Figure 2.
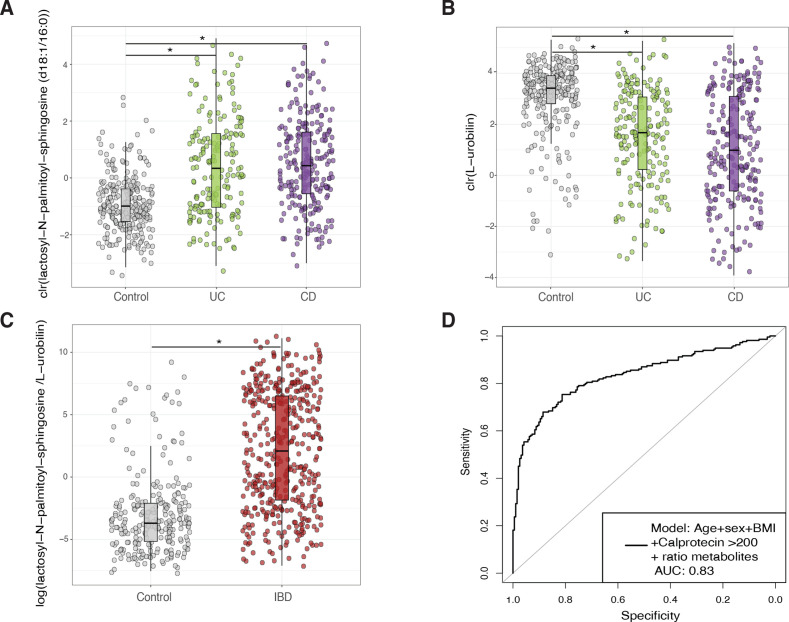
Biomarker discovery for the diagnosis of IBD. (A, B) Show the abundance of the metabolites with the highest potential to discriminate between samples from non-IBD (grey) and IBD (UC in green and CD in purple). (C). Boxplots depict the value of a potential biomarker for IBD. The y-axis is the log-transformed value of the ratio constructed from the levels of lactosyl-N-palmitoyl-sphingosine (d18:1/16:0) and L-urobilin. Boxplot in grey depicts values in non-IBD controls. Boxplot in red depicts values in patients with IBD. (D). Receiver operating characteristic curve (ROC curve) of the prediction model based on patient characteristics (age, sex and BMI), the levels of faecal calprotectin (expressed as a binary trait (yes/no) if levels of this marker were >200 µg/g of faeces) and the ratio between metabolites. The prediction value, expressed as the area under the curve (AUC), reached a value of 0.83 in the test dataset. Metabolite values are clr-transformed. Boxplot shows the median and interquartile range (25th and 75th). Whiskers show the 1.5*IQR range. Asterisks indicate significant differences between groups (FDR<0.05). BMI, body mass index; CD, Crohn’s disease; FDR, false discovery rate; UC, ulcerative colitis.

