Abstract
This study aimed at three representative pollutants, benzidine, cyromazine, and streptomycin, which were commonly used and posed a great threat to both environment and human health, mainly to explore a fast, simple, sensitive, visible naked-eye detection method. Colorimetric detection by gold nanoparticles (AuNPs) was first attempted. The cross-linking reaction occurred owing to the strong forces between the targets and AuNPs, leading to aggregation and color change. However, large-scale aggregation was easily formed and settled, which failed to achieve accurate quantification. Thus, AuNPs are considered to be used in fluorescence detection as reaction bridges. The introduction of AuNPs could effectively quench the fluorescence of Rhodamine B based on fluorescence resonance energy transfer (FRET). Moreover, a classical “on–off–on” fluorescence detection system was constructed based on nanomaterials. When AuNPs were added, the red fluorescence of the Rhodamine B solution could be effectively quenched (the “off” reaction). However, the tight cross-linking reaction between the three targets and AuNPs occurred through the strong affinity, causing Rhodamine B to dissociate in the solution. The fluorescence was rapidly restored, accompanied by a significant enhancement of fluorescence intensity (the “on” reaction). The fluorescent responses toward the three targets were established, resulting in good linearity in a wide range with low detection limits. Moreover, through the investigation of specificity, the fluorescence sensor exhibited satisfying selectivity and high binding affinity to the detected targets among the same types of inferences, indicating great potential for practical application. This simple, fast and sensitive fluorescence detection system was first used for simultaneously detecting three types of pollutants and finally successfully applied to real samples.
A classical “on–off–on” fluorescence detection system was constructed based on FRET to detect three different types of pollutants.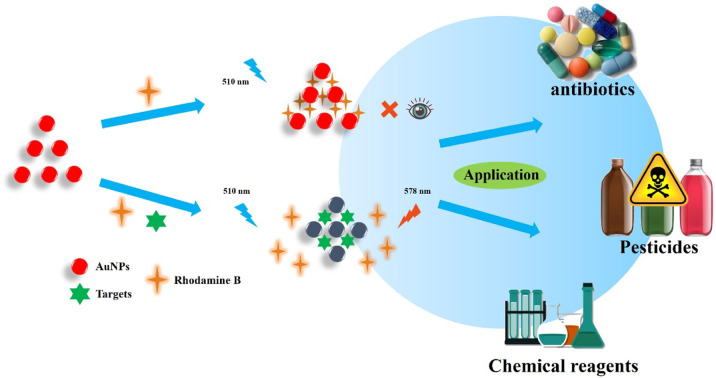
1. Introduction
Environmental pollutants refer to substances that can directly or indirectly harm human beings after entering the environment. Pollutants are usually useful substances in production but become environmental pollutants if they are released in large quantities without recycling and reuse. Therefore, to become a pollutant, a substance must exist in a certain amount or concentration in a particular environment and last for a certain period of time. There are many types of environmental pollutants, among which common pollutants closely related to human production and life are more harmful. The direct discharge of discarded industrial chemical reagents causes environmental pollution. Although pesticides and antibiotics play a significant role in agricultural production and human health, they become environmental pollutants once their emissions reach a certain limit. Therefore, this study aimed at three representative kinds of pollutants, mainly to explore a rapid, simple, sensitive, and visible naked-eye detection method.
Aromatic amines are a group of important environmental pollutants that are contaminants of azo colorants in their manufacturing processes, leading to a serious threat to human health owing to their high carcinogenicity.1,2 Among them, benzidine (C12H12N2) is an important organic synthesis intermediate and an important acid inhibitor, which is widely used in medicine, chemical industry, and other fields. In addition, it is a very important dye intermediate that can be used to produce various organic pigments. However, it remains a toxic environmental pollutant and has been identified as a carcinogen for the human bladder since 1975.3 According to the list of carcinogens published by the World Health Organization's International Agency for Research on Cancer in 2017, benzidine belongs to class I of carcinogens with extremely strong carcinogenic effects. Benzidine and its derivatives in the environment occur mostly in groundwater and industrial effluents.4 Thus, research in the fields of benzidine detection and removal from contaminated aqueous environmental samples remains indispensable and imperative.5
Cyromazine(C6H10N6), a highly effective triazine pesticide with strong selectivity, has been widely used in animal manure, field crops, fruits and vegetables as a low-toxicity insecticide for insect growth inhibitors.6,7 However, the overuse of cyromazine has been proven to cause problems with food contamination of animal origin.8 Several extended toxicological tests have proved that it would cause mammary tumours in mice, and its structure is similar to other mammary tumour-producing analogues, thus posing a potential threat to the environment and human health9,10 However, cyromazine can be easily metabolized in both plants and animals to form melamine,11 and its excessive accumulation results in kidney failure because of the formation of insoluble melamine–cyanurate acid crystals.12 Therefore, cyromazine has been classified as a potential carcinogenic drug by the Environmental Protection Agency of the US,13 and the maximum residue level of cyromazine in edible animal-derived products is strictly regulated to be 50 ng g−1.14 To avoid the harmful effects of cyromazine in food to the consumer, the development of a simple and quick method of detecting the residue of cyromazine is very important and accurate.15
Streptomycin(C21H39N7O12), is a typical aminoglycoside isolated and purified from Streptomyces griseus. It has been widely used in humans and veterinarians to treat infectious diseases caused by Gram-negative bacteria by inhibiting the synthesis of bacterial proteins to treat bacterial infections, such as enteritis and dysentery.16–18 Owing to the wide application of streptomycin in modern agricultural practice and foodstuffs, streptomycin residues are frequently found in common food and daily life,19 which are easy to affect the ecological balance and human health.20 In particular, the erroneous and uncontrolled application of streptomycin in animal-derived foods leads to serious side effects on human health, such as ototoxicity and nephrotoxicity.21,22 Considering the hazard of excess streptomycin, most countries have established a series of standards to limit streptomycin residue.23 The European Commission sets maximum residue limits for streptomycin in milk at 200 and 1000 mg L−1 in pig kidneys and explicitly limits the amount of streptomycin in natural products, such as honey.24 Therefore, it is necessary to detect the content of streptomycin, especially at low levels.
At present, many methods have been developed to detect the three environmental pollutants mentioned above in edible products or environmental samples, such as high-performance liquid chromatography (HPLC), gas chromatography spectrometry (GC), liquid chromatography-mass spectrometry (LC-MS), ultra-high performance liquid chromatography-high resolution mass spectrometry (UHPLC-MS/MS) or rapidly developed immunoassay methods.25–27 Although the above methods have the advantages of high sensitivity and good accuracy, they also suffer from drawbacks, such as the requirement of sophisticated equipment, time-consuming sample preparation steps, and high costs in instrument maintenance and personnel training, which hinder the application of ordinary laboratories.28 Hence, there is an urgent need to develop a rapid, accurate, economical and real-time detection method for environmental safety and physical health.
Fluorescence has commonly been used in analytical applications owing to its particular advantages of high sensitivity, high throughput, low sample volume, simple operation and ease of application.29,30 Fluorescent-based test systems, which take advantage of organic quenchers, have attracted great attention and interest in fluorescence immunoassays and biosensors.31 First, common quenching mechanisms include static quenching, dynamic quenching, energy transfer, photoinduced electron transfer and internal filtering effect. Energy transfer can be divided into Förster resonance energy transfer (FRET), Dexter energy transfer (DET) and surface energy transfer (SET),32 among which fluorescence resonance energy transfer (FRET) plays an essential role that usually occurs between a fluorescent donor and an acceptor.33 Gold nanoparticles (AuNPs) have been investigated in this area because of their charming properties, such as different types of assemblies, high stability, ease of synthesis and electronic, magnetic and optical characteristics related to size (quantum effects of size).34,35 Thus, AuNPs have a wide range of applications in the fields of catalytic synthesis, bioimaging and pollutant degradation, especially in fluorescent probes that have received widespread attention from researcher.36,37 AuNPs act as exquisite quenchers of fluorescent dyes instead of traditional organic quench agents owing to their extremely high extinction coefficient and broad absorption spectrum,38 which overlaps well with the emission spectrum of the usual fluorophore, resulting in excellent fluorescence quenching ability. Second, in the presence of extinguishing agents, fluorescence detection strategies in analytical chemistry include “on–off”, “off–on”, “on–off–on”, and “on–off–on–off” reaction systems. We constructed a classical “on–off–on” fluorescence detection system based on nanomaterials in this study.
The complexation of various metal ions with some molecules via functional groups is of great significance for some applications, and color changes can be observed with the naked eye.39 Therefore, in this study, the colorimetric detection of AuNPs was first considered to analyse three types of pollutants, as AuNPs exhibited advantages of simple, sensitive and fast characteristics. However, AuNPs are generally assembled in an uncontrolled and non-oriented manner, resulting in the easy formation of large-scale aggregation, which makes it difficult to achieve accurate qualification. Therefore, it is reasonable to consider introducing fluorescent substances into the detection system. A Rhodamine B-AuNP detection system was successfully designed for three types of pollutants based on FRET by taking advantage of the fluorescence “turn-off” and “turn-on” features. The prepared Rhodamine B solution exhibited maximum fluorescence emission at a wavelength of 578 nm when excited at 510 nm, and its red fluorescence was effectively quenched by AuNPs. Three kinds of detection targets contained hydroxyl, amino group and other dominant structures, which led to covalent bonds and electrostatic interactions between targets and AuNPs. The quenched fluorescence was distinctly recovered and exhibited a linear regression response to the target for quantitative detection. In addition, the test system showed high selectivity among various distractors with similar structures. Finally, a real sample of streptomycin sulfate veterinary drugs for injection and environmental Yellow River water samples were successfully detected.
2. Experimental procedures
2.1. Chemical reagents
Chloroauric acid (HAuCl4·3H2O) was purchased from Sigma-Aldrich (USA) and applied directly. Sodium citrate was obtained from DaMao Chemical Corporation (Tianjin, China). Cyromazine, propiconazole, phosalone, diazinon, isazofos, chlorpyrifos-methyo, and tolclofos-methyl were purchased from Xianding Biotechnology Co., Ltd (Shanghai, China). Imidacloprid and thiamethoxam were purchased from Yuanye Biotechnology Co., Ltd (Shanghai, China). Azamethiphos was purchased from Macklin Biochemical Co., Ltd (Shanghai, China). Formothion was purchased from Jizhun Technology Services Co., Ltd (Guangzhou, China). Ofloxacin, amoxicillin, clarithromycin, ampicillin, benzylpenicillin potassium and ciprofloxacin were purchased from Macklin Biochemical Co., Ltd (Shanghai, China). Roxithromycin was purchased from Solarbio Life Sciences Technology Co., Ltd (Beijing, China). Norfloxacin and erythrocin were purchased from Aladdin Biochemical Technology Co., Ltd (Shanghai, China). Acetaminophen, dimethylaminobenzaldehyde, salicylic acid, para-aminobenzoic acid, phenol, naphthalene and 5-methyl-2-phenyl-1,2 dihydropyrazol-3-one were purchased from DaMao Chemical Corporation (Tianjin, China). All of the experimental solutions were prepared using distilled water, and all chemicals used in this study were of analytical reagent grade.
2.2. Instruments
The excitation and emission spectra of fluorescence were collected using a spectrofluorophotometer RF-5301 PC (Shimadzu, Japan). Ultra-Violet absorption spectra (UV-Vis) were recorded on UV-Vis (Perkin, USA) equipped with a 1 cm-path-length quartz cell. Fluorescent colorimetric photographs were collected using an iPhone camera. Transmission electron microscopy (TEM) images were obtained on an FEI Tecnai G2TF20 instrument (FEITECNAI, USA) under an acceleration voltage of 200 kV.
2.3. Preparation of AuNPs
In this study, AuNPs were obtained based on conventional synthesis methods.40 AuNPs were synthesized by the reduction of HAuCl4 with sodium citrate. The synthesis method was simplified as follows: 0.228 g of sodium citrate was dissolved in 10 mL of distilled water to obtain a concentration of 77.6 mM. Under vigorous stirring, the prepared solution was rapidly added into the boiling HAuCl4 solution (786 μL of 10% HAuCl4 dissolved in 100 mL distilled water). The color of the mixed solution changed from blank to wine red. Then, the mixture was boiled for 10 min to obtain an AuNp solution. The characteristic absorption wavelength of AuNPs was monitored to be 520 nm, indicating that the particle size was almost 13 nm. According to Lambert Beer's law: A = Kbc, c = A/Kb, where A is the absorbance value, K is the molar absorption coefficient (2.7 × 10⁸ mol L−1), and b is the thickness of absorption layer,41 the molar concentration of AuNPs was calculated to be about 259 nM.
2.4. Fluorescence quenching by AuNPs
To explore the quenching efficiency of AuNPs on Rhodamine B, different concentrations of AuNPs were added into the Rhodamine B solution. Therefore, 0, 100 μL, 200 μL, 300 μL, 400 μL, 500 μL, 600 μL, and 740 μL AuNP solutions were added into 20 μL and 25 μM Rhodamine B solutions. The total volume of the solution was replenished with distilled water to 800 μL. The final concentrations of AuNPs were 0, 16.25 nM, 32.5 nM, 48.75 nM, 65 nM, 81.25 nM, 97.5 nM, and 120.25 nM. After vortex blending for 15 s, a fluorescent color change was observed under a UV lamp. The fluorescence intensity was monitored using a spectrofluorophotometer, in which fluorescence was excited at 510 nm. The maximum emission wavelength was 578 nm, and the slit width was set to 3.
2.5. Detection of three types of pollutants
The optimal volume of AuNPs was determined to be 740 μL, which could completely quench the fluorescence of Rhodamine B. The process for detecting three types of pollutants (cyromazine, streptomycin and benzidine) was as follows: 40 μL of different concentrations of targets were mixed with 740 μL of AuNPs and 20 μL of Rhodamine B solution, and the final volume was 800 μL. The final concentrations of cyromazine were 250 nM, 500 nM, 650 nM, 750 nM, 1 μM, 1.25 μM, and 2.5 μM. The final concentrations of streptomycin were 5 nM, 50 nM, 250 nM, 500 nM, 1.25 μM, 2.5 μM, 5 μM, and 10 μM. The final concentrations of benzidine were 2.5 μM, 3.75 μM, 5 μM, 7.5 μM, 10 μM, and 15 μM. After vortex blending for 15 s, color changes were observed under a UV lamp and daylight. To ensure the measured range of the spectrofluorophotometer, 740 μL of distilled water was added into the above mixture. The setting parameters were the same as above.
For colorimetric detection, 40 μL of different concentrations of targets were mixed with 740 μL of AuNPs and 20 μL of distilled water; the final volume was 800 μL. The final concentrations of the three types of pollutants were the same as described above. After mixing, the color change was monitored using a UV-Vis spectrophotometer.
2.6. Selectivity for three types of pollutants
To ensure practical applications, it was essential to investigate the selectivity of a fluorescence detection system. Three types of pollutants were further investigated among a series of pesticides, antibiotics and chemical agents containing benzene rings. The specific operation was as follows: stock solutions of different types of testing samples were prepared using distilled water. 40 μL of each solution was mixed with 740 μL of AuNPs and 20 μL of Rhodamine B solution. The ultimate concentrations of pesticides, antibiotics and chemical agents containing benzene rings in the experiment were determined to be 2.5 μM, 1 μM and 5 μM, respectively. The detection method was the same as mentioned above.
2.7. Real sample detection
To verify the feasibility and practicability of this method, real sample detection for streptomycin and benzidine was operated on in commercialized streptomycin sulfate veterinary drugs and Yellow River. The Yellow River was simply pretreated as follows: the sample was settled overnight; then, the liquid supernatant was filtered through 0.22 μm membrane and diluted twice to obtain. A series concentration of benzidine was spiked into the above sample. The spiked concentrations were 60 μM, 70 μM, 80 μM, 90 μM, 100 μM, and 150 μM. Streptomycin sulfate for the injection of veterinary drugs was purchased from a regular medical establishment. The specification of streptomycin sulfate for the injection of veterinary drugs was 2 g. According to drug specifications, a series concentration of streptomycin was prepared as 1 μM, 5 μM, 12.5 μM, 23 μM, and 50 μM. The experimental conditions were the same as those described above.
3. Results and discussion
3.1. Colorimetric detection of AuNPs and three types of pollutants
Colorimetric sensors have attracted much attention owing to their low cost, simple preparation, good selectivity, simple operation, disposable use, no need for complex instruments, and the ability to detect color changes visible to only the naked eye.42 Therefore, we first conducted colorimetric detection on AuNPs and three target substances.
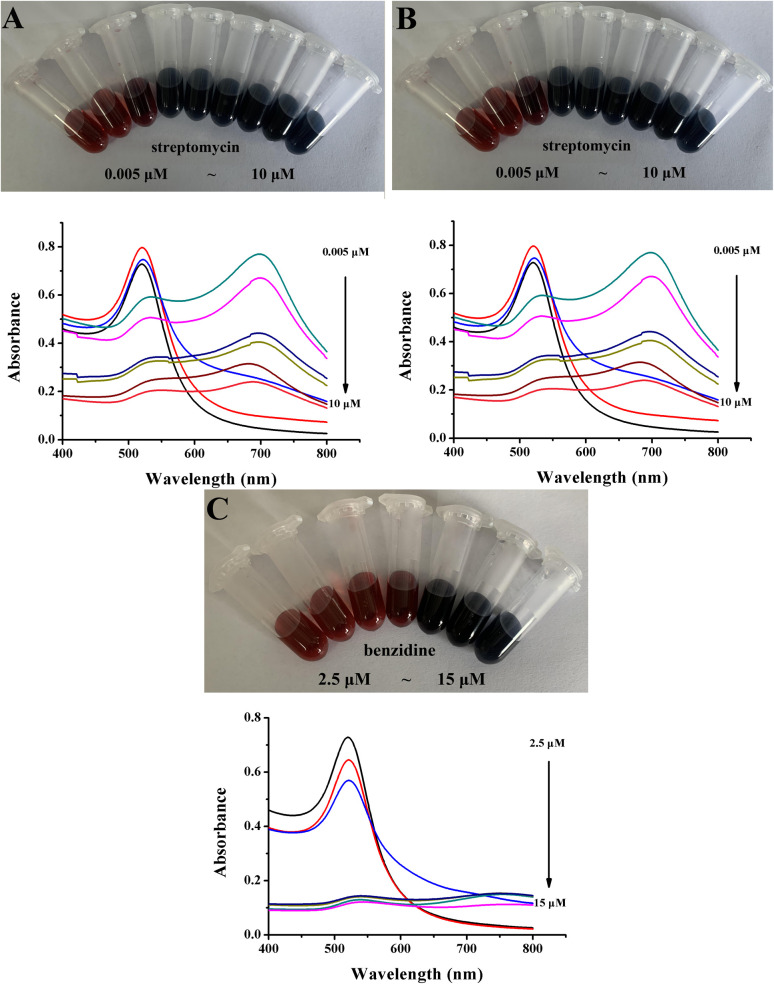
As shown in Fig. 1A, the characteristic absorption peak of AuNPs was 520 nm. When cyromazine was added to AuNPs (a series of concentrations were provided in “2.5”), the solution color and UV-Vis absorption spectra obviously changed. With the addition of cyromazine, the color of the solution changed from red to black. Simultaneously, the absorption peak of AuNPs at 520 nm gradually disappeared. When the concentration was above 0.5 μM, the large-scaled aggregation was easily formed and then settled. The colorimetric result was also confirmed by applying a UV-Vis spectrogram, and no obvious characteristic absorption peak was formed. Fig. 1B depicts the colorimetric detection of streptomycin. When the concentration varied from 0.005 μM to 10 μM, the color changed from red to black. Not only was the absorbance at the characteristic absorption peak of 520 nm decreased, but also a new characteristic absorption peak at 700 nm emerged. As AuNPs aggregated in an uncontrolled and non-oriented manner, large-scale aggregation was easily formed, causing an indistinguishable color change. Generally, the absorbance of the ratio characteristic peaks (A700/A520) was used to evaluate the linear response of detection. However, it was found that there was no linear relationship between concentration and A700/A520, which was unable to accurately quantify.
Fig. 1. Photograph and UV-Vis absorption spectra of AuNPs after the addition of various concentrations of cyromazine (A), streptomycin (B), and benzidine (C).
The colorimetric detection of benzidine also showed similar results. The results are shown in Fig. 1C. As the concentration increased, large-scale aggregation was easily formed, leading to a rapid color change and a decrease in the characteristic peak absorbance. All the above colorimetric results indicated that AuNPs were aggregated in an uncontrolled and non-oriented manner, causing the formation of large-scale aggregation, which was easily settled in the solution. Thus, the color of the solution exhibited an indistinguishable color change, accompanied by a rapidly decreased absorbance value that was unable to achieve accurate quantification.
FT-IR spectra were used to study the functional groups of the three types of pollutants. The peaks observed in different regions of the spectrum provide valuable information about the structure of the synthesized compounds. Fig. S1A† depicts the characteristic peak of cyromazine. The peak at 2971 cm−1 was caused by the telescopic vibration of C–H on propane substituents. The peaks of 3497 cm−1 and 1547 cm−1 were attributed to the tensile and flexural vibrations of N–H on the primary amine substituents, respectively. In addition, the peak of 1664 cm−1 represented the vibration of C–N. As shown in Fig. S1B,† the strong absorption bands at the peaks of 3379 cm−1, 1679 cm−1 and 1100 cm−1 were caused by the contractile vibration of O–H, C–O and C–N, respectively, which were characteristic absorption peaks of streptomycin, while the peak of 1600 cm−1 was attributed to the contractile vibration peaks of C–N in streptomycin. The IR spectrum illustrated in Fig. S1C† showed a characteristic absorption band at 1400–1605 cm−1, which belonged to the stretching vibration tension of the benzene ring skeleton of benzidine. The strong peak at 818 cm−1 was caused by the out-of-plane bending vibration of C–H substituted by the middle position of benzidine. The sharp peak at 3300–3400 cm−1 was caused by N–H stretching vibration, and the stretching vibration of C–N in benzidine occurred at 1265 cm−1. These observations indicate that the three types of pollutants detected have different characteristic functional groups to ensure the relative independence of the work.
3.2. Mechanism for colorimetric detection of AuNPs and three types of pollutants
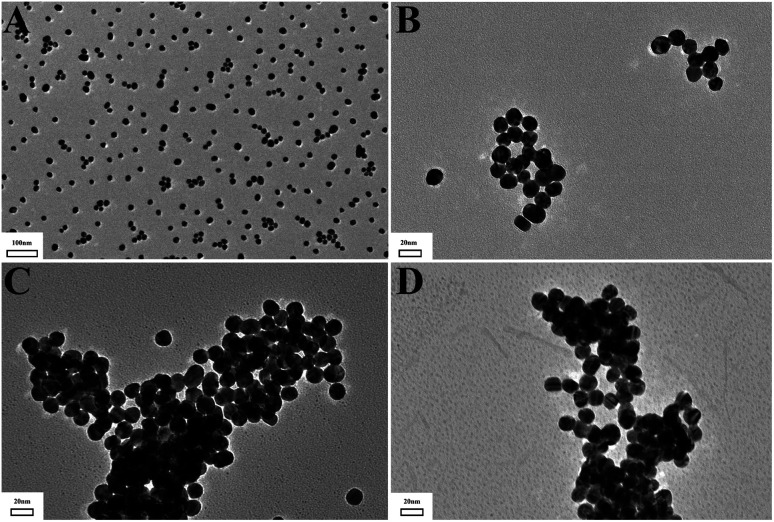
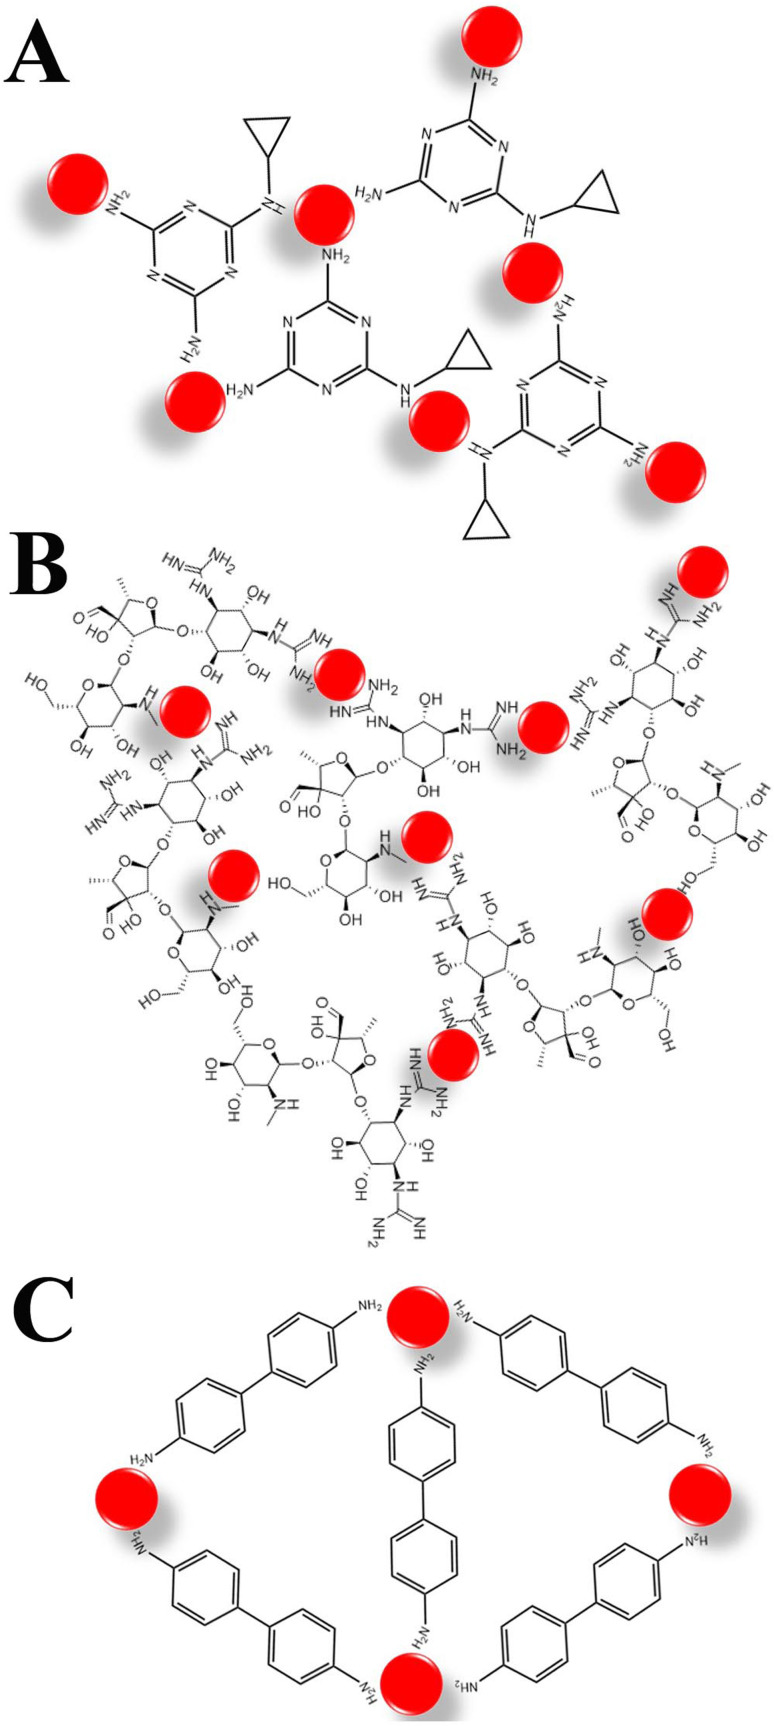
To verify the feasibility of the mechanism, we employ transmission electron microscopy (TEM) to characterize the particle size changes in AuNPs and observe the morphology of AuNPs, as shown in Fig. 2. AuNPs reduced by sodium citrate had a homogeneous dispersion with an average size of about 13 nm. After the addition of three types of pollutants, they could be bound onto the surface of the AuNPs with the large-scale aggregation formed. This was mainly due to the strong affinity between the targets and the AuNPs, as demonstrated in Fig. 3. All three targets contain a large number of amino groups (–NH2), especially streptomycin, which contains both amino groups and hydroxyl groups (–NH2 and –OH). Thus, targets could be tightly bound to the surface of AuNPs through covalently bonded Au–N. The presence of numerous Au–N shortened the distance between particles, leading to cross-linking reactions. Moreover, for streptomycin, hydrogen-bond interactions and the electrostatic attraction occur between –NH2 and –OH, further accelerating the aggregation of particles.43 Therefore, AuNPs were sensitive to all three pollutants.
Fig. 2. TEM of AuNPs (A) and AuNPs with the addition of cyromazine (B), streptomycin (C) and benzidine (D).
Fig. 3. The possible detection mechanism between AuNPs and cyromazine (A), streptomycin (B) and benzidine (C).
3.3. Mechanism for the fluorescence detection of AuNPs and three types of pollutants
Although the colorimetric detection method of AuNPs was sensitive, it suffered from drawbacks such as uncontrolled aggregation manner and narrow detection range, which made it difficult to achieve accurate quantification. Thus, it was reasonable to introduce fluorescent substances into the detection system.
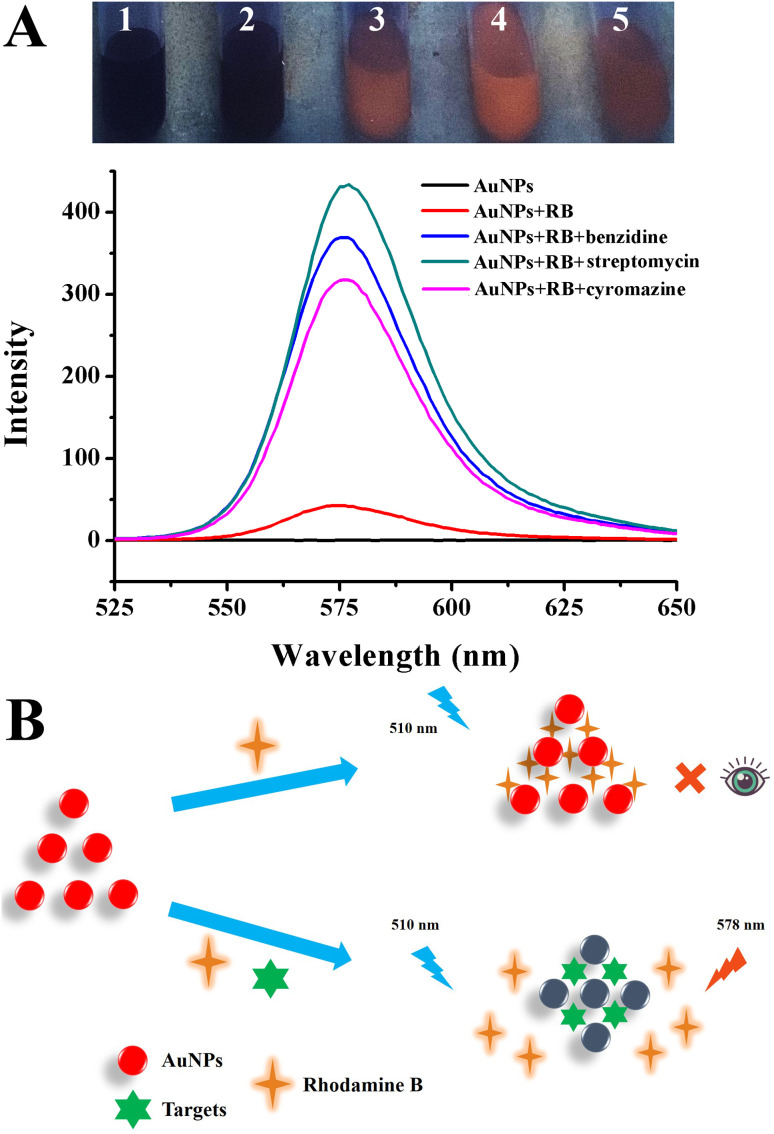
Rhodamine B is a widely used synthetic dye with strong fluorescence, water solubility and light stability. It has been found that Rhodamine B could be adsorbed on the AuNP surface by electrostatic interaction.44 The maximum emission wavelength was monitored at 578 nm using a fluorescence spectrophotometer when excited at 510 nm. The results and proposed mechanism for fluorescence detection are shown in Fig. 4A. AuNPs had no fluorescence property whether observed under a UV lamp or detected by a fluorescence spectrophotometer. When added to the Rhodamine B solution, the interaction between AuNPs and Rhodamine B occurred, leading to the fluorescence quenching of Rhodamine B and an obvious color change from red to black. The results confirmed the fluorescence quenching ability of AuNPs on Rhodamine B. However, when AuNPs and three types of pollutants were simultaneously added into the Rhodamine B solution, the red fluorescence of Rhodamine B recovered with a significantly increased fluorescence intensity. This was because these three substances with amino groups and hydroxyl groups are easy to bond to AuNPs. Additionally, the positively charged amino groups tend to disrupt the charge balance of AuNPs. Therefore, AuNPs compete to occupy the binding site, causing the restoration of fluorescence.
Fig. 4. (A) Photograph and fluorescence spectra of AuNPs, Rhodamine B solution with the addition of AuNPs, Rhodamine B solution with the addition of AuNPs and benzidine, streptomycin, and cyromazine. (B) Possible fluorescence quenched and recovered mechanisms based on AuNPs.
The possible mechanism is shown in Fig. 4B and S2.† During the FRET process, traditional organic quenchers were replaced by AuNPs, which acted as excellent quenchers, and their quenching efficiency was several orders of magnitude greater than that of typical ones.45 FRET refers to that in two different fluorescent groups; if the emission spectrum of the “Donor” group overlaps with the absorption spectrum of the “Acceptor” group to a certain extent, and the distance between them is close enough, fluorescence energy can be effectively transferred from the “Donor” to the “Acceptor”. When AuNPs aggregate, the color of the solution changes from red to blue as the surface plasmon band moves towards a longer wavelength. If the fluorescent groups are desorbed from the surface of the AuNPs, analysis-induced AuNP aggregation may also lead to changes in fluorescence intensity through FRET. In addition, FRET requires that the spectra of the donor and the receptor overlap well, and the distance between the donor and receptor is less than 10 nm.46 Thus, the surface plasmon resonance effect of AuNPs can greatly enhance the electromagnetic field around the particles, affecting the luminescence characteristics of fluorescent molecules distributed on the surface of AuNPs and surrounding. As shown in Fig. 4B, initially, because of the repulsion of the surface charge, AuNPs disperse uniformly in solution, while Rhodamine B adsorbs AuNPs by electrostatic adsorption, so the distance between them decreases. The fluorescence of rhodamine B is quenched by gold nanoparticles because of the resonance energy transfer between them.44 Thus, AuNPs have the unique property of an extremely high extinction coefficient, leading to the quenching of fluorescent species at different emission wavelengths from the visible range to the near infrared.45,47 The extremely high extinction coefficient and broad absorption spectrum overlap well with the emission of the usual fluorophore, resulting in excellent fluorescence quenching ability.38 However, owing to covalent bonds and electrostatic attractions, the analytes had a much stronger affinity for AuNPs, leading to the occupation of binding sites between fluorophore molecules and AuNPs; consequently, the fluorescence was restored.48
3.4. Quenching effect of AuNPs and three types of pollutants
AuNPs are known to significantly alter the optical properties of nearby fluorescent compounds owing to the coupling of oscillatory dipoles of fluorescent molecules with surface plasmon resonance from metal particles. This can lead to enhanced or quenched fluorescence depending on the distance between the fluorescent molecule and the surface of the AuNPs.49
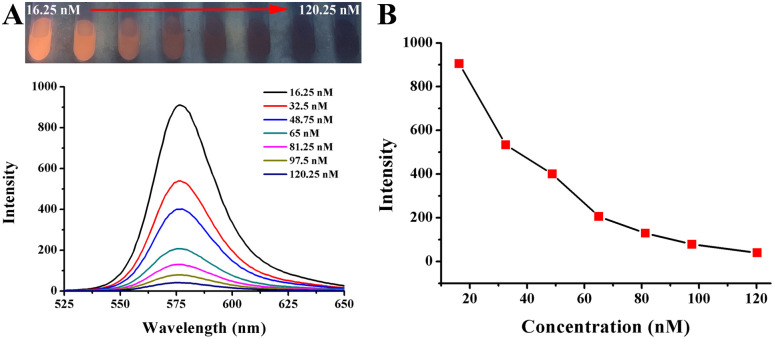
The quenching effect of AuNPs on Rhodamine B solution is shown in Fig. 5. A series of concentrations of AuNPs was added into the Rhodamine B solution. With concentrations varying from 16.25 nM to 120.25 nM, the red fluorescence of the Rhodamine B solution was quenched gradually when observed under ultraviolet lamp. The fluorescence intensity at the emission wavelength of 578 nm also decreased, which was accompanied by a color change. It was found that when the concentration was up to 120.25 nM, the fluorescence was almost completely quenched, whether observed by the naked eye or detected using a spectrofluorophotometer. This is mainly caused by the FRET between AuNPs and Rhodamine B. AuNPs have the advantage of a high extinction coefficient and can quench fluorescent substances with a wide wavelength range. In this paper, to ensure the accuracy of detection and ensure that the fluorescence could be recovered by the detection target, the optimal concentration of AuNPs was determined to be 120.25 nM so that the fluorescence could be almost completely quenched.
Fig. 5. (A) Photograph and fluorescence spectra of Rhodamine B solution added by a series concentration of AuNP solution (final concentration). (B) A dynamic response between AuNPs concentration and fluorescence intensity at 578 nm.
3.5. Analytical merit of the three types of pollutants
3.5.1. Fluorescence detection
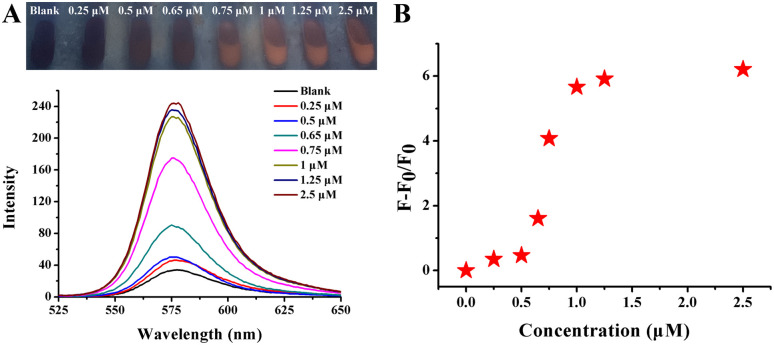
To investigate the fluorescence recovery efficiency of cyromazine, a series of concentrations of cyromazine, AuNPs and Rhodamine B were mixed. After the reaction, the results are shown in Fig. 6. First, the fluorescence was completely quenched by the addition of 120.25 nM AuNPs, leading to a significant decrease in fluorescence intensity. When cyromazine was added with concentrations varying from 0.25 μM to 2.5 μM, the red fluorescence was gradually recovered, which was accompanied by an increase in fluorescence intensity when monitored at 578 nm. This was because cyromazine bound competitively to AuNPs owing to electrostatic adsorption and Au–N covalent bonding, resulting in the fluorescence recovery of Rhodamine B. It was found that when the concentration was above 1 μM, the fluorescence intensity at 578 nm no longer increased, but a constant value was maintained with an almost unchanged color (Fig. 6A). The results showed that the reaction reached equilibrium, the reaction site reached saturation, and there were no more sites to continue the reaction.
Fig. 6. (A) Photographs and fluorescence spectra of Rhodamine B solution after the addition of various cyromazine concentrations in the presence of 120.25 nM AuNPs. (B) Variation trend toward F − F0/F0 over the concentrations of cyromazine corresponding to (A).
The fluorescence intensity was expressed as F − F0/F0, where F and F0 are the fluorescence intensities recorded in the presence and absence of the target, respectively. The trend of fluorescence intensity as a function of concentration is shown in Fig. 9B. Compared with colorimetric detection by AuNPs only (Fig. 1A), when the concentration of cypromazine exceeded 0.25 μM, AuNPs aggregated on a large scale, resulting in a rapid color change from red to black. The result showed that simple colorimetric detection failed to achieve the accurate quantification of the targets.
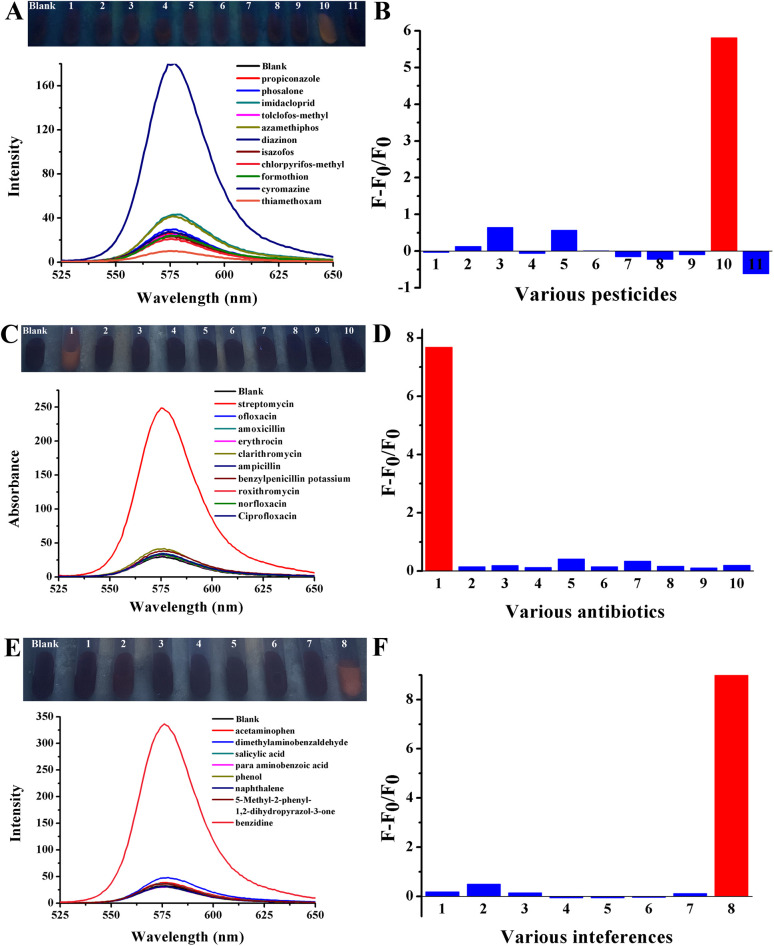
Fig. 9. Photographs and fluorescence spectra of Rhodamine B solution after the addition of various pesticides (A), antibiotics (C) and chemical reagents (E) with the presence of 120.25 nM AuNPs. (B), (D) and (F) Histograms of fluorescence intensity exhibited by F − F0/F0 corresponding to their respective spectra.
To explore the fluorescence recovery efficiency, streptomyamine B was mixed. The reaction procedures were the same as before, and the results are shown in Fig. 7. As the concentration of streptomycin increased from 5 nM to 10 μM, the red fluorescence gradually restored with a significant increase in fluorescence intensity emitted at 578 nm. At concentrations of up to 1.25 μM, the fluorescence intensity at 578 nm no longer increased, indicating the arrival of an equilibrium state, and no more reaction sites involved in the reaction (Fig. 7A). The following linear relationship between (F − F0/F0) and concentrations varying from 5 nM to 1.25 μM was established with a good correlation coefficient of 0.99 (Fig. 10B): y = 2.6889x + 0.1209. The limit of detection (LOD) for streptomycin was estimated using the following equation: LOD = (3σ/s), where σ represents the standard deviation of three blank measurements and s represents the slope of the linear regression equation. The LOD of streptomycin was calculated to be 1.12 nM. The proposed mechanism was mainly due to the covalent bonds between the hydroxyl and amino groups of streptomycin and AuNPs, which caused Rhodamine B to dissociate from the AuNPs and return to the free state, thus resuming red fluorescence. A comparison of the various detection techniques for streptomycin is presented in Table S1.† In comparison with fluorescence detection, the colorimetric results are shown in Fig. 1B. When the concentration of streptomycin exceeded 0.05 μM, the aggregation of AuNPs basically reached the equilibrium state and the color of the solution remained unchanged.
Fig. 7. (A) Photographs and fluorescence spectra of Rhodamine B solution after the addition of various streptomycin concentrations in the presence of 120.25 nM AuNPs. (B) Correlation between streptomycin and fluorescence intensity. A linear regression toward F − F0/F0 over the concentrations of streptomycin corresponding to (A).
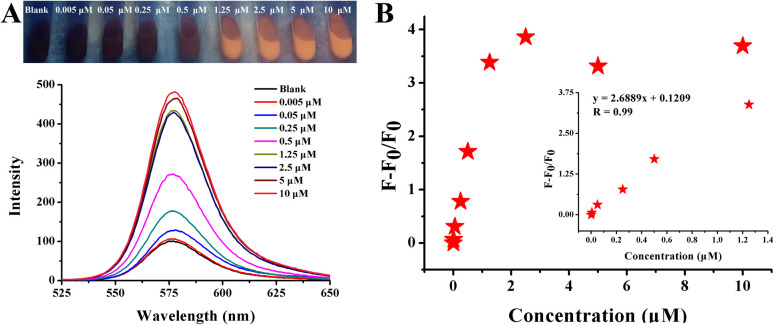
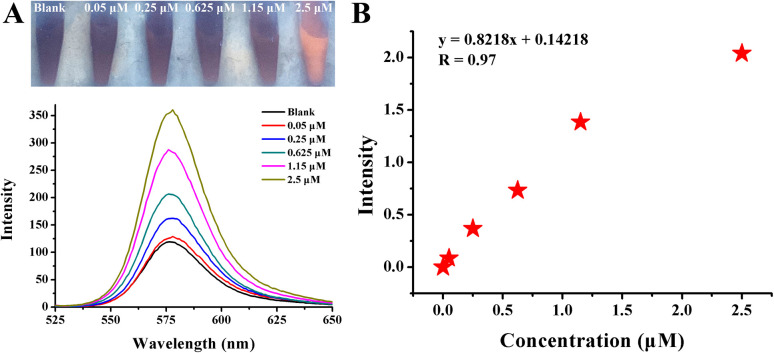
Fig. 10. (A) Photographs and fluorescence spectra of Rhodamine B solution after the addition of a veterinary drug for injectable streptomycin sulfate with different concentrations in the presence of 120.25 nM AuNPs. (B) The dynamic response between concentration and fluorescence intensity is exhibited by F − F0/F0.
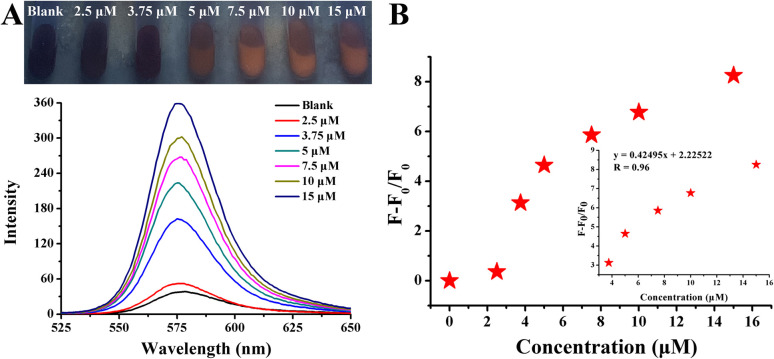
As for benzidine, when the concentration varied from 2.5 μM to 15 μM, the red fluorescence gradually recovered, which was accompanied by an obvious increase in the fluorescence intensity emitted at 578 nm (Fig. 8A). A linear relationship between (F − F0/F0) and concentrations in the above range with a good correlation coefficient of 0.96 is (Fig. 11B) as follows: y = 0.42495x + 2.22522 with a good correlation coefficient of 0.99. The detection limit (LOD) was calculated to be 56.52 nM using the formula of LOD = 3σ/s. Benzidine could be bonded on the surface of particles via Au–N with strong cross-linking affection. In addition, the electrostatic balance was disturbed by the electrostatic attraction of the positive charge of the amino group and the negative charge on the surface of the particles. Under the combined action of the two, the distances between the particles were shortened rapidly, leading to large-scale aggregation. A comparison of the various detection techniques for benzidine is illustrated in Table S2.† The colorimetric detection of benzidine using AuNPs is depicted in Fig. 1C. Compared with fluorescence detection, simple colorimetric detection for benzidine exhibited the shortcomings of low sensitivity and a narrow detection range. Moreover, compared to colorimetric detection using the naked eye, fluorescence is perceived by the body rather than by color change under normal light.
Fig. 8. (A) Photographs and fluorescence spectra of Rhodamine B solution after the addition of various benzidine concentrations in the presence of 120.25 nM AuNPs. (B) The correlation between benzidine and fluorescence intensity. A linear regression toward F − F0/F0 over the concentrations of benzidine corresponding to (A).
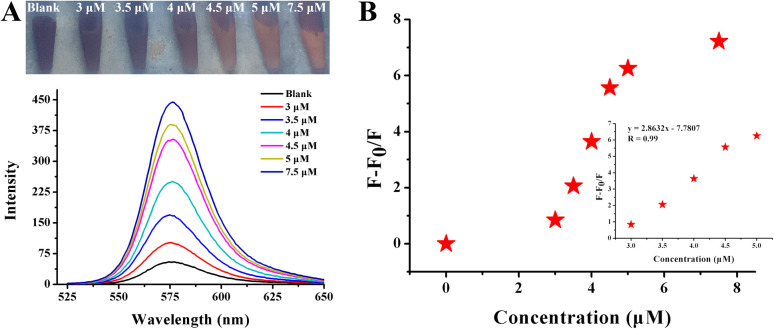
Fig. 11. (A) Photographs and fluorescence spectra of Rhodamine B solution after the addition of Yellow River water samples in the presence of 120.25 nM AuNPs. (B) The dynamic response between concentration and fluorescence intensity exhibited by F − F0/F0.
3.5.2. Selectivity for three types of pollutants
To achieve application in real samples, it was necessary to investigate the selectivity of three types of environmental pollutants among various testing samples that are structurally similar or belong to the same type. Cyromazine was investigated among a series of pesticides that were commonly used in most crops, such as propiconazole, phosalone, imidacloprid, tolclofos-methyl, azamethiphos, diazinon, isazofos, chlorpyrifos-methyo, formothion and thiamethoxam. (Table S3†). The final concentration was determined to be 2.5 μM. Streptomycin was investigated among various antibiotics, which were common broad-spectrum antimicrobials, such as ofloxacin, amoxicillin, erythrocin, clarithromycin, ampicillin, benzylpenicillin potassium, roxithromycin, norfloxacin, and ciprofloxacin (Table S4†). The final concentration was determined to be 1 μM. Benzidine was detected among a series of chemical reagents with similar structures, such as acetaminophen, dimethylaminobenzaldehyde, salicylic acid, para-aminobenzoic acid, phenol, naphthalene, and 5-methyl-2-phenyl-1,2-dihydropyrazol-3-one (Table S5†). The final concentration was determined to be 5 μM.
The results are shown in Fig. 9. It was found that when three types of environmental pollutants were added, red fluorescence was obviously observed under an ultraviolet lamp, which was accompanied by a significant fluorescence enhancement. However, no obvious fluorescence recovery was observed in response to the addition of other substances, indicating that the red fluorescence of Rhodamine B was still quenched by AuNPs. Because the three types of environmental pollutants could interact with AuNPs through Au–N bonds and electrostatic adsorption, the proposed method has high specificity. The fluorescence enhancement of the RB-AuNP solution observed in the presence of three types of environmental pollutants was significantly higher than that of other substances. These phenomena indicate that RB-AuNPs have a high selectivity towards them. The statistical results of the histogram further exhibited significant differences between the target objects and the other interferences.
3.6. Real sample detection of streptomycin veterinary drugs
To further confirm its practical value, the streptomycin detection system is applied to streptomycin sulfate veterinary drugs, which are mainly aimed at the treatment of various intestinal diseases in livestock and poultry. Based on the drug specifications, a series of concentrations was prepared. As shown in Fig. 10A, as the concentration increased from 50 nM to 2.5 μM, the red fluorescence quenched by AuNPs gradually recovered, leading to an obvious color change from blank to red. The fluorescence spectra also showed consistent changes. The linear variation investigated by plotting (F − F0/F0) against a concentration of streptomycin sulfate veterinary drug in a wide range from 50 nM to 2.5 μM was as follows (Fig. 10B): y = 0.8218x + 0.14218. According to the formula mentioned previously, the LOD was calculated to be 18.3 nM.
3.7. Application of benzidine in Yellow River medium
To validate the feasibility in real samples, a testing system for benzidine detection was further applied to the Yellow River medium. After the simple sample pretreatment, a series of concentrations were spiked into the prepared samples. The results are shown in Fig. 11A. With an increase in concentration from 3 μM to 7.5 μM, the red fluorescence gradually recovered when observed under an ultraviolet lamp, which was accompanied by an obvious increase in fluorescence intensity emitted at 578 nm. The linear variation investigated by plotting (F − F0/F0) against concentrations varying from 3 μM to 5 μM with a high coefficient of 0.99 was as follows (Fig. 11B): y = 2.8632x − 7.7807. The LOD was calculated to be 10.5 nM.
4. Conclusion
In summary, a new type of simple, fast, highly sensitive, and visible naked-eye detection method for the detection of the three representative kinds of pollutants is established in this study. This study also compared the colorimetric detection of AuNPs with an “on–off–on” fluorescence detection system. In this study, although AuNPs are sensitive in response, they are prone to large-scale aggregation, making it difficult to achieve quantitative detection of the target substance. In the “on–off–on” fluorescence detection system, we obtained that the detection range of streptomycin was 5 nM to 1.25 μM with a LOD of 1.12 nM and the detection range of benzidine was 2.5–15 μM with the LOD of 56.52 nM. Finally, the actual samples were tested. Such a testing system based on fluorescent tuning on and off had the following advantages: (1) this is the first study in which three different types of pollutants are determined simultaneously, achieving naked-eye detection. (2) The calibration curves were established in wide ranges of relatively low LODs. (3) The testing system exhibited high sensitivity and selectivity towards three target objects among the same types of interference without any further chemical or complex pre-treatment. (4) The sensor platform was successfully applied to real sample detection.
Author contributions
Conceptualization: Yifei Kong, Xinyue Chen, formal analysis: Yifei Kong, Dan Liu, funding acquisition: Xinyue Chen, methodology: Yifei Kong, Xinran Guo, resources: Xinyue Chen, supervision: Xinyue Chen, writing – original draft: Yifei Kong, Dan Liu, Xinran Guo, writing – review & editing: Yifei Kong, Dan Liu, Xinran Guo.
Conflicts of interest
The authors declare that they have no competing interests.
Supplementary Material
Acknowledgments
The authors greatly appreciate the financial support from Chinese “Double First-class” construction funds (No. 561120206), the 2021 project of State Drug Administration-Key Laboratory of Quality Control of Chinese Medicinal Materials and Decoction Pieces, China (No. 2022GSMPA-KL04).
Electronic supplementary information (ESI) available. See DOI: https://doi.org/10.1039/d3ra02647g
Notes and references
- Cai G. Ge K. Ouyang X. Hu Y. Li G. Thin-layer chromatography combined with surface-enhanced Raman scattering for rapid detection of benzidine and 4-aminobiphenyl in migration from food contact materials based on gold nanoparticle doped metal-organic framework. J. Sep. Sci. 2020;43(14):2834–2841. doi: 10.1002/jssc.202000145. [DOI] [PubMed] [Google Scholar]
- Mazzo T. M. Saczk A. Umbuzeiro G. A. Zanoni M. Analysis of Aromatic Amines in Surface Waters Receiving Wastewater from a Textile Industry by Liquid Chromatographic with Electrochemical Detection. Anal. Lett. 2006;39:2671–2685. [Google Scholar]
- Falciola L. Pifferi V. Mascheroni E. Platinum-Based and Carbon-Based Screen Printed Electrodes for the Determination of Benzidine by Differential Pulse Voltammetry. Electroanalysis. 2012;24:767–775. [Google Scholar]
- Wang Z. Wu L. Wang F. Jiang Z. Shen B. Durian-like multi-functional Fe3O4–Au nanoparticles: synthesis, characterization and selective detection of benzidine. J. Mater. Chem. A. 2013;1:9746–9751. [Google Scholar]
- Bi W. Hayes R. B. Feng P. Qi Y. Chen M. Mortality and incidence of bladder cancer in benzidine exposed workers in China. Am. J. Ind. Med. 1992;21:481–489. doi: 10.1002/ajim.4700210404. [DOI] [PubMed] [Google Scholar]
- Liu J. Bai W. Zhu C. Yan M. Yang S. Chen A. Sensitive colorimetric detection of cyromazine in cucumber samples by using label-free gold nanoparticles and polythymine. Analyst. 2015;140:3064–3069. doi: 10.1039/c4an02398f. [DOI] [PubMed] [Google Scholar]
- Wang P. C. Lee R. J. Chen C. Y. Chou C. C. Lee M. R. Determination of cyromazine and melamine in chicken eggs using quick, easy, cheap, effective, rugged and safe (QuEChERS) extraction coupled with liquid chromatography–tandem mass spectrometry. Anal. Chim. Acta. 2012;752:78–86. doi: 10.1016/j.aca.2012.09.029. [DOI] [PubMed] [Google Scholar]
- Xing H. Gu W. Xu D. Tian F. Yao L. Wang Z. Hu X. A simple fluorescent assay for cyromazine detection in raw milk by using CYR-stabilized G-quadruplex formation. RSC Adv. 2018;8:2418–2425. doi: 10.1039/c7ra12970j. [DOI] [PMC free article] [PubMed] [Google Scholar]
- Liu J. Zhong Y. Jing L. Zhang H. Xi J. Wang J. An enzyme linked immunosorbent assay for the determination of cyromazine and melamine residues in animal muscle tissues. Food Control. 2010;21:1482–1487. [Google Scholar]
- Bai W. Zhu C. Zhang G. Huang Y. Yan J. Yan M. Chen A. Visual colorimetric detection of cyromazine in river water using citrate-stabilized gold nanoparticles. Anal. Methods. 2016;8:5869–5873. [Google Scholar]
- Su H. Chen L. Bing S. Ai S. Fluorescence Detection of Cyromazine using gallic acid-reduced gold nanoparticles. Sens. Actuators, B. 2012;174:458–464. [Google Scholar]
- Wang C. Y. Qi Y. X. Liu X. Q. Determination of Cyromazine and Melamine Based on Capillary Electrophoresis Coupled with Electrogenerated Chemiluminescence at Gold Nanoparticles Modified Electrode. Adv Mat Res. 2014;1033–1034:533–536. [Google Scholar]
- Brynes S. D. Demystifying 21 CFR Part 556–tolerances for residues of new animal drugs in food. Regul. Toxicol. Pharmacol. 2005;42:324–327. doi: 10.1016/j.yrtph.2005.05.009. [DOI] [PubMed] [Google Scholar]
- Le T. Yan P. Xu J. Hao Y. A novel colloidal gold-based lateral flow immunoassay for rapid simultaneous detection of cyromazine and melamine in foods of animal origin. Food Chem. 2013;138:1610–1615. doi: 10.1016/j.foodchem.2012.11.077. [DOI] [PubMed] [Google Scholar]
- Sihua P. Aqiang W. Yuyang L. Jingjing J. Xuncong J. Heming Y. Jinlei L. Shuyan Y. Jianjun L. Shihao Z. Technology for Rapid Detection of Cyromazine Residues in Fruits and Vegetables: Molecularly Imprinted Electrochemical Sensors. Biosensors. 2022;12(6):414. doi: 10.3390/bios12060414. [DOI] [PMC free article] [PubMed] [Google Scholar]
- Ghanbari K. Roushani M. A novel electrochemical aptasensor for highly sensitive and quantitative detection of the streptomycin antibiotic. Bioelectrochemistry. 2018;120:43–48. doi: 10.1016/j.bioelechem.2017.11.006. [DOI] [PubMed] [Google Scholar]
- Taghdisi S. M. Danesh N. M. Nameghi M. A. Ramezani M. Abnous K. A label-free fluorescent aptasensor for selective and sensitive detection of streptomycin in milk and blood serum. Food Chem. 2016;203:145–149. doi: 10.1016/j.foodchem.2016.02.017. [DOI] [PubMed] [Google Scholar]
- Wang X. Chen C. Waterhouse G. I. N. Qiao X. Xu Z. Ultra-sensitive detection of streptomycin in foods using a novel SERS switch sensor fabricated by AuNRs array and DNA hydrogel embedded with DNAzyme. Food Chem. 2022;393:133413. doi: 10.1016/j.foodchem.2022.133413. [DOI] [PubMed] [Google Scholar]
- He X. Han H. Liu L. Shi W. Lu X. Dong J. Yang W. Lu X. Self-Assembled Microgels for Sensitive and Low-Fouling Detection of Streptomycin in Complex Media. ACS Appl. Mater. Interfaces. 2019;11:13676–13684. doi: 10.1021/acsami.9b00277. [DOI] [PubMed] [Google Scholar]
- Dwa B. Xz A. Bc A. Kz A. Using bimetallic Au@Pt nanozymes as a visual tag and as an enzyme mimic in enhanced sensitive lateral-flow immunoassays: Application for the detection of streptomycin. Anal. Chim. Acta. 2020;1126:106–113. doi: 10.1016/j.aca.2020.06.009. [DOI] [PubMed] [Google Scholar]
- Emrani A. S. Danesh N. M. Lavaee P. Ramezani M. Colorimetric and fluorescence quenching aptasensors for detection of streptomycin in blood serum and milk based on double-stranded DNA and gold nanoparticles. Food Chem. 2016;190:115–121. doi: 10.1016/j.foodchem.2015.05.079. [DOI] [PubMed] [Google Scholar]
- Danesh N. M. Ramezani M. Emrani A. S. Abnous K. Taghdisi S. M. A novel electrochemical aptasensor based on arch-shape structure of aptamer-complimentary strand conjugate and exonuclease I for sensitive detection of streptomycin. Biosens. Bioelectron. 2016;75:123–128. doi: 10.1016/j.bios.2015.08.017. [DOI] [PubMed] [Google Scholar]
- Zhao J. Wu Y. Tao H. Chen H. Yang W. Qiu S. Colorimetric detection of streptomycin in milk based on peroxidase-mimicking catalytic activity of gold nanoparticles. RSC Adv. 2017;7:38471–38478. [Google Scholar]
- Yang L. Zhao J. Wang C. Wang Z. Xing C. Guo H. Wang Y. Zhao Z. Hu Z. Cai Z. Bi/BiVO4/NiFe-LDH heterostructures with enhanced photoelectrochemical performance for streptomycin detection. J. Environ. Sci. 2021;109:114–122. doi: 10.1016/j.jes.2021.03.043. [DOI] [PubMed] [Google Scholar]
- Su X. Li Y. Qiao Y. Peng Q. Shi B. Method for determination of streptomycin and streptidine as markers for streptomycin industrial dregs monitoring in pig and poultry compound feeds. J. Chromatogr. B: Biomed. Sci. Appl. 2016;1035:84–90. doi: 10.1016/j.jchromb.2016.09.037. [DOI] [PubMed] [Google Scholar]
- Xu X. Liu D. Luo L. Li L. Wang K. You T. Photoelectrochemical aptasensor based on CdTe quantum dots-single walled carbon nanohorns for the sensitive detection of streptomycin. Sens. Actuators, B. 2017;251:564–571. [Google Scholar]
- Draher J. Ehling S. Cellar N. Reddy T. Henion J. Sousou N. Validation of a rapid method of analysis using ultrahigh-performance liquid chromatography-tandem mass spectrometry for nitrogen-rich adulterants in nutritional food ingredients. J. Chromatogr. A. 2014;1373:106–113. doi: 10.1016/j.chroma.2014.11.019. [DOI] [PubMed] [Google Scholar]
- Draher J. Jonathan S. Nigel R. Todime C. Nick Ehling Stefan Determination of emerging nitrogenous economic adulterants in milk proteins by high-performance liquid chromatography/compact mass spectrometry. Rapid Commun. Mass Spectrom. 2016;30:1265–1272. doi: 10.1002/rcm.7568. [DOI] [PubMed] [Google Scholar]
- Ramezani M. Danesh N. M. Lava Ee P. Abnous K. Taghdisi S. M. A selective and sensitive fluorescent aptasensor for detection of kanamycin based on catalytic recycling activity of exonuclease III and gold nanoparticles. Sens. Actuators, B. 2016;222:1–7. [Google Scholar]
- Lu G. Tan P. Lei C. Nie Z. Huang Y. Yao S. Fluorescent detection of protein kinase based on positively charged gold nanoparticles. Talanta. 2014;128:360–365. doi: 10.1016/j.talanta.2014.04.061. [DOI] [PubMed] [Google Scholar]
- Mayavan S. Dutta N. K. Choudhury N. R. Kim M. Elvin C. M. Hill A. J. Self-organization, interfacial interaction and photophysical properties of gold nanoparticle complexes derived from resilin-mimetic fluorescent protein rec1-resilin. Biomaterials. 2011;32:2786–2796. doi: 10.1016/j.biomaterials.2010.12.030. [DOI] [PubMed] [Google Scholar]
- Zu F. Yan F. Bai Z. Xu J. Wang Y. Huang Y. Zhou X. The quenching of the fluorescence of carbon dots: A review on mechanisms and applications. Microchim. Acta. 2017;184:1899–1914. [Google Scholar]
- Tan D. He Y. Xing X. Zhao Y. Tang H. Pang D. Aptamer functionalized gold nanoparticles based fluorescent probe for the detection of mercury (II) ion in aqueous solution. Talanta. 2013;113:26–30. doi: 10.1016/j.talanta.2013.03.055. [DOI] [PubMed] [Google Scholar]
- Chao J. Zhang Y. N. Zhu D. Liu B. Cui C. J. Su S. Fan C. H. Wang L. H. Hetero-assembly of gold nanoparticles on a DNA origami template. Sci. China: Chem. 2016;59:730–734. [Google Scholar]
- Acet O. Shcharbin D. Zhogla V. Kirsanov P. Halets-Bui I. Onal Acet B. Gok T. Bryszewska M. Odabasi M. Dipeptide nanostructures: Synthesis, interactions, advantages and biomedical applications. Colloids Surf., B. 2023;222:113031. doi: 10.1016/j.colsurfb.2022.113031. [DOI] [PubMed] [Google Scholar]
- Yang Y.-H. Tao X. Bao Q.-L. Yang J. Su L.-J. Zhang J.-T. Chen Y. Yang L.-J. A highly selective supramolecular fluorescent probe for detection of Au3+ based on supramolecular complex of pillar[5]arene with 3, 3′-dihydroxybenzidine. J. Mol. Liq. 2023;370:121018. [Google Scholar]
- Yıldırım M. Acet Ö. Yetkin D. Acet B. Ö. Karakoc V. Odabası M. Anti-cancer activity of naringenin loaded smart polymeric nanoparticles in breast cancer. J. Drug Delivery Sci. Technol. 2022;74:103552. [Google Scholar]
- Tang Y. Yan Z. Wu T. Ding Y. Lv L. A turn-on fluorescent probe for Hg2+ detection by using gold nanoparticle-based hybrid microgels. Sens. Actuators, B. 2016;228:767–773. [Google Scholar]
- Dikici E. Önal Acet B. Acet Ö. Odabaşı M. “Lab-on-pol” colormatic sensor platforms: Melamine detection with color change on melamine imprinted membranes. Microchem. J. 2023;188:108468. [Google Scholar]
- Frens G. Controlled Nucleation for the Regulation of the Particle Size in Monodisperse Gold Suspensions. Nat. Phys. Sci. 1973;241:20–22. [Google Scholar]
- Zhang Z. Chen Z. Wang S. Qu C. Chen L. On-Site Visual Detection of Hydrogen Sulfide in Air Based on Enhancing the Stability of Gold Nanoparticles. ACS Appl. Mater. Interfaces. 2014;6:6300–6307. doi: 10.1021/am500564w. [DOI] [PubMed] [Google Scholar]
- Abedalwafa M. A. Li Y. Ni C. Wang L. Colorimetric sensor arrays for the detection and identification of antibiotics. Anal. Methods. 2019;11:2836–2854. [Google Scholar]
- Liu D. Zhao Y. Ji J. Liu X. Feng S. Chen X. Design of fluorescence system based on rutin functionalized gold nanoparticles: Sensitive detection of etimicin via a smartphone in the food and human samples. Arabian J. Chem. 2022;15:104325. [Google Scholar]
- Yu Y. Ye S. Sun Z. You J. Li W. Song Y. Zhang H. A fluorescent aptasensor based on gold nanoparticles quenching the fluorescence of rhodamine B to detect acetamiprid. RSC Adv. 2022;12:35260–35269. doi: 10.1039/d2ra05037d. [DOI] [PMC free article] [PubMed] [Google Scholar]
- Xu J. Li Y. Guo J. Shen F. Luo Y. Sun C. Fluorescent detection of clenbuterol using fluorophore functionalized gold nanoparticles based on fluorescence resonance energy transfer. Food Control. 2014;46:67–74. [Google Scholar]
- Tseng M.-H. Hu C.-C. Chiu T.-C. A fluorescence turn-on probe for sensing thiodicarb using rhodamine B functionalized gold nanoparticles. Dyes Pigm. 2019;171:107674. [Google Scholar]
- Zhong W. Nanomaterials in fluorescence-based biosensing. Anal. Bioanal. Chem. 2009;394:47–59. doi: 10.1007/s00216-009-2643-x. [DOI] [PubMed] [Google Scholar]
- Hormozi-Nezh Ad M. R. Bagheri H. Bohloul A. Taheri N. Robatjazi H. Highly sensitive turn-on fluorescent detection of captopril based on energy transfer between fluorescein isothiocyanate and gold nanoparticles. J. Lumin. 2013;134:874–879. [Google Scholar]
- Qin H. Ma D. Du J. Distance dependent fluorescence quenching and enhancement of gold nanoclusters by gold nanoparticles. Spectrochim. Acta, Part A. 2018;189:161–166. doi: 10.1016/j.saa.2017.08.025. [DOI] [PubMed] [Google Scholar]
Associated Data
This section collects any data citations, data availability statements, or supplementary materials included in this article.


