

Abstract
Objective. Slow-wave modulation occurs during states of unconsciousness and is a large-scale indicator of underlying brain states. Conventional methods typically characterize these large-scale dynamics by assuming that slow-wave activity is sinusoidal with a stationary frequency. However, slow-wave activity typically has an irregular waveform shape with a non-stationary frequency, causing these methods to be highly unpredictable and inaccurate. To address these limitations, we developed a novel method using tau-modulation, which is more robust than conventional methods in estimating the modulation of slow-wave activity and does not require assumptions on the shape or stationarity of the underlying waveform. Approach. We propose a novel method to estimate modulatory effects on slow-wave activity. Tau-modulation curves are constructed from cross-correlation between slow-wave and high-frequency activity. The resultant curves capture several aspects of modulation, including attenuation or enhancement of slow-wave activity, the temporal synchrony between slow-wave and high-frequency activity, and the rate at which the overall brain activity oscillates between states. Main results. The method’s performance was tested on an open electrocorticographic dataset from two monkeys that were recorded during propofol-induced anesthesia, with electrodes implanted over the left hemispheres. We found a robust propagation of slow-wave modulation along the anterior–posterior axis of the lateral aspect of the cortex. This propagation preferentially originated from the anterior superior temporal cortex and anterior cingulate gyrus. We also found the modulation frequency and polarity to track the stages of anesthesia. The algorithm performed well, even with non-sinusoidal activity and in the presence of real-world noise. Significance. The novel method provides new insight into several aspects of slow-wave modulation that have been previously difficult to evaluate across several brain states. This ability to better characterize slow-wave modulation, without spurious correlations induced by non-sinusoidal signals, may lead to robust and physiologically-plausible diagnostic tools for monitoring brain functions during states of unconsciousness.
Keywords: slow-wave, modulation, phase-amplitude coupling, unconsciousness, cross-correlation, broadband gamma, electrocorticography
1. Introduction
States of unconsciousness (e.g. anesthesia, non-rapid eye movement, sleep, and coma) are often characterized by their distinct electrophysiological signatures. One feature that is common to all of them is slow-wave activity, seen electrographically as large deflections alternating at a rate of approximately 1 Hz. These waves are thought to be large-scale indicators of underlying brain states in which neurons alternate between sustained periods of depolarization (up-states) and hyperpolarization (down-states). Neurons tend to repetitively fire in the depolarized up-state, and remain silent for several hundred milliseconds in the hyperpolarized down-state (Steriade et al 1993, Massimini et al 2004, Murphy et al 2009, 2011).
Slow-waves have been extensively studied during non-rapid eye movement sleep (Massimini et al 2004, Murphy et al 2009) and under anesthesia (Murphy et al 2011) to investigate the complexity of the underlying network interactions. Slow-wave activity is initiated, maintained, and terminated through the interplay between intrinsic network interactions, and modulated by different factors, such as excitability levels (Sancristóbal et al 2016), neuromodulators (Pigorini et al 2015, D’Andola et al 2018, Nghiem et al 2020), and inputs from other connected areas (Sanchez-Vives 2020). Slow-waves have been suggested as the default emergent activity of the cortical network (Sanchez-Vives and Mattia 2014, Sanchez-Vives et al 2017, Sanchez-Vives 2020).
Several studies have examined how the temporal and spatial distribution of slow-wave dynamics relate to the states of unconsciousness (Purdon et al 2015, Brown et al 2018, Kremen et al 2019, von Ellenrieder et al 2022). During propofol-induced anesthesia, the onset of slow-wave is correlated with loss of consciousness (LOC) (Cimenser et al 2011, Lewis et al 2012). Furthermore, there has been particular interest in the modulation of the amplitude of high-frequency neural activity by the phase of low-frequency oscillations (i.e. phase-amplitude coupling, Tort et al 2010). Recent evidence suggests a functional role of this modulation during LOC (Purdon et al 2013, Mukamel et al 2014, Huang et al 2018, Malekmohammadi et al 2019, Stephen et al 2020, Dong et al 2022, Liu et al 2022). Specifically, the slow-wave modulated alpha oscillations at different phases (trough-max and peak-max), depending on the depth of anesthesia (Purdon et al 2013, Mukamel et al 2014). Further, slow-wave modulated broadband signal across different regions, reflecting underlying cortical up- and down-states of unconsciousness (Stephen et al 2020).
Conventional slow-wave modulation analyses are based on phase analysis after narrow-band filtering, which may be confounded by sharp signal transitions and nonsinusoidal waveforms (Aru et al 2015, Cole and Voytek 2017). In these approaches, slow-wave modulation is extracted in three steps: (1) narrow-band bandpass filtering of the neuronal activity into slow-wave and high-frequency band signals; (2) extracting the phase of the slow-wave signal and the power of the high-frequency signal; and (3) quantifying the correlation between the phase and the power (Canolty et al 2006, Tort et al 2010, Purdon et al 2013). These approaches assume that slow-wave activity can be well-characterized by sinusoidal waveforms. However, this is an inappropriate assumption, as slow-wave activity often has an irregular waveform shape and frequency (Stephen et al 2020). Because of this, conventional methods that use narrow-band filtering to extract the phase of the slow-wave activity are highly susceptible to producing spurious coupling in the presence of non-sinusoidal waveforms, leading to an unreliable representation of slow-wave modulation (Cole and Voytek 2017).
Slow-wave activity can be characterized by three general features: modulation strength, polarity, and frequency. Together they may represent different neurophysiological aspects under the state of unconsciousness. For example, modulation strength represents the attenuation or enhancement of slow-wave activity, modulation polarity represents the temporal synchrony between slow-wave and high-frequency activity, and modulation frequency represents the rate at which the activity fluctuates between up and down states. Prior studies have primarily focused on the modulation strength and polarity (Massimini et al 2004, Purdon et al 2013, 2015). However, conventional slow-wave modulation methods assume a stationary modulation frequency, making it difficult to accurately extract the modulation frequency of slow-wave activity that is characterized by instantaneous and non-stationary neural activities.
To address these limitations of conventional slow-wave modulation extraction methods, we describe a novel method (tau-modulation) to estimate slow-wave modulation (figure 1). This method determines a tau-modulation curve (TMC) using a cross-correlation between the slow-wave and the instantaneous power of the band-pass filtered high-frequency signal. It then extracts three modulation features (i.e. strength, frequency, and polarity) that represent different neurophysiological signatures under the state of unconsciousness. In contrast to conventional methods, tau-modulation does not depend on estimating the phase of the slow-wave, making it less prone to spurious coupling in the presence of non-sinusoidal waveforms. Additionally, tau-modulation extracts the instantaneous modulation frequency as well as the modulation strength and polarity, enabling it to conduct more comprehensive monitoring of different states of unconsciousness. This improved performance and robustness against artifacts could help improve the efficiency and reliability of slow-wave modulation methods and could lead to better diagnostic tools for monitoring brain functions during states of unconsciousness.
Figure 1.
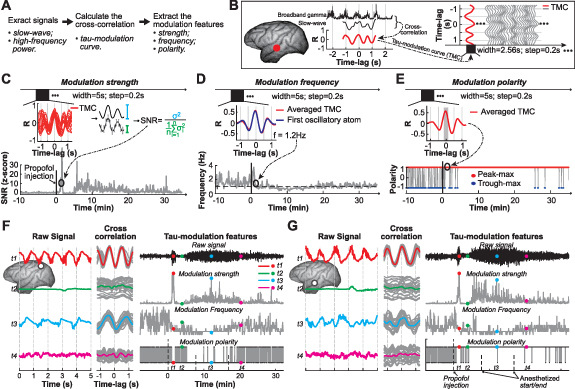
Method description. (A) General steps of tau-modulation method. (B) The tau-modulation curve (TMC) is defined as the cross-correlation coefficient values (R) between the slow-wave and broadband gamma power. (C)–(E) Extracting the three modulation features from the tau-modulation curve. (C) Calculating the signal-to-noise ratio (SNR, Schalk et al 2007) of TMCs within a 5 s-long observation window; (D) averaging the TMCs within a 5 s-long observation window and applying a matching pursuit algorithm (Chandran et al 2016) to extract modulation frequency; (E) averaging the TMCs within a 5 s-long observation window, removing the linear trend, and determining the positive or negative polarity of the averaged TMC around time-lag 0. These steps were repeated every 0.2 s. (F), (G) Applying the tau-modulation method to the signals recorded from two representative electrodes. The left panel shows the raw signal within four different periods (t1–t4); the middle panel shows the cross-correlation (i.e. tau-modulation curve) between the slow-wave and broadband gamma activity; the right panel depicts the raw signal and three modulation features extracted from the tau-modulation curve.
2. Material and methods
2.1. Data collection
We used propofol-induced anesthesia datasets to verify the tau-modulation method. The datasets were recorded at the RIKEN Institute (Japan) and are publicly available as part of the Neurotycho database (http://neurotycho.org/anesthesia-task). The protocol was approved by the RIKEN Ethics Committee (Yanagawa et al 2013). Two macaca fuscata monkeys (Chibi, C; George, G; supplementary figure 1) took part in the propofol-induced anesthesia study, and each monkey repeated the experiment on two separate days (C1, C2, G1, G2).
Electrocorticography (ECoG) data were recorded with a sampling frequency of 1 kHz using chronically implanted multichannel electrode arrays (Unique Medical, Japan). The arrays, consisting of 128 platinum electrodes spaced at 5 mm inter-electrode distance, were implanted in the subdural space and covered the majority of the lateral surface of the left hemisphere and the medial cortical regions. Reference electrodes were made of rectangular platinum plates placed within the subdural space between the ECoG array and dura. Ground electrodes were placed within the epidural space.
Throughout the experiments, the monkey was seated in a primate chair with both arms and head movement restricted. The experiment was comprised of three conditions: (1) awake; (2) anesthetized; and (3) recovery. The awake condition had periods with eyes-uncovered and eyes-covered. First, the monkey had its eyes uncovered and sat at rest for up to 20 min. Next, the monkey’s eyes were covered by an eye mask to refrain from evoking visual responses. During the eyes-covered period, the monkey sat at rest for up to 20 min before propofol (5.2 mg kg−1 for C1 and C2, 5.0 mg kg−1 for G1 and G2) was injected intravenously. LOC was defined as the point at which the monkey no longer responded to manipulation of the monkey’s hand or touching of the nostril or philtrum with a cotton swab. As an additional confirmation that the monkey had reached LOC, slow-wave activities were observed in the neural signal. Following the LOC, the monkey was left anesthetized to recover on its own from anesthesia (recovery condition). Throughout the recovery condition, there were eyes-covered and eyes-uncovered periods. During the recovery period, the monkey’s eyes were covered, and the monkey sat calmly for 10–30 min. Next, the monkey’s eyes were uncovered, and the monkey sat at rest for about 10 min. The onset of recovery was defined as the point at which the monkey started to respond to manipulation of the monkey’s hand or touching of the nostril or philtrum with a cotton swab.
Data processing was performed using EEGLAB functions (Delorme and Makeig 2004) and custom scripts written in MATLAB (Mathworks, Inc.). We pre-processed the signals using a common average reference spatial filter to remove common noise across all electrodes (Liu et al 2015), and two finite impulse response (FIR) notch filters (48–52 Hz, 98–102 Hz) to remove line noise.
2.2. Tau-modulation method
The tau-modulation method is comprised of three principle steps (figure 1(A)): (1) extracting slow-wave and high-frequency power; (2) calculating the cross-correlation between slow-wave and high-frequency power along each time-lag (τ or tau), resulting in a series of correlation coefficients (i.e. TMC); and (3) extracting the three features (strength, frequency, polarity) from the TMC. This method was applied to the signal from each of the electrodes.
Slow-wave activity reflects a rhythmic alteration between up- and down-states. Power spectral changes of ECoG signals recorded in the broadband gamma range correlate with population-level activity and represent underlying local multi-unit spiking activity (Nir et al 2007, Ray et al 2008, Manning et al 2009, Miller et al 2014). Thus, broadband gamma activity can reliably reflect neuronal activation during up-state and distinguish it from down-state periods (Stephen et al 2020). This evidence presents the primary motivation for applying the tau-modulation analysis to determine the coupling between slow-wave and broadband gamma activity. Prior studies (Miller et al 2009, 2014) showed that broadband gamma is a spectrally broad but spatially focal, non-rhythmic neural activity that occurs above ∼40 Hz. In our analysis, we chose the broadband gamma range as the 55–145 Hz band, to exclude the influence of line noise at 50 Hz and its harmonic at 150 Hz. The MATLAB code that implements the tau-modulation methods and sample data is openly available on GitHub (https://github.com/neurotechcenter/TauModulation_SlowWave).
2.2.1. Extracting TMC
We first extracted slow-wave (0.2–4 Hz) and broadband gamma activity (55–145 Hz) using FIR bandpass filters (, EEGLAB). We then applied a Hilbert transform on the broadband gamma activity to extract its envelope. Finally, we down-sampled (, EEGLAB) the resulting signals, i.e. the slow-wave activity and broadband gamma envelope, to 25 Hz to reduce the computation complexity of our analysis. Next, we calculated the cross-correlation between the slow-wave and broadband gamma envelope. Specifically, we calculated the Pearson correlation between the 2.56 s-long Hamming-window-filtered slow-wave segment and the broadband gamma envelope segment with a time-lag ranging from −1.28 s to 1.28 s, which yielded one TMC (red line in figure 1(B)). We repeated this procedure every 0.2 s to yield a series of TMCs along time (grey line in figure 1(B)). Note that this analysis did not involve estimating the phase of the slow-wave, a typical step employed by conventional slow-wave modulation analysis methods, which makes our tau-modulation method less prone to spurious correlation induced by non-sinusoidal waveforms. Finally, we extracted the three modulation features (i.e. strength, frequency, and polarity) from the TMCs as described below.
2.2.2. Extracting the modulation strength
We calculated the signal-to-noise ratio (SNR) of TMCs within a 5 s-long observation window (i.e. 25 TMCs over 5 s). Specifically, we calculated the SNR as the ratio between the variance of the whole TMC period and the average variance of the individual sample during the TMC period (figure 1(C), equation (1), Schalk et al (2007)). SNR values larger than 1 indicate that broadband gamma activity was modulated by the slow wave, while SNR values close to 1 indicate no modulation. This procedure was repeated every 0.2 s to yield a series of SNR values over time. We chose the awake eyes-covered period as the baseline. We normalized the SNR of each electrode by subtracting the average SNR of the baseline and dividing it by the standard deviation of the baseline. The SNR values tended to be increased after propofol injection. The SNR was calculated as follows:
In this equation, σ 2 (blue error bar in figure 1(C)) indicates the variance of the R values across whole time-lags (red traces in figure 1(C)). (grey error bar in figure 1(C)) indicates the variance of the R values during each time-lag. n indicates the number of time-lags (i.e. 64; calculated as the feature rate of 25 samples per second × the 2.56 s length of the whole time-lags).
To determine the peak in the tau-modulation strength (figure 3(C)), we first approximated the electrode’s normalized SNR values over the 5–20 min after propofol injection using a 20th-order polynomial curve (supplementary figure 3(B)). This approximation created a temporally smoothed representation of the tau-modulation strength and allowed us to determine the point in time where the modulation strength of each electrode reached its first maximum (green dots, figure 3(C), supplementary figure 3). Specifically, we chose the first peak of the fitted line that exceeded the average SNR values within the anesthetized period.
Figure 3.

Spatial-temporal dynamics of tau-modulation strength. (A) Averaged (mean±s.d., n = 128) tau-modulation strength values across all electrodes for each dataset (C1, C2, G1, G2). (B) Tau-modulation strength of individual electrode within six time periods (t1–t6, red bar in A). (C) Tau-modulation curves for each electrode of dataset C1, which are sorted by the peak modulation time (green dots). (D) Propagation of tau-modulation strength across the entire cortex (color represents the peak modulation time, and circle size represents the corresponding modulation strength).
2.2.3. Extracting the modulation frequency
We averaged the TMCs within a 5 s-long observation window and applied a matching pursuit algorithm (Chandran et al 2016) to extract the fundamental oscillation frequency of the averaged TMC. Matching pursuit is a technique that iteratively approximates the original signal using a linear combination of Gabor atoms, enabling it to capture both sharp transient and sustained oscillatory elements. We defined the first oscillatory atom as the modulation frequency. This procedure was repeated every 0.2 s to yield a series of modulation frequency values along time. We found the modulation frequency to be approximately 1 Hz after propofol injection (grey line, figure 1(D)).
2.2.4. Extracting the modulation polarity
The modulation polarity is the sign of the cross-correlation between slow-wave and broadband gamma envelope. At any given time-lag of the cross-correlation, if the sign is positive, it indicates that the slow-wave and broadband gamma are positively coupled and thus increase and decrease together (peak-max); if the correlation is negative, it means that the slow-wave and broadband gamma are negatively-coupled and thus increase when the other decreases (trough-max). To calculate the modulation polarity, we averaged the TMCs within a 5 s-long observation window and removed the linear trend of the resulting averaged TMC. We then analyzed the correlation between slow-wave and broadband gamma. We found that under propofol anesthesia, broadband gamma was much more likely to couple to the peak or the trough of the slow-wave than to the rising or falling phases (supplementary figure 7, Purdon et al 2013). Hence a positive/negative value around a time-lag of 0 represents that broadband gamma amplitude is higher during the peak/trough of the slow-wave (peak-max/trough-max). For example, figure 1(E) shows an averaged TMC with a positive value around time-lag 0 (grey shaded area), representing a peak-max phenomenon during the 5 s period. This procedure was repeated every 0.2 s and yielded a series of modulation polarity values along time (1: peak-max, red cycle; -1: trough-max, blue cycle). This specific electrode shown in figure 1(E) exhibited a consistent peak-max slow-wave modulation after propofol injection.
3. Results
3.1. Electrophysiological effects of propofol
To illustrate how tau-modulation characterizes the electrophysiological dynamics during propofol anesthesia, we selected signals from temporal, parietal, and prefrontal cortex in monkey Chibi (C1, figure 2(A)) at six time periods (t1–t6, figure 2(B)). The upper panel shows raw signals (figure 2(C)). Prior to propofol injection, the ECoG signal exhibits a wide range of neural activity (t1). Within one minute of propofol injection, the ECoG signal exhibits synchronized slow-wave activity for up to one minute (t2). This is followed by a general suppression of neural activity for several minutes (t3) and a steady increase of slow-wave activity over the next 10 min (t4–t6). The middle panel shows the spectral power. The neural signals exhibit a typical 1/f spectrum during baseline (t1). Spectral power increases within one minute of propofol injection, especially in slow-wave frequencies (t2). This is followed by a general decrease in spectral power (t3). Spectral power remains suppressed, except for an increase in low-frequency power, indicating an increased slow-wave activity (t4–t6). The lower panel shows the TMC, which characterizes the slow-wave modulation activity following the propofol injection (t2) and the period during which slow-wave activity returns (t4–t6).
Figure 2.

Electrophysiological effects of propofol. (A) Representative electrode locations within five distinct functional cortical areas. We chose 21 electrodes within five functionally relevant cortical areas to illustrate the effect of propofol on the monkey’s cortex. (B) Timeline of the propofol anesthesia procedure. We chose six pivotal periods (t1–t6) to illustrate the neural signal dynamics before and after propofol injection. (C) Detailed signal properties during the six time periods (signals for the same electrodes as in (A). The upper panel shows raw signals, the middle panel shows the spectral power, and the lower panel shows the tau-modulation curves.
3.2. Modulation strength
To understand how slow-wave modulation characterizes changes in the electrophysiological activity after propofol injection, we averaged the tau-modulation strength values across all the electrodes (figure 3(A)). We found a sudden sharp increase of the modulation strength within one minute of propofol injection, followed by a return to baseline and a gradual increase within the following minutes. This increase faded away within the next half hour. This evolution of the neural activity is indicated in figure 2.
To investigate the spatial-temporal dynamics of slow-wave modulation, we analyzed the tau-modulation strength of individual electrodes (figure 3(B)) within six time periods (t1–t6, red bar in figure 3(A)). The results indicate the dynamic networks evolved in two distinctly different stages. The first stage (around t2) encompasses a roughly one-minute-long period following propofol injection. The spatial dynamics of this period resemble those of the default mode networks (supplementary figure 2) known to have vast anatomical connections throughout the brain, and are considered to relate to high-order functions (Binder et al 2009, Buckner and DiNicola 2019).
The second stage (t3–t6) encompasses roughly 5–20 min after propofol injection. During this stage, spatiotemporal dynamics of the tau-modulation strength indicate the propagation of the effect of propofol on the individual brain regions. We analyzed tau-modulation strength across the cortex throughout the second stage to determine whether there is a clear propagation effect with early peak tau-modulation strength across time and electrode locations (green dots, figure 3(C), supplementary figure 3). We found that the propagation of modulation strength (figure 3(D)) traveled across the entire cortex (color represents the peak modulation time, and cycle size represents the corresponding modulation strength). Our results show the spatiotemporal propagation along the anterior–posterior axis of the lateral aspect of the cortex. We further demonstrate that this propagation preferentially originated from the anterior superior temporal cortex and anterior cingulate gyrus (supplementary figure 4).
The tau-modulation method was compared to conventional methods for characterizing modulation, including the modulation index as described in Canolty et al (2006). This comparison found that the results generally aligned with one another, and tau-modulation demonstrated a stronger modulation effect, indicating a higher sensitivity and robustness in monitoring brain states (supplementary figure 5). Additionally, the interpretation of slow-wave as cortical up-state and down-state suggests that neural activity at all frequencies is coupled to slow-wave activity. This is supported by findings that up- and down-states equally affect rhythmic and non-rhythmic neural activities (Lewis et al 2012). We further confirmed this phenomenon by determining the effect of slow-wave modulation on different frequency bands (i.e. theta, alpha, beta, and low gamma), which demonstrated similar findings (supplementary figure 6).
3.3. Modulation frequency
We used a matching pursuit algorithm (figure 4(A)) to extract the modulation frequency from the TMC that corresponds to the specific frequency of slow-wave modulation due to propofol anesthesia. We then averaged the tau-modulation frequencies across all electrodes (figure 4(B)). Similar to the modulation strength, we found a sudden sharp transition in the modulation frequency from a wide range of frequencies to converge at a single frequency around 1 Hz. This transition occurred within one minute of propofol injection, followed by a short period of instability, and then a gradual upward trend in modulation frequency over the following minutes.
Figure 4.

Tau-modulation frequency and polarity. (A) Upper panel shows the modulation frequency for one electrode near the superior temporal sulcus in dataset C1. The modulation frequency was defined as the first oscillatory atom from the matching pursuit algorithm (Chandran et al 2016). The lower panel shows the tau-modulation curve (black) and the first oscillatory atom (cyan) during six time periods (t1–t6, red bar in upper panel). These results indicated that the matching pursuit algorithm could accurately extract the modulation frequency. (B) Averaged (mean±s.d., n = 128) modulation frequency across all electrodes for each dataset (C1, C2, G1, G2). (C) ECoG signals (left panel) and the corresponding tau-modulation curve (right panel) with opposite modulation polarity. Red and blue indicate peak-max and trough-max, respectively. (D) Left panel: average modulation polarity values around the sharp modulation period (roughly one minute following propofol injection). Electrodes with positive/negative averaged polarity values were indicated as peak-max/trough-max modulation electrodes (red/blue). Right panel: averaged (mean±s.d.) modulation polarity for peak-max/trough-max modulation electrodes (red/blue).
3.4. Modulation polarity
We found that a positive/negative modulation polarity around time-lag 0 (figure 4(C)-right) could faithfully reflect the peak-max/trough-max modulation (figure 4(C)-left). We averaged the tau-modulation polarity values across the peak-max and trough-max modulation electrodes (figure 4(D)-left), and found a separation of modulation polarity towards the end of the anesthesia (figure 4(D)-right).
4. Discussion
The tau-modulation method is a novel approach that provides insight into slow-wave modulation and propagation during states of unconsciousness. We demonstrated that this method could extract modulation strength, frequency, and polarity from a simple TMC derived from the cross-correlation between the slow-wave and high-frequency signals. Unlike conventional methods, tau-modulation does not require an estimation of the phase of slow-wave activity, making it less prone to the confounding effects induced by non-sinusoidal brain waves. We validated this method by applying it to electrocorticographic signals recorded during propofol-induced anesthesia and showed that the results were comparable to conventional methods.
Our results showed a strong slow-wave modulation strength over the default mode network (supplementary figure 2). Positron emission tomography and functional magnetic resonance imaging studies found multiple cortical areas that were maximally involved in slow-wave activity, including the left inferior frontal gyrus, the entire extent of the cingulate gyrus (from anterior to posterior), the precuneus and the insula (Maquet 2000, Dang-Vu et al 2005, Kaufmann et al 2006, Riedner et al 2011). EEG studies also showed similar areas of involvement (Massimini et al 2004, Murphy et al 2009, 2011). The overlap between the default mode network and the areas maximally involved by slow-wave activity highly suggests a neurophysiologic association (Huber et al 2004, 2006, Van Someren et al 2011).
Slow-waves can have distinct cortical origins. For example, surface EEG analyses have suggested that the transition from down-state to up-state originates in the lateral anterior-most part of the scalp (Massimini et al 2004). Source modeling of high-density EEG has found diffuse hotspot origins of slow-waves in the insula, temporal, frontal, and parietal cortices. Approximately 46% of spontaneous slow waves across all subjects included at least one insula voxel within their origin (Murphy et al 2009, 2011). Sleep studies found the underlying active and inactive neuronal states occur locally in most slow-waves (Nir et al 2011). Our findings suggest that slow-waves during propofol anesthesia originate preferentially in the area around the anterior superior temporal gyrus. Since the insula is in the deeper areas around the anterior superior temporal gyrus, our results indicate that slow-waves might originate from the insula (supplementary figure 4). However, the underlying reason for this regional origin selectivity remains unknown. It might be that slow-waves originating in these areas could better propagate to other cortical areas, a hypothesis that is supported by the observation that the area around the lateral sulcus is important for initiating and propagating seizures in many cases of temporal lobe epilepsy (Isnard et al 2000, Ryvlin et al 2006).
Several studies indicate that slow-waves are not instantaneous events, but rather that they travel across the brain. Spontaneous slow-waves have distinct cortical origins with a characteristic propagation across the cortex, and involve unique subsets of cortical structures (Murphy et al 2009, 2011). For example, Murphy et al found one slow-wave propagation along the anterior–posterior axis that was mediated by a cingulate pathway, and another along the anterior–posterior axis over the lateral aspect of the cortex (Murphy et al 2009, 2011). In neurosurgical patients, Nir et al used simultaneous scalp EEG, intracerebral EEG, and unit firing from multiple brain regions to show that slow-waves can propagate from the medial prefrontal cortex to the medial temporal lobe and hippocampus (Nir et al 2011). Ruiz-Mejias et al found slow-wave propagation patterns in the anteroposterior axis in motor cortex and the mediolateral axis in visual cortex with multielectrode recordings in mice (Ruiz-Mejias et al 2011), and studies in cats found neural activity spread preferentially in the anterior-to-posterior direction (Volgushev et al 2006, Volgushev et al 2011). In our study, we found a spatiotemporal propagation along the anterior–posterior axis of the lateral aspect of the cortex (figure 3, supplementary figure 3), which is in general agreement with these studies.
Slow-wave activities are thought to reflect up and down states, and typically have a frequency below 1 Hz, largely between 0.2 and 0.5 Hz (Sanchez-Vives 2020). Extracting the instantaneous modulation frequency is crucial to understand when dynamic changes occur between brain states. However, slow-wave modulation is not purely sinusoidal, and methods that utilize narrow bandpass filters are not able to determine the modulation frequency at any given time-point (Purdon et al 2013, Mukamel et al 2014). This is one significant advantage of the tau-modulation method, which can extract the instantaneous modulation frequency (figures 4(A) and (B)), yielding more comprehensive insight into slow-wave modulation.
Anesthesia-induced slow-wave activity can modulate alpha oscillations at different polarities (peak-max or trough-max), depending on the depth of anesthesia (Purdon et al 2013, Mukamel et al 2014, Brown et al 2018), which most likely reflects underlying changes in the polarization level of the thalamus (Soplata et al 2017). The results of this study show that the tau-modulation method can reliably extract polarity from the TMC, providing significant insight into the state of unconsciousness (figures 4(C) and (D)).
Previous studies found a switch between the peak-max and trough-max slow-wave modulation before and after LOC (Purdon et al 2013, Stephen et al 2020). This effect was found to occur predominantly between slow-wave and alpha-band activity. A later study found trough-max slow-wave modulation to primarily occur within the low-frequency band (10–20 Hz) before LOC, and peak-max slow-wave modulation to occur within a broad frequency band after LOC (5–50 Hz) (Stephen et al 2020). This indicates that different underlying mechanisms might drive trough-max and peak-max slow-wave modulation. Our study mainly focuses on the modulation of slow-wave on broadband gamma activity, which is in general congruence with the results shown in Stephen et al (2020), where the trough-max effect did not show in higher frequencies (above 20 Hz) during the awake state.
One limitation of any method that calculates the coupling between amplitude and phase of a signal is that it may lead to more stochastic results in the absence of such coupling within the investigated frequency band. For example, the absence of a slow-wave during the awake state leads to unreliable results for the modulation frequency and polarity (see Figures 1(F)–(G). It is thus important to note, that for periods of low modulation strength, the modulation frequency and polarity may not be interpretable.
5. Conclusions
This study presents a novel tau-modulation method for slow-wave modulation analysis. This method extracts three important instantaneous modulation features (strength, frequency, and polarity) from a simple TMC, which can be derived from the cross-correlation between slow-wave and high-frequency signals. Combining the three modulation features in real-time provides a sensitive and physiologically-relevant marker of brain states related to unconsciousness, including depth of anesthesia, and may have applications in states of sleep and coma.
Acknowledgments
This work was supported by the National Institutes of Health (NIH) Grants R01-MH120194, R01-EB026439, T32-GM139799, R01-CA203861, R01-NS101013, U24-NS109103, U01-NS108916, U01-NS128612, P41-EB018783, the McDonnell Center for Systems Neuroscience, Fondazione Neurone, the National Natural Science Foundation of China (51620105002, 82272116), the Shanghai Municipal Science and Technology Major Project (No. 2018SHZDZX01) and ZJLab.
Data availability statement
The data that support the findings of this study are openly available at the following URL: http://neurotycho.org/anesthesia-task.
Authors’ contributions
Conceptualization: T X, Z W, P B. Methodology: T X, P B. Formal analysis: T X. Visualization: T X, P B. Funding acquisition: T X, T J F, X S, X Z, E C L, J T W, L C, P B. Supervision: P B. Writing—original draft: T X, P B. Writing—review & editing: T X, Z W, T J F, X S, X Z, E C L, J T W, L C, P B.
Conflict of interest
One Patent (US20220218264A1) related to the tau-modulation method described in this manuscript has been published. The inventors/contributors of this patent involve some of the manuscript authors, including T X, Z W, X S, X Z, E C L, L C, and P B.
Code availability
The MATLAB scripts necessary to reproduce the results presented in this manuscript are on GitHub https://github.com/neurotechcenter/TauModulation_SlowWave.
References
- Aru J, Aru J, Priesemann V, Wibral M, Lana L, Pipa G, Singer W, Vicente R. Untangling cross-frequency coupling in neuroscience. Curr. Opin. Neurobiol. 2015;31:51–61. doi: 10.1016/j.conb.2014.08.002. [DOI] [PubMed] [Google Scholar]
- Binder J R, Desai R H, Graves W W, Conant L L. Where is the semantic system? A critical review and meta-analysis of 120 functional neuroimaging studies. Cereb. Cortex. 2009;19:2767–96. doi: 10.1093/cercor/bhp055. [DOI] [PMC free article] [PubMed] [Google Scholar]
- Brown E, Purdon P, Akeju O, An J. Using EEG markers to make inferences about anaesthetic-induced altered states of arousal. Br. J. Anaesth. 2018;121:325–7. doi: 10.1016/j.bja.2017.12.034. [DOI] [PMC free article] [PubMed] [Google Scholar]
- Buckner R L, DiNicola L M. The brain’s default network: updated anatomy, physiology and evolving insights. Nat. Rev. Neurosci. 2019;20:593–608. doi: 10.1038/s41583-019-0212-7. [DOI] [PubMed] [Google Scholar]
- Canolty R T, Edwards E, Dalal S S, Soltani M, Nagarajan S S, Kirsch H E, Berger M S, Barbaro N M, Knight R T. High gamma power is phase-locked to theta oscillations in human neocortex. Science. 2006;313:1626–8. doi: 10.1126/science.1128115. [DOI] [PMC free article] [PubMed] [Google Scholar]
- Chandran K S S, Mishra A, Shirhatti V, Ray S. Comparison of matching pursuit algorithm with other signal processing techniques for computation of the time-frequency power spectrum of brain signals. J. Neurosci. 2016;36:3399–408. doi: 10.1523/JNEUROSCI.3633-15.2016. [DOI] [PMC free article] [PubMed] [Google Scholar]
- Cimenser A, Purdon P L, Pierce E T, Walsh J L, Salazar-Gomez A F, Harrell P G, Tavares-Stoeckel C, Habeeb K, Brown E N. Tracking brain states under general anesthesia by using global coherence analysis. Proc. Natl Acad. Sci. 2011;108:8832–7. doi: 10.1073/pnas.1017041108. [DOI] [PMC free article] [PubMed] [Google Scholar]
- Cole S R, Voytek B. Brain oscillations and the importance of waveform shape. Trends Cogn. Sci. 2017;21:137–49. doi: 10.1016/j.tics.2016.12.008. [DOI] [PubMed] [Google Scholar]
- D’Andola M, Rebollo B, Casali A G, Weinert J F, Pigorini A, Villa R, Massimini M, Sanchez-Vives M V. Bistability, causality and complexity in cortical networks: an in vitro perturbational study. Cereb. Cortex. 2018;28:2233–42. doi: 10.1093/cercor/bhx122. [DOI] [PubMed] [Google Scholar]
- Dang-Vu T T, Desseilles M, Laureys S, Degueldre C, Perrin F, Phillips C, Maquet P, Peigneux P. Cerebral correlates of delta waves during non-REM sleep revisited. NeuroImage. 2005;28:14–21. doi: 10.1016/j.neuroimage.2005.05.028. [DOI] [PubMed] [Google Scholar]
- Delorme A, Makeig S. EEGLAB: an open source toolbox for analysis of single-trial EEG dynamics including independent component analysis. J. Neurosci. Methods. 2004;134:9–21. doi: 10.1016/j.jneumeth.2003.10.009. [DOI] [PubMed] [Google Scholar]
- Dong K, Zhang D, Wei Q, Wang G, Huang F, Chen X, Muhammad K G, Sun Y, Liu J. Intrinsic phase–amplitude coupling on multiple spatial scales during the loss and recovery of consciousness. Comput. Biol. Med. 2022;147:105687. doi: 10.1016/j.compbiomed.2022.105687. [DOI] [PubMed] [Google Scholar]
- Huang Y, Wu D, Bahuri N, Wang S, Hyam J, Yarrow S, FitzGerald J, Aziz T, Green A. Spectral and phase-amplitude coupling signatures in human deep brain oscillations during propofol-induced anaesthesia. Br. J. Anaesth. 2018;121:303–13. doi: 10.1016/j.bja.2018.04.031. [DOI] [PubMed] [Google Scholar]
- Huber R, Felice Ghilardi M, Massimini M, Tononi G. Local sleep and learning. Nature. 2004;430:78–81. doi: 10.1038/nature02663. [DOI] [PubMed] [Google Scholar]
- Huber R, Ghilardi M F, Massimini M, Ferrarelli F, Riedner B A, Peterson M J, Tononi G. Arm immobilization causes cortical plastic changes and locally decreases sleep slow wave activity. Nat. Neurosci. 2006;9:1169–76. doi: 10.1038/nn1758. [DOI] [PubMed] [Google Scholar]
- Isnard J, Guénot M, Ostrowsky K, Sindou M, Mauguière F. The role of the insular cortex in temporal lobe epilepsy. Ann. Neurol. 2000;48:614–23. doi: 10.1002/1531-8249(200010)48:4614::AID-ANA83.0.CO;2-S. [DOI] [PubMed] [Google Scholar]
- Kaufmann C, Wehrle R, Wetter T C, Holsboer F, Auer D P, Pollmächer T, Czisch M. Brain activation and hypothalamic functional connectivity during human non-rapid eye movement sleep: an EEG/fMRI study. Brain. 2006;129:655–67. doi: 10.1093/brain/awh686. [DOI] [PubMed] [Google Scholar]
- Kremen V, Brinkmann B H, Van Gompel J J, Stead M, St Louis E K, Worrell G A. Automated unsupervised behavioral state classification using intracranial electrophysiology. J. Neural Eng. 2019;16:026004. doi: 10.1088/1741-2552/aae5ab. [DOI] [PubMed] [Google Scholar]
- Lewis L D, et al. Rapid fragmentation of neuronal networks at the onset of propofol-induced unconsciousness. Proc. Natl Acad. Sci. 2012;109:E3377–86. doi: 10.1073/pnas.1210907109. [DOI] [PMC free article] [PubMed] [Google Scholar]
- Liu J, Dong K, Low S S, Wei Q, Wang G, Huang F, Chen X, Muhammad K G, Zhang D. Dynamic alpha-gamma phase-amplitude coupling signatures during sevoflurane-induced loss and recovery of consciousness. Neurosci. Res. 2022;185:20–28. doi: 10.1016/j.neures.2022.09.002. [DOI] [PubMed] [Google Scholar]
- Liu Y, Coon W G, de Pesters A, Brunner P, Schalk G. The effects of spatial filtering and artifacts on electrocorticographic signals. J. Neural Eng. 2015;12:056008. doi: 10.1088/1741-2560/12/5/056008. [DOI] [PMC free article] [PubMed] [Google Scholar]
- Malekmohammadi M, Price C M, Hudson A E, DiCesare J A T, Pouratian N. Propofol-induced loss of consciousness is associated with a decrease in thalamocortical connectivity in humans. Brain. 2019;142:2288–302. doi: 10.1093/brain/awz169. [DOI] [PMC free article] [PubMed] [Google Scholar]
- Manning J R, Jacobs J, Fried I, Kahana M J. Broadband shifts in local field potential power spectra are correlated with single-neuron spiking in humans. J. Neurosci. 2009;29:13613–20. doi: 10.1523/JNEUROSCI.2041-09.2009. [DOI] [PMC free article] [PubMed] [Google Scholar]
- Maquet P. Functional neuroimaging of normal human sleep by positron emission tomography. J. Sleep Res. 2000;9:207–31. doi: 10.1046/j.1365-2869.2000.00214.x. [DOI] [PubMed] [Google Scholar]
- Massimini M, Huber R, Ferrarelli F, Hill S, Tononi G. The sleep slow oscillation as a traveling wave. J. Neurosci. 2004;24:6862–70. doi: 10.1523/JNEUROSCI.1318-04.2004. [DOI] [PMC free article] [PubMed] [Google Scholar]
- Miller K J, Honey C J, Hermes D, Rao R P, den Nijs M, Ojemann J G. Broadband changes in the cortical surface potential track activation of functionally diverse neuronal populations. NeuroImage. 2014;85:711–20. doi: 10.1016/j.neuroimage.2013.08.070. [DOI] [PMC free article] [PubMed] [Google Scholar]
- Miller K J, Zanos S, Fetz E E, den Nijs M, Ojemann J G. Decoupling the cortical power spectrum reveals real-time representation of individual finger movements in humans. J. Neurosci. 2009;29:3132–7. doi: 10.1523/JNEUROSCI.5506-08.2009. [DOI] [PMC free article] [PubMed] [Google Scholar]
- Mukamel E A, et al. A transition in brain state during propofol-induced unconsciousness. J. Neurosci. 2014;34:839–45. doi: 10.1523/JNEUROSCI.5813-12.2014. [DOI] [PMC free article] [PubMed] [Google Scholar]
- Murphy M, et al. Propofol anesthesia and sleep: a high-density EEG study. Sleep. 2011;34:283–91. doi: 10.1093/sleep/34.3.283. [DOI] [PMC free article] [PubMed] [Google Scholar]
- Murphy M, Riedner B A, Huber R, Massimini M, Ferrarelli F, Tononi G. Source modeling sleep slow waves. Proc. Natl Acad. Sci. 2009;106:1608–13. doi: 10.1073/pnas.0807933106. [DOI] [PMC free article] [PubMed] [Google Scholar]
- Nghiem T-A E, et al. Cholinergic switch between two types of slow waves in cerebral cortex. Cereb. Cortex. 2020;30:3451–66. doi: 10.1093/cercor/bhz320. [DOI] [PubMed] [Google Scholar]
- Nir Y, Fisch L, Mukamel R, Gelbard-Sagiv H, Arieli A, Fried I, Malach R. Coupling between neuronal firing rate, gamma LFP and bold fMRI is related to interneuronal correlations. Curr. Biol. 2007;17:1275–85. doi: 10.1016/j.cub.2007.06.066. [DOI] [PubMed] [Google Scholar]
- Nir Y, Staba R J, Andrillon T, Vyazovskiy V V, Cirelli C, Fried I, Tononi G. Regional slow waves and spindles in human sleep. Neuron. 2011;70:153–69. doi: 10.1016/j.neuron.2011.02.043. [DOI] [PMC free article] [PubMed] [Google Scholar]
- Pigorini A, et al. Bistability breaks-off deterministic responses to intracortical stimulation during non-REM sleep. NeuroImage. 2015;112:105–13. doi: 10.1016/j.neuroimage.2015.02.056. [DOI] [PubMed] [Google Scholar]
- Purdon P L, et al. Electroencephalogram signatures of loss and recovery of consciousness from propofol. Proc. Natl Acad. Sci. 2013;110:E1142–51. doi: 10.1073/pnas.1221180110. [DOI] [PMC free article] [PubMed] [Google Scholar]
- Purdon P L, Sampson A, Pavone K J, Brown E N. Clinical electroencephalography for anesthesiologists: part I background and basic signatures. Anesthesiology. 2015;123:937–60. doi: 10.1097/ALN.0000000000000841. [DOI] [PMC free article] [PubMed] [Google Scholar]
- Ray S, Crone N E, Niebur E, Franaszczuk P J, Hsiao S S. Neural correlates of high-gamma oscillations (60–200 Hz) in macaque local field potentials and their potential implications in electrocorticography. J. Neurosci. 2008;28:11526–36. doi: 10.1523/JNEUROSCI.2848-08.2008. [DOI] [PMC free article] [PubMed] [Google Scholar]
- Riedner B A, Hulse B K, Murphy M J, Ferrarelli F, Tononi G. Temporal dynamics of cortical sources underlying spontaneous and peripherally evoked slow waves. Prog. Brain Res. 2011;193:201–18. doi: 10.1016/B978-0-444-53839-0.00013-2. [DOI] [PMC free article] [PubMed] [Google Scholar]
- Ruiz-Mejias M, Ciria-Suarez L, Mattia M, Sanchez-Vives M V. Slow and fast rhythms generated in the cerebral cortex of the anesthetized mouse. J. Neurophysiol. 2011;106:2910–21. doi: 10.1152/jn.00440.2011. [DOI] [PubMed] [Google Scholar]
- Ryvlin P, Minotti L, Demarquay G, Hirsch E, Arzimanoglou A, Hoffman D, Guenot M, Picard F, Rheims S, Kahane P. Nocturnal hypermotor seizures, suggesting frontal lobe epilepsy, can originate in the insula. Epilepsia. 2006;47:755–65. doi: 10.1111/j.1528-1167.2006.00510.x. [DOI] [PubMed] [Google Scholar]
- Sanchez-Vives M V. Origin and dynamics of cortical slow oscillations. Curr. Opin. Physiol. 2020;15:217–23. doi: 10.1016/j.cophys.2020.04.005. [DOI] [Google Scholar]
- Sanchez-Vives M V, Massimini M, Mattia M. Shaping the default activity pattern of the cortical network. Neuron. 2017;94:993–1001. doi: 10.1016/j.neuron.2017.05.015. [DOI] [PubMed] [Google Scholar]
- Sanchez-Vives M V, Mattia M. Slow wave activity as the default mode of the cerebral cortex. Arch. Ital. Biol. 2014;152:147–55. doi: 10.12871/000298292014239. [DOI] [PubMed] [Google Scholar]
- Sancristóbal B, Rebollo B, Boada P, Sanchez-Vives M V, Garcia-Ojalvo J. Collective stochastic coherence in recurrent neuronal networks. Nat. Phys. 2016;12:881–7. doi: 10.1038/nphys3739. [DOI] [Google Scholar]
- Schalk G, Kubánek J, Miller K J, Anderson N R, Leuthardt E C, Ojemann J G, Limbrick D, Moran D, Gerhardt L A, Wolpaw J R. Decoding two-dimensional movement trajectories using electrocorticographic signals in humans. J. Neural Eng. 2007;4:264–75. doi: 10.1088/1741-2560/4/3/012. [DOI] [PubMed] [Google Scholar]
- Soplata A E, McCarthy M M, Sherfey J, Lee S, Purdon P L, Brown E N, Kopell N. Thalamocortical control of propofol phase-amplitude coupling. PLoS Comput. Biol. 2017;13:e1005879. doi: 10.1371/journal.pcbi.1005879. [DOI] [PMC free article] [PubMed] [Google Scholar]
- Stephen E P, Hotan G C, Pierce E T, Harrell P G, Walsh J L, Brown E N, Purdon P L. Broadband slow-wave modulation in posterior and anterior cortex tracks distinct states of propofol-induced unconsciousness. Sci. Rep. 2020;10:13701. doi: 10.1038/s41598-020-68756-y. [DOI] [PMC free article] [PubMed] [Google Scholar]
- Steriade M, Nunez A, Amzica F. A novel slow ( 1 Hz) oscillation of neocortical neurons in vivo: depolarizing and hyperpolarizing components. J. Neurosci. 1993;13:3252–65. doi: 10.1523/JNEUROSCI.13-08-03252.1993. [DOI] [PMC free article] [PubMed] [Google Scholar]
- Tort A B L, Komorowski R, Eichenbaum H, Kopell N. Measuring phase-amplitude coupling between neuronal oscillations of different frequencies. J. Neurophysiol. 2010;104:1195–210. doi: 10.1152/jn.00106.2010. [DOI] [PMC free article] [PubMed] [Google Scholar]
- Van Someren E, Van Der Werf Y, Roelfsema P, Mansvelder H, Lopes da Silva F. Slow brain oscillations of sleep, resting state and vigilance. Prog. Brain Res. 2011;193:3–15. doi: 10.1016/B978-0-444-53839-0.00001-6. [DOI] [PubMed] [Google Scholar]
- Volgushev M, Chauvette S, Mukovski M, Timofeev I. Precise long-range synchronization of activity and silence in neocortical neurons during slow-wave sleep. J. Neurosci. 2006;26:5665–72. doi: 10.1523/JNEUROSCI.0279-06.2006. [DOI] [PMC free article] [PubMed] [Google Scholar]
- Volgushev M, Chauvette S, Timofeev I. Long-range correlation of the membrane potential in neocortical neurons during slow oscillation. Prog. Brain Res. 2011;193:181–99. doi: 10.1016/B978-0-444-53839-0.00012-0. [DOI] [PMC free article] [PubMed] [Google Scholar]
- von Ellenrieder N, Peter-Derex L, Gotman J, Frauscher B. SleepSEEG: automatic sleep scoring using intracranial EEG recordings only. J. Neural Eng. 2022;19:026057. doi: 10.1088/1741-2552/ac6829. [DOI] [PubMed] [Google Scholar]
- Yanagawa T, Chao Z C, Hasegawa N, Fujii N. Large-scale information flow in conscious and unconscious states: an ECoG study in monkeys. PLoS One. 2013;8:e80845. doi: 10.1371/journal.pone.0080845. [DOI] [PMC free article] [PubMed] [Google Scholar]
Associated Data
This section collects any data citations, data availability statements, or supplementary materials included in this article.
Data Availability Statement
The data that support the findings of this study are openly available at the following URL: http://neurotycho.org/anesthesia-task.