

This prognostic study presents clinical validation of a novel 31-gene classifier that accurately predicts colorectal liver metastasis molecular subtypes as a secondary analysis of the large multicenter randomized clinical trial.
Key Points
Question
Are biologically derived molecular subtypes and integrated clinical-molecular risk stratification of colorectal liver metastases prognostic in an independent cohort from the phase 3 New EPOC randomized clinical trial?
Findings
Of 240 patients who underwent hepatic resection for limited colorectal liver metastases, the biological phenotype of each molecular subtype in the validation cohort was concordant with the discovery cohort. The immune subtype (best prognosis) demonstrated an improved 5-year progression-free survival and overall survival compared with the canonical subtype (worst prognosis), and the low-risk integrated group demonstrated 5-year progression-free survival of 44% and overall survival of 78%, which was superior to the high-risk group at 16% and 43%, respectively.
Meaning
Molecular subtypes of oligometastatic colorectal liver metastases and integrated risk stratification are prognostic and warrant further study as a possible predictive biomarker to personalize therapies.
Abstract
Importance
Personalized treatment approaches for patients with oligometastatic colorectal liver metastases are critically needed. We previously defined 3 biologically distinct molecular subtypes of colorectal liver metastases: (1) canonical, (2) immune, and (3) stromal.
Objective
To independently validate these molecular subtypes in the phase 3 New EPOC randomized clinical trial.
Design, Setting, and Participants
This retrospective secondary analysis of the phase 3 New EPOC randomized clinical trial included a bi-institutional discovery cohort and multi-institutional validation cohort. The discovery cohort comprised patients who underwent hepatic resection for limited colorectal liver metastases (98% received perioperative chemotherapy) from May 31, 1994, to August 14, 2012. The validation cohort comprised patients who underwent hepatic resection for liver metastases with perioperative chemotherapy (fluorouracil, oxaliplatin, and irinotecan based) with or without cetuximab from February 26, 2007, to November 1, 2012. Data were analyzed from January 18 to December 10, 2021.
Interventions
Resected metastases underwent RNA sequencing and microRNA (miRNA) profiling in the discovery cohort and messenger RNA and miRNA profiling with microarray in the validation cohort.
Main Outcomes and Measures
A 31-feature (24 messenger RNAs and 7 miRNAs) neural network classifier was trained to predict molecular subtypes in the discovery cohort and applied to the validation cohort. Integrated clinical-molecular risk groups were designated based on molecular subtypes and the clinical risk score. The unique biological phenotype of each molecular subtype was validated using gene set enrichment analyses and immune deconvolution. The primary clinical end points were progression-free survival (PFS) and overall survival (OS).
Results
A total of 240 patients were included (mean [range] age, 63.0 [56.3-68.0] years; 151 [63%] male), with 93 in the discovery cohort and 147 in the validation cohort. In the validation cohort, 73 (50%), 28 (19%), and 46 (31%) patients were classified as having canonical, immune, and stromal metastases, respectively. The biological phenotype of each subtype was concordant with the discovery cohort. The immune subtype (best prognosis) demonstrated 5-year PFS of 43% (95% CI, 25%-60%; hazard ratio [HR], 0.37; 95% CI, 0.20-0.68) and OS of 63% (95% CI, 40%-79%; HR, 0.38; 95% CI, 0.17-0.86), which was statistically significantly higher than the canonical subtype (worst prognosis) at 14% (95% CI, 7%-23%) and 43% (95% CI, 32%-55%), respectively. Adding molecular subtypes to the clinical risk score improved prediction (the Gönen and Heller K for discrimination) from 0.55 (95% CI, 0.49-0.61) to 0.62 (95% CI, 0.57-0.67) for PFS and 0.59 (95% CI, 0.52-0.66) to 0.63 (95% CI, 0.56-0.70) for OS. The low-risk integrated group demonstrated 5-year PFS of 44% (95% CI, 20%-66%; HR, 0.38; 95% CI, 0.19-0.76) and OS of 78% (95% CI, 44%-93%; HR, 0.26; 95% CI, 0.08-0.84), superior to the high-risk group at 16% (95% CI, 10%-24%) and 43% (95% CI, 32%-52%), respectively.
Conclusions and Relevance
In this prognostic study, biologically derived colorectal liver metastasis molecular subtypes and integrated clinical-molecular risk groups were highly prognostic. This novel molecular classification warrants further study as a possible predictive biomarker for personalized systemic treatment for colorectal liver metastases.
Trial Registration
isrctn.org Identifier: ISRCTN22944367
Introduction
Approximately 25% of patients with colorectal cancer eventually develop liver metastases, which are typically associated with poor survival.1 However, patients undergoing surgical resection of limited liver metastases (ie, oligometastases) demonstrate 5-year disease-free survival of 20% to 25% and overall survival (OS) of 30% to 40%.2,3,4,5 Oligometastatic colorectal cancer exhibits a wide spectrum of clinical behavior, and multiple randomized trials of adjuvant chemotherapy have failed to improve OS.6,7,8,9 Prognostic biomarkers are critically needed to improve risk stratification and facilitate personalized selection of perioperative systemic therapies.
In this context, various prognostic models encompassing clinicopathologic features have been developed.4,5,10,11 A limitation of clinical risk stratification is a failure to account for the underlying biological features that affect metastatic virulence and, ultimately, survival after surgical resection. We previously defined 3 robust, biologically distinct molecular subtypes of colorectal cancer liver metastasis based on messenger RNA (mRNA) and microRNA (miRNA) expression patterns.12 Metastases were classified as (1) canonical (associated with altered cell cycle signaling, increased cellular proliferation, and an immune-depleted microenvironment), (2) immune (exhibiting robust innate and adaptive immune infiltration), and (3) stromal (demonstrating increased epithelial-mesenchymal transition, angiogenesis, KRAS signaling, and inflammatory immune infiltration).
Although these subtypes were derived from their biological properties alone and not their association with clinical outcomes, molecular subtypes were independently prognostic, even when accounting for clinical risk stratification. Furthermore, integrated clinical-molecular risk groups predicted distinct clinical outcomes, with low-, intermediate-, and high-risk patients exhibiting 10-year OS of 94%, 45%, and 19%, respectively. Importantly, low-risk patients exhibited an oligometastatic pattern of failure and pace of progression with all instances of tumor recurrence being confined to only 1 to 3 additional liver metastases, in stark contrast with intermediate- and high-risk groups where recurrences were commonly more widespread and involving multiple organ sites. Validation of these molecular subtypes as prognostic biomarkers was required before advocating for their widespread use.
In this prognostic study, we present, to our knowledge, the first clinical validation of a novel 31-gene classifier that accurately predicts the colorectal liver metastasis molecular subtypes as a secondary analysis of the large multicenter phase 3 New EPOC randomized clinical trial.13,14 Importantly, we confirm the hypothesis that integrated clinical-molecular risk groups are highly prognostic for survival and confirm that a low-risk integrated subgroup achieves excellent OS after surgical resection.
Methods
Study Design and Participants
We trained a neural network molecular classifier in a retrospective discovery cohort consisting of 93 patients (Figure 1) treated at The University of Chicago Medical Center (Chicago, Illinois) and NorthShore University HealthSystem Evanston Hospital (Evanston, Illinois) from May 31, 1994, to August 14, 2012. Patients with colorectal adenocarcinoma underwent hepatic resection for limited liver metastases that presented either synchronously or metachronously (typically 1-5 lesions involving 1 or both lobes); 98% of patients received perioperative fluorouracil and platinum-based chemotherapy.
Figure 1. Discovery and Validation Cohorts.

Flowchart demonstrating patients included in analyses, including the retrospective discovery cohort and phase 3 New EPOC randomized clinical trial validation cohort. miRNA indicates microRNA; S:CORT, Stratification in Colorectal Cancer Consortium.
An independent validation cohort consisted of 147 patients (Figure 1) enrolled in the multicenter phase 3 New EPOC randomized clinical trial who underwent molecular profiling of colorectal liver metastases (study protocol previously published13,14 and in Supplement 1). Patients with operable colorectal cancer liver metastases (including those deemed suboptimally resectable or at high risk of positive resection margins) underwent hepatic resection with perioperative chemotherapy (fluorouracil, oxaliplatin, and irinotecan based) with or without cetuximab from February 26, 2007, to November 1, 2012 (median follow-up was 53.4 months). Patients were excluded if they were ineligible for chemotherapy or had extrahepatic distant metastases. Thus, both cohorts were similar, representing patients undergoing surgery with perioperative systemic therapy for limited colorectal cancer liver metastases.
The New EPOC trial was approved by the South West Research Ethics Committee, and data collection was approved by institutional review boards at each respective cancer center. Patient informed consent was collected as part of the New EPOC trial. Study results are reported following Reporting Recommendations for Tumor Marker Prognostic Studies (REMARK) guidelines.15
Specimen Processing and Development of Molecular Subtype Classifier
Specimen processing, training, and application of the neural network classifier for colorectal liver metastasis molecular subtypes are outlined in detail in the eMethods in Supplement 2. For the discovery cohort, formalin-fixed paraffin-embedded specimens from hepatic resections underwent whole transcriptome RNA sequencing and miRNA profiling.12 For the validation cohort, archival liver metastasis and primary tumor formalin-fixed paraffin-embedded blocks at the time of resection from the New EPOC trial underwent mRNA and miRNA profiling with microarray.13,14
In the discovery cohort, a machine learning neural network classifier was trained to classify colorectal liver metastases into 1 of 3 molecular subtypes (canonical, immune, and stromal) using mRNA and miRNA expression data (eFigure 1 in Supplement 2). In this cohort, we previously defined molecular subtypes using the similarity network fusion clustering algorithm, and these served as the reference standard for training the neural network classifier.12 Importantly, although molecular subtypes were ultimately associated with survival in the discovery set, the original similarity network fusion algorithm clustered tumors based only on molecular features and not survival outcomes. The final classifier contained 31 features (24 mRNAs and 7 miRNAs). For each patient in the validation cohort, the neural network classifier was applied to predict the molecular subtype of the corresponding liver metastasis.
Molecular subtypes of the liver metastases were used for the primary statistical analyses. To investigate if the signature’s prognostic performance was specific to application to liver metastases only, the subtypes were also predicted for matched primary tumors. Consensus molecular subtypes (CMSs) of both metastases and primary tumors were also determined to compare their prognostic performance with this study’s liver metastasis subtypes.16
Outcomes
Unlike the discovery cohort, no gold standard reference existed against which to compare the computed subtypes in the validation cohort. To confirm that the neural network classifier accurately captured the expected biological phenotype of the computed molecular subtypes within the validation cohort, single-sample gene set enrichment analysis (ssGSEA) and immune deconvolution were performed using gene expression data for each liver metastasis (eMethods in Supplement 2).17,18
All patients were annotated with baseline demographic, clinical, and pathologic information from which the clinical risk score (CRS) was computed (eMethods in Supplement 2).4 As previously defined, an integrated clinical-molecular risk group was designated for each patient, combining the computed molecular subtype with high (≥2) or low (<2) CRS.12 Low-risk patients were defined as exhibiting an immune or canonical subtype with low CRS. Intermediate-risk patients were defined as demonstrating an immune subtype with high CRS or stromal subtype with low CRS. High-risk patients were defined as having a canonical or stromal subtype with high CRS.
The primary clinical end points of this study were progression-free survival (PFS) and OS in the validation cohort. Progression-free survival was defined as time to recurrence, progression, or death (whichever occurred first), and OS was defined as time to death. Time-to-event outcomes were measured from date of surgery in the discovery cohort and date of randomization on trial in the validation cohort.
Statistical Analysis
We hypothesized that the immune subtype would exhibit the best PFS and OS (compared with the canonical and stromal subtypes) and that integrated clinical-molecular risk stratification would be associated with both PFS and OS in the validation cohort, based on previously published analysis of the discovery cohort.12 Patients were excluded if they did not undergo surgery or did not undergo molecular profiling of their liver metastases. Patients were excluded in the integrated risk group analysis if CRS could not be computed due to unavailable data (n = 3). Progression-free survival and OS were analyzed using the Kaplan-Meier method and log-rank tests. Multivariable Cox proportional hazards models for PFS and OS were generated in the validation cohort. In multivariable models of the molecular subtypes, CRS and randomization to cetuximab were included as covariates. In multivariable models of the integrated risk groups, randomization to cetuximab was included as a covariate. In sensitivity analyses, the multivariable models were extended to also include age, tumor differentiation, resection margin status, World Health Organization performance status, KRAS and BRAF alteration status, and primary tumor location. The CRS was analyzed as a categorical variable when included as a covariate. Model discrimination was evaluated by the Gönen and Heller K concordance statistic. Statistical analyses were performed using Stata/IC, version 16.1 (StataCorp).
Statistical analysis for ssGSEA enrichment scores and immune deconvolution features consisted of t tests for pairwise comparison between subtypes. To correct for multiple comparisons, P values were adjusted by controlling the false discovery rate (<.05). A 2-sided P < .05 was considered statistically significant.
Results
Cohort Characteristics
Patient characteristics are summarized in Table 1. Overall, both the discovery (n = 93) and validation (n = 147) cohorts were representative of patients who underwent hepatic resection for limited colorectal liver metastases in the setting of perioperative chemotherapy. The prevalence of KRAS and BRAF alterations and microsatellite instability are reported in the eMethods in Supplement 2.
Table 1. Baseline Patient Characteristics.
| Characteristic | No. (%) | ||
|---|---|---|---|
| Total (N = 240) | Discovery cohort (n = 93) | Validation cohort (n = 147) | |
| Age, mean (range), y | 63.0 (56.3-68.0) | 60.8 (52.3-65.6) | 64.0 (59.0-69.0) |
| Sex | |||
| Female | 89 (37) | 39 (42) | 50 (34) |
| Male | 151 (63) | 54 (58) | 97 (66) |
| Clinical risk score | |||
| <2 | 53 (23) | 32 (37) | 21 (15) |
| ≥2 | 178 (77) | 55 (63) | 123 (85) |
| Incomplete | 9 | 6 | 3 |
| >1 Liver metastasis | 151 (64) | 39 (42) | 112 (78) |
| Node-positive primary | 151 (67) | 55 (64) | 96 (69) |
| Preoperative CEA >200 ng/mL | 12 (6) | 3 (4) | 9 (6) |
| Disease-free interval <12 mo | 157 (65) | 51 (55) | 106 (72) |
| Metastasis size >5 cm | 61 (25) | 23 (25) | 38 (26) |
| Shortest margin between cancer and cut surface | |||
| ≥1 cm | 76 (34) | 24 (28) | 52 (38) |
| <1 cm | 120 (54) | 48 (56) | 72 (53) |
| No margin (cancer visible on cut surface) | 27 (12) | 14 (16) | 13 (9) |
| Not availablea | 17 | 7 | 10 |
Abbreviation: CEA, carcinoembryonic antigen.
Margin distance between cancer and cut surface was designated as not available if considered not evaluable (eg, due to ablation being performed as part of hepatic resection).
Classification of Molecular Subtypes
Training of the neural network classifier for liver metastasis molecular subtypes is detailed in eFigure 1 in Supplement 2. A 31-feature signature consisting of 24 mRNAs and 7 miRNAs resulted in optimal model performance with an average accuracy of 96% across cross-validation testing sets (eFigures 2 and 3 and eTable 1 in Supplement 2 and neural network coefficient matrices in Supplement 3). Molecular subtypes were predicted, and integrated clinical-molecular risk groups were determined in the validation cohort (eFigure 4 in Supplement 2). Across molecular subtypes, there were no differences in several clinicopathologic features, including the risk factors comprising the CRS, tumor and nodal staging, tumor differentiation, age, or sex (eFigure 5 in Supplement 2). Progression-free survival and OS were highly concordant between the discovery and validation cohorts (eFigure 6 in Supplement 2) by total cohort, molecular subtype, or integrated clinical-molecular risk group.
Biological Phenotypes in the Validation Cohort
To corroborate the phenotype of each molecular subtype in the validation cohort, an ssGSEA analysis was performed (Figure 2A and eFigure 7A in Supplement 2). Consistent with previous findings, the canonical subtype exhibited increased enrichment scores corresponding to DNA repair pathways, cell cycle regulation/proliferation (including E2F, G2M, and mitotic spindle pathways), and MYC signaling. The stromal subtype demonstrated enrichment for epithelial-mesenchymal transition, angiogenesis, inflammatory response, and KRAS signaling. In addition, the immune subtype exhibited lower enrichment scores for KRAS signaling, angiogenesis, cell proliferation, and transforming growth factor β signaling pathways.
Figure 2. Gene Set Enrichment Analysis and Immune Deconvolution in the Validation Cohort.

Heat map representing enrichment and depletion of multiple gene sets and immune compartments. Single-sample gene set enrichment analysis (A) and immune deconvolution (B) are shown across molecular subtypes. Statistical analysis of enrichment scores and immune deconvolution consisted of t tests for pairwise comparison between subtypes, with P values adjusted by controlling the false discovery rate (<.05) to account for multiple comparisons. If a row is annotated with a single subtype label (canonical [C], immune [I], or stromal [S]), that molecular subtype was enriched for the corresponding pathway with adjusted P < .05 (compared with each of the other subtypes). If a row is annotated with 2 subtype labels, both subtypes were enriched with adjusted P < .05 compared with the other subtype. An additional detailed view is presented in eFigure 7 in Supplement 2. IFN indicates interferon; TGF-β, transforming growth factor β; TNF, tumor necrosis factor.
Immune deconvolution analysis was performed in the validation cohort to evaluate the abundance of specific immune cells by molecular subtype (Figure 2B and eFigure 7B in Supplement 2). The majority of immune cells were decreased in the canonical subtype, whereas the immune subtype demonstrated enrichment for B cells, NK cells, CD8 T cells, and cytotoxic lymphocytes. By contrast, the stromal subtype exhibited depletion of B lymphocytes and NK cells and enrichment for fibroblast, monocytes, and myeloid dendritic cells in the context of CD8 T cells and cytotoxic lymphocytes. Although the presence of CD8 T and cytotoxic lymphocytes were similar between the immune and stromal subtypes, histological evaluation of the discovery cohort previously demonstrated that the spatial distribution of T cells in the tumor microenvironment was distinct.12 Immune metastases displayed dense bandlike peritumoral and intratumoral infiltration of CD8 T lymphocytes, whereas stromal metastases exhibited considerable fibrosis resulting in peritumorally restricted T-lymphocytic infiltrate, which is consistent with increased fibroblasts in the stromal subtype. Collectively, these findings corroborated the distinct underlying biological phenotypes associated with each subtype.
Clinical Outcomes in the Validation Cohort
Progression-free survival and OS were analyzed in the validation cohort by molecular subtype of the liver metastasis and integrated clinical-molecular risk group to validate both as prognostic biomarkers. The immune subtype demonstrated superior PFS and OS to canonical and stromal subtypes, consistent with previous findings12 (Figure 3A). The 5-year PFS was 43% (95% CI, 25%-60%), 14% (95% CI, 7%-23%), and 26% (95% CI, 14%-39%) for immune, canonical, and stromal subtypes, respectively. Differences in PFS were statistically significant across subtypes (log-rank P = .004; Figure 3A). Similarly, the 5-year OS was 63% (95% CI, 40%-79%), 43% (95% CI, 32%-55%), and 49% (95% CI, 34%-63%) for immune, canonical, and stromal subtypes, respectively (log-rank P = .08; Figure 3B). By pairwise comparison, this resulted in a statistically significant difference in OS between immune vs canonical/stromal subtypes (log-rank P = .045; Figure 3B).
Figure 3. Progression-Free Survival (PFS) and Overall Survival (OS) by Molecular Subtype and Integrated Risk Stratification in the Validation Cohort.
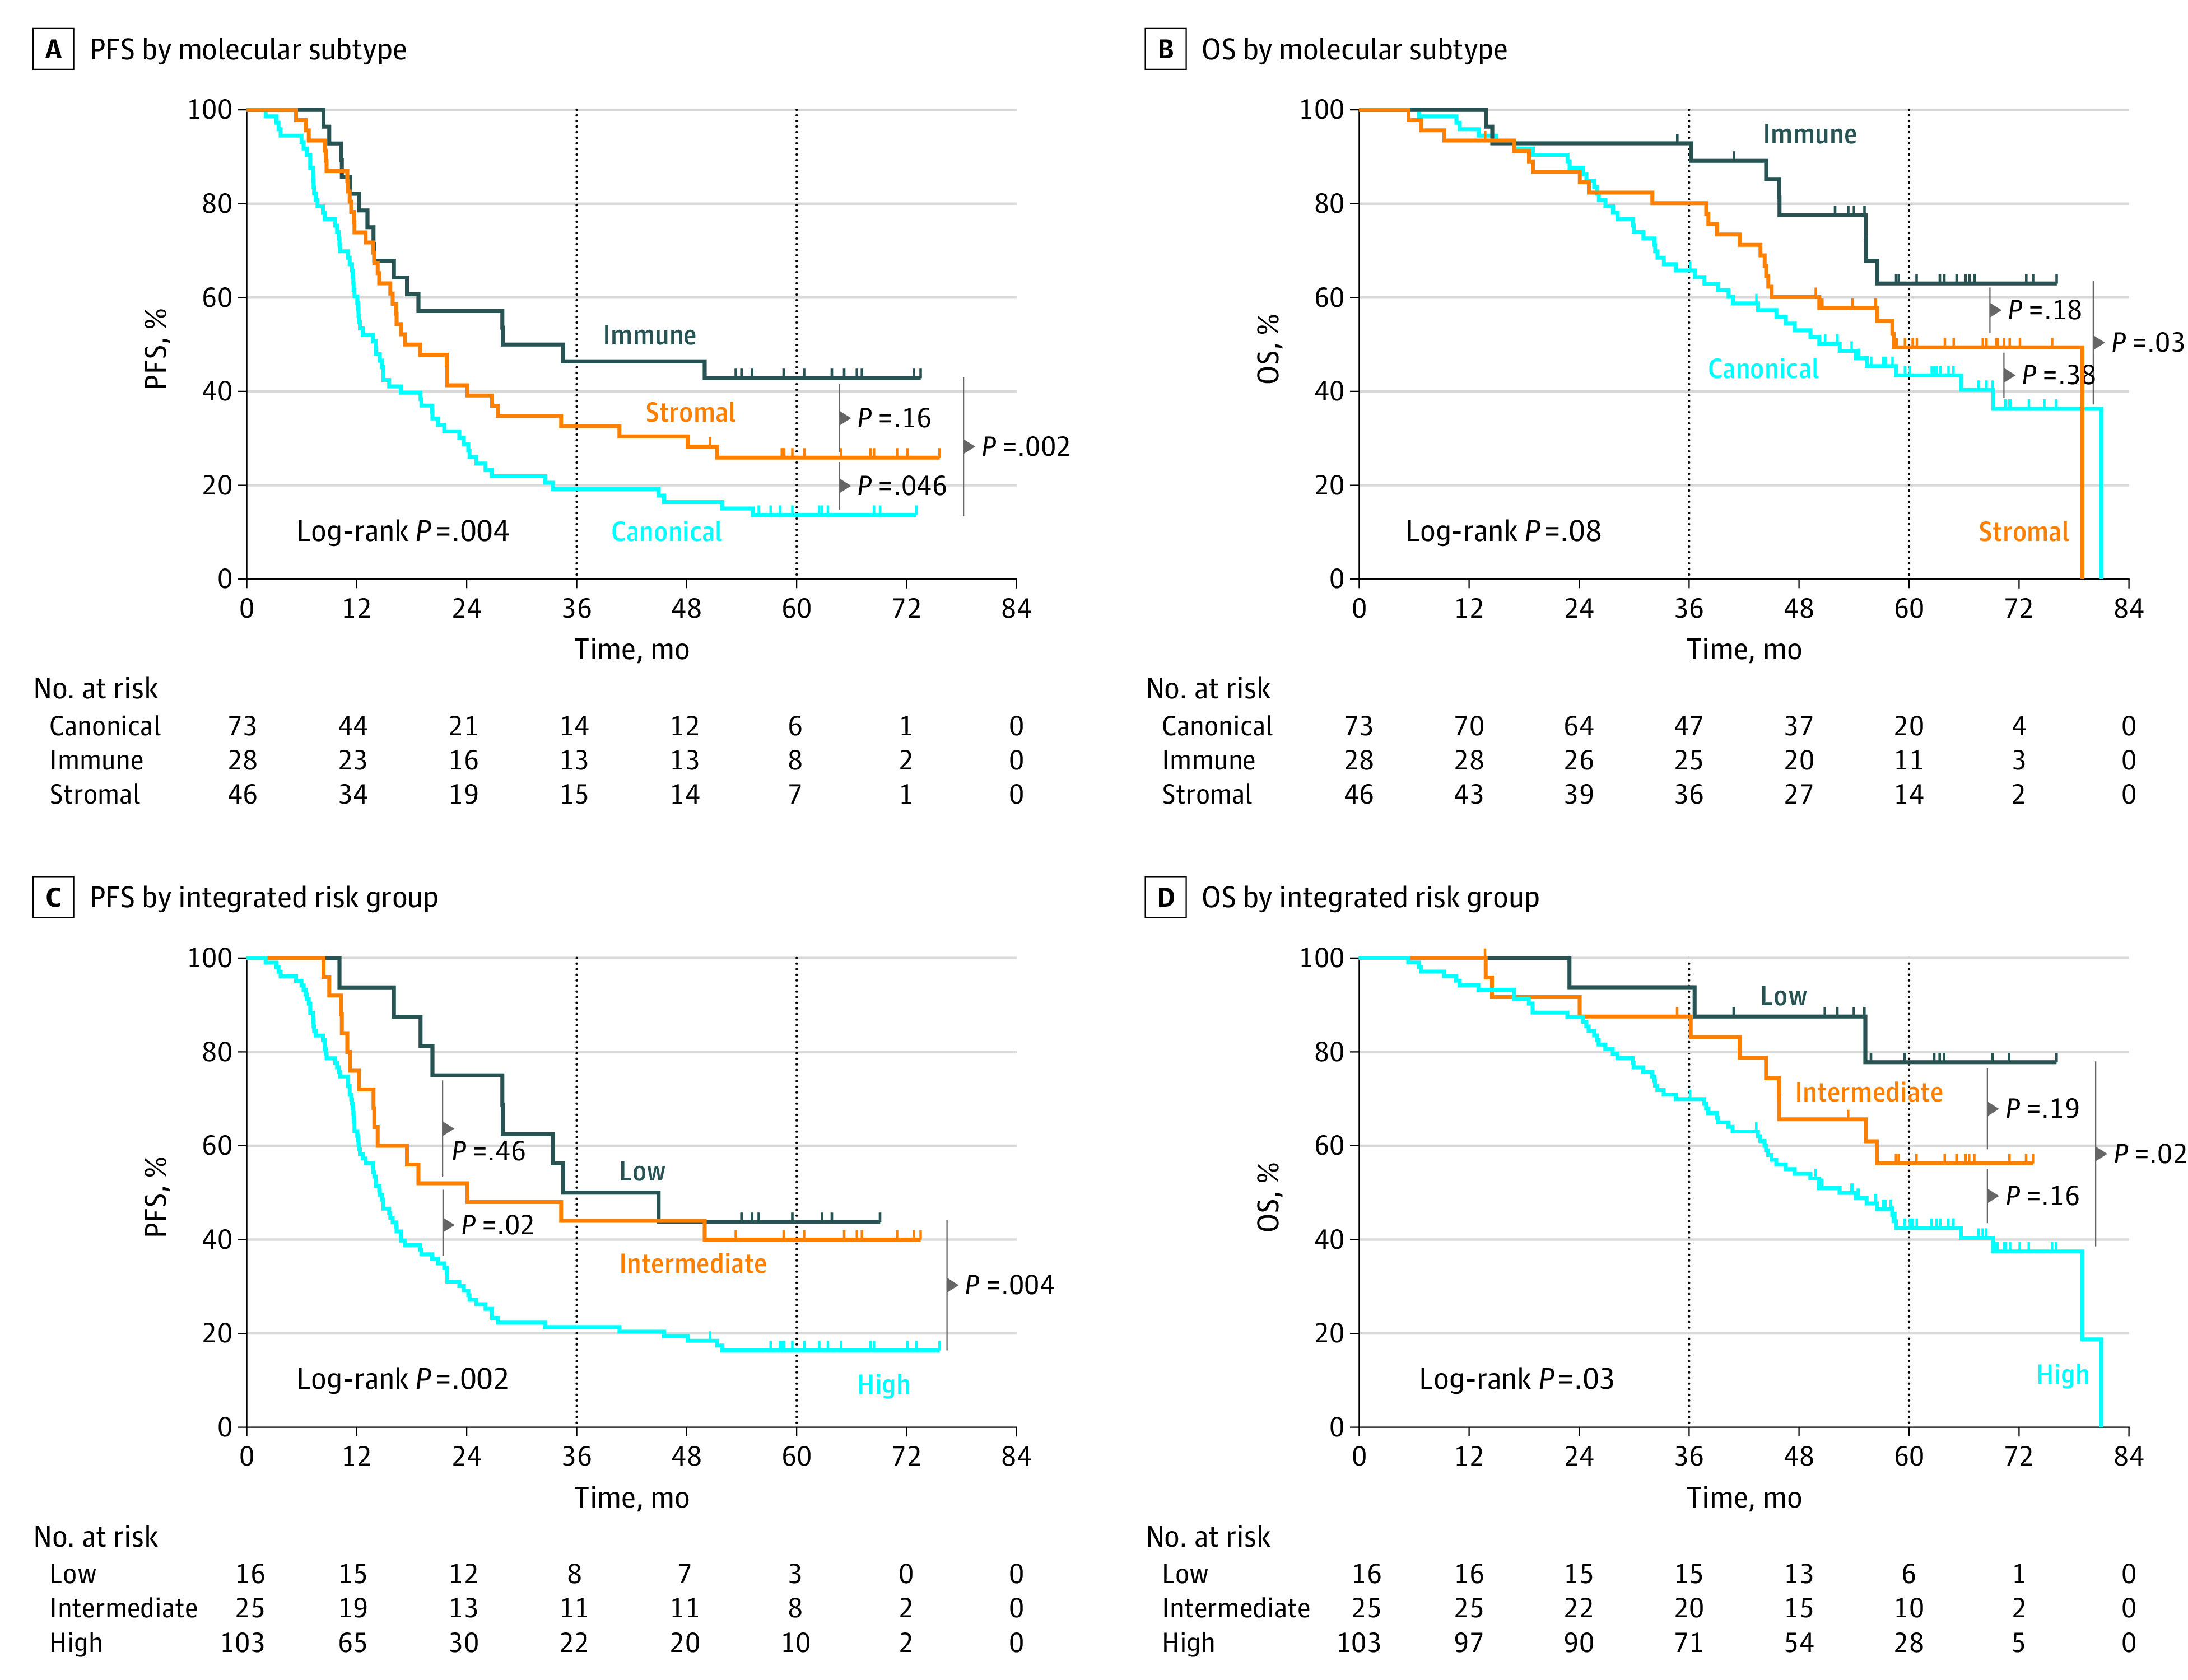
The x-axes represent time in months after randomization in the New EPOC randomized clinical trial. Of 147 total patients, PFS events occurred in 113, 16, 63, and 34 patients in the overall cohort and immune, canonical, and stromal subtypes, respectively, and OS events occurred in 75, 9, 43, and 23 patients, respectively. By integrated clinical-molecular risk group (n = 144), PFS events occurred in 9, 15, and 86 patients in the low-, intermediate-, and high-risk groups, respectively, and OS events occurred in 3, 10, and 61 patients, respectively.
When applied to primary tumor expression data (n = 124), there was no association between predicted molecular subtypes in primary tumors and PFS or OS (eFigure 8 in Supplement 2). Similarly, neither the CMS subtype of the primary tumor nor CMS subtype of the matched liver metastasis were associated with PFS and OS (eTable 2 and eFigure 9 in Supplement 2). Thus, liver metastasis molecular subtypes were only prognostic when applied to the metastatic tumor.
By integrated clinical-molecular risk group, 5-year PFS was 44% (95% CI, 20%-66%), 40% (95% CI, 21%-58%), and 16% (95% CI, 10%-24%) for the low-, intermediate-, and high-risk groups, respectively (log-rank P = .002; Figure 3C). The superior PFS of patients in the low-risk group also translated to improved OS. The 5-year OS was 78% (95% CI, 44%-93%), 56% (95% CI, 34%-74%), and 43% (95% CI, 32%-52%) for the low-, intermediate-, and high-risk groups, respectively (Figure 3D).
Multivariable Cox models were computed in the validation cohort (Table 2), which also included randomization to cetuximab since cetuximab was associated with decreased survival in the New EPOC trial. The addition of molecular subtypes to the CRS provided further prognostic value for PFS, increasing the Gönen and Heller K concordance statistic from 0.55 (95% CI, 0.49-0.61) to 0.62 (95% CI, 0.57-0.67). For PFS, the immune subtype demonstrated a hazard ratio (HR) of 0.37 (95% CI, 0.20-0.68; P = .001), and the stromal subtype demonstrated an HR of 0.56 (95% CI, 0.36-0.89; P = .01) compared with canonical when controlling for the CRS. For OS, the addition of molecular subtypes to the CRS similarly improved model performance, increasing the Gönen and Heller K from 0.59 (95% CI, 0.52-0.66) to 0.63 (95% CI, 0.56-0.70). The immune subtype exhibited an HR of 0.38 (95% CI, 0.17-0.86; P = .02). Thus, the immune subtype demonstrated greater PFS and OS.
Table 2. Multivariable Cox Models for Progression-Free Survival (PFS) and Overall Survival (OS) in the Validation Cohort.
| Variable | Primary Cox models | Cox models including cetuximab randomization | ||
|---|---|---|---|---|
| Hazard ratio (95% CI) | P value | Hazard ratio (95% CI) | P value | |
| PFS by molecular subtype | ||||
| Molecular subtype | ||||
| Canonical | 1 [Reference] | NA | 1 [Reference] | NA |
| Immune | 0.4 (0.2-0.7) | .001 | 0.4 (0.2-0.7) | .001 |
| Stromal | 0.6 (0.4-0.9) | .01 | 0.6 (0.4-0.9) | .01 |
| Clinical risk score | ||||
| 1 | 1 [Reference] | NA | 1 [Reference] | NA |
| 2 | 1.7 (0.9-3.3) | .09 | 1.8 (0.9-3.4) | .09 |
| 3 | 2.0 (1.0-3.7) | .04 | 2.0 (1.1-3.7) | .04 |
| 4 | 2.0 (0.9-4.6) | .10 | 2.0 (0.8-4.6) | .12 |
| 5 | 1.2 (0.2-9.4) | .86 | 1.1 (0.2-9.2) | .88 |
| Cetuximab | ||||
| No | NA | NA | 1 [Reference] | NA |
| Yes | NA | NA | 1.1 (0.7-1.6) | .72 |
| OS by molecular subtype | ||||
| Molecular subtype | ||||
| Canonical | 1 [Reference] | NA | 1 [Reference] | NA |
| Immune | 0.4 (0.2-0.9) | .02 | 0.4 (0.2-0.8) | .01 |
| Stromal | 0.7 (0.4-1.2) | .14 | 0.6 (0.3-1.0) | .06 |
| Clinical risk score | ||||
| 1 | 1 [Reference] | NA | 1 [Reference] | NA |
| 2 | 1.7 (0.6-4.5) | .32 | 1.8 (0.7-5.0) | .23 |
| 3 | 2.7 (1.0-6.9) | .04 | 3.3 (1.2-8.5) | .02 |
| 4 | 2.7 (0.9-8.2) | .09 | 2.6 (0.8-7.9) | .10 |
| 5 | 2.2 (0.3-18.8) | .49 | 1.8 (0.2-15.5) | .61 |
| Cetuximab | ||||
| No | NA | NA | 1 [Reference] | NA |
| Yes | NA | NA | 2.0 (1.2-3.4) | .008 |
| PFS by integrated risk | ||||
| Integrated risk | ||||
| Low | 0.4 (0.2-0.8) | .006 | 0.4 (0.2-0.8) | .006 |
| Intermediate | 0.5 (0.3-0.9) | .02 | 0.5 (0.3-0.9) | .02 |
| High | 1 [Reference] | NA | 1 [Reference] | NA |
| Cetuximab | ||||
| No | NA | NA | 1 [Reference] | NA |
| Yes | NA | NA | 1.0 (0.7-1.5) | .94 |
| OS by integrated risk | ||||
| Integrated risk | ||||
| Low | 0.3 (0.1-0.8) | .02 | 0.3 (0.1-0.8) | .02 |
| Intermediate | 0.6 (0.3-1.2) | .16 | 0.6 (0.3-1.3) | .20 |
| High | 1 [Reference] | NA | 1 [Reference] | NA |
| Cetuximab | ||||
| No | NA | NA | 1 [Reference] | NA |
| Yes | NA | NA | 1.6 (1.0-2.5) | .06 |
Abbreviation: NA, not applicable.
Furthermore, the integrated clinical-molecular risk score remained associated with both PFS and OS. Relative to the high-risk group, the HR for the low-risk integrated group was 0.38 (95% CI, 0.19-0.76; P = .006) for PFS and 0.26 (95% CI, 0.08-0.84; P = .02) for OS. Randomization to cetuximab did not notably influence the prognostic effect size of the molecular subtypes or integrated risk groups. There were no statistically significant interaction effects between molecular subtype and CRS, molecular subtype and cetuximab, and integrated risk group and cetuximab. Finally, the prognostic effect of the integrated clinical-molecular risk grouping and molecular subtypes persisted in sensitivity analyses that included randomization to cetuximab, age, tumor differentiation, margin status, World Health Organization performance status, KRAS and BRAF alteration statuses, and primary tumor location in the model (eTable 3 in Supplement 2). For PFS, the addition of integrated risk grouping to the aforementioned variables increased the Gönen and Heller K from 0.61 (95% CI, 0.56-0.66) to 0.65 (95% CI, 0.60-0.70). For OS, the addition of integrated risk grouping increased the Gönen and Heller K from 0.66 (95% CI, 0.61-0.71) to 0.69 (95% CI, 0.63-0.75). In summary, integrated clinical-molecular risk stratification was highly prognostic in this independent validation cohort, defining a low-risk subgroup with an OS of 78% (95% CI, 44%-93%) at 5 years.
Discussion
We developed a novel classification of colorectal cancer liver metastases that was biologically derived and not empirically developed based on association with clinical outcome. We validated its prognostic significance in the multicenter phase 3 New EPOC randomized clinical trial. As previously published for the discovery cohort,12 molecular subtypes independently add to clinical risk stratification for oncologic outcomes after hepatic resection, and an integrated clinical-molecular risk grouping remains highly prognostic for survival.
These findings may improve the management of oligometastatic colorectal liver metastases in several aspects. First, this study presents a novel molecular classification system in a context where prognostic biomarkers are generally lacking and rarely integrated with well-established clinical risk stratification. Although CMS exists for primary tumors, their prognostic use is limited in liver metastases, where one-third of tumors are unclassifiable.12 Thus, it is crucial to molecularly stage the metastasis separately from the primary tumor. While other prognostic features include histopathological growth patterns and the Immunoscore, risk stratification based on gene expression is sparse.19,20,21,22 Balachandran et al reported a multigene molecular risk score for colorectal liver metastases that was prognostic and validated in a retrospective European cohort.23 By contrast, the molecular subtypes in this study were not derived empirically based on their association with survival, but instead defined by their underlying biological phenotype. For PFS and OS, the improvement in model discrimination with the addition of molecular subtyping to the CRS is comparable with other prognostic molecular biomarkers.24,25,26 The validation of an integrated clinical-molecular risk stratification of liver metastases potentially defines a novel framework to stage metastatic disease using both clinical and molecular features.
Second, we propose that these molecular subtypes and integrated risk stratification warrant further study as possible predictive biomarkers. While adjuvant chemotherapy is commonly administered after surgery for liver metastases, multiple randomized trials have failed to demonstrate improvements in OS, and predictive biomarkers are needed to optimally personalize systemic therapies after aggressive local therapies.2,6,7,8,9,27,28 This novel classification identifies patients with the greatest risk of relapse and, thus, may help select patients for perioperative systemic therapy. Moreover, because these molecular subtypes are characterized by distinct biological phenotypes, they uniquely present a potential opportunity to personalize the classes of therapies used. In this context, we demonstrated that the CIN70 gene expression signature predicts response to DNA-damaging chemotherapy in colorectal liver oligometastases.29 Thus, particular classes of adjuvant systemic therapies (including cytotoxic chemotherapy, immunotherapy, anti-angiogenesis agents, or other targeted therapies) may demonstrate differential benefit in specific molecular subtypes or integrated risk groups, justifying further investigation in future biomarker-driven trials or inclusion as stratification factors. Similarly, the molecular subtypes in this study may complement liquid biomarkers. While circulating tumor DNA helps identify patients with minimal residual disease, colorectal liver metastases exhibit a wide spectrum of metastatic behavior that is partially elucidated by molecular classification.30
Limitations
Limitations of this study include that this classifier was developed in patients undergoing surgery only. Future study would extend investigation to other local therapies, including radiation therapy and ablation.31,32 In addition, the magnitude of the concordance probability estimates in this study highlight the considerable clinical heterogeneity of colorectal liver oligometastases. Subsequent studies in larger cohorts of patients may further clarify the role of molecular subtyping in this context.
Conclusions
In this prognostic study, colorectal liver metastasis molecular subtypes were associated with differential PFS and OS in an independent cohort from the phase 3 New EPOC randomized clinical trial. When combined with the CRS, integrated risk stratification was associated with long-term survival after resection for limited colorectal liver metastases. This study illustrates how integrated clinical and molecular risk stratification characterize the diverse phenotypic spectrum of clinical metastases. It may serve as a framework that is broadly applicable to many human cancers for the development of biomarkers that influence the use of local and systemic therapies in metastatic disease.
Trial Protocol
eMethods
eFigure 1. Diagram representing training and application of neural network classifier to predict molecular subtypes
eFigure 2. Optimization of model performance (measured by the F score) as features are eliminated using recursive feature elimination
eTable 1. List of mRNAs and miRNAs included in the neural network classifier to predict molecular subtypes
eFigure 3. Histogram representing the robustness and internal consistency of the molecular subtype classifier for liver metastases in the validation cohort
eFigure 4. Distribution of molecular subtypes and integrated clinical-molecular risk groups in the discovery and validation cohorts
eFigure 5. Distribution of clinical and pathologic features across molecular subtypes in the validation cohort
eFigure 6. PFS and OS by cohort, subtype, and risk group
eFigure 7. Box and whisker plots for detailed visualization
eFigure 8. Survival outcomes in validation cohort by predicted molecular subtype of primary tumor
eTable 2. Association of consensus molecular subtype of the primary tumor with molecular subtype of the liver metastasis in the validation cohort
eFigure 9. Survival outcomes in the validation cohort based on consensus molecular subtypes of either the primary tumor or liver metastasis
eTable 3. Sensitivity analysis demonstrating Cox proportional hazards model for PFS and OS in validation cohort
eReferences
eTable 4. Theta1 Matrices
eTable 5. Theta2 Matrices
Nonauthor Collaborators. The S:CORT Consortium nonauthor collaborators
Data Sharing Supplement
References
- 1.Leporrier J, Maurel J, Chiche L, Bara S, Segol P, Launoy G. A population-based study of the incidence, management and prognosis of hepatic metastases from colorectal cancer. Br J Surg. 2006;93(4):465-474. doi: 10.1002/bjs.5278 [DOI] [PubMed] [Google Scholar]
- 2.Hughes K, Simon R; Registry of Hepatic Metastases . Resection of the liver for colorectal carcinoma metastases: a multi-institutional study of indications for resection. Surgery. 1988;103(3):278-288. [PMC free article] [PubMed] [Google Scholar]
- 3.Kanas GP, Taylor A, Primrose JN, et al. Survival after liver resection in metastatic colorectal cancer: review and meta-analysis of prognostic factors. Clin Epidemiol. 2012;4:283-301. [DOI] [PMC free article] [PubMed] [Google Scholar]
- 4.Fong Y, Fortner J, Sun RL, Brennan MF, Blumgart LH. Clinical score for predicting recurrence after hepatic resection for metastatic colorectal cancer: analysis of 1001 consecutive cases. Ann Surg. 1999;230(3):309-318. doi: 10.1097/00000658-199909000-00004 [DOI] [PMC free article] [PubMed] [Google Scholar]
- 5.Rees M, Tekkis PP, Welsh FKS, O’Rourke T, John TG. Evaluation of long-term survival after hepatic resection for metastatic colorectal cancer: a multifactorial model of 929 patients. Ann Surg. 2008;247(1):125-135. doi: 10.1097/SLA.0b013e31815aa2c2 [DOI] [PubMed] [Google Scholar]
- 6.Nordlinger B, Sorbye H, Glimelius B, et al. ; EORTC Gastro-Intestinal Tract Cancer Group; Cancer Research UK; Arbeitsgruppe Lebermetastasen und-tumoren in der Chirurgischen Arbeitsgemeinschaft Onkologie (ALM-CAO); Australasian Gastro-Intestinal Trials Group (AGITG); Fédération Francophone de Cancérologie Digestive (FFCD) . Perioperative chemotherapy with FOLFOX4 and surgery versus surgery alone for resectable liver metastases from colorectal cancer (EORTC Intergroup trial 40983): a randomised controlled trial. Lancet. 2008;371(9617):1007-1016. doi: 10.1016/S0140-6736(08)60455-9 [DOI] [PMC free article] [PubMed] [Google Scholar]
- 7.Nordlinger B, Sorbye H, Glimelius B, et al. ; EORTC Gastro-Intestinal Tract Cancer Group; Cancer Research UK; Arbeitsgruppe Lebermetastasen und–tumoren in der Chirurgischen Arbeitsgemeinschaft Onkologie (ALM-CAO); Australasian Gastro-Intestinal Trials Group (AGITG); Fédération Francophone de Cancérologie Digestive (FFCD) . Perioperative FOLFOX4 chemotherapy and surgery versus surgery alone for resectable liver metastases from colorectal cancer (EORTC 40983): long-term results of a randomised, controlled, phase 3 trial. Lancet Oncol. 2013;14(12):1208-1215. doi: 10.1016/S1470-2045(13)70447-9 [DOI] [PubMed] [Google Scholar]
- 8.Kanemitsu Y, Shimizu Y, Mizusawa J, et al. ; JCOG Colorectal Cancer Study Group . Hepatectomy followed by mFOLFOX6 versus hepatectomy alone for liver-only metastatic colorectal cancer (JCOG0603): a phase II or III randomized controlled trial. J Clin Oncol. 2021;39(34):3789-3799. doi: 10.1200/JCO.21.01032 [DOI] [PubMed] [Google Scholar]
- 9.Booth CM, Berry SR. Perioperative chemotherapy for resectable liver metastases in colorectal cancer: do we have a blind spot? J Clin Oncol. 2021;39(34):3767-3769. doi: 10.1200/JCO.21.01972 [DOI] [PubMed] [Google Scholar]
- 10.Nordlinger B, Guiguet M, Vaillant JC, et al. ; Association Française de Chirurgie . Surgical resection of colorectal carcinoma metastases to the liver: a prognostic scoring system to improve case selection, based on 1568 patients. Cancer. 1996;77(7):1254-1262. doi: [DOI] [PubMed] [Google Scholar]
- 11.Iwatsuki S, Dvorchik I, Madariaga JR, et al. Hepatic resection for metastatic colorectal adenocarcinoma: a proposal of a prognostic scoring system. J Am Coll Surg. 1999;189(3):291-299. doi: 10.1016/S1072-7515(99)00089-7 [DOI] [PMC free article] [PubMed] [Google Scholar]
- 12.Pitroda SP, Khodarev NN, Huang L, et al. Integrated molecular subtyping defines a curable oligometastatic state in colorectal liver metastasis. Nat Commun. 2018;9(1):1793. doi: 10.1038/s41467-018-04278-6 [DOI] [PMC free article] [PubMed] [Google Scholar]
- 13.Primrose J, Falk S, Finch-Jones M, et al. Systemic chemotherapy with or without cetuximab in patients with resectable colorectal liver metastasis: the New EPOC randomised controlled trial. Lancet Oncol. 2014;15(6):601-611. doi: 10.1016/S1470-2045(14)70105-6 [DOI] [PubMed] [Google Scholar]
- 14.Bridgewater JA, Pugh SA, Maishman T, et al. ; New EPOC investigators . Systemic chemotherapy with or without cetuximab in patients with resectable colorectal liver metastasis (New EPOC): long-term results of a multicentre, randomised, controlled, phase 3 trial. Lancet Oncol. 2020;21(3):398-411. doi: 10.1016/S1470-2045(19)30798-3 [DOI] [PMC free article] [PubMed] [Google Scholar]
- 15.McShane LM, Altman DG, Sauerbrei W, Taube SE, Gion M, Clark GM; Statistics Subcommittee of the NCI-EORTC Working Group on Cancer Diagnostics . REporting recommendations for tumour MARKer prognostic studies (REMARK). Br J Cancer. 2005;93(4):387-391. doi: 10.1038/sj.bjc.6602678 [DOI] [PMC free article] [PubMed] [Google Scholar]
- 16.Guinney J, Dienstmann R, Wang X, et al. The consensus molecular subtypes of colorectal cancer. Nat Med. 2015;21(11):1350-1356. doi: 10.1038/nm.3967 [DOI] [PMC free article] [PubMed] [Google Scholar]
- 17.Barbie DA, Tamayo P, Boehm JS, et al. Systematic RNA interference reveals that oncogenic KRAS-driven cancers require TBK1. Nature. 2009;462(7269):108-112. doi: 10.1038/nature08460 [DOI] [PMC free article] [PubMed] [Google Scholar]
- 18.Becht E, Giraldo NA, Lacroix L, et al. Estimating the population abundance of tissue-infiltrating immune and stromal cell populations using gene expression. Genome Biol. 2016;17(1):218. doi: 10.1186/s13059-016-1070-5 [DOI] [PMC free article] [PubMed] [Google Scholar]
- 19.Nielsen K, Rolff HC, Eefsen RL, Vainer B. The morphological growth patterns of colorectal liver metastases are prognostic for overall survival. Mod Pathol. 2014;27(12):1641-1648. doi: 10.1038/modpathol.2014.4 [DOI] [PubMed] [Google Scholar]
- 20.Eefsen RL, Vermeulen PB, Christensen IJ, et al. Growth pattern of colorectal liver metastasis as a marker of recurrence risk. Clin Exp Metastasis. 2015;32(4):369-381. doi: 10.1007/s10585-015-9715-4 [DOI] [PubMed] [Google Scholar]
- 21.Wang Y, Lin HC, Huang MY, et al. The Immunoscore system predicts prognosis after liver metastasectomy in colorectal cancer liver metastases. Cancer Immunol Immunother. 2018;67(3):435-444. doi: 10.1007/s00262-017-2094-8 [DOI] [PMC free article] [PubMed] [Google Scholar]
- 22.Baldin P, Van den Eynde M, Mlecnik B, et al. Prognostic assessment of resected colorectal liver metastases integrating pathological features, RAS mutation and Immunoscore. J Pathol Clin Res. 2021;7(1):27-41. doi: 10.1002/cjp2.178 [DOI] [PMC free article] [PubMed] [Google Scholar]
- 23.Balachandran VP, Arora A, Gönen M, et al. A validated prognostic multigene expression assay for overall survival in resected colorectal cancer liver metastases. Clin Cancer Res. 2016;22(10):2575-2582. doi: 10.1158/1078-0432.CCR-15-1071 [DOI] [PMC free article] [PubMed] [Google Scholar]
- 24.Spratt DE, Yousefi K, Deheshi S, et al. Individual patient-level meta-analysis of the performance of the decipher genomic classifier in high-risk men after prostatectomy to predict development of metastatic disease. J Clin Oncol. 2017;35(18):1991-1998. doi: 10.1200/JCO.2016.70.2811 [DOI] [PMC free article] [PubMed] [Google Scholar]
- 25.Klein EA, Yousefi K, Haddad Z, et al. A genomic classifier improves prediction of metastatic disease within 5 years after surgery in node-negative high-risk prostate cancer patients managed by radical prostatectomy without adjuvant therapy. Eur Urol. 2015;67(4):778-786. doi: 10.1016/j.eururo.2014.10.036 [DOI] [PubMed] [Google Scholar]
- 26.Kratz JR, Haro GJ, Cook NR, et al. Incorporation of a molecular prognostic classifier improves conventional non-small cell lung cancer staging. J Thorac Oncol. 2019;14(7):1223-1232. doi: 10.1016/j.jtho.2019.03.015 [DOI] [PubMed] [Google Scholar]
- 27.Hellman S, Weichselbaum RR. Oligometastases. J Clin Oncol. 1995;13(1):8-10. doi: 10.1200/JCO.1995.13.1.8 [DOI] [PubMed] [Google Scholar]
- 28.Katipally RR, Pitroda SP, Juloori A, Chmura SJ, Weichselbaum RR. The oligometastatic spectrum in the era of improved detection and modern systemic therapy. Nat Rev Clin Oncol. 2022;19(9):585-599. doi: 10.1038/s41571-022-00655-9 [DOI] [PubMed] [Google Scholar]
- 29.Spurr LF, Martinez CA, Katipally RR, et al. A proliferative subtype of colorectal liver metastases exhibits hypersensitivity to cytotoxic chemotherapy. NPJ Precis Oncol. 2022;6(1):72. doi: 10.1038/s41698-022-00318-z [DOI] [PMC free article] [PubMed] [Google Scholar]
- 30.Loupakis F, Sharma S, Derouazi M, et al. Detection of molecular residual disease using personalized circulating tumor DNA assay in patients with colorectal cancer undergoing resection of metastases. JCO Precis Oncol. 2021;5(5):1166-1177. doi: 10.1200/PO.21.00101 [DOI] [PMC free article] [PubMed] [Google Scholar]
- 31.Ruers T, Punt C, Van Coevorden F, et al. ; EORTC Gastro-Intestinal Tract Cancer Group; Arbeitsgruppe Lebermetastasen und—tumoren in der Chirurgischen Arbeitsgemeinschaft Onkologie (ALM-CAO) and the National Cancer Research Institute Colorectal Clinical Study Group (NCRI CCSG) . Radiofrequency ablation combined with systemic treatment versus systemic treatment alone in patients with non-resectable colorectal liver metastases: a randomized EORTC Intergroup phase II study (EORTC 40004). Ann Oncol. 2012;23(10):2619-2626. doi: 10.1093/annonc/mds053 [DOI] [PMC free article] [PubMed] [Google Scholar]
- 32.Scorsetti M, Comito T, Tozzi A, et al. Final results of a phase II trial for stereotactic body radiation therapy for patients with inoperable liver metastases from colorectal cancer. J Cancer Res Clin Oncol. 2015;141(3):543-553. doi: 10.1007/s00432-014-1833-x [DOI] [PMC free article] [PubMed] [Google Scholar]
Associated Data
This section collects any data citations, data availability statements, or supplementary materials included in this article.
Supplementary Materials
Trial Protocol
eMethods
eFigure 1. Diagram representing training and application of neural network classifier to predict molecular subtypes
eFigure 2. Optimization of model performance (measured by the F score) as features are eliminated using recursive feature elimination
eTable 1. List of mRNAs and miRNAs included in the neural network classifier to predict molecular subtypes
eFigure 3. Histogram representing the robustness and internal consistency of the molecular subtype classifier for liver metastases in the validation cohort
eFigure 4. Distribution of molecular subtypes and integrated clinical-molecular risk groups in the discovery and validation cohorts
eFigure 5. Distribution of clinical and pathologic features across molecular subtypes in the validation cohort
eFigure 6. PFS and OS by cohort, subtype, and risk group
eFigure 7. Box and whisker plots for detailed visualization
eFigure 8. Survival outcomes in validation cohort by predicted molecular subtype of primary tumor
eTable 2. Association of consensus molecular subtype of the primary tumor with molecular subtype of the liver metastasis in the validation cohort
eFigure 9. Survival outcomes in the validation cohort based on consensus molecular subtypes of either the primary tumor or liver metastasis
eTable 3. Sensitivity analysis demonstrating Cox proportional hazards model for PFS and OS in validation cohort
eReferences
eTable 4. Theta1 Matrices
eTable 5. Theta2 Matrices
Nonauthor Collaborators. The S:CORT Consortium nonauthor collaborators
Data Sharing Supplement