

Abstract

Carbon capture, storage, and utilization have become familiar terms when discussing climate change mitigation actions. Such endeavors demand the availability of smart and inexpensive devices for CO2 monitoring. To date, CO2 detection relies on optical properties and there is a lack of devices based on solid-state gas sensors, which can be miniaturized and easily made compatible with Internet of Things platforms. With this purpose, we present an innovative semiconductor as a functional material for CO2 detection. A nanostructured In2O3 film, functionalized by Na, proves to enhance the surface reactivity of pristine oxide and promote the chemisorption of even rather an inert molecule as CO2. An advanced operando equipment based on surface-sensitive diffuse infrared Fourier transform is used to investigate its improved surface reactivity. The role of sodium is to increase the concentration of active sites such as oxygen vacancies and, in turn, to strengthen CO2 adsorption and reaction at the surface. It results in a change in film conductivity, i.e., in transduction of a concentration of CO2. The films exhibit excellent sensitivity and selectivity to CO2 over an extra-wide range of concentrations (250–5000 ppm), which covers most indoor and outdoor applications due to the marginal influence by environmental humidity.
Keywords: CO2 detection, chemically active metal oxides, In2O3, operando spectroscopies, smart sensors for IoT
Introduction
In recent years, with the development of industry and exponential urbanization, the problems of air pollution and global warming have become increasingly serious and gas monitoring has attained a sufficiently wide market to be commercially attractive. Carbon dioxide (CO2) is considered as the most important contributor to global warming, accounting for 76% of the greenhouse effect,1,2 with an average global concentration level of 420 parts per million (ppm).3 In addition, recent research highlighted that people spend more than 90% of their time in indoor environments4 and, consequently, are subjected to breathe CO2 concentrations higher than the environmental background up to several thousand ppm, depending on the occupancy and ventilation of the confined space.5 Indeed, high concentrations of indoor CO2 have been linked to a deleterious health effect, such as the sick building syndrome.6 In particular, long exposure to concentrations ranging between 2000 and 5000 ppm negatively affects cognitive performance, including headaches and loss of attention.7 Severe toxicity and oxygen deprivation effects occur as the CO2 concentration exceeds 5000 ppm over an 8 h workday.8
Moreover, as recently reported by Peng and Jimenez (2021), CO2 was pointed out as an indicator for indoor ventilation and in turn of pathogen infection (e.g., SARS-CoV-2) probability through aerosol transmission.9 Monitoring CO2 concentration could be useful in greenhouse planting (where the CO2 concentration is usually kept below 300 ppm) and in packaging for conservation of fruits and vegetables (up to 25%).10,11
For CO2 measurements, several techniques have been developed, spanning from analytical instruments such as gas chromatography (GC) assisted by mass spectrometry (MS), infrared spectroscopy (IR) to compact and portable devices, i.e., optical, acoustic, electrochemical, capacitive, and nondispersive infrared-based sensors (NDIR). However, some limitations, e.g., lack of portability, high-maintenance cost, need for trained users (for GC–MS), short device lifetime (for optical and electrochemical sensors), low selectivity (for acoustic sensors), and spectral interference (for NDIR sensors), have prevented CO2 monitoring on a large scale.12−15
Hence, alternative systems combining accuracy, resolution, and robustness with small size, low cost, and power consumption would be highly demanded. Solid-state gas sensors, such as chemoresistive devices, would represent a viable route in this sense to previously mentioned tools, because such devices could be easily integrated in Internet of Things (IoT) networks. Among them, metal-oxide (MOX)-based gas sensors have gained a wide market due to high sensitivity, rapid response, stability, and reproducibility combining simple and low-cost fabrication methods. Unfortunately, to date, they have exhibited a modest attitude to detect CO2, resulting in a poor response due to the inherent stable nature of such a molecule.16−21
Therefore, new functional materials for CO2 sensing featuring stronger chemical reactivity, while maintaining complete reversibility of the detection process, represent a challenge. MOXs are an interesting class of semiconductors, as their properties can be engineered by changing the chemical–physical composition of the MOX, i.e., the crystal structure, the size and shape at the nanostructure level, or by introducing additives (main-group elements, transition metals, noble metals, etc.).22,23 In particular, dopant MOXs proved effective to enhance chemical reactivity.24 Recently, it was discovered that alkali metals act as catalysts to promote analyte adsorption at the compound surface.25 In fact, they accelerate the formation and facilitate the stabilization of reaction intermediates, ultimately increasing the adsorption of CO2.
Indium oxide (In2O3) has been studied in electrochemistry as an efficient catalyst for CO2 hydrogenation to methanol.26 The basic idea behind this investigation is to merge the concepts above, i.e., develop a sodium-doped indium oxide semiconductor (Na:In2O3) to achieve high CO2 sensing. Indeed, In2O3 is not a novelty among the MOX sensors, because its detection properties have already been probed vs ozone, nitrogen dioxide, and methane.27−29 In sight of potential large-scale applications, we resorted to a simple synthesis method such as the sol–gel process. The powders, conveniently characterized, were used as a functional component for screen-printed sensing films and probed vs different concentrations of CO2 and its potential interfering gases (toluene, ethanol, carbon monoxide, and nitrogen dioxide) for applications. The sensing capability vs CO2 was explored over a wide range of concentrations (250–5000 ppm), covering most relevant indoor and outdoor applications. The role of the sodium in the sensing mechanism was investigated through Fourier transform infrared diffuse reflectance (DRIFT) spectroscopy, an operando characterization technique to monitor the gas–solid interaction occurring at the surface while the sensor is working.30−32
Experimental Section
In this study, we synthesized pristine and Na-doped indium oxide by means of the sol–gel process. The morphology, elemental composition, and structure of the nanopowders were investigated by scanning electron microscopy (SEM), transmission electron microscopy (TEM), electron X-ray diffraction (EDX) analysis, and X-ray diffraction (XRD). The doping effect of sodium incorporation in the indium oxide nanostructure was derived from X-ray photoelectron spectroscopy (XPS) and optical properties obtained by UV–visible (UV–vis) measurements. Then, sensing devices were produced by a scalable and controllable fabrication technique such as screen printing. The sensors based on pristine and Na-doped indium oxide were electrically characterized to study their sensing performance. Finally, the impact of sodium addition on the latter was investigated through operando DRIFT spectroscopy.
Materials
Indium(III) nitrate hydrate (99.9%) (In(NO3)3·5H2O) was purchased from Sigma-Aldrich, USA. Sodium hydroxide anhydrous pellets (NaOH), ammonia (NH3), and propan-2-ol (C3H8O) were purchased from CARLO ERBA Reagents S.A.S. Deionized (DI) water was procured from the Millipore DI water purification system.
Synthesis and Film Deposition
Synthesis of In2O3 Powder
In2O3 nanopowder was prepared by the sol–gel method. In(NO3)3·5H2O (0.1 M) was dissolved in 60 mL of DI water. Then, 4.0 mL of NH3 was added to the previously prepared aqueous solution. The mixture was stirred for 30–40 min at room temperature.
Synthesis of Na:In2O3 Powder
Na:In2O3 powder was synthetized through the sol–gel technique. First, 0.1 M In(NO3)3·5H2O was dissolved in 60 mL of DI water. Then, 0.5 M NaOH was added to the above precursor aqueous solution and stirred for 40 min at 70 °C.
The slurry, obtained from the two syntheses, was washed with isopropanol and DI water several times using a centrifuge at 5000 rpm for 2 min. The white precipitate was dried at 100 °C for 4 h and consecutively at 200 °C for 2 h. The dried powder was thermally treated at 450 °C for 3 h in an ambient air.
Details on material characterization methods (XRD, SEM, TEM, XPS, and UV–vis) are reported in the Supporting Information.
Film Deposition
The yellow powders were ground in an agate mortar and mixed with α-terpineol, ethyl cellulose, and silica to form a homogeneous paste (step 1 in Figure S1, Supporting Information).
The resulting composites were screen printed by an AUREL C920 onto alumina substrates, commercially available, owing two interdigitated gold electrodes on the front-side, and a platinum heater on the backside to thermo-activate the sensing layer of the device (step 2; Figure S1). In particular, the electrodes supply the input voltage (5 V) and extract the output signal of the sensing layer. The printed film (∼20 μm thick) was calcined at 450 °C for 3 h in air and finally packaged by welding, with a thermo-compression wedge wire bonder, the four contacts to a TO-39 support, commercially available, using gold wires with a diameter of 0.06 mm33 (step 3; Figure S1).
Gas Sensing Measurements
The electrical characterization was developed through two approaches to deeply investigate the gas sensing performance of In2O3-based sensors:
Electrical characterization: experimentation in a standard test chamber for identifying the optimal working conditions, sensitivity, repeatability, response and recovery times, humidity influence, and selectivity.
Sensing mechanism investigation: operando DRIFT investigation of the Na:In2O3 sensor exposed to CO2 in dry and wet conditions.
Electrical Characterization Setup
The sensing properties of the Na:In2O3 film were tested in a 622 cm3 gas-flow sealed chamber. Synthetic air (20% O2 and 80% N2) and target gases from certified cylinders (N5.0 degree of purity) were mixed and fluxed through mass-flow controllers at 500 standard cc/min (sccm). Then, the filling time of the test chamber was calculated to be about 1 min and 15 s, as it depends on the size, the geometry of the chamber, and the velocity of the gas flow.34
Relative humidity and temperature inside the test chamber were controlled by a commercial Honeywell HIH-4000 humidity sensor. The test chamber was placed in a climatic box, which maintains a constant outer temperature of 25 °C through a thermal ventilation system.35
Electrical Measurements
Working Temperature
Sensors were kept at their optimal working temperature, identified after a proper calibration with temperatures ranging from 150 to 300 °C, under a continuous flow of synthetic air, until the thermodynamic steady state was attained. The sensor response was defined as
| 1 |
where Ggas and Gdry air are the steady-state conductance in gas and in air, respectively. The response (τres) and recovery (τrec) times were calculated as the time needed to reach 90% of the steady response and the time to restore 90% of the baseline level, respectively.
Sensitivity
The film was exposed to increasing concentrations ranging from 250 to 5000 ppm of CO2 to sound out different application scenarios.
Repeatability
The Na:In2O3 film was exposed to four cycles of 400 and 1200 ppm of CO2.
Humidity Influences
The sensors were stabilized at the beginning of each measurement by keeping the sensors at their working temperature under a continuous flow (500 sccm) of wet air, in the range of 1–75 RH%, by fluxing part of the total flux through a bubbler filled with distilled water. After the stabilization, the sensors were exposed to the target gas.
| 2 |
where Gwet air is the conductance in wet conditions.
Selectivity
The concentrations of selected gases (ethanol, toluene, NO2, and CO) were chosen according to the National Institute for Occupational Safety and Health (NIOSH), the American Society of Heating, Refrigerating and Air-Conditioning Engineers (ASHRAE), and the average tested levels reported in the literature.8,36−39 The selectivity coefficient (ks) was defined as the ratio of the response value of the sensors to CO2 and interfering gas, respectively.40
| 3 |
Limit of Detection (LOD)
According to the International Union of Pure and Applied Chemistry (IUPAC) definition,41 the LOD is calculated as LOD = 3(RMS noise/S), where RMS noise is the root-mean-square deviation and S is the slope of the fitting of the calibration curve.
Operando DRIFT Setup
The kinetics at the gas–solid surface was investigated through operando experiments employing a Bruker Vertex 70 V vacuum FTIR spectrometer, equipped with a DRIFT accessory (Praying Mantis, Harrick Scientific Products Inc.) (Figure S2, Supporting Information). The characterization of In2O3-based sensors was investigated using a dedicated apparatus, including a customized sealed gas test chamber (IR dome with a void volume of ≈0.5 cm3) and a data acquisition system. All specifications about the system for gas injection, chamber characteristics, and electronics are given in the Supporting Information and in the previous works.30,42
Operando DRIFT Measurements
The single-channel spectrum is composed by the absorption caused by functional groups of species adsorbed on the surface and by the sensing material itself, which together with the diverse individual component of the spectrometer (optical elements, light source emission, and detector nonlinearity) affect the overall shape of the single-channel DRIFT spectrum.
The spectra were acquired through a liquid nitrogen-cooled mercury cadmium tellurium mid-band detector, with a spectral range from 850 to 4000 cm–1. The absorbance spectra were calculated by using the equation
| 4 |
where I sample (λ) and I background (λ) are the spectra of the sample and the background.30,31
Characterization in Dry and Wet Conditions
The samples were maintained at its proper working temperature (200 °C) overnight, and then each spectrum was collected at a resolution of 4 cm–1 averaging 1024 scans with a beam spot size of 2.5 mm. All the optical bench settings and spectral data acquisition were performed through Bruker OPUS software.
Before the CO2 exposure, the measuring chamber was kept in a constant flow of 100 sccm of synthetic dry air, while the sensor operating temperature was gradually increased with steps of 50 °C up to 200 °C. Each temperature step was maintained for as long as to allow thermodynamically stabilization of the surface. The surface reactivity of the sensor was evaluated after maintaining the device at 200 °C for 1 day under a 100 sccm constant flow of synthetic dry air and an applied voltage between the electrodes of 1 V.42 According to these conditions, we evaluated the spectral background for each reported measurement. After a stabilization of the baseline for a few hours, the device was exposed to a mixture of 1000 and 3500 ppm of CO2 and synthetic air under dry (≈1% RH at 30 °C) and wet conditions (up to 22 RH% at 30 °C).
Results and Discussion
Powder Characterization
The XRD pattern of the same powder revealed that both the pristine and Na-doped samples are monophasic and with a cubic crystal structure (s.g. Ia-3) (Figure 1a). The diffraction peaks for Na:In2O3 were shifted slightly toward 2θ values lower than those for the pristine In2O3, indicating lattice expansion through sodium doping. Along with a lattice parameter variation, the addition of sodium yielded a crystal structure that has nearly the same crystallite size (XXRD) but a lower microstrain (e0), as provided in Table 1. Namely, peak broadening effects that may arise from dislocations or interstitial, substitutional, and other similar point defects as determined by XRD analyses43 are hindered by sodium doping.
Figure 1.

(a) XRD pattern of pristine In2O3 and Na:In2O3 powders. Inset: magnification of the Na:In2O3 peak shift. (b) TEM and (c) HR-TEM images of In2O3 powder. (d) TEM and (e) HR-TEM images of Na:In2O3 powder.
Table 1. Main Crystallographic Information (i.e., Crystal System, Space Group, Lattice Parameter (a), Crystallite Size (XXRD), and Microstrain (e0)) for the Investigated Samples.
| sample | crystal system | space group | a [Å] | crystallite size, XXRD [nm] | microstrain, e0 × 100 |
|---|---|---|---|---|---|
| In2O3 | In2O3 (cubic) | Ia-3 | 10.1193(4) | 10.4(1) | 0.101(2) |
| Na:In2O3 | In2O3 (cubic) | Ia-3 | 10.1213(2) | 10.9(1) | 0.060(3) |
The SEM analysis on the In2O3-based powders showed regular nanometric spherical particles with an equiaxed shape (Figures S3a and S4, Supporting Information). The morphology of In2O3 and Na:In2O3 was further characterized by TEM. Figure 1b,d confirms that the powders consisted of monodisperse nanoparticles and averaged (12 ± 4) nm and (11 ± 3) nm in size for In2O3 and Na:In2O3, respectively. Here, crystalline facets were highlighted on the particles with a round shape (see Figure 1c,e). The particles were crystalline as no amorphous or secondary segregated phases were observed at the grain surface. The selected-area electron diffraction pattern (Figure S5, Supporting Information) showed the typical interplanar distances of the cubic phase of In2O3, the major reflections of which derive from crystalline planes (222), (004), and (044), then confirming XRD results. Furthermore, scanning transmission electron microscopy combined with energy-dispersive X-ray (STEM-EDX) analysis confirmed the localization of Na within the nanometric In2O3 particles (Figure S6, Supporting Information).
The survey spectrum of high-resolution XPS over the powders (Figure 2) revealed the presence of three main elements, i.e., In, O, and Na. To investigate the chemical state of these elements, the high-resolution spectra of In 3d (440–455 eV), O 1s (526–535 eV), and Na 1s (1066–1075 eV) core levels were collected. Their quantification (atomic%) in the pristine and doped samples is reported in Table S1. Figure 2a compares the XPS spectrum of the In 3d core level for the powders with and without Na, which neatly shows the doublet corresponding to 3d5/2 and 3d3/2. For the pristine In2O3 sample, In 3d5/2 and In 3d3/2 peaks appeared at 444.1 and 451.6 eV, respectively. The energy of the In 3d doublet corresponds to the In3+ oxidation state and In-O bonds.44 A slight change of binding energies of the In 3d peaks was observed between pristine In2O3 and Na:In2O3 samples. The displacement of these peaks indicates different chemical neighborhoods due to incorporation of sodium into the In2O3 lattice. Then, a similar shift can be also observed for O 1s, as reported in Table S2. Figure 2b,c shows a detailed deconvolution of the O 1s high-resolution spectra, both for Na:In2O3 and In2O3 samples, in four peaks corresponding to the O lattice (In-O-In), O atoms adjoined to oxygen deficiency sites (oxygen vacancies), surface hydroxyl groups OH-In, and H2O (∼533.0 eV).45−47 The main O 1s peak at 529.6 eV for In2O3 (529.2 eV for Na:In2O3) corresponds to the O lattice. The binding energies at 530.3 eV for In2O3 (529.9 eV for Na:In2O3) are assigned to O atoms adjoined to oxygen vacancies, while the O 1s peak at 531.4 eV for In2O3 (531.1 eV for Na:In2O3) is related to the adsorbed −OH terminations.48,49 The increased % of O atoms adjoined to oxygen vacancies found in the doped In2O3 sample suggests a higher concentration of oxygen vacancies for Na:In2O3 (8.1%) than for In2O3 (7.0%). Although the quantification of the total amount of oxygen vacancies in indium oxide by XPS analysis can be hardly deduced from the fit of the O 1s peaks, the assessment is supported by the different ratios between oxygen and metals (In + Na) in the two samples, equal to 1.22 and 1.32 for Na:In2O3 and In2O3, respectively (Table S1).
Figure 2.

High-resolution XPS spectra of (a) In 3d, (b, c) O 1s, and (d) Na 1s core levels of Na:In2O3 (blue line) and In2O3 powders (red line).
Figure 2d shows the high-resolution spectrum of the Na 1s core level in the Na:In2O3 powder. The binding energy identified at 1071.4 eV is ascribed to Na+,50 which confirmed the successful incorporation of Na into the In2O3 lattice through sol–gel synthesis. Therefore, doping with low-oxidation-state alkali metals is a suitable strategy to promote the formation and to control the concentration of oxygen vacancies in MOX, enabling the tuning of catalytic and optoelectronic properties, as already observed in previous works.51,52
The optical properties of the In2O3-based nanopowders were characterized by UV and visible spectroscopies (Figure 3). It can be observed that the maximum in the absorption spectrum for pristine In2O3 was recorded at a wavelength of about 304 nm. For comparison, the maximum for doped In2O3 was red-shifted to 313 nm. Specifically, the optical absorption of the powders was investigated to account for the influence of sodium to the direct band gap (Eg) of In2O3. The latter was determined by using Tauc’s plot,53 resulting in Eg = 3.60 and 3.46 eV for the pristine In2O3 and Na:In2O3, respectively. This observation confirmed the role of sodium as a dopant (Na+). In fact, if sodium had been present in the sample as metallic (Na0), no decrease in the band gap width would have been observed.54,55 This decrease in the band gap confirms the role of Na+ cations as an electrically active dopant in In2O3.
Figure 3.
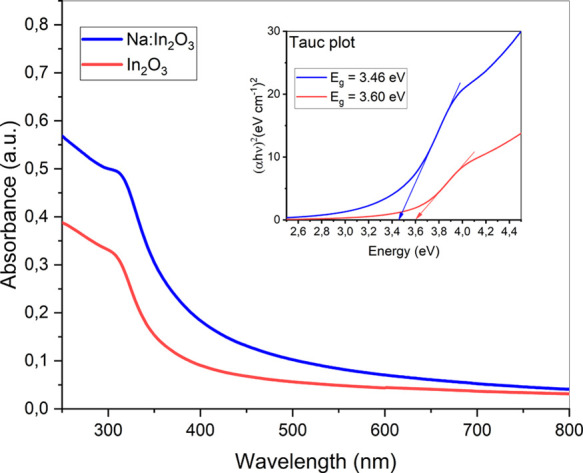
UV–vis absorbance spectrum and inset of (αhν)2 vs energy (eV) for Na:In2O3 and In2O3.
Gas Sensing Performance
The gas response of the films based on pristine In2O3 and Na:In2O3 was investigated by measuring the conductance change at different working temperatures (150–450 °C) under exposure to 500 ppm of CO2. As shown in Figure S7a,b (Supporting Information), the optimal working temperature for the Na:In2O3 film lied in the range of 200–250 °C, while the In2O3 film peaked at 250 °C. In this work, to meet the demand for lowest power consumption, an operating temperature of 200 °C was chosen hereinafter for Na:In2O3. As expected, the conductance change after the injection of reducing gas such as CO2 (Figure S7c) increased for both In2O3 and Na:In2O3, owing to their n-type behavior. Then, the sensor responses were calculated using eq 1.34
The sensitivity to CO2 was investigated by measuring the conductance of the Na:In2O3 film when exposed to 250, 500, 1000, 2000, 3500, and 5000 ppm of CO2, as compared to that for pristine In2O3. The gas concentration range was selected to probe the sensor for operation in both indoor and outdoor applications.11,56,57 As it can be seen in Figure 4, the response of the Na:In2O3 film gradually increased from 4.33 at 250 ppm to 12.7 at 5000 ppm, featuring remarkable sensitivity that envisages noteworthy potential for CO2 monitoring in several contexts. In contrast, the response of the pristine In2O3 film was much lower than for the doped film and, above all, with strong tendency to saturate even at the lowest concentrations.
Figure 4.
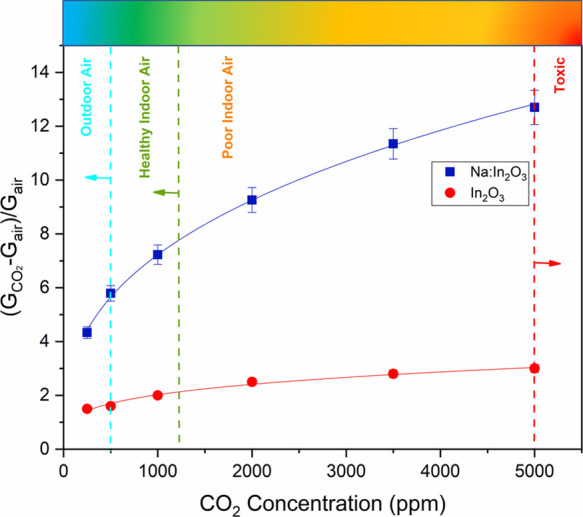
Calibration curves of Na:In2O3 and pristine In2O3 sensors at 200 and 250 °C, respectively, for CO2. During the measurements, the temperature and humidity inside the chamber were 25 °C and 2 RH%, respectively.
The film response also proved to be repeatable (see Figure 5), as requested for the application as a sensor. The response τres and recovery τrec times turned out to be 5 and 9 min at 400 ppm and 3 and 23 min at 1200 ppm. The kinetics of the reaction mechanism could be accelerated by increasing the working temperature; however, already at this level, the sensors are adequately prompt to address indoor and outdoor applications.
Figure 5.
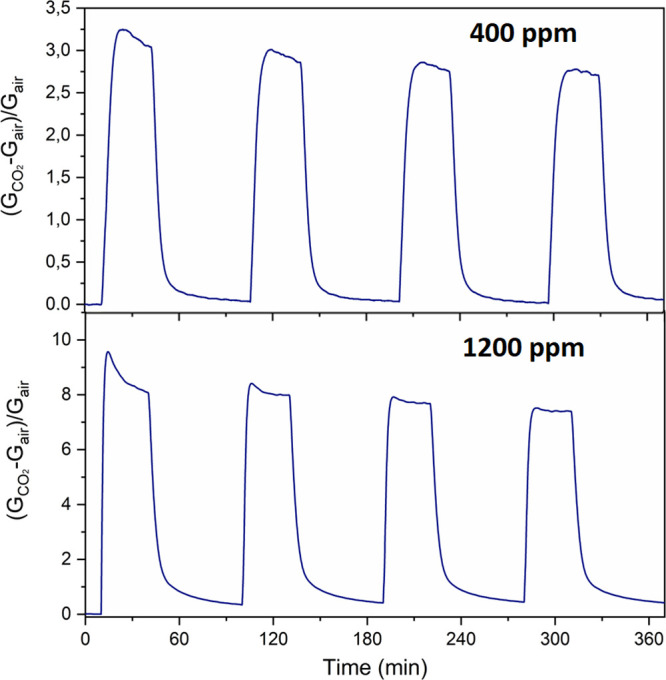
Four-cycle repeatability test as a function of time. For these experiments, the Na:In2O3 sensor was exposed toward 400 and 1200 ppm of CO2 gas. During the measurements, the temperature and humidity inside the chamber were 25 °C and 2 RH%, respectively.
Response and recovery times of the order of 10 min are typical characteristics timing for other MOX semiconductors as in previous works.58−60
Under dry conditions, n-type semiconductors form an electron depletion region near the surface due to adsorption, dissociation, and ionization of environmental oxygen in the operating temperature range of 200–500 °C, which leads to decreasing the sensor conductance. Thus, a chemical reaction between the negatively charged surface oxygen and any reducing gaseous analyte releases electrons to the conduction band (CB), resulting in an increase of the film conductivity. Under wet conditions, the conductance of a MOX semiconductor is affected by the dissociation of water vapor on the surface forming protons and hydroxyl groups (eq 5).40 Protons react with chemisorbed O– species forming neutral −OH groups, thus affecting the conductance.
| 5 |
On the other hand, OH– replaces the coverage of O– species, passivating the film adsorption sites for detection of analytes. Moreover, in a humid environment, the gas sensing response of a MOX semiconductor is attributable to the competition between the adsorption/desorption processes of H2O molecules and the analyte.
In this study, the Na:In2O3 sensor was exposed to 500 ppm of CO2 at different RH levels (3–64%). As shown in Figure S8 (Supporting Information), with an increase of relative humidity, the baseline of film conductance also increased due to the formation of the −OH groups. With the injection of CO2, competition for the active sites may occur between water vapor and the target gas. Hence, the combination of such competitive interactions resulted in a substantial change in film conductance. Indeed, in the presence of humidity, the sensor exhibited a lower response (eq 2) to CO2 than in dry conditions (Figure 6a). It is worthwhile noticing that the response is marginally affected by humidity over a wide range, which is a key feature for possible applications. By contrast, Figure 6a shows that the undoped In2O3 film response merely vanishes under wet conditions.
Figure 6.

(a) Influence of RH% on the response to 500 ppm of CO2 for Na:In2O3 and pristine In2O3 sensors. (b) Selectivity of In2O3-based films toward different analytes. During the measurements, the temperature and humidity inside the chamber were 25 °C and 2 RH% (except for wet analyses), respectively.
Moreover, in the practical implementation of a sensing unit vs an analyte of interest, one should consider the co-presence of other gases whose physicochemical properties may affect the sensor response. Therefore, Na:In2O3 film selectivity was explored by exposing the sensors to various interferents, such as ethanol, toluene, NO2, and CO at different concentrations (Figure 6b). These were selected in sight of indoor and outdoor air quality monitoring, according to the concentration of interest reported by NIOSH and ASHRAE.36−39
It turned out that the Na-doped sensor showed better responses than the pristine In2O3 sensor for all the gases tested with a theoretical LOD of ∼4.1 ppb.41 In particular, we estimated the ks(40) of the sensors for CO2 detection (Table S3, Supporting Information). Hence, the results obtained make the achieved sensor attractive for various CO2 applications, since it is not significantly affected by the influence of other interfering gases.
To further evaluate the features of the Na:In2O3 sensor proposed in this work, we compare its sensing performance vs CO2 to those of other MOX-based sensors, which have been reported in the literature so far (Table 2). The table below summarizes the investigations conducted on CO2-sensitive materials operating at relatively low temperatures and prepared by synthesis methods similar to the one used in this work.
Table 2. Sensing Parameters of Different CO2 Sensors Based on MOX Semiconductors.
| sensing material | synthesis route | operating temperature [°C] | response at concentration [ppm] | operating condition | reference |
|---|---|---|---|---|---|
| ZnO/CuO nanorods | hydrothermal | RT | 0.09 at 1000a | dry | (16) |
| 5wt%Sn-CdO nanopowders | co-precipitating | 250 | 1.18 at 5000b* | dry | (17) |
| CuO@1wt%Ag-BaTiO3 spheres decorated | mixing | 120 | 0.60 at 1000a* | dry | (18) |
| CeO2 yolk-shell nanospheres | solvothermal | 100 | 3.98 at 2400c | negligible response below 70 RH% | (19) |
| Nd2O2CO3 nanoparticles | sol–gel | 350 | 4.00 at 1000d | negligible response below 50 RH% | (20) |
| CaO-In2O3 mesoporous | impregnation | 230 | 1.80 at 2000d | dry | (21) |
| N-ZnO nanoparticles | sol–gel | 250 | 4.50 at 2000d* | dry | (61) |
| Na:In2O3 nanoparticles | sol–gel | 200 | 7.10 at 1000e | uniform response above 15 RH% | this work |
 , where R is the resistance
(Rgas, resistance in CO2 atmosphere; Rair, resistance in carrier gas). The asterisk
denotes a value not explicitly stated in the study but approximated
from a graphical plot.
, where R is the resistance
(Rgas, resistance in CO2 atmosphere; Rair, resistance in carrier gas). The asterisk
denotes a value not explicitly stated in the study but approximated
from a graphical plot.
 , where R is the resistance
(Rgas, resistance in CO2 atmosphere; Rair, resistance in carrier gas).
, where R is the resistance
(Rgas, resistance in CO2 atmosphere; Rair, resistance in carrier gas).
 , where R is the resistance
(Rgas, resistance in CO2 atmosphere; Rair, resistance in carrier gas).
, where R is the resistance
(Rgas, resistance in CO2 atmosphere; Rair, resistance in carrier gas).
 , where R is the resistance
(Rgas, resistance in CO2 atmosphere; Rair, resistance in carrier gas). The asterisk
denotes a value not explicitly stated in the study but approximated
from a graphical plot.
, where R is the resistance
(Rgas, resistance in CO2 atmosphere; Rair, resistance in carrier gas). The asterisk
denotes a value not explicitly stated in the study but approximated
from a graphical plot.
 , where G is the conductance
(Ggas, conductance in CO2 atmosphere; Gair, conductance in carrier gas).
, where G is the conductance
(Ggas, conductance in CO2 atmosphere; Gair, conductance in carrier gas).
It is noteworthy that the sensor in this work exhibits superior functionality vs CO2. First, with respect to sensing devices produced by the same synthesis route, it operates at lower temperatures. Further, above all, its sensitivity ranks among the best and it is marginally affected by environmental humidity, especially it is indifferent over a very wide range (15–64 RH%), paving the way to indoor and outdoor applications.
Operando DRIFT Investigation toward CO2 Detection
To elucidate the sensing mechanism that enables the electrical activity of the new material in the presence of CO2, operando DRIFT measurements were performed. This advanced characterization technique provides an insight into the species adsorbed at the surface, aiding the analysis of the products formed as a result of chemical reactions.
The behavior of Na:In2O3 was first compared to that of the pristine In2O3. Each sensor was exposed to synthetic dry air, to identify the species pre-adsorbed onto the material surface before supplying CO2. The single-channel spectra were collected, while each sensor was being heated at the same working temperature of 200 °C to compare their sensing mechanism in the same thermodynamics conditions (Figure S9, Supporting Information). Simultaneously, the resistance of the sensing films was acquired.
Second, the sensors were exposed to 3500 ppm of CO2 in dry conditions (Figure S10a, Supporting Information). Comparing the two sensors, there is the formation of bridged carbonates, bidentate for Na:In2O3 and inorganic carboxylates for In2O3. According to the literature,62 the latter, due to their thermal stability, are less reactive with respect to the former species, and this is explanatory of the limited electrical response of pristine In2O3 vs CO2.
The solid–gas kinetics occurring at the surface of the Na:In2O3 sensor was investigated by acquiring the DRIFT spectra at topic intervals, while the dynamical response of the sensor vs 1000 ppm CO2 was being carried out (Figure 7). The figure highlights that adsorption and desorption are completely reversible at 200 °C. The DRIFT spectra highlighted the presence of hydroxyl groups adsorbed on the surface during CO2 injection (see steps 2 and 3; Figure 7). According to DRIFT studies using D2O/H2O on In2O3 by Boehme et al.,63 the sharp peak at ca. 3711 cm–1 can be attributed to the formation of isolated hydroxyl groups, while the broad bands between 3640 and 3040 cm–1 are bridged hydroxyls. Both species are due to residual water vapor in the gas injection tube (see Figure S11a, Supporting Information), and they decreased during the recovery to dry conditions (see step 4; Figure 7). However, gaseous CO2 molecules were the most abundant species observed by DRIFT.64 As shown in Figure 7b, the presence of the characteristic peaks at ca. 2339 and 2365 cm–1 belongs to these molecules (see steps 2 and 3; Figure 7). The bands at 1439 and 1034 cm–1 are assigned to In-O lattice vibration overtones.65
Figure 7.

(a) Measurement scheme, resistance change when the gas sensor was exposed to 1000 ppm of CO2 in dry air at 200 °C with time intervals marked for FTIR spectrum sampling. (b) Spectra acquired during CO2 input and output under dry air conditions at time intervals marked above.
In the region between 1600 and 1000 cm–1, there are two main carbonate species. Indeed, the exposure of the sample to CO2 flow led to the rapid formation of bidentate carbonate (b-HCO3–) as recorded by 1607 and 1291 cm–1, while bridged bidentate carbonate (br-CO32–) was at 1564 cm–1.66
From the electrical point of view, the sensor resistance decreased with the injection of CO2 due to carbonate species and hydroxyl group formation (steps 2 and 3; Figure 7a). On the other hand, film resistance increased as a result of CO2 desorption (steps 4 and 5; Figure 7a), which led to a significant decrease in carbonate species, while the bands corresponding to −OH groups remained almost constant in intensity owing to the lower working temperature (200 °C), which inhibited their desorption.
To further investigate the sensing mechanism toward CO2, we compared the DRIFT spectra acquired during the exposure to the two different concentrations of CO2 (1000 and 3500 ppm) (Figure S10b, Supporting Information). At higher concentrations, a slight increase in the intensities of all adsorbed species was recorded and two more peaks showed up at 3627 and 3600 cm–1. According to the literature,66 they can be attributed to the ν(OH) modes of the newly formed hydroxyl groups of the bidentate carbonates and monodentate carbonates.
The stimulating behavior under humidity exposure we observed led us to increase the relative humidity concentrations (5.5–22 RH%). Under wet environments in the presence of 1000 ppm of CO2 (see Figure 8), the DRIFT spectra can be explained in terms of chemical activity of three types of adsorbates on the surface, namely, −CO32–, −OH–, and −O– (see Figure 8a). The narrow and intense peaks between 4000–3300 and 2100–1300 cm–1, which increased with the humidity concentrations, are assigned to the gaseous H2O molecules.67 The competitive relation between hydroxyl groups and carbonate species became clear as an increase in the peaks due to hydroxyl groups resulted in a decrease of the carbonate species (see Figure 8b). Therefore, adsorbed H2O on the surface limits the adsorption sites and inhibits the formation of carbonates.64
Figure 8.

(a) Spectra of the Na:In2O3 film at 200 °C acquired during the inlet of 1000 ppm of CO2 in dry conditions (1 RH%) and in wet conditions. (b) Magnification of the spectrum reported in panel (a) in the range from 2000 to 850 cm–1. The spectral noise is related to the increase of water species adsorbed at the surface.
Sensing Mechanism
By combining the information obtained through DRIFT measurements with the electrical characterization of the film, it was possible to formulate some hypotheses about the detection mechanism of CO2 by Na:In2O3 as a chemoresistive functional material. In particular, the sensing mechanism can be explained in terms of the band bending theory.68,69 Considering dry air conditions, at working temperatures ranging between 100 and 500 °C, the interaction of the sensing layer with atmospheric oxygen leads to ionosorption of the latter in molecular (O2–) and/or atomic (O–, O2–) species (see eqs 6–9).70 More precisely, the reactions occurring at the surface, listed as a function of increasing temperature, are the following:
| 6 |
| 7 |
| 8 |
| 9 |
At an operating temperature of 200 °C, the oxygen ions (O–) would dominate the ionosorption (eq 8).71 As a result, atmospheric oxygen traps electrons from the CB, creating a potential barrier (qVs)1 and consequently increasing the resistance of the film with respect to room-temperature operation (stage I in Figure 9a). As CO2 is fed (stage II in Figure 9a), its molecules react with the pre-adsorbed oxygen ions at the surface following eq 10 to produce carbonate ions and electrons.1,72
| 10 |
Therefore, the concentration of free electrons in the CB of Na:In2O3 increases, leading to a decrease in the potential barrier in this new state, (qVs)2, and consequently in the film resistance.
Figure 9.

Reaction mechanisms on the surface (a) in dry air (stage I) and under CO2 exposure (stage II) and (b) in wet air (stage I) and under CO2 exposure (stage II). Ec and Ev are the conduction and valence bands, EF is the Fermi level, and ED is the donor level created due to the doping by Na.
Under wet conditions, water molecules (eq 5) both react with and hinder chemisorbed oxygens at the surface (stage I in Figure 9b). This phenomenon influences the band bending effect, i.e., the potential barrier created in wet air is lower than in dry air ((qVs)3 < (qVs)1). This results in a decrease of the film resistance. Exposing the sensor to CO2 in wet conditions, hydroxyl groups promote the reaction in eq 11, decreasing the potential barrier ((qVs)4 < (qVs)3) (stage II in Figure 9b).
| 11 |
However, a higher water concentration hinders the reaction between active sites with CO2. Therefore, the variation of potential barrier height with the exposure to the analyte is lower in wet than in dry conditions, inducing a lower response.
The role of sodium in enhancing the CO2 detection relies on the increase in the concentration of oxygen vacancies as confirmed by XPS analysis (see Table 2 and Figure 2), according to the following reaction:73
| 12 |
where V O· denotes the singly ionized oxygen vacancy and VO denotes the neutral oxygen vacancy.
On the one hand, whereas oxygen vacancies are additional surface sites of high reactivity, sodium could itself prove to be a promoter of the catalytic effect,74 causing both electronic and redox changes in the material.
Conclusions
In this work, Na:In2O3 nanostructured powder was synthesized by the sol–gel method. Extensive characterization by SEM, TEM, XRD, XPS, and UV–vis confirmed the nanostructured nature of the material as spherical particles and the presence of sodium dispersed in the crystalline structure. Indeed, aggregates or second phases were not observed by TEM and XRD analysis, suggesting that the addition of sodium is properly distributed. In particular, XPS revealed an increase in the concentration of oxygen vacancies in the doped sample as compared to the pristine one, which turned out to magnify the surface reactivity of the doped material. Indeed, Na:In2O3 was capable of reducing CO2, suggesting that it can straight be used as a gas sensor.
The sensing performance was evaluated by investigating the sensitivity in dry and in RH% conditions, repeatability, and selectivity. In particular, the negligible influence of humidity enables the new MOX-based sensing material to a wide scenario of possible applications.
By comparing the performance to other CO2 sensors in the literature, it emerged that Na:In2O3 as a functional material is very effective for CO2 sensing at low temperatures. To achieve additional information on the surface reaction mechanism of Na:In2O3-based gas sensors to CO2, we performed operando DRIFT spectroscopy measurements. It was highlighted that the adsorption of CO2 on the surface led to the formation of carbonate species, which, in the case of wet conditions, compete with hydroxyl groups on the film. To further investigate this process, it might be necessary to conduct H2O/D2O and 12CO/13CO isotope exchange experiments to discriminate the different groups on the surface.
Therefore, the enhancement of oxygen vacancies caused by sodium doping was fundamental to increase the reactivity vs CO2. To deeply explore the role of sodium in the sensing mechanism, density functional theory calculations might provide significant information on the electronic structure and energy of interactions.
These sensing capabilities, corroborated by the technological advantage to operate at low temperatures and the possible miniaturization for IoT networks, make the material investigated in this work the most effective MOX-based gas sensor for CO2 detection, competing with widespread optical sensors.
Acknowledgments
This work was funded (POR FSE 2014/2020) by Regione Emilia-Romagna. Research Project for Technology Transfer and Business. Integrated management of satellite data and ground IoT sensors aimed at sustainability in precision farming practices for regional crops of excellence.
Supporting Information Available
The Supporting Information is available free of charge at https://pubs.acs.org/doi/10.1021/acsami.3c04789.
Sensor fabrication method, operando drift setup, material characterization, electrical characterization, and operando drift investigation toward CO2 detection (PDF)
Author Contributions
A.R. contributed to the conceptualization, methodology, validation, writing (original draft), material synthesis, data curation, and electrical characterization. B.F. contributed to the conceptualization, methodology, and writing (original draft). E.S., M.V., and S.K. contributed to the writing (review and editing). A.G., M.F., M.A., L.V., and A.P. contributed to the investigation and material characterization. V.G. contributed to supervision and funding acquisition.
The authors declare no competing financial interest.
This paper was published ASAP on June 30, 2023. Equation 4 was updated, and the corrected version was reposted on July 3, 2023.
Supplementary Material
References
- Lin Y.; Fan Z. Compositing Strategies to Enhance the Performance of Chemiresistive CO2 Gas Sensors. Mater. Sci. Semicond. Process. 2020, 107, 104820 10.1016/j.mssp.2019.104820. [DOI] [Google Scholar]
- Grote M.; Williams I.; Preston J. Direct Carbon Dioxide Emissions from Civil Aircraft. Atmos. Environ. 2014, 95, 214–224. 10.1016/j.atmosenv.2014.06.042. [DOI] [PMC free article] [PubMed] [Google Scholar]
- NASA, Understanding Our Planet to Benefit Humankind; NASA,Https://Climate.Nasa.Gov/. https://climate.nasa.gov/. [Google Scholar]
- Pitarma R.; Marques G.; Ferreira B. R. Monitoring Indoor Air Quality for Enhanced Occupational Health. J. Med. Syst. 2017, 41, 23. 10.1007/s10916-016-0667-2. [DOI] [PubMed] [Google Scholar]
- Shriram S.; Ramamurthy K.; Ramakrishnan S. Effect of Occupant-Induced Indoor CO2 Concentration and Bioeffluents on Human Physiology Using a Spirometric Test. Build. Environ. 2019, 149, 58–67. 10.1016/j.buildenv.2018.12.015. [DOI] [Google Scholar]
- Maddalena R.; Mendell M. J.; Eliseeva K.; Chan W. R.; Sullivan D. P.; Russell M.; Satish U.; Fisk W. J. Effects of Ventilation Rate per Person and per Floor Area on Perceived Air Quality, Sick Building Syndrome Symptoms, and Decision-Making. Indoor Air 2015, 25, 362–370. 10.1111/ina.12149. [DOI] [PubMed] [Google Scholar]
- Satish U.; Mendell M. J.; Shekhar K.; Hotchi T.; Sullivan D.; Streufert S.; Fisk W. J. Is CO2 an Indoor Pollutant? Direct Effects of Low-to-Moderate CO2 Concentrations on Human Decision-Making Performance. Environ. Health Perspect. 2012, 120, 1671–1677. 10.1289/ehp.1104789. [DOI] [PMC free article] [PubMed] [Google Scholar]
- Immediately Dangerous To Life or Health (IDLH) Values; Centers for Disease Control and Prevention, 1994. https://www.cdc.gov/niosh/npg/npgd0103.html. [Google Scholar]
- Peng Z.; Jimenez J. L. Exhaled CO2 as a COVID-19 Infection Risk Proxy for Different Indoor Environments and Activities. Environ. Sci. Technol. Lett. 2021, 8, 392–397. 10.1021/acs.estlett.1c00183. [DOI] [PubMed] [Google Scholar]
- Anwar M. N.; Fayyaz A.; Sohail N. F.; Khokhar M. F.; Baqar M.; Khan W. D.; Rasool K.; Rehan M.; Nizami A. S. CO2 Capture and Storage: A Way Forward for Sustainable Environment. J. Environ. Manage. 2018, 226, 131–144. 10.1016/j.jenvman.2018.08.009. [DOI] [PubMed] [Google Scholar]
- Puligundla P.; Jung J.; Ko S. Carbon Dioxide Sensors for Intelligent Food Packaging Applications. Food Control 2012, 25, 328–333. 10.1016/j.foodcont.2011.10.043. [DOI] [Google Scholar]
- Yu L.; Li Y.; Yu H.; Zhang K.; Wang X.; Chen X.; Yue J.; Huo T.; Ge H.; Alamry K. A.; Marwani H. M.; Wang S. A Fluorescence Probe for Highly Selective and Sensitive Detection of Gaseous Ozone Based on Excited-State Intramolecular Proton Transfer Mechanism. Sens. Actuators, B 2018, 266, 717–723. 10.1016/j.snb.2018.03.175. [DOI] [Google Scholar]
- Dinh T.-V.; Choi I.-Y.; Son Y.-S.; Kim J.-C. A Review on Non-Dispersive Infrared Gas Sensors: Improvement of Sensor Detection Limit and Interference Correction. Sens. Actuators, B 2016, 231, 529–538. 10.1016/j.snb.2016.03.040. [DOI] [Google Scholar]
- Bulbul A.; Kim H. A Bubble-Based Microfluidic Gas Sensor for Gas Chromatographs. Lab Chip 2015, 15, 94–104. 10.1039/C4LC00892H. [DOI] [PubMed] [Google Scholar]
- Vincent T. A.; Gardner J. W. A Low Cost MEMS Based NDIR System for the Monitoring of Carbon Dioxide in Breath Analysis at Ppm Levels. Sens. Actuators, B 2016, 236, 954–964. 10.1016/j.snb.2016.04.016. [DOI] [Google Scholar]
- Keerthana S.; Rathnakannan K. Hierarchical ZnO/CuO Nanostructures for Room Temperature Detection of Carbon Dioxide. J. Alloys Compd. 2022, 897, 162988 10.1016/j.jallcom.2021.162988. [DOI] [Google Scholar]
- Rajesh N.; Kannan J. C.; Krishnakumar T.; Bonavita A.; Leonardi S. G.; Neri G. Microwave Irradiated Sn-Substituted CdO Nanostructures for Enhanced CO2 Sensing. Ceram. Int. 2015, 41, 14766–14772. 10.1016/j.ceramint.2015.07.208. [DOI] [Google Scholar]
- Joshi S.; Ippolito S. J.; Periasamy S.; Sabri Y. M.; Sunkara M. V. Efficient Heterostructures of Ag@CuO/BaTiO3 for Low-Temperature CO2 Gas Detection: Assessing the Role of Nanointerfaces during Sensing by Operando DRIFTS Technique. ACS Appl. Mater. Interfaces 2017, 9, 27014–27026. 10.1021/acsami.7b07051. [DOI] [PubMed] [Google Scholar]
- Zito C. A.; Perfecto T. M.; Dippel A.-C.; Volanti D. P.; Koziej D. Low-Temperature Carbon Dioxide Gas Sensor Based on Yolk–Shell Ceria Nanospheres. ACS Appl. Mater. Interfaces 2020, 12, 17745–17751. 10.1021/acsami.0c01641. [DOI] [PubMed] [Google Scholar]
- Djerdj I.; Haensch A.; Koziej D.; Pokhrel S.; Barsan N.; Weimar U.; Niederberger M. Neodymium Dioxide Carbonate as a Sensing Layer for Chemoresistive CO2 Sensing. Chem. Mater. 2009, 21, 5375–5381. 10.1021/cm9013392. [DOI] [Google Scholar]
- Prim A.; Pellicer E.; Rossinyol E.; Peiró F.; Cornet A.; Morante J. R. A Novel Mesoporous CaO-Loaded In2O3 Material for CO2 Sensing. Adv. Funct. Mater. 2007, 17, 2957–2963. 10.1002/adfm.200601072. [DOI] [Google Scholar]
- Wang C.; Yin L.; Zhang L.; Xiang D.; Gao R. Metal Oxide Gas Sensors: Sensitivity and Influencing Factors. Sensors 2010, 10, 2088–2106. 10.3390/s100302088. [DOI] [PMC free article] [PubMed] [Google Scholar]
- Degler D.; Weimar U.; Barsan N. Current Understanding of the Fundamental Mechanisms of Doped and Loaded Semiconducting Metal-Oxide-Based Gas Sensing Materials. ACS Sens. 2019, 4, 2228–2249. 10.1021/acssensors.9b00975. [DOI] [PubMed] [Google Scholar]
- Zhang Y.; Liu Y.; Zhou L.; Liu D.; Liu F.; Liu F.; Liang X.; Yan X.; Gao Y.; Lu G. The Role of Ce Doping in Enhancing Sensing Performance of ZnO-Based Gas Sensor by Adjusting the Proportion of Oxygen Species. Sens. Actuators, B 2018, 273, 991–998. 10.1016/j.snb.2018.05.167. [DOI] [Google Scholar]
- Liang B.; Duan H.; Sun T.; Ma J.; Liu X.; Xu J.; Su X.; Huang Y.; Zhang T. Effect of Na Promoter on Fe-Based Catalyst for CO2 Hydrogenation to Alkenes. ACS Sustainable Chem. Eng. 2019, 7, 925–932. 10.1021/acssuschemeng.8b04538. [DOI] [Google Scholar]
- Wang J.; Zhang G.; Zhu J.; Zhang X.; Ding F.; Zhang A.; Guo X.; Song C. CO2 Hydrogenation to Methanol over In2O3-Based Catalysts: From Mechanism to Catalyst Development. ACS Catal. 2021, 11, 1406–1423. 10.1021/acscatal.0c03665. [DOI] [Google Scholar]
- Sui N.; Zhang P.; Zhou T.; Zhang T. Selective Ppb-Level Ozone Gas Sensor Based on Hierarchical Branch-like In2O3 Nanostructure. Sens. Actuators, B 2021, 336, 129612 10.1016/j.snb.2021.129612. [DOI] [Google Scholar]
- Xu X.; Wang D.; Wang W.; Sun P.; Ma J.; Liang X.; Sun Y.; Ma Y.; Lu G. Porous Hierarchical In2O3 Nanostructures: Hydrothermal Preparation and Gas Sensing Properties. Sens. Actuators, B 2012, 171-172, 1066–1072. 10.1016/j.snb.2012.06.035. [DOI] [Google Scholar]
- Waitz T.; Wagner T.; Sauerwald T.; Kohl C.-D.; Tiemann M. Ordered Mesoporous In2O3: Synthesis by Structure Replication and Application as a Methane Gas Sensor. Adv. Funct. Mater. 2009, 19, 653–661. 10.1002/adfm.200801458. [DOI] [Google Scholar]
- Valt M.; Ciana M. D.; Fabbri B.; Sali D.; Gaiardo A.; Guidi V. Design and Validation of a Novel Operando Spectroscopy Reaction Chamber for Chemoresistive Gas Sensors. Sens. Actuators, B 2021, 341, 130012 10.1016/j.snb.2021.130012. [DOI] [Google Scholar]
- Ciana M. D.; Valt M.; Fabbri B.; Gaiardo A.; Spagnoli E.; Krik S.; Bernardoni P.; Gilli N.; Migliori A.; Quaranta A.; Morandi V.; Guidi V. SO2 Sensing Mechanism of Nanostructured SiC-SiOxC Core Shell: An Operando DRIFT Investigation. Sens. Actuators, B 2022, 371, 132497 10.1016/j.snb.2022.132497. [DOI] [Google Scholar]
- Gurlo A.; Riedel R. In Situ and Operando Spectroscopy for Assessing Mechanisms of Gas Sensing. Angew. Chem., Int. Ed. 2007, 46, 3826–3848. 10.1002/anie.200602597. [DOI] [PubMed] [Google Scholar]
- Fabbri B.; Valt M.; Parretta C.; Gherardi S.; Gaiardo A.; Malagù C.; Mantovani F.; Strati V.; Guidi V. Correlation of Gaseous Emissions to Water Stress in Tomato and Maize Crops: From Field to Laboratory and Back. Sens. Actuators, B 2020, 303, 127227 10.1016/j.snb.2019.127227. [DOI] [Google Scholar]
- Spagnoli E.; Gaiardo A.; Fabbri B.; Valt M.; Krik S.; Ardit M.; Cruciani G.; Della Ciana M.; Vanzetti L.; Vola G.; Gherardi S.; Bellutti P.; Malagù C.; Guidi V. Design of a Metal-Oxide Solid Solution for Sub-Ppm H2 Detection. ACS Sens. 2022, 7, 573–583. 10.1021/acssensors.1c02481. [DOI] [PMC free article] [PubMed] [Google Scholar]
- Valt M.; Caporali M.; Fabbri B.; Gaiardo A.; Krik S.; Iacob E.; Vanzetti L.; Malagù C.; Banchelli M.; D’Andrea C.; Serrano-Ruiz M.; Vanni M.; Peruzzini M.; Guidi V. Air Stable Nickel-Decorated Black Phosphorus and Its Room-Temperature Chemiresistive Gas Sensor Capabilities. ACS Appl. Mater. Interfaces 2021, 13, 44711–44722. 10.1021/acsami.1c10763. [DOI] [PMC free article] [PubMed] [Google Scholar]
- Allen J. G.; MacNaughton P.; Satish U.; Santanam S.; Vallarino J.; Spengler J. D. Associations of Cognitive Function Scores with Carbon Dioxide, Ventilation, and Volatile Organic Compound Exposures in Office Workers: A Controlled Exposure Study of Green and Conventional Office Environments. Environ. Health Perspect. 2016, 124, 805–812. 10.1289/ehp.1510037. [DOI] [PMC free article] [PubMed] [Google Scholar]
- Lee S. C.; Chang M. Indoor Air Quality Investigations at Five Classrooms. Indoor Air 1999, 9, 134–138. 10.1111/j.1600-0668.1999.t01-2-00008.x. [DOI] [PubMed] [Google Scholar]
- Jung C.-C.; Wu P.-C.; Tseng C.-H.; Su H.-J. Indoor Air Quality Varies with Ventilation Types and Working Areas in Hospitals. Build. Environ. 2015, 85, 190–195. 10.1016/j.buildenv.2014.11.026. [DOI] [Google Scholar]
- Raysoni A. U.; Stock T. H.; Sarnat J. A.; Chavez M. C.; Sarnat S. E.; Montoya T.; Holguin F.; Li W.-W. Evaluation of VOC Concentrations in Indoor and Outdoor Microenvironments at Near-Road Schools. Environ. Pollut. 2017, 231, 681–693. 10.1016/j.envpol.2017.08.065. [DOI] [PubMed] [Google Scholar]
- Galstyan V.; Poli N.; D’Arco A.; Macis S.; Lupi S.; Comini E. A Novel Approach for Green Synthesis of WO3 Nanomaterials and Their Highly Selective Chemical Sensing Properties. J. Mater. Chem. A 2020, 8, 20373–20385. 10.1039/D0TA06418A. [DOI] [Google Scholar]
- Recommendations for the Definition, Estimation and Use of the Detection Limit. Analyst 1987, 112, 199. 10.1039/an9871200199. [DOI] [Google Scholar]
- Della Ciana M.; Valt M.; Fabbri B.; Bernardoni P.; Guidi V.; Morandi V. Development of a Dedicated Instrumentation for Electrical and Thermal Characterization of Chemiresistive Gas Sensors. Rev. Sci. Instrum. 2021, 92, 074702 10.1063/5.0053635. [DOI] [PubMed] [Google Scholar]
- Diffraction Analysis of the Microstructure of Materials; Mittemeijer E. J.; Scardi P., Eds.; Hull R.; Osgood R. M.; Parisi J.; Warlimont H., Series Eds.; Springer Series in Materials Science; Springer Berlin Heidelberg: Berlin, Heidelberg, 2004; Vol. 68. 10.1007/978-3-662-06723-9. [DOI] [Google Scholar]
- Shinde D. V.; Ahn D. Y.; Jadhav V. V.; Lee D. Y.; Shrestha N. K.; Lee J. K.; Lee H. Y.; Mane R. S.; Han S.-H. A Coordination Chemistry Approach for Shape Controlled Synthesis of Indium Oxide Nanostructures and Their Photoelectrochemical Properties. J. Mater. Chem. A 2014, 2, 5490–5498. 10.1039/C3TA15407F. [DOI] [Google Scholar]
- Hu B.; Hu M.; Guo Q.; Wang K.; Wang X. In-Vacancy Engineered Plate-like In(OH)3 for Effective Photocatalytic Reduction of CO2 with H2O Vapor. Appl. Catal., B 2019, 253, 77–87. 10.1016/j.apcatb.2019.04.046. [DOI] [Google Scholar]
- Qi Y.; Song L.; Ouyang S.; Liang X.; Ning S.; Zhang Q.; Ye J. Photoinduced Defect Engineering: Enhanced Photothermal Catalytic Performance of 2D Black In2O3–x Nanosheets with Bifunctional Oxygen Vacancies. Adv. Mater. 2020, 32, 1903915. 10.1002/adma.201903915. [DOI] [PubMed] [Google Scholar]
- Shan F.; Sun H.-Z.; Lee J.-Y.; Pyo S.; Kim S.-J. Improved High-Performance Solution Processed In3O3 Thin Film Transistor Fabricated by Femtosecond Laser Pre-Annealing Process. IEEE Access 2021, 9, 44453–44462. 10.1109/ACCESS.2021.3056774. [DOI] [Google Scholar]
- Xing R.; Xu L.; Song J.; Zhou C.; Li Q.; Liu D.; Wei Song H. Preparation and Gas Sensing Properties of In2O3/Au Nanorods for Detection of Volatile Organic Compounds in Exhaled Breath. Sci. Rep. 2015, 5, 10717. 10.1038/srep10717. [DOI] [PMC free article] [PubMed] [Google Scholar]
- Idriss H. On the Wrong Assignment of the XPS O1s Signal at 531–532 EV Attributed to Oxygen Vacancies in Photo- and Electro-Catalysts for Water Splitting and Other Materials Applications. Surf. Sci. 2021, 712, 121894 10.1016/j.susc.2021.121894. [DOI] [Google Scholar]
- Jaisutti R.; Lee M.; Kim J.; Choi S.; Ha T.-J.; Kim J.; Kim H.; Park S. K.; Kim Y.-H. Ultrasensitive Room-Temperature Operable Gas Sensors Using p-Type Na:ZnO Nanoflowers for Diabetes Detection. ACS Appl. Mater. Interfaces 2017, 9, 8796–8804. 10.1021/acsami.7b00673. [DOI] [PubMed] [Google Scholar]
- Carey J. J.; Nolan M. Enhancing the Oxygen Vacancy Formation and Migration in Bulk Chromium( iii ) Oxide by Alkali Metal Doping: A Change from Isotropic to Anisotropic Oxygen Diffusion. J. Mater. Chem. A 2017, 5, 15613–15630. 10.1039/C7TA00315C. [DOI] [Google Scholar]
- Karmakar K.; Sarkar A.; Mandal K.; Khan G. G. Investigating the Role of Oxygen Vacancies and Lattice Strain Defects on the Enhanced Photoelectrochemical Property of Alkali Metal (Li, Na, and K) Doped ZnO Nanorod Photoanodes. ChemElectroChem 2018, 5, 1147–1152. 10.1002/celc.201800097. [DOI] [Google Scholar]
- Suzuki T.; Watanabe H.; Ueno T.; Oaki Y.; Imai H. Significant Increase in Band Gap and Emission Efficiency of In2O3 Quantum Dots by Size-Tuning around 1 Nm in Supermicroporous Silicas. Langmuir 2017, 33, 3014–3017. 10.1021/acs.langmuir.6b04181. [DOI] [PubMed] [Google Scholar]
- Anand K.; Kaur J.; Singh R. C.; Thangaraj R. Structural, Optical and Gas Sensing Properties of Pure and Mn-Doped In2O3 Nanoparticles. Ceram. Int. 2016, 42, 10957–10966. 10.1016/j.ceramint.2016.03.233. [DOI] [Google Scholar]
- Prakash R.; Kumar S.; Ahmed F.; Lee C. G.; Song J. I. Room Temperature Ferromagnetism in Ni Doped In2O3 Nanoparticles. Thin Solid Films 2011, 519, 8243–8246. 10.1016/j.tsf.2011.03.105. [DOI] [Google Scholar]
- Ramalho O.; Wyart G.; Mandin C.; Blondeau P.; Cabanes P.-A.; Leclerc N.; Mullot J.-U.; Boulanger G.; Redaelli M. Association of Carbon Dioxide with Indoor Air Pollutants and Exceedance of Health Guideline Values. Build. Environ. 2015, 93, 115–124. 10.1016/j.buildenv.2015.03.018. [DOI] [Google Scholar]
- Pavani M.; Rao P. T.. Real Time Pollution Monitoring Using Wireless Sensor Networks. In 2016 IEEE 7th Annual Information Technology, Electronics and Mobile Communication Conference (IEMCON); IEEE: Vancouver, BC, Canada, 2016; pp. 1–6. 10.1109/IEMCON.2016.7746315. [DOI] [Google Scholar]
- Chen G.; Han B.; Deng S.; Wang Y.; Wang Y. Lanthanum Dioxide Carbonate La2O2CO3 Nanorods as a Sensing Material for Chemoresistive CO2 Gas Sensor. Electrochim. Acta 2014, 127, 355–361. 10.1016/j.electacta.2014.02.075. [DOI] [Google Scholar]
- Wang Y.; Zhang K.; Zou J.; Wang X.; Sun L.; Wang T.; Zhang Q. Functionalized Horizontally Aligned CNT Array and Random CNT Network for CO2 Sensing. Carbon 2017, 117, 263–270. 10.1016/j.carbon.2017.03.012. [DOI] [Google Scholar]
- Gaiardo A.; Fabbri B.; Giberti A.; Valt M.; Gherardi S.; Guidi V.; Malagù C.; Bellutti P.; Pepponi G.; Casotti D.; Cruciani G.; Zonta G.; Landini N.; Barozzi M.; Morandi S.; Vanzetti L.; Canteri R.; Della Ciana M.; Migliori A.; Demenev E. Tunable Formation of Nanostructured SiC/SiOC Core-Shell for Selective Detection of SO2. Sens. Actuators, B 2020, 305, 127485 10.1016/j.snb.2019.127485. [DOI] [Google Scholar]
- Xia Y.; Pan A.; Su Y.-Q.; Zhao S.; Li Z.; Davey A. K.; Zhao L.; Maboudian R.; Carraro C. In-Situ Synthesized N-Doped ZnO for Enhanced CO2 Sensing: Experiments and DFT Calculations. Sens. Actuators, B 2022, 357, 131359 10.1016/j.snb.2022.131359. [DOI] [Google Scholar]
- Li C.; Sakata Y.; Arai T.; Domen K.; Maruya K.; Onishi T. Carbon Monoxide and Carbon Dioxide Adsorption on Cerium Oxide Studied by Fourier-Transform Infrared Spectroscopy. Part 1.—Formation of Carbonate Species on Dehydroxylated CeO2, at Room Temperature. J. Chem. Soc., Faraday Trans. 1 1989, 85, 929. 10.1039/f19898500929. [DOI] [Google Scholar]
- Boehme I.; Weimar U.; Barsan N. Unraveling the Surface Chemistry of CO Sensing with In2O3 Based Gas Sensors. Sens. Actuators, B 2021, 326, 129004 10.1016/j.snb.2020.129004. [DOI] [Google Scholar]
- Suzuki T.; Sackmann A.; Oprea A.; Weimar U.; Bârsan N. Chemoresistive CO2 Gas Sensors Based On La2O2 CO3 : Sensing Mechanism Insights Provided by Operando Characterization. ACS Sens. 2020, 5, 2555–2562. 10.1021/acssensors.0c00882. [DOI] [PubMed] [Google Scholar]
- Can I.; Weimar U.; Barsan N.. Operando Investigations of Differently Prepared In2O3-Gas Sensors. In Proceedings of Eurosensors 2017, Paris, France, 3–6 September 2017; MDPI, 2017; p 432. 10.3390/proceedings1040432. [DOI] [Google Scholar]
- Köck E.-M.; Kogler M.; Bielz T.; Klötzer B.; Penner S. In Situ FT-IR Spectroscopic Study of CO2 and CO Adsorption on Y2O3, ZrO2, and Yttria-Stabilized ZrO2. J. Phys. Chem. C 2013, 117, 17666–17673. 10.1021/jp405625x. [DOI] [PMC free article] [PubMed] [Google Scholar]
- Harbeck S.; Szatvanyi A.; Barsan N.; Weimar U.; Hoffmann V. DRIFT Studies of Thick Film Un-Doped and Pd-Doped SnO2 Sensors: Temperature Changes Effect and CO Detection Mechanism in the Presence of Water Vapour. Thin Solid Films 2003, 436, 76–83. 10.1016/S0040-6090(03)00512-1. [DOI] [Google Scholar]
- Sahm T.; Gurlo A.; Bârsan N.; Weimar U. Basics of Oxygen and SnO2 Interaction; Work Function Change and Conductivity Measurements. Sens. Actuators, B 2006, 118, 78–83. 10.1016/j.snb.2006.04.004. [DOI] [Google Scholar]
- Barsan N.; Koziej D.; Weimar U. Metal Oxide-Based Gas Sensor Research: How To?. Sens. Actuators, B 2007, 121, 18–35. 10.1016/j.snb.2006.09.047. [DOI] [Google Scholar]
- Ji H.; Zeng W.; Li Y. Gas Sensing Mechanisms of Metal Oxide Semiconductors: A Focus Review. Nanoscale 2019, 11, 22664–22684. 10.1039/C9NR07699A. [DOI] [PubMed] [Google Scholar]
- Barsan N.; Weimar U. Conduction Model of Metal Oxide Gas Sensors. J. Electroceram. 2001, 7, 143–167. 10.1023/A:1014405811371. [DOI] [Google Scholar]
- Xiong Y.; Xue Q.; Ling C.; Lu W.; Ding D.; Zhu L.; Li X. Effective CO2 Detection Based on LaOCl-Doped SnO2 Nanofibers: Insight into the Role of Oxygen in Carrier Gas. Sens. Actuators, B 2017, 241, 725–734. 10.1016/j.snb.2016.10.143. [DOI] [Google Scholar]
- Basyooni M. A.; Shaban M.; El Sayed A. M. Enhanced Gas Sensing Properties of Spin-Coated Na-Doped ZnO Nanostructured Films. Sci. Rep. 2017, 7, 41716. 10.1038/srep41716. [DOI] [PMC free article] [PubMed] [Google Scholar]
- Konsolakis M.; Lykaki M. Recent Advances on the Rational Design of Non-Precious Metal Oxide Catalysts Exemplified by CuOx/CeO2 Binary System: Implications of Size, Shape and Electronic Effects on Intrinsic Reactivity and Metal-Support Interactions. Catalysts 2020, 10, 160. 10.3390/catal10020160. [DOI] [Google Scholar]
Associated Data
This section collects any data citations, data availability statements, or supplementary materials included in this article.