

SUMMARY
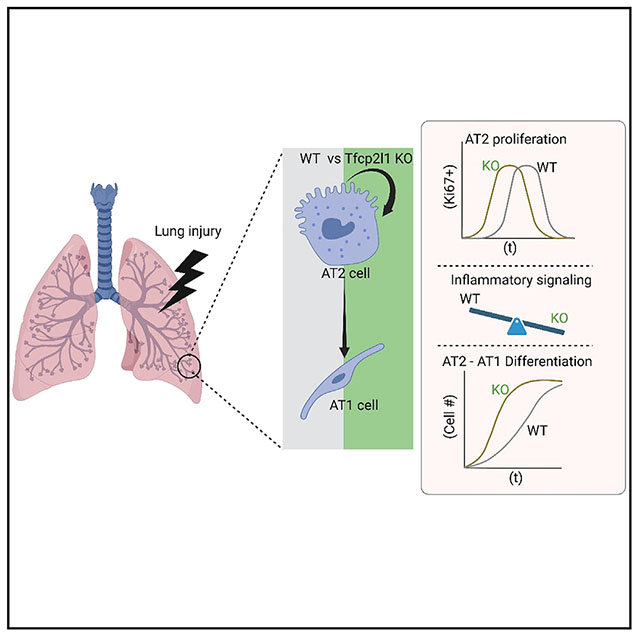
Alveolar epithelial type 2 (AT2) cells harbor the facultative progenitor capacity in the lung alveolus to drive regeneration after lung injury. Using single-cell transcriptomics, software-guided segmentation of tissue damage, and in vivo mouse lineage tracing, we identified the grainyhead transcription factor cellular promoter 2-like 1 (Tfcp2l1) as a regulator of this regenerative process. Tfcp2l1 loss in adult AT2 cells inhibits self-renewal and enhances AT2-AT1 differentiation during tissue regeneration. Conversely, Tfcp2l1 blunts the proliferative response to inflammatory signaling during the early acute injury phase. Tfcp2l1 temporally regulates AT2 self-renewal and differentiation in alveolar regions undergoing active regeneration. Single-cell transcriptomics and lineage tracing reveal that Tfcp2l1 regulates cell fate dynamics across the AT2-AT1 differentiation and restricts the inflammatory program in murine AT2 cells. Organoid modeling shows that Tfcp2l1 regulation of interleukin-1 (IL-1) receptor expression controlled these cell fate dynamics. These findings highlight the critical role Tfcp2l1 plays in balancing epithelial cell self-renewal and differentiation during alveolar regeneration.
Graphical abstract
In brief
Cardenas-Diaz et al. use single-cell transcriptomics, software-guided segmentation of tissue damage, and mouse lineage tracing to interrogate the role of Tfcp2l1 in alveolar type 2 cells during lung regeneration. Tfcp2l1 regulates cell fate dynamics across AT2-AT1 differentiation and restricts the inflammatory program in murine AT2 cells.
INTRODUCTION
Multiple forms of acute lung injury, including viral infection, can lead to acute respiratory distress syndrome (ARDS), exemplified by the coronavirus disease 2019 (COVID-19) pandemic.1 A critical challenge for the lung facing viral infection is to clear the pathogen while maintaining tissue function, particularly gas exchange within alveoli.1–3 This delicate balance involves still poorly understood crosstalk between the immune system and alveolar cell lineages, including alveolar epithelial cells. The alveolar epithelium consists of two major cell types: alveolar epithelial type 1 (AT1) cells, which cover 95% of the externalized lumen of the alveolus and are critical for gas exchange, and alveolar epithelial type 2 (AT2) cells, which secrete pulmonary surfactant to prevent alveolar collapse during respiration. The AT2 cell population also harbors facultative progenitor activity in the alveolar epithelium, demonstrated by their ability to proliferate and differentiate into AT1 cells after injury and during homeostasis.4–6 Thus, understanding the transcriptional network regulating AT2 cell proliferation and differentiation is essential for developing new methods that promote lung regeneration.
The heterogeneous nature of lung damage and regeneration complicates accurate assessment of alveolar injury models. Recent developments in single-cell technologies and computational tools for genomics analysis and unbiased segmentation of tissue damage have helped to deconvolute this complexity and facilitate our understanding of the regenerative process in the lungs.7–11 These tools have identified several molecular regulators of AT2 cell behavior during regeneration, including Wnt, Stat3, fibroblast growth factor (FGF), and interleukin-1 (IL-1) signaling.6–8,10,12–16 Despite this recent progress, the transcriptional networks that regulate the balance between AT2 self-renewal and differentiation during lung regeneration remain incompletely understood.
Transcription factor cellular promoter 2-like 1 (Tfcp2l1) is a member of the grainyhead transcription factor family and is a downstream target of the Wnt and leukemia inhibitory factor (LIF)/Stat3 signaling pathways.17–20 Tfcp2l1 is necessary and sufficient to maintain mouse embryonic stem cell (mESC) self-renewal and stemness and is also important for kidney development.17,19,21–24 Additionally, Tfcp2l1 regulates proliferation in multiple cancer cell types.25,26 Like other grainyhead transcription factors, Tfcp2l1 contains a CP2-like DNA binding domain and a dimerization motif through which it can homo- and heterodimerize with other grainyhead transcription factors.27 However, little is known about whether Tfcp2l1 is expressed in or plays a role in lung regeneration.
In this study, we have identified Tfcp2l1 as a critical transcriptional regulator of AT2 self-renewal and AT2-AT1 cell differentiation in response to multiple models of acute lung injury. Using single-cell RNA sequencing (scRNA-seq) and mouse lineage tracing techniques, we show that Tfcp2l1 expression is initiated just before birth in the AT2 cell lineage and continues to be expressed throughout adulthood. Loss of Tfcp2l1 alters the kinetics of self-renewing capacity in the AT2 cell lineage with a simultaneous increase in AT2-AT1 cell differentiation in a spatio-temporally specific manner after acute lung injury. Mechanistically, we show that Tfcp2l1 regulates an AT2 cell inflammatory code that is important for their response to certain inflammatory cytokines, including IL-1β. Single-cell lineage tracing and transcriptomics reveal that the anchoring response of AT2 cells to acute injury changes upon loss of Tfcp2l1, leading to primacy of the inflammatory expression program over cell proliferation. Our studies identify a transcriptional regulator, Tfcp2l1, that is essential for organizing the stage-dependent response of AT2 cells to acute injury and their subsequent response during alveolar regeneration in the lung.
RESULTS
Tfcp2l1 is expressed in AT2 cells in the lungs
To identify putative transcriptional regulators of AT2 cell progenitor function, we assessed gene expression differences between the Wnt-responsive AT2 subpopulation, called alveolar epithelial progenitors (AEPs), and the entire AT2 cell population in the adult mouse using RNA-seq.15 We filtered this dataset to identify transcription factors with enhanced expression in AEPs, which revealed Tfcp2l1 as one of the top differentially expressed genes (Figure 1A). Analysis of adult mouse and human lung scRNA-seq data revealed that Tfcp2l1 expression is restricted to AT2 cells in the mouse lung (Figures 1B and 1C) and human lung (Figures S1A–S1C).7 Examination of a mouse developmental time course scRNA-seq dataset revealed that the Tfcp2l1 transcript was detectable by scRNA-seq starting at approximately embryonic day 17.5 (E17.5) (Figure 1D).7 To further validate this late onset of Tfcp2l1 gene expression, we used a Tfcp2l1CreERT2; R26RtdTomato mouse line to track expression during development and into the adult. These data showed that Tfcp2l1+ cells could be identified by tamoxifen-induced recombination starting at E18.5, and expression was restricted to a subset of AT2 cells (Figure 1E). We also confirmed that human AT2 cells express enriched levels of the TFCP2L1 transcript using RNAscope (Figure S1D). To determine whether Tfcp2l1 expression was enriched in the previously described Wnt-responsive AEP subpopulation of AT2 cells, we examined Tfcp2l1 expression in Axin2+ AT2 cells in Axin2tdTomato–CreERT2; R26RYFP mice using RNAscope. Tfcp2l1 expression was detected in 43% of AEP cells and 15% of non-AEP cells, suggesting enrichment for Tfcp2l1 expression in this progenitor subpopulation (Figures S1E and S1F).
Figure 1. Tfcp2l1 is expressed in AT2 cells in the lungs.
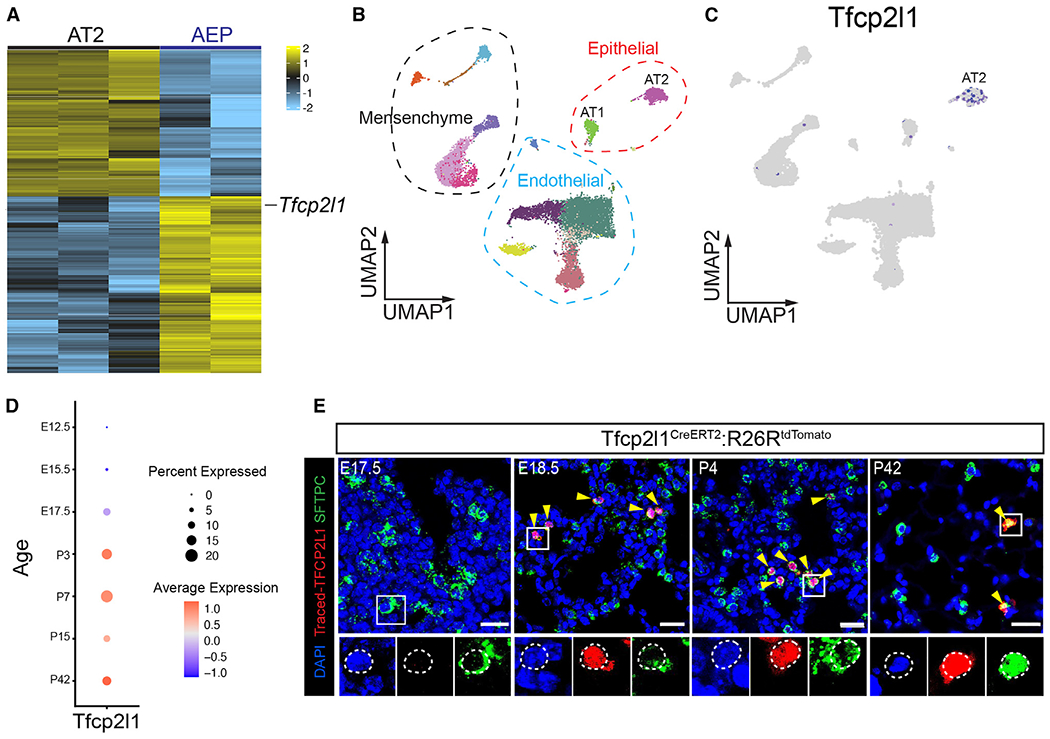
(A) RNA-seq heatmap plot showing differentially expressed genes between the AT2 and AEP cell population.
(B and C) scRNA-seq uniform manifold approximation and projection (UMAP) plot of adult mouse lung with clustering and cell type distribution showing Tfcp2l1 expression in AT2 cells of the mouse lung.
(D) Dot plot visualization derived from developmental time series of scRNA-seq data, showing Tfcp2l1 expression during mouse lung development.
(E) Time-specific lineage tracing using Tfcp2l1CreERT2:R26RtdTomato mice, showing that Tfcp2l1 expression is initiated by approximately E18.5 and is restricted to surfactant protein C (Sftpc)+ AT2 cells. Yellow arrowheads highlight lineage Tfcp2l1+/Sftpc+ cells. (Scale bars, 20 μm).
Tfcp2l1 regulates AT2 self-renewal and AT1 cell differentiation kinetics during influenza-induced lung regeneration
To determine the role of Tfcp2l1 during lung development, we generated the Tfcp2l1fl/fl; ShhCre mouse, and lung tissue was examined at post-natal day 22 (P22) and P40 (Figures S1G–S1O). Loss of Tfcp2l1 during lung development did not affect lung morphology or AT1/AT2 ratios (Figures S1G–S1O). To explore whether Tfcp2l1 plays a role in lung alveolar epithelial homeostasis, we generated SftpcCreERT2; Tfcp2l1fl/fl; R26REYFP mice (hereafter called Tfcp2l1AT2-KO) and aged them for 1 month or 1 year (Figures S2A and S2B). Tfcp2l1 inactivation in adult mouse AT2 cells did not result in altered lung morphology or changes in the slow homeostatic turnover of AT2-AT1 (Figures S2C–S2F).
To assess the role Tfcp2l1 plays after an acute infectious injury to the lungs, we subjected Tfcp2l1AT2-KO and control littermates to influenza A infection (H1N1), which results in severe and heterogeneous tissue damage followed by tissue regeneration.6,11,12,15,28 During the acute inflammatory phase of influenza A infection (7–10 days post infection), Tfcp2l1AT2–KO mutants exhibited less weight loss than control mice, suggesting a possible improvement in repair and regeneration (Figures 2A–2C). This difference normalized as Tfcp2l1AT2-KO and control mice recovered (Figure 2B). To characterize the dynamics of alveolar epithelial regeneration after viral infection, lungs from Tfcp2l1AT2-KO mutants and control mice were collected on days 10, 14, and 28 post infection (dpi) (Figure 2D). No evident changes in apoptosis were observed in AT2 lineage-traced cells at 10 dpi (Figures S2G and S2H). To examine differences in lung regeneration from loss of Tfcp2l1 expression, as reported previously, we segmented the regions of injury and regeneration into three distinct zones: normal, damaged, and severe (Figures 2E and 2F).6,11 For example, in control samples at 14 dpi in normal zones, lung tissue exhibits largely homeostatic morphology with a typical distribution of AT2 cells (Sftpc+) and AT1 cells (Ager+) (Figure 2F). In damaged zones that surround severe zones, we observe perturbed tissue morphology with dense accumulations of AT1 and AT2 cells (Figure 2F). In severe zones, the tissue architecture is greatly altered, and there is almost complete loss of alveolar epithelial cell markers with a few highly proliferative AT2 cells remaining (Figure 2F).6,11 As expected, influenza-induced injury resulted in heterogeneous alteration of lung morphology (Figures S2I–S2K). Examination of cell proliferation in AT2 lineage-traced cells of Tfcp2l1AT2-KO mutants revealed a significant increase in proliferation in normal and damages zones at 10 dpi compared with the control (Figures 2G, 2H, S3A, and S3C). However, by 14 dpi, Tfcp2l1AT2-KO mutants exhibited less AT2 cell proliferation in damaged and severe zones compared with controls (Figures 2G, 2H, S3A, S3C, S3E, and S3F). Assessment of cell proliferation at 28 dpi demonstrated that AT2 proliferation had decreased in Tfcp2l1AT2-KO mutants and controls with no significant difference between the genotypes, similar to homeostatic conditions (Figures 2G, 2H, S3A, and S3C). To interrogate phenotypes related to AT2-AT1 differentiation, Hopx immunostaining was used because it facilitates quantification of AT2 to AT1 cell differentiation because of its nuclear expression (Figures S3H and S3I). This analysis shows that AT2-AT1 differentiation occurs at a much higher rate in Tfcp2l1AT2-KO mutants in damaged zones at 14 dpi but normalizes by 28 dpi (Figures 2I, 2J, S3B, S3D, and S3G). These data suggest that Tfcp2l1 initially suppresses and then promotes AT2 cell proliferation while inhibiting AT1 differentiation after acute injury (Figure 2K).
Figure 2. Tfcp2l1 regulates AT2 self-renewal and AT1 cell differentiation kinetics during influenza-induced lung regeneration.
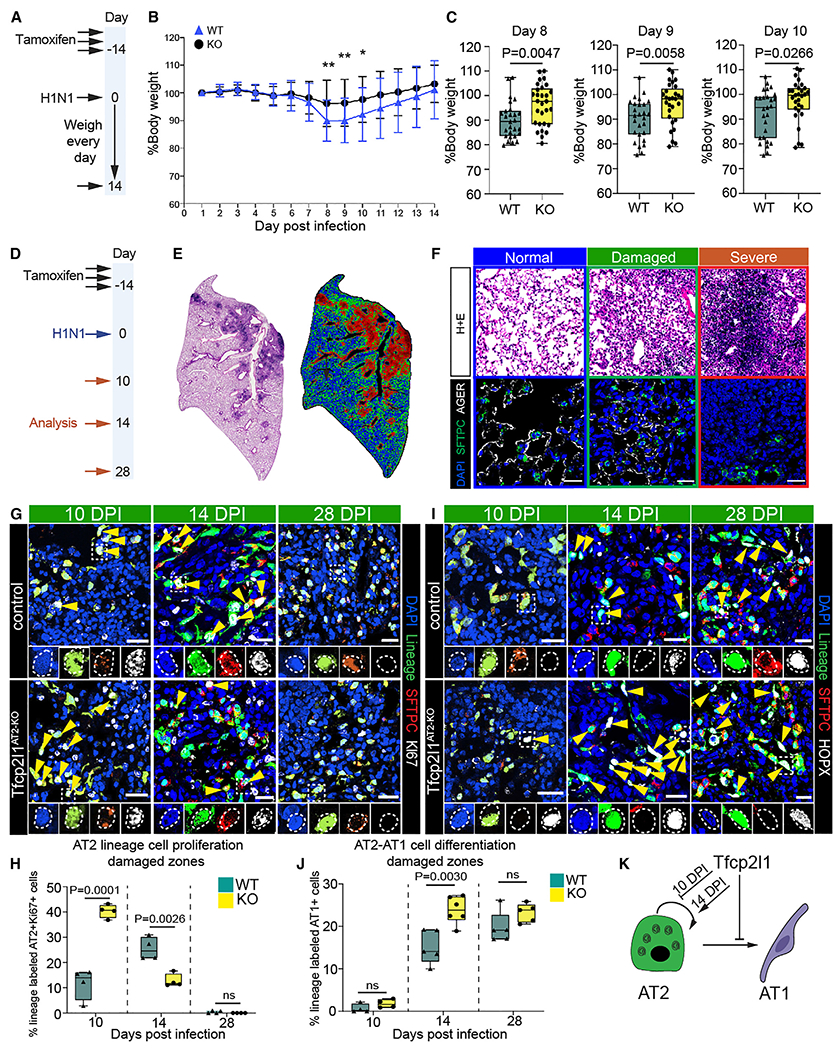
(A) Experimental plan showing tamoxifen treatment and influenza infection and timing to record loss weight.
(B) Percentage of body weight for 14 days post influenza infection.
(C) Body weight quantification from days 8–10. n = 27 control mice and 29 mutant mice.
(D) Experimental schematic showing tamoxifen treatment, influenza infection, and the timing to examine mouse lungs.
(E) Left: H&E stain 14 days post infection (dpi). Right: cluster injury zone map generated from the H&E picture.
(F) Top row: H&E pictures representing the injury zones found at 14 dpi. Colors outlining each box represent different injury zones (blue, normal; green, damaged; red, severe; scale bars, 100 μm). Bottom row: IHC pictures for SFTPC, AGER, and DAPI in the three different injury zones (scale bars, 20 μm).
(G) Immunohistochemistry (IHC) for the AT2 cell lineage markers enhanced yellow fluorescent protein (EYFP), SFTPC, and Ki67 in damaged zones 10, 14, and 28 dpi with highlighted areas to show co-staining of markers (scale bars, 20μm).
(H) Quantification of lineage-traced proliferative AT2 cells in damaged injury zones 10, 14, and 28 dpi.
(I) IHC for the AT2 cell lineage markers EYFP, SFTPC, and HOPX in damaged zones 10, 14, and 28 dpi (with highlighted areas to show co-staining of markers and yellow arrowheads indicating AT1 cell-derived AT2 cells (scale bars, 20 μm).
(J) Quantification of AT1 cell-derived AT2 cells in damaged injury zones 10, 14, and 28 dpi.
(K) Summary diagram showing that Tfcp2l1 represses AT2 self-renewal and AT1 cell differentiation.
All quantification data are represented as mean ± SEM. Two-tailed t test p values are shown; n = 4–5 mice per group.
Tfcp2l1 regulates AT2 cell-mediated alveolar regeneration in a spatial and temporal manner
Our data show that Tfcp2l1 regulates the balance between proliferation and differentiation at 14 days post influenza infection. To determine whether Tfcp2l1AT2-KO cells have altered proliferation kinetics earlier in response to injury, we employed a non-infectious hyperoxia-induced acute lung injury (HALI) model to induce a more homogeneous lung injury (Figure 3A).11,29–32 The HALI model allows precise timing of injury and regeneration because of the lack of ongoing infection and damage in the infectious influenza model. To interrogate cell proliferation during the early inflammatory phase of this injury prior to AT1 cell differentiation, we subjected Tfcp2l1AT2-KO mutants and controls to 72 h of HALI. Mice were then pulsed with 5-ethynyl-2-deoxyuridine (EdU) 4 h before collecting lung tissue 3 days post HALI. Flow cytometry revealed an increase in EdU+ Tfcp2l1-deficient AT2 3 days post HALI (Figures 3B and 3C). To determine whether this increase in AT2 cell proliferation is due to the earlier time point assessed or due to a different injury model, we performed histological analysis on control and mutant mice 7 days post HALI. At this time point, we observed the stochastic emergence of fibrosis, consistent with previous reports.11,30,33 We used the same unbiased computational imaging approach as described previously to bin our analysis into three injury zones: normal (variable AT2 cell proliferation), damaged (highly proliferative AT2 cells and AT2-AT1 differentiation), and severe (ACTA2+ fibrotic foci with few AT2 and AT1 cells) (Figures 3D–3G).6,11 Quantification of AT2 cell proliferation demonstrated a statistically significant decrease in Tfcp2l1AT2-KO mutant AT2 cell proliferation 7 days after HALI (Figures 3H–3J). We also found that Tfcp2l1AT2-KO AT2 cells differentiated into AT1 cells at a higher rate compared with controls 7 days after HALI, similar to what we observed 14 days after influenza-induced lung injury (Figures 3K–3M). These data suggest that Tfcp2l1 regulates a precise temporal response to acute lung injury, repressing early AT2 cell proliferation, then subsequently becoming essential for AT2 cell proliferation and AT2-AT1 cell differentiation during the peak of the regenerative process.
Figure 3. Tfcp2l1 regulates AT2 cell-mediated alveolar regeneration in a spatial and temporal manner.
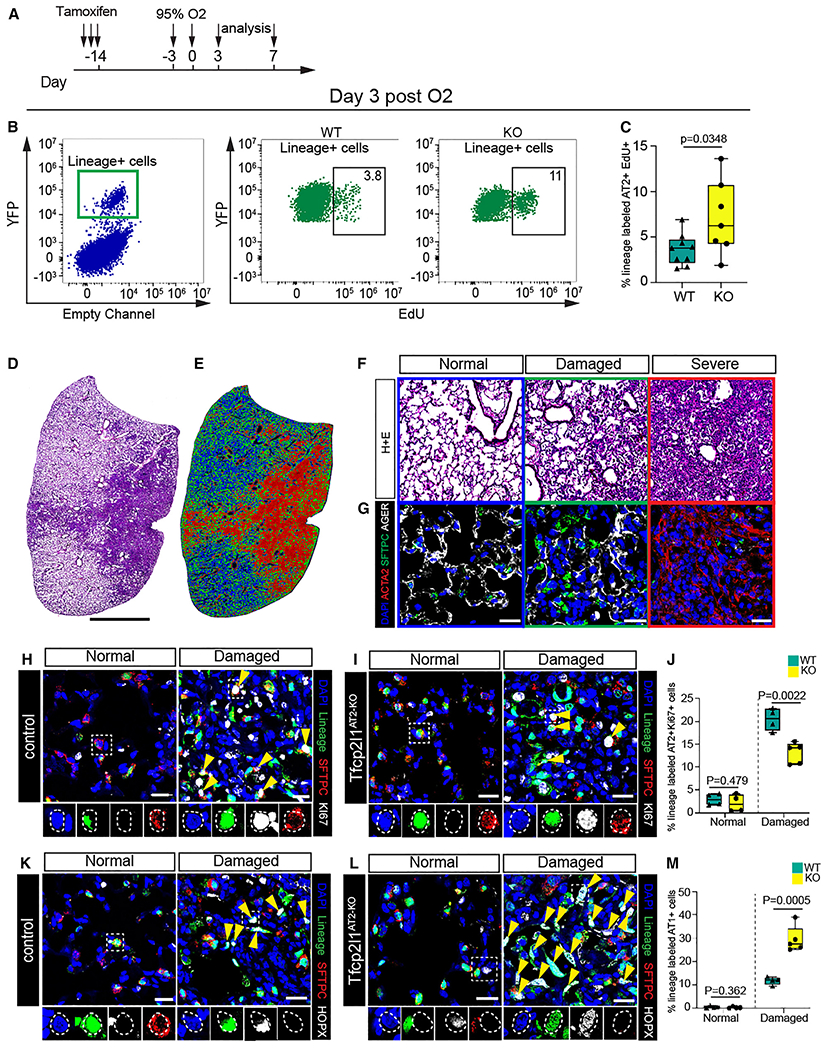
(A) Experimental schematic showing tamoxifen treatment and exposure to hyperoxia with different timing for analysis.
(B) Flow cytometry quantification of EdU and lineage-traced EYFP cells on day 3 post hyperoxia exposure.
(C) Quantification of lineage-traced EYFP and EdU+ cells on day 3 post hyperoxia exposure (n = 7–9 mice per group).
(D and E) Left: H&E stain 7 days post hyperoxia exposure. Right: cluster injury zone map generated from the H&E picture.
(F) H&E pictures; each box panel is a representative picture of the injury zones found 7 days post hyperoxia exposure. Colors in each boxed represent different injury zones (blue, normal; green, damaged; red, severe).
(G) IHC pictures for SFTPC, AGER, and smooth muscle alpha-actin (αSMA) in the three different injury zones (scale bars, 20 μm).
(H and I) IHC for the AT2 cell lineage markers EYFP, SFTPC, and Ki67 in normal and damaged injury zones 7 days post hyperoxia exposure of control and Tfcp2l1AT2-KO mutants, with dashed white boxes and yellow arrowheads highlighting proliferative lineage-traced AT2 cells (scale bars, 20 μm).
(J) Quantification of lineage-traced proliferative AT2 cells in different injury zones 7 days post hyperoxia exposure.
(K and L) IHC for the AT2 cell lineage markers EYFP, SFTPC, and HOPX in normal and damaged zones 7 days post hyperoxia exposure of control and Tfcp2l1AT2-KO mutants, with dashed white boxes and yellow arrowheads highlighting AT1 cells derived from AT2 cells (scale bars, 20 μm).
(M) Quantification of AT1 cell-derived AT2 cells in normal and damaged injury zones 7 days post hyperoxia exposure.
All quantification data are represented as mean ± SEM. Two-tailed t test p values are shown; n = 4–5 mice per group.
Loss of Tfcp2l1 leads to altered AT2 cell transcriptional states and increased traffic across the AT2-AT1 differentiation axis
To determine how Tfcp2l1 regulates AT2-specific cell state changes during regeneration, we isolated SftpcCreERT2 lineage traced cells from Tfcp2l1AT2-KO and control animals 14 dpi by fluorescence-activated cell sorting (FACS) and performed scRNA-seq analysis (Figure 4A). The 14-day post-influenza infection point was used because proliferation and differentiation are occurring and affected by the loss of Tfcp2l1 at this time. Control and Tfcp2l1AT2-KO mutant scRNA-seq datasets were merged, which revealed six distinct cell clusters (Figures 4B and 4C). As expected, we observed a cluster consisting of canonical AT1 cells, one cluster resembling the previously described transition state between AT2-AT1 cells,8–10 and four clusters correlating to various other subtypes of AT2 cells (Figure 4C). In addition, the AT2b and AT2/AT1 transition clusters were over-represented in the Tfcp2l1AT2-KO mutants (Figure 4D). The AT2b cluster is marked by increased expression of genes relating to what has been described previously as a primed or activated AT2 cell state, including Lcn2, Dmkn, and Lrg1 (Figure 4E).8,10
Figure 4. Loss of Tfcp2l1 leads to altered AT2 cell transcriptional states and increased traffic across the AT2-AT1 differentiation axis.
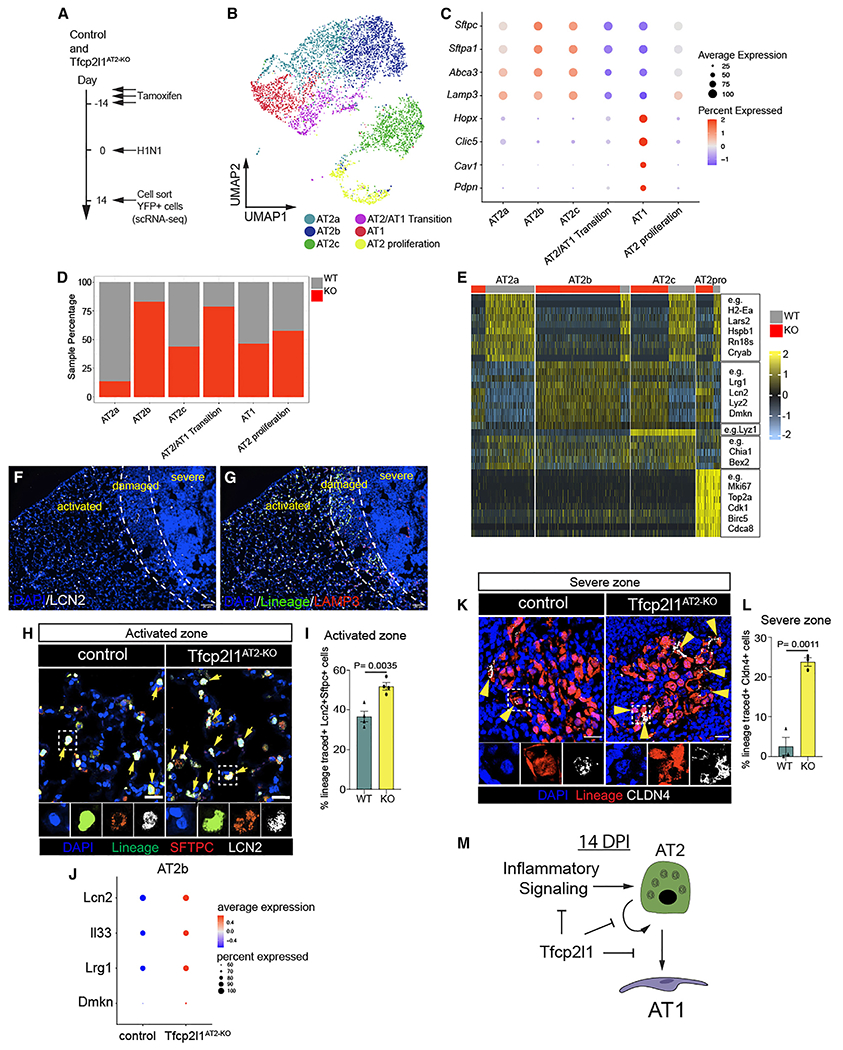
(A) Experimental schematic showing tamoxifen treatment, influenza infection, and the timing to sort lineage-traced EYFP cells to generate single-cell RNA sequencing (scRNA-seq) libraries from control and Tfcp2l1AT2-KO mice.
(B) Merged scRNA-seq data, showing a UMAP plot of control and Tfcp2l1AT2-KO mice 14 dpi.
(C) Dot plot graph from merged scRNA-seq data with AT1 and AT2 canonical markers by cell clusters.
(D) Cell percentage distribution per cell cluster.
(E) Heatmap plot showing differentially expressed genes per cell cluster.
(F) IHC for LCN2 across the different zones of injury and regeneration 14 dpi.
(G) IHC for the AT2 cell lineage markers EYFP, LAMP3, and LCN2 in activated zones 14 dpi.
(H) IHC at high magnification of EYFP, LAMP3, and LCN2 in activated zones of control and Tfcp2l1AT2-KO mice at 14 dpi (scale bars, 20 μm).
(I) Quantification of LCN2+ AT2 cells in activated injury zones 14 dpi.
(J) AT2b cell cluster dot plot displaying Lcn2, Il33, Lrg1, and Dmkn expression between control and Tfcp2l1AT2-KO mice.
(K) IHC for the AT2 cell lineage marker EYFP and CLDN4 in severe zones 14 dpi; white boxes indicate magnified areas, and yellow arrowheads indicate CLDN4+ cells in lineage-traced cells (scale bars, 20 μm).
(L) Quantification CLDN4+ lineage-traced cells in severe injury zones 14 dpi. (M) Summary diagram showing that Tfcp2l1 represses inflammatory signaling, AT2 self-renewal, and AT1 cell differentiation.
All quantification data are represented as mean ± SEM. Two-tailed t tests, not significant; p ≤ 0.05; n = 3–5 mice per group.
To determine which AT2 cell states emerge because of influenza infection and subsequent tissue regeneration, we generated scRNA-seq data from AT2 lineage-traced cells sorted from uninfected mice and compared uninjured AT2 cells with those exposed to influenza, as described above, at 14 dpi. This comparison revealed three AT2-specific cell states after influenza injury, including one proliferative cluster (cluster 6) and three non-proliferative clusters (clusters 1, 2, and 4). (Figures S4A–S4C). The major difference between the two non-proliferative clusters is expression of the gene Lyz1 in cluster 2 versus cluster 1 (Figures S4D–S4F). Analysis of clusters 1 and 2 reveals dramatic upregulation of pathways associated with immune effector response, antigen processing, and other immune-related phenomena (Figure S4G). In addition, clusters 1 and 2 in this analysis are similar to AT2b in the control versus Tfcp2l1AT2-KO mutant analysis (Figure 4E), indicating that loss of Tfcp2l1 leads to increased numbers of this inflammatory response state in AT2 cells (Figures 4E, S4E, and S4G). We also examined Tfcp2l1 gene expression before and after infection and did not observe a significant change because of viral infection (Figure S5A).
We next assessed the location of AT2 cells expressing the inflammatory response pathways by examining Lcn2 expression, a marker of the inflammatory AT2b cluster, at 14 dpi in control and Tfcp2l1AT2-KO mutant lungs (Figure 4F). Lcn2+ AT2 cells were present in control normal regions but found at lower numbers in damaged regions undergoing regeneration and essentially absent in the severe regions of control and Tfcp2l1AT2-KO mutants (Figures 4F, 4G, and S5B). Interestingly, Lcn2+ AT2 cells were increased in number in Tfcp2l1AT2-KO mutant normal zones (Figures 4H and 4I). Moreover, the genes that define this inflammatory AT2b cluster are significantly increased in Tfcp2l1AT2-KO mutant AT2 cells (Figure 4J). Because AT2 cells in what we described previously as a “normal” zone have elevated levels of an inflammatory gene signature, including Lcn2, we renamed this region the “activated” zone to indicate that AT2 cells in morphologically unperturbed lung tissue react to injury and respond by activating an inflammatory program.
The AT2/AT1 transition cluster is enriched in genes identified previously as transitional AT2-AT1 cell state markers, including Ly6a, Tnip3, and Cldn4 (Figures S5C–S5E).8–10 To determine the relative abundance and localization of control and Tfcp2l1-deficient AT2-AT1 transition state cells during regeneration, we quantified the percentage of EYFP+ lineage-traced cells expressing Cldn4 14 days after influenza infection in control and Tfcp2l1AT2-KO mutants. While we observed only a small percentage of cells expressing Cldn4 in control animals, these cells were most frequently detected in severe zones and were increased in Tfcp2l1AT2-KO mutants, suggesting increased traffic across the AT2-AT1 differentiation border (Figures 4K, 4L, S5D, and S5E). Control and mutant samples generated an AT1 cell cluster characterized by expression of AT1 canonical markers like Hopx, Pdpn, Cav1, and others (Figures 4C and S5D). Thus, loss of Tfcp2l1 leads to alterations in the ratio of AT2 cell subsets, an increase in the AT2b inflammatory state, and increased traffic across the AT2/AT1 differentiation axis (Figure 4M).
Loss of Tfcp2l1 disrupts stage-specific transcriptional dynamics during AT2 cell regeneration
The alterations in the ratio of the inflammatory AT2b and AT2-AT1 transition state subpopulations suggested a change in the transcriptional response and trajectory of AT2 cells upon injury in the absence of Tfcp2l1. We applied the diffusion map (DM) algorithm to each scRNA-seq dataset as our data reduction approach. This method constructs potential differentiation trajectories but gives no directionality. We combined RNA velocity algorithms to predict direction in the DM34 (Figures 5A and 5B). We next used scVelo to compute velocity vectors based on RNA expression and splicing parameters (Figures 5C and 5D).35,36 While these methods can refine the directionally further by predicting cells age based on transcriptional dynamics referred to as “latent time,” a distinct advantage in our analysis is that we know the start state based on SftpcCreERT lineage tracing (homeostatic AT2 fate) and the end state (AT1 fate).
Figure 5. Loss of Tfcp2l1 disrupts stage-specific transcriptional dynamics during AT2 cell regeneration.
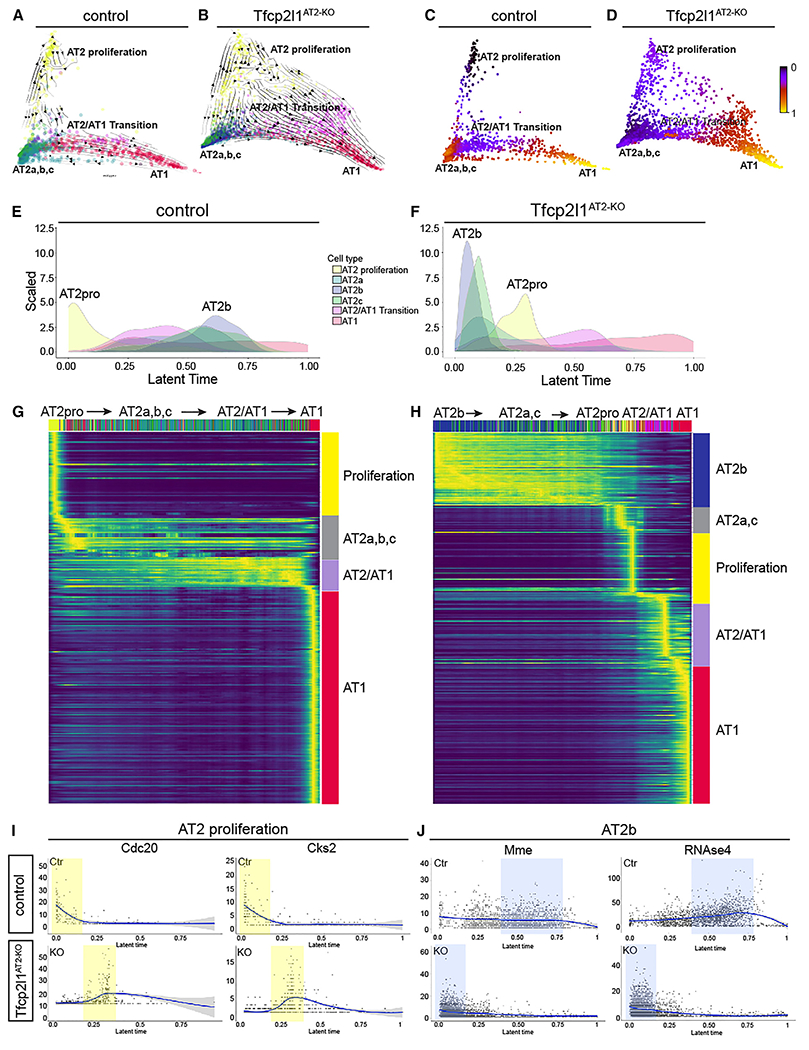
(A and B) scVelo directionality overlaid onto DM reduction of control and Tfcp2l1AT2-KO data 14 dpi.
(C and D) Latent time data inferred from scVelo mapped on the DM as a spectrum of transcriptional changes from a prime or 0 state (blue) to an end state (yellow) in control and Tfcp2l1AT2-KO mutants. Of note, control and Tfcp2l1AT2-KO mutant trajectories end in the AT1 state.
(E and F) Density histograms displaying the distribution of AT2 cell states based on latent time of lineage-traced control and Tfcp2l1AT2-KO AT2 cells. (G and H) Gene expression dynamics resolved along latent time, showing AT2 cell state changes in lineage-traced control and Tfcp2l1AT2-KO AT2 cells.
(I and J) Expression dynamics of example driver genes along latent time (I) Cdc20 and Cks2, control (top), and Tfcp2l1AT2-KO (bottom).
(J) Mme and RNAse4 control (top) and Tfcp2l1AT2-KO (bottom). The proliferation state is shaded in yellow, and the AT2b state is shaded in blue.
In control lungs, the AT2 cell proliferation state is the prime anchor state, with AT1 cells being the final end state at 14 dpi (Figure 5A). However, the DM of Tfcp2l1AT2-KO lineage-traced AT2 cells shows that AT2a, AT2b, and AT2c clusters are the prime anchor state, with the proliferation state arising later in latent time (Figure 5B). This was confirmed by mapping latent time as a spectrum on top of the DM, which also shows a switch from proliferation to AT2a, AT2b, and AT2c as the prime or 0 state for Tfcp2l1AT2-KO lineage-traced AT2 cells (Figures 5C and 5D).35,36 To better understand the fate of AT2 cells upon loss of Tfcp2l1, linear ordering of the various cell states existing in the lineage-traced cells was plotted using a histogram function and shows a clear switch of prime transcriptional states, with AT2b instead of AT2 proliferation positioned as the latent time origin in Tfcp2l1AT2-KO traced cells (Figures 5E and 5F). In all analyses, control and Tfcp2l1AT2-KO mutant lineage-traced cells end on the AT1 cell fate, which is supported by our lineage tracing (Figures 5A–5H). These data suggest a reordering of the cell states that are derived from lineage-traced Tfcp2l1-null AT2 cells 14 days after influenza infection, with a switch from the proliferative to the inflammatory reactive AT2b state.
Genes that showed high degrees of transcriptional dynamics were used to assess the gene expression programs that differentially guided control and Tfcp2l1AT2-KO mutant lineage-traced AT2 cells through their response to acute injury (Figures 5G, 5H, S6A, and S6B). Control lineage-traced AT2 cells exhibited enrichment in cell growth, wound healing, and cell development gene expression programs (Figure S6C). In contrast, the response of Tfcp2l1AT2-KO mutant lineage-traced AT2 cells was driven by changes in cell adhesion, epithelial migration, and cell morphogenesis programs (Figure S6D). Latent time analysis shows that ordering of cells expressing two proliferation-associated genes, Cdc20 and Cks2, was altered between control and Tfcp2l1AT2-KO mutants (Figure 5I). Similar but contrasting changes were observed by examining two AT2b-specific genes, Mme and RNAse4 (Figure 5J). These data demonstrate that loss of Tfcp2l1 disrupts AT2 cell states during lung regeneration, leading to altered transcriptional dynamics and a reordering of the staged response across latent time.
Deep transcriptome analysis of lineage-traced Tfcp2l1-deficient AT2 cells reveals enhanced sensitivity to the post-injury inflammatory milieu
While scRNA-seq can provide important information regarding changes in cell state, the ability to quantitate changes in gene expression remains somewhat limited. To better understand the extensive quantitative changes in gene expression in AT2 cells as they respond to acute lung injury in the absence of Tfcp2l1 expression, we performed standard RNA-seq analysis on lineage-traced cells from control and Tfcp2l1AT2-KO mutants (Figure 6A). Differential gene expression between control and Tfcp2l1-deficient lineage traced cells revealed 386 genes upregulated and 195 genes down-regulated (Figure 6B). Gene set enrichment analysis identified several categories of genes down-regulated in Tfcp2l1AT2-KO mutants, including those related to cell proliferation, such as E2F targets, MYC targets, and G2M checkpoint (Figure 6C). The top target genes driving the changes in the E2F proliferation-related pathway include Cdc20, Cdkn3, Mxd3, and Top2a (Figure 6D). Interestingly, genes related to inflammatory pathways were upregulated in Tfcp2l1-deficient lineage-traced cells (Figure 6C). The top target genes driving upregulation of the inflammatory response pathway include Il7r, Ccr7, Cd69, Il1a, and Il1r1 (Figure 6E). Additionally, we identified enrichment in AT1 cell markers in Tfcp2l1-deficient cells, such as Sema3e, Limch, Sema3a, Cav1, Clic5, and Hopx, correlating with an increase in AT2-AT1 differentiation (Figure S6E). Several of these gene expression changes were confirmed by qPCR (Figures 6F, 6G, and S6F). Interestingly, while previous work has suggested that Tfcp2l1 is a target of Wnt signaling,18 its expression was not altered by treatment of AT2-derived organoids with a Wnt-activating Gsk3b inhibitor (Figures S6G and S6H). Axin2 expression was induced in these organoids, confirming Wnt activation (Figure S6H). To further identify direct targets for Tfcp2l1 in AT2 cells, we examined a previous dataset generated using a single-cell assay for transposase-accessible chromatin (scATAC-seq), identifying open chromatin regions near promoters of AT2-expressed genes. This analysis revealed several cell proliferation genes containing Tfcp2l1 DNA binding sites in their promoters that were down-regulated in Tfcp2l1-deficient AT2 cells: Cks2, Mki67, Spc25, and Top2a (Figures S7A–S7F). These data reveal the dramatic changes in cell proliferation and inflammatory programs upon loss of Tfcp2l1 in regenerating AT2 cells.
Figure 6. Deep transcriptome analysis of lineage-traced Tfcp2l1-deficient AT2 cells reveals enhanced sensitivity to the post-injury inflammatory milieu.
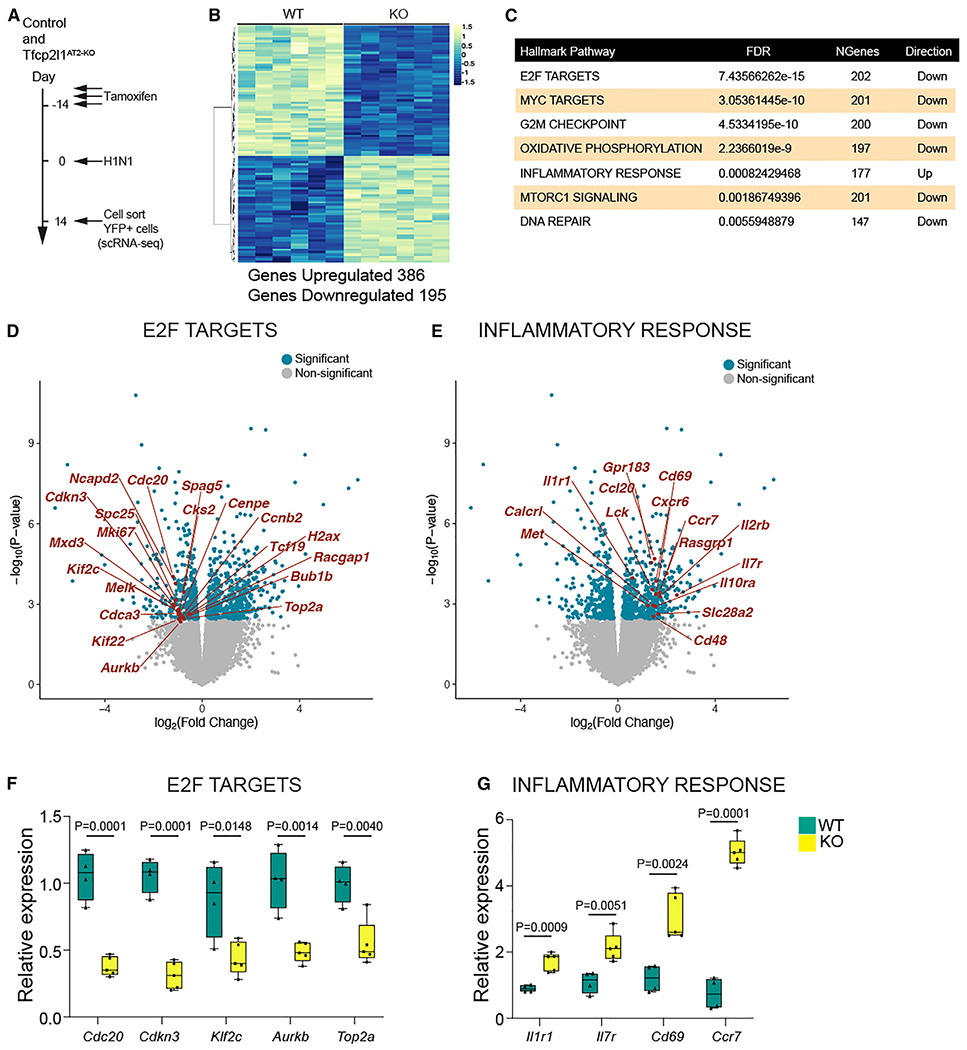
(A) Experimental schematic showing tamoxifen treatment, influenza infection, and the timing to sort lineage-traced EYFP cells to generate bulk RNA-seq libraries from control and Tfcp2l1AT2-KO mice.
(B) Differential expression heatmap comparing control and Tfcp2l1AT2-KO mutants (n = 6).
(C) Hallmark database gene set enrichment analysis of differentially expressed genes between control and Tfcp2l1AT2-KO mice 14 dpi.
(D and E) Volcano plots from RNA-seq data control and Tfcp2l1AT2-KO mice 14 dpi, with dark blue dots indicating statistically significant different genes between control and Tfcp2l1AT2-KO in the E2F and inflammatory response categories (adjusted p < 0.05). An example gene in each category is highlighted in red.
(F and G) qPCR gene expression validation of a subset of differentially expressed genes in the E2F and inflammatory response categories (control, n = 4; Tfcp2l1AT2-KO, n = 5).
Tfcp2l1 restrains the AT2 cell response to IL-1 signaling
To better understand the response of Tfcp2l1-deficient AT2 cells to the inflammatory environment, we utilized an AT2 alveolar organoid model (Figures 7A and 7B).6,11,37 Because our transcriptomic analysis showed increased expression of multiple inflammatory cytokine receptors in Tfcp2l1-deficient AT2 cells, including Il1r1 (Figures 6E and 6G), we examined whether these cells would respond in an enhanced manner to exogenous IL-1β exposure. IL-1 signaling regulates AT2 cell growth and proliferation.6,8,12,37 IL-1β treatment increased organoid size in AT2 Tfcp2l1AT2-KO cells (Figure 7C). We quantified AT2 and AT1 ratios in an organoid formation assay, but both genotypes presented similar differentiation efficiency with or without IL-1β treatment (Figures S7H–S7L). These data suggest that Tfcp2l1 suppresses AT2 cell proliferation and AT2 cell responsiveness to IL-1β signaling (Figure 7D). These data help explain why loss of Tfcp2l1 promotes AT2 proliferation at 10 dpi, when the inflammatory environment and IL-1b expression are still high, subsequently leading to loss of proliferation later at 14 dpi through regulation of core cell proliferation genes (Figures 2 and 6). Because inflammatory cytokine expression is highest in the early stages of post-injury repair and regeneration,38,39 these data support a model where Tfcp2l1 dampens the early response to the inflammatory milieu through control of Il1r1 and other cytokine receptors but is required in later stages of the regenerative process to balance AT2 self-renewal and AT2-AT1 differentiation (Figure 7E).
Figure 7. Tfcp2l1 restrains the AT2 cell response to IL-1 signaling.
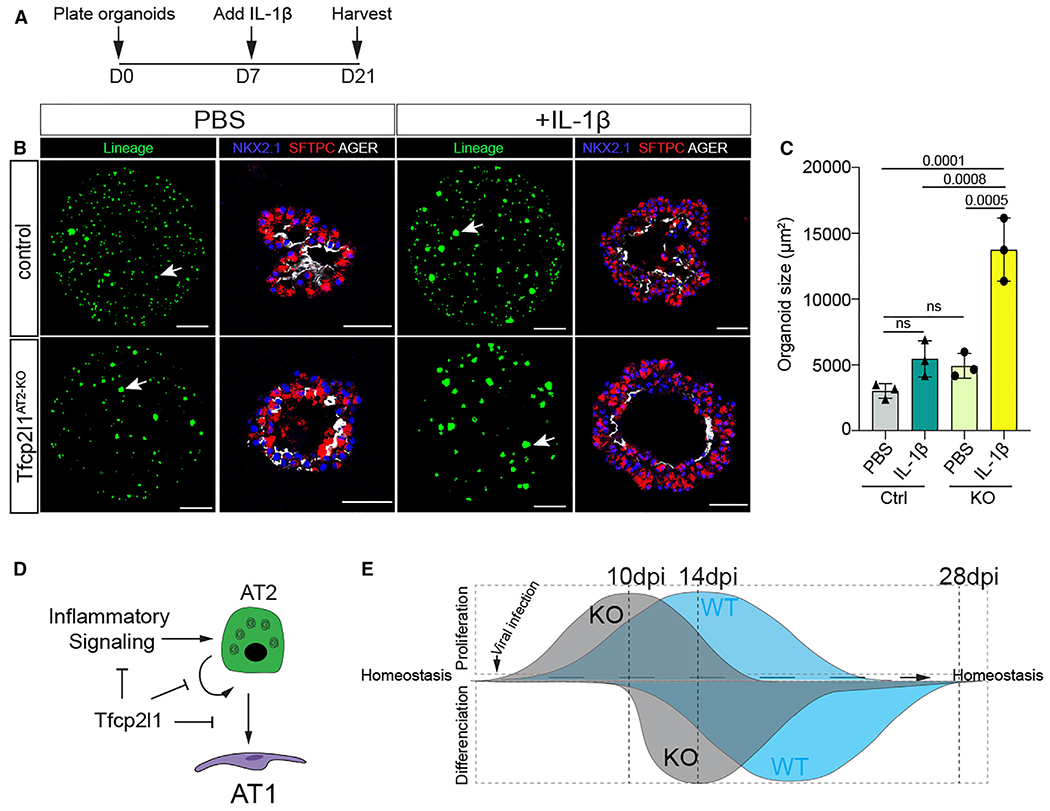
(A) Experimental schematic showing the days for cytokine treatments and duration of organoid culture.
(B) Organoids treated with PBS or IL-1b as noted. Lineage-marked cells are from native EYFP fluorescence, and IHC on sections for SFTPC and AGER expression reveals AT2 and AT1 cells, respectively (lineage panel bar graph, 1,000 μm; IHC bar graph, 50 μm).
(C) Quantification of organoid size after 21 days in culture, comparing PBS and IL-1β in control and Tfcp2l1AT2-KO.
(D) Summary diagram showing that Tfcp2l1 represses AT2 cell proliferation and inflammatory signaling.
(E) Left: Tfcp2l1 is enriched in AT2 cells. The lack of Tfcp2l1 transient increases cell proliferation during lung regeneration. Right: Tfcp2l1 maintains AT2 cell identity and reduces AT2-AT1 cell differentiation.
All data quantification data are represented as mean ± SEM. two-way ANOVA, Tukey test, and not significant; p ≤ 0.05, n = 3 mice per group.
DISCUSSION
The transcriptional networks regulating AT2 cell-mediated lung alveolar regeneration are not well understood. We identify Tfcp2l1 as an AT2 cell lineage-restricted transcription factor that regulates AT2 cell self-renewal and differentiation in a spatial and temporal manner after acute injury. Tfcp2l1 regulates a complex transcriptional network that includes cell cycle drivers and inflammatory signaling, repressing the AT2 cell response to the exaggerated levels of inflammatory cytokines during the acute response early after injury but promoting AT2 self-renewal and restricting AT1 differentiation later in the active regeneration process. Such precise balancing of the response by a resident epithelial progenitor is critical to ensure that it is not over-stimulated by the intense inflammatory environment observed after acute tissue injury to the lung but remains responsive to mitogenic signals later in the regenerative process.
Previous studies have shown that Wnt signaling drives and maintains AT2 cell fate during lung development and alveolar regeneration through regulation of Wnt responsiveness in a subset of AT2 cells.6,11,13,15,40–42 Tfcp2l1 is known to be a direct target of Wnt signaling, transmitting the actions of this pathway to regulate the pluripotent stem cell (PSC) state.17,18,20–22,24,43 Our study shows that Tfcp2l1 expression emerges and increases in parallel with the second wave of Wnt signaling during sacculation and alveologenesis, which plays a key role in establishing and maturing the AT2 cell lineage.40 This expression timing and pattern also parallel the emergence of the Axin2+ AT2 subset called AEPs.15
AT2 cells are facultative stem cells within the lung alveolus, playing critical roles in surfactant production and maintenance and exhibiting the capacity to rapidly re-enter the cell cycle and differentiate into AT1 cells (reviewed in Leach and Morrisey44). In PSCs, Tfcp2l1 is phosphorylated by Cdk1, which regulates its ability to promote cell proliferation.19 Tfcp2l1 also regulates Esrrb to promote PSC self-renewal.22 Increased expression of Tfcp2l1 in lung and bladder cancer has been linked to poor prognosis and aggressive phenotypes, whereas decreased expression has been linked to a decrease in cancer progression.19,26 Cdk1 phosphorylation of Tfcp2l1 also appears to regulate its ability to promote proliferation in bladder cancer.19,45 Together, these findings reveal an integral role of Tfcp2l1 in transmitting Wnt signals to promote cell cycle progression in multiple stem cell lineages, including AT2 cells.
Our original definition of the three major zones of responses to acute lung injury defined the morphologically unperturbed zone as “normal.”6,11 However, our current data reveal that AT2 cells exhibit a significant transcriptional response to acute lung injury in this region. Markers of the inflammatory reactive AT2b cluster, such as Lcn2, are found almost exclusively in what we referred to previously as normal regions. This has led us to rename this region “activated.” Activated AT2 cells in injured lungs increase overall, and their transcriptional response is enhanced upon loss of Tfcp2l1. While previous studies have identified similar AT2 cell subpopulations,8,10 the spatial location of this unique subpopulation has remained unclear, as has the transcriptional network that regulates it. We show that Tfcp2l1-deficient AT2 cells upregulate IL1r1a, the receptor for IL-1β, and proliferate faster during early lung regeneration and in organoid cultures when exposed to exogenous IL-1β. These results suggest that Tfcp2l1 regulates AT2 cell receptivity to inflammatory signaling that occurs during the early stages of lung regeneration. However, later in the regenerative cycle, Tfcp2l1 is essential for balancing the proliferative and differentiation response of AT2 cells. One possible explanation for this bimodal response is that Tfcp2l1 is important in suppressing the proliferative response to an overly exuberant inflammatory setting where continuous mitogenic inputs into AT2 cells could increase their susceptibility to oncogenic conversion.
Several studies have identified the presence of a transient intermediate state during AT2-AT1 cell differentiation.8–10 14 days post influenza infection, we observed that this generally rare population is primarily restricted to severe zones where AT2 cells have not yet differentiated into AT1 cells. Loss of Tfcp2l1 in AT2 cells increases the number of cells expressing markers of this transient state in severe zones while increasing AT2-AT1 differentiation in the damaged zone. These results across different injury zones reinforce the concept that Tfcp2l1 maintains AT2 cell identity via multiple mechanisms, suppressing premature AT1 differentiation.
The molecular pathways that help balance the temporal response to acute tissue injury, particularly the altered inflammatory environment after injury, remain incompletely understood. Our studies suggest that Tfcp2l1 regulates proliferative and inflammatory responsive gene programs to impede exuberant proliferation during the early inflammatory stage of acute injury but promote the necessary proliferation of AT2 cells later in the regenerative process after injury. Such tight control of these pathways underscores the necessity to control the epithelial response to acute injury and balance the timing and extent of the pro-regenerative processes to achieve effective and functional tissue regeneration.
Limitations of the study
Our study has identified the critical role of the transcription factor Tfcp2l1 in maintaining the fate of AT2 cells and its significance for lung regeneration. Specifically, we observed that Tfcp2l1 regulates the cellular states of AT2 cells, leading to increased inflammatory response and differentiation into AT1 cells. The basis for these findings was derived from lineage tracing and single-cell transcriptomics. Single-cell transcriptomics is limited to the time when cells are collected and use of trajectory analysis such as RNA velocity and diffusion mapping. Our interpretations are based on an acute viral infection model, and the relevance of TFCP2L1 in human lung regeneration has yet to be determined. Finally, the mouse alveolar organoid models have certain limitations, particularly regarding co-culture of AT2 cells with mesenchymal cells and the cell-intrinsic effects of Tfcp2l1 expression in AT2 cells.
STAR★METHODS
RESOURCE AVAILABILITY
Lead contact
Inquiry or request for further resource and/or information related to this study, contact Edward E. Morrisey (emorrise@pennmedicine.upenn.edu).
Materials availability
Mouse models used in this study can be requested to the Jackson laboratory or contact Edward E. Morrisey (emorrise@pennmedicine.upenn.edu).
Data and code availability
All data reported in this paper will be shared by the lead contact upon request. The Tfcp2l1AT2–KO and control RNA-seq and scRNA-seq datasets have been deposited in the NCBI GEO database at https://www.ncbi.nlm.nih.gov/geo/query/acc.cgi under GEO accession number GSE204787.
This paper does not report original code. Any additional information required to reanalyze the data reported in this paper is available from the lead contact upon request.
EXPERIMENTAL MODEL AND SUBJECT DETAILS
Mouse lines
Information related with mouse genotyping and mouse generation can be found from Jackson Laboratories otherwise is indicated. R26REYFP (Jackson Laboratory stock # 007903), R26RtdTomato (Jackson Laboratory stock # 007914), Tfcp2l1CreERT2 (Jackson Laboratories stock # 028732), SftpcEGFP (Jackson Laboratories stock # 028356). The SftpcCreERT2 mouse line was a kind gift from Dr. Harold A. Chapman’s lab (University of California, San Francisco), and the Tfcp2l1flox mouse was a kind gift from Dr. Jonathan Barasch’s lab Columbia University). All mice were mixed background (C57BL/6 and CD1). We performed the experiments with at least n = 3 mice per condition; we included mixed gender and carefully included littermates to ensure consistency. A single dot in each graph represents an individual mouse for data quantification. The University of Pennsylvania Institutional Animal Care and Use Committee approved all animal procedures performed here.
Lung alveolar organoid assay
Three consecutive tamoxifen doses (200 mg/kg) were administered by oral gavage in SftpcCreERT2; R26REYFP or SftpcCreERT2; Tfcp2l1fl/fl; R26REGFP mice. 14 days later, mouse lungs were collected to generate single-cell suspension using a combination of different enzymes (Collagenase type I, dispase, and DNase1) as described in.6,11,29 Samples were resuspended in FACS buffer (1X Phosphate-Buffered Saline (PBS), 25mM HEPES (Gibco, catalog # 15630080), 2mM EDTA (Invitrogen, catalog # 15575020), and 1.5% Fetal Bovine Serum (FBS) (ThermoFisher, catalog # 15260037). EGFP+ cells were FACS sorted, and we measured cell viability using Trypan Blue solution (Gibco, catalog # 15250061). To assess cell numbers, we used Countess 3 automated cell counter.
To generate alveolar organoids, we used a 24 well-plate format. The conditions described as follows used per one well. Each well consists of a cell culture inset (0.4μm transparent PET membrane) (Corning, cat # 353095). We mixed 5x10³EGFP+ cells with 5x10⁴ primary lung fibroblasts to support epithelial cell growth with 50μL of ice-cold Matrigel (Corning, catalog # 356231) and 50μL of MTEC-SAGM medium mixed with supplements (Lonza, catalog # CC-3119) and (Lonza, catalog # CC-4124), the SAGM medium preparation is detailed in.11 The 100μL solution (Cells, medium, and Matrigel) was plated on top of the cell culture insert and let to polymerize for 20min in a tissue culture incubator (5% CO2, 37°C, with saturating humidity). Each well was fed using SAGM medium with a 10mM rock inhibitor (Y-27632 dihydrochloride, Millipore Sigma, catalog #Y0503) for 24 h. Then, the medium was changed with fresh SAGM medium supplements with SB431542 (10μM, Tocris, Cat #1614) for seven days changing the medium every other day. On day 7, organoids were fed using SAGM medium supplemented with or without IL-1β (10 ng/mL, BioLegend, cat # 575102) until day 21, provided every other day.
We used EVOSFL Auto 2 Imaging System to document the organoid formation. For data analysis, we harvested the organoids on day 21. To perform IHC in organoids. First, organoids were fixed in the cell culture insert using 2% paraformaldehyde solution (Thermo Fisher Scientific, catalog # AAJ19943K2) for 30 min. Then, remove PFA using 3–5 washes in PBS, each for 10 min. After removing PFA, we proceeded to dehydrate organoids utilizing a series of ethanol washes from 30%, 50%, 70%, 95%, and 100% each wash for 30 min. Finally, the bottom of the cell culture inset was removed and embedded in paraffin wax, sectioned at a thickness of 6mm. Results are from three independent experiments, and each experimental condition was performed with at least three replicate wells.
METHOD DETAILS
Tamoxifen delivery
Tamoxifen (Sigma-Aldrich, catalog #T5648) was resuspended at 20 mg/mL using a mixture of ethanol (10%) and corn oil (90%). For pregnant dam experiments, tamoxifen was administered only once by oral gavage at a 200 mg/kg dose. Experiments involve adult mice (older than six weeks old). We administer tamoxifen by oral gavage at a dose of 200 mg/kg for three consecutive days. We left tamoxifen to wash out for 14 days for every injury experiment before starting injury experiments.
EdU incorporation
EdU (Santa Cruz, catalog # sc-284628B) was dissolved in 1X PBS and administered via intraperitoneal injection at 50 mg/kg. Adult mice received EdU 4 h before lung collection. To detect EdU+ cells, we used the Click-iT EdU cell proliferation kit (Invitrogen, catalog #C10634) and followed the manufacturer’s instructions.
Influenza infection
We administered intranasal 50μL of virus solution (PR8 H1N1 influenza virus in cold PBS) per anesthetized mouse. The viral dose is approximately 1LD50 (determined experimentally based on delivery to six-to eight-week-old C57BL/6 female mice) as previously described.6,11 We received the PR8 H1N1 influenza virus as a kind gift from Dr. John Wherry at the University of Pennsylvania.
Histology
The lungs were harvested, and we removed blood from lung lobes using PBS by puncturing the heart and running PBS for 1 min at a constant pressure of 25cm. Then we inflated the lungs using 2% PFA at continuous pressure of 25cm and left them fixed overnight at 4°C. To remove PFA, we wash the fixed lungs six times using PBS, every wash for 30 min, then proceed to dehydrate using 75%, 90%, and 100% ethanol each incubation for 24 h at 4°C. Lungs were paraffin wax, sectioned at a thickness of 6mm. Lung sections were stained using Hematoxylin and eosin (H&E) as performed before.6,11 To perform immunohistochemistry, we used the antibodies listed below using the following concentrations.
HOPX (mouse, Santa Cruz, sc-398703, 1:100)
Rabbit anti-SFTPC (Rabbit, Abcam, ab90716)
ACTA2 (mouse, Millipore Sigma, A5228, 1:200)
AGER (Rage) (rat, R&D Systems, MAB1179, 1:50)
LAMP3 (DC-Lamp) (rat, Novus, DDX0191P-100, 1:100)
GFP (chicken, Aves Labs, GFP-1020, 1:200)
Ki67 (mouse, BD Biosciences, 550609, 1:200)
NKX2.1 (Ttf1) (mouse, Thermo Fisher Scientific, MS-699-P1, 1:25)
RFP (Rabbit anti-RFP, Rockland, 600-401-379)
CLDN4 (Rabbit anti-Cldn4, ThemoFisher, 36–4800)
LCN2 (Rabbit anti-Lcn2, Cell signaling, Cat No. D4M8L)
Slides were mounted using Vectashield Antifade Mounting Medium (Vector Laboratories catalog # H-1000) or Slowfade Diamond Antifade Mountant (Invitrogen, catalog #S36972). Slowfade Diamond Antifade Mountant was used to avoid the quenching action of Vectashield on Alexa Fluor 647 secondary antibodies. Imaging for cell quantification was acquired using a Leica TCS SP8 confocal microscope.
Hyperoxia treatment and lung assessment program
We used adult mice (>6 weeks old) for hyperoxia experiments, and the methodology used was previously described.11,29 In addition, we employed the lung assessment program to identify lung injury zones caused by influenza or hyperoxia injury to determine lung injury zones, and the software details are described (Liberti et al., 2022).
Bulk RNA-seq, scRNA-seq and scATAC-seq
14 days post-infection lineage traced EGFP+ cells were FACS, and cell pellets were resuspended with lysis buffer from RNA isolation kit PureLink RNA Micro Kit (Invitrogen Cat No 12183-016). To isolate total RNA, we follow the manufacturing protocol. To calculate RNA integrity, we used a Bioanalyzer High Sensitivity RNA pico kit Analysis (Agilent, cat # 5067-1513). The NEBNext Single Cell/Low Input RNA Library Prep Kit for Illumina (New England Biolabs, catalog #E6420) follows the manufacturer’s instructions. Libraries were sequenced using the Illumina HiSeq. Fastq files were aligned against mouse reference (mm39/mGRC39) using the STAR aligner (v2.7.9a).46 Duplicate reads were removed using MarkDuplicates from Picard tools, and per gene read counts for Ensembl (v104) gene annotations were computed. Expression levels in counts per million (CPM) were normalized and transformed using VOOM in the limma R package.47 Surrogate variables to account for sources of latent variation such as batch were calculated using the svaseq function from the R SVA package.48 Differential gene expression analysis was conducted using the limma package. Gene Ontology and pathway analysis was performed using the clusterProfiler (v4.4.4).49 All plots were constructed in R using ggplot2 or Complexheatmap.
For scRNA-seq libraries, lineage-traced EYFP+ cells were cell sorted and resuspended in 1X PBS buffer (calcium and magnesium free) carrying 0.04% weight/volume BSA construction we used 10X Genomics protocols. Cell viability assessment was performed using trypan blue and we aimed for 10000 viable cells to be loaded onto 10X Chromium (10X Genomics). Library generation was performed according to manufacture protocol for 10X Single Cell 3′ v3 chemistry. Quality of cDNA libraries were performed using Bioanalyzer High Sensitivity DNA from Agilent (Cat No. 5067-4626). Library reads were aligned to the mouse reference (mm39/mGRC39) and unique molecular identifier (UMI) counts obtained STAR-Solo (v2.7.9a).46 For further processing, integration and downstream analysis, Seurat (v4.0.6)50 was used. Cells with less than 200 genes, greater than 2 Median absolute deviation above the median, and with potential stress signals of greater than 5% mitochondrial reads were removed. The cell cycle phase prediction score was calculated using Seurat function CellCycleScoring. Multiple libraries were merged and then merged data was normalized and scaled using the SCTransform function and regressing out the effects of percent fraction of mitochondria, number of features per cell, and number of UMI per cell. Linear dimension reduction was done via PCA, and the number of PCA dimensions was evaluated and selected based on assessment of an ElbowPlot. Data was clustered using the Louvain graph-based algorithm in R and Cluster resolution chosen based on evaluation by the clustree program. The Uniform Manifold Projection (UMAP) data reduction algorithm was used to project the cells onto two dimensional coordinates. Clusters were then assigned putative cell types based on annotation with canonical marker genes, or from assessment of top cluster-defining genes based on differential expression (using the FindAllMarkers function in Seurat). For intra-cluster gene expression differences, the FindMarkers function was used to identify variation between specified clusters and the resultant gene sets were comparted via the MAST method. GO and WikiPathway enrichment analysis was done with the clusterProfiler R package.49 RNA velocity analysis was performed using the scVelo package. Count data for spliced, unspliced and ambiguous reads was obtained using velocity parameter in STAR-solo (v2.7.9a) and counts were converted to loom files using loompy. were created using scanpy (v1.9)51 and scVelo (v0.2.4)36 was used to compute RNA velocity and latent time. RNA velocity and heatmaps were generated using scVelo.
scATAC-seq data from adult lungs were generated and processed as previously described (PMID: 33974915, GEO: GSM5009426). Briefly, adult lungs were harvested, and nuclei isolation and counting were conducted according to the manufacturer’s protocol (10X Genomics, Single Cell ATAC v1 reagents). Data processing such as read filtering and alignment, transposase cut site identification, and peak accessibility was conducted using Cell Ranger ATAC pipeline. Data was further processed using the Seurat extension Signac (https://satijalab.org/signac/). Gene activity score was computed using the chromatin accessibility reads associated with each gene. scATAC-seq and scRNA-seq were integrated using a cross-modality integration and label transfer method to identify shared correlation patterns in the gene activity matrix and scRNA-seq dataset using the FindIntegrationAnchors and IntegrateData functions. Tfcp2l1 motif finding was performed using Signac and the JASPAR2022 R package. Plots were created using the CoveragePlot() function is Signac.
Flow cytometry
Samples were dispersed into single cells and then fixed using 2% PFA incubating at room temperature for 30min. Cells used for flow cytometry to detect EdU+ samples were processed using the Click-iT EdU cell proliferation kit (Invitrogen, catalog #C10634), and it was used according to the manufacturer’s instructions. Samples were analyzed using a CytoFLEX S flow cytometer.
RNA isolation cDNA synthesis and Q-PCR
Total RNA was isolated using PureLink RNA Micro Kit (Invitrogen Cat #12183-016). We resuspended the RNA in 16μL of RNAse-free, and we used 100ng total RNA to generate cDNA using the SuperScript IV Reverse Transcriptase (ThermoFisher Cat No 18090050). For Q-PCR, we mixed cDNA with SYBRgreen PCR master Mix (ThermoFisher Cat # 4367659). QuantStudio7 Flex (Applied Biosystems) was used for sample quantification. We used the delta-delta Ct method for gene expression quantification using the Tbp housekeeping gene for normalization. The different gene primers are presented in Table 1.
QUANTIFICATION AND STATISTICAL ANALYSIS
Organoid size and colony forming efficiency
To measure organoid size, we follow the methodology described by.6,11 In brief, EVOS FL Auto 2 Imaging System was used to image the whole well to visualize the endogenous EYFP signal. We used Fiji software to process image analysis, every picture threshold, and further binarized. To minimize background, we applied erosion and then dilation. To fully measure organoids diameter, we applied to fill holes and watershedding functions. Finally, analyze particle was used to measure organoid size with reading parameter bigger than 1000mm2. We performed at least three biological experiments with a minimum of 4 replicates.
Statistics
Results related to quantification based on images or any other type of experiment it is shown as mean ± SEM if another representation is not stated. To compare two different populations, we used two-tailed unpaired Student’s t-tests with p values <0.05 considered significant. We used Graphpad Prism9 software to compute and graph data.
Supplementary Material
KEY RESOURCES TABLE
| REAGENT or RESOURCE | SOURCE | IDENTIFIER |
|---|---|---|
| Antibodies | ||
| Mouse anti-Hopx | Santa Cruz | Cat#: sc-398703; RRID: AB_2687966 |
| Rabbit anti-SFTPC | Abcam | Cat#: ab90716; RRID: AB_10674024 |
| Chicken anti-GFP | Aves Labs | Cat#: GFP-1020; RRID: AB_10000240 |
| Rabbit anti-RFP | Rockland | Cat#: 600-401-379 AB_ AB_2209751 |
| Rat anti-Ager (Rage) | R&D Systems | Cat#: MAB1179; RRID: AB_2289349 |
| Mouse anti-Ki67 | BD Biosciences | Cat#: 550609; RRID: AB_393778 |
| Rabbit anti-Cldn4 | ThermoFisher | Cat#: 36–4800; RRID: AB_2533262 |
| Mouse Anti- Acta2 | Millipore Sigma | Cat#: A5228; RRID: AB_262054 |
| Rat anti-Lamp3 (DC-Lamp) | Novus | Cat#: DDX0191P-100; RRID: AB_2827532) |
| Mouse anti-Nkx2.1 (TTF1) | Thermo Fisher Scientific | Cat#: MS-699-P1; RRID: AB_142087 |
| Bacterial and virus strains | ||
| H1N1 PR8 | Dr. John E. Wherry’s Lab (University of Pennsylvania) | N/A |
| Chemicals, peptides, and recombinant proteins | ||
| IL-1β | Biolegend | Cat# 575102 |
| SB431542 | Tocris | Cat# 1614 |
| Small Airway Epithelial Cell Growth Medium (SAGM) supplements |
Lonza | Cat# CC-4124 |
| Small airway epithelial cell growth basal media (SABM) | Lonza | Cat# CC-3119 |
| Cholera toxin Millipore | Millipore Sigma | Cat# C9903 |
| EGF | Peprotech | Cat# AF-100-15 |
| Antibiotic-Antimycotic | Gibco | Cat# 15240062 |
| Fetal Bovine Serum | Denville | Cat# FB5001 |
| Matrigel | Corning | Cat# 356231 |
| Slowfade Diamond Antifade Mountant | Invitrogen | Cat# S36972 |
| Deposited data | ||
| RNA-seq at 14dpi | This paper | GEO: GSE |
| Critical commercial assays | ||
| PureLink RNA Mini Kit | Invitrogen | Cat# 12183-016 |
| NEBNext Single Cell/Low Input RNA Library Prep Kit for Illumina |
New England Biolabs | Cat# E6420 |
| Click-iT EdU cell proliferation kit | Invitrogen | Cat #C10634) |
| Experimental models: Organisms/strains | ||
| R26REYFP | Jackson Laboratory | stock # 007903 |
| R26RtdTomato | Jackson Laboratory | stock # 007914 |
| Tfcp2l1CreERT2 | Jackson Laboratories | stock # 028732 |
| SftpcCreERT2 | PMCID: PMC3223845 | N/A |
| Tfcp2l1flox | PMCID: PMC5484618 | N/A |
| Software and algorithms | ||
| LungDamage program | PMID: 33979629 | https://github.com/WALIII/LungDamage |
| Graphpad Prism9 | GraphPad | https://www.graphpad.com/scientific-software/prism/ |
| Illustrator | Adobe | https://www.adobe.com/products/illustrator.html |
| MATLAB | MathWorks | https://www.mathworks.com/products/matlab.html |
| Fiji | PMID: 22743772 | https://fiji.sc/R 4.0.5 |
| R 4.0.5 | R Project | https://www.r-project.org/ |
| FlowJo 10.7.1 | PMCID: PMC5484618 | N/A |
Highlights.
Tfcp2l1 maintains temporal and spatial AT2 self-renewal during lung regeneration
Tfcp2l1 regulates AT2-AT1 cell differentiation in regional zones of active regeneration
Tfcp2l1 dampens the early response to the inflammatory milieu through control of Il1r1
ACKNOWLEDGMENTS
E.E.M. is supported by funding from NIH grants (HL152194, HL087825, HL132999, and HL134745) and the BREATH Consortium of the Longfonds Foundation (the Netherlands). J.B. is supported by funding from NIH grants (RO1DK073462, RO1DK092684, and U54DK104309).
Footnotes
SUPPLEMENTAL INFORMATION
Supplemental information can be found online at https://doi.org/10.1016/j.celrep.2023.112451.
DECLARATION OF INTERESTS
The authors declare no competing interests.
REFERENCES
- 1.Torres Acosta MA, and Singer BD (2020). Pathogenesis of COVID-19-induced ARDS: implications for an ageing population. Eur. Respir. J 56, 2002049. 10.1183/13993003.02049-2020. [DOI] [PMC free article] [PubMed] [Google Scholar]
- 2.Flerlage T, Boyd DF, Meliopoulos V, Thomas PG, and Schultz-Cherry S (2021). Influenza virus and SARS-CoV-2: pathogenesis and host responses in the respiratory tract. Nat. Rev. Microbiol 19, 425–441. 10.1038/s41579-021-00542-7. [DOI] [PMC free article] [PubMed] [Google Scholar]
- 3.Boyd DF, Allen EK, Randolph AG, Guo XZJ, Weng Y, Sanders CJ, Bajracharya R, Lee NK, Guy CS, Vogel P, et al. (2020). Exuberant fibroblast activity compromises lung function via ADAMTS4. Nature 587, 466–471. 10.1038/s41586-020-2877-5. [DOI] [PMC free article] [PubMed] [Google Scholar]
- 4.Basil MC, Katzen J, Engler AE, Guo M, Herriges MJ, Kathiriya JJ, Windmueller R, Ysasi AB, Zacharias WJ, Chapman HA, et al. (2020). The cellular and physiological basis for lung repair and regeneration: past, present, and future. Cell Stem Cell 26, 482–502. 10.1016/j.stem.2020.03.009. [DOI] [PMC free article] [PubMed] [Google Scholar]
- 5.Hogan BLM, Barkauskas CE, Chapman HA, Epstein JA, Jain R, Hsia CCW, Niklason L, Calle E, Le A, Randell SH, et al. (2014). Repair and regeneration of the respiratory system: complexity, plasticity, and mechanisms of lung stem cell function. Cell Stem Cell 15, 123–138. 10.1016/j.stem.2014.07.012. [DOI] [PMC free article] [PubMed] [Google Scholar]
- 6.Liberti DC, Kremp MM, Liberti WA 3rd, Penkala IJ, Li S, Zhou S, and Morrisey EE (2021). Alveolar epithelial cell fate is maintained in a spatially restricted manner to promote lung regeneration after acute injury. Cell Rep. 35, 109092. 10.1016/j.celrep.2021.109092. [DOI] [PMC free article] [PubMed] [Google Scholar]
- 7.Zepp JA, Morley MP, Loebel C, Kremp MM, Chaudhry FN, Basil MC, Leach JP, Liberti DC, Niethamer TK, Ying Y, et al. (2021). Genomic, epigenomic, and biophysical cues controlling the emergence of the lung alveolus. Science 371, eabc3172. 10.1126/sc-ence.abc3172. [DOI] [PMC free article] [PubMed] [Google Scholar]
- 8.Choi J, Park JE, Tsagkogeorga G, Yanagita M, Koo BK, Han N, and Lee JH (2020). Inflammatory signals induce AT2 cell-derived damage-associated transient progenitors that mediate alveolar regeneration. Cell Stem Cell 27, 366–382.e7. 10.1016/j.stem.2020.06.020. [DOI] [PMC free article] [PubMed] [Google Scholar]
- 9.Kobayashi Y, Tata A, Konkimalla A, Katsura H, Lee RF, Ou J, Banovich NE, Kropski JA, and Tata PR (2020). Persistence of a regeneration-associated, transitional alveolar epithelial cell state in pulmonary fibrosis. Nat. Cell Biol 22, 934–946. 10.1038/s41556-020-0542-8. [DOI] [PMC free article] [PubMed] [Google Scholar]
- 10.Strunz M, Simon LM, Ansari M, Kathiriya JJ, Angelidis I, Mayr CH, Tsidiridis G, Lange M, Mattner LF, Yee M, et al. (2020). Alveolar regeneration through a Krt8+ transitional stem cell state that persists in human lung fibrosis. Nat. Commun 11, 3559. 10.1038/s41467-020-17358-3. [DOI] [PMC free article] [PubMed] [Google Scholar]
- 11.Liberti DC, Liberti Iii WA, Kremp MM, Penkala IJ, Cardenas-Diaz FL, Morley MP, Babu A, Zhou S, Fernandez Iii RJ, and Morrisey EE (2022). Klf5 defines alveolar epithelial type 1 cell lineage commitment during lung development and regeneration. Dev. Cell 57, 1742–1757.e5. 10.1016/j.devcel.2022.06.007. [DOI] [PubMed] [Google Scholar]
- 12.Katsura H, Kobayashi Y, Tata PR, and Hogan BLM (2019). IL-1 and TNFalpha contribute to the inflammatory niche to enhance alveolar regeneration. Stem Cell Rep. 12, 657–666. 10.1016/j.stemcr.2019.02.013. [DOI] [PMC free article] [PubMed] [Google Scholar]
- 13.Nabhan AN, Brownfield DG, Harbury PB, Krasnow MA, and Desai TJ (2018). Single-cell Wnt signaling niches maintain stemness of alveolar type 2 cells. Science 359, 1118–1123. 10.1126/science.aam6603. [DOI] [PMC free article] [PubMed] [Google Scholar]
- 14.Paris AJ, Hayer KE, Oved JH, Avgousti DC, Toulmin SA, Zepp JA, Zacharias WJ, Katzen JB, Basil MC, Kremp MM, et al. (2020). STAT3-BDNF-TrkB signalling promotes alveolar epithelial regeneration after lung injury. Nat. Cell Biol 22, 1197–1210. 10.1038/s41556-020-0569-x. [DOI] [PMC free article] [PubMed] [Google Scholar]
- 15.Zacharias WJ, Frank DB, Zepp JA, Morley MP, Alkhaleel FA, Kong J, Zhou S, Cantu E, and Morrisey EE (2018). Regeneration of the lung alveolus by an evolutionarily conserved epithelial progenitor. Nature 555, 251–255. 10.1038/nature25786. [DOI] [PMC free article] [PubMed] [Google Scholar]
- 16.Zepp JA, Zacharias WJ, Frank DB, Cavanaugh CA, Zhou S, Morley MP, and Morrisey EE (2017). Distinct mesenchymal lineages and niches promote epithelial self-renewal and myofibrogenesis in the lung. Cell 170, 1134–1148.e10. 10.1016/j.cell.2017.07.034. [DOI] [PMC free article] [PubMed] [Google Scholar]
- 17.Hancock GV, Liu W, Peretz L, Chen D, Gell JJ, Collier AJ, Zamudio JR, Plath K, and Clark AT (2021). Divergent roles for KLF4 and TFCP2L1 in naive ground state pluripotency and human primordial germ cell development. Stem Cell Res. 55, 102493. 10.1016/j.scr.2021.102493. [DOI] [PMC free article] [PubMed] [Google Scholar]
- 18.Qiu D, Ye S, Ruiz B, Zhou X, Liu D, Zhang Q, and Ying QL (2015). Klf2 and Tfcp2l1, two Wnt/beta-catenin targets, act synergistically to induce and maintain naive pluripotency. Stem Cell Rep. 5, 314–322. 10.1016/j.stemcr.2015.07.014. [DOI] [PMC free article] [PubMed] [Google Scholar]
- 19.Heo J, Noh BJ, Lee S, Lee HY, Kim Y, Lim J, Ju H, Yu HY, Ryu CM, Lee PC, et al. (2020). Phosphorylation of TFCP2L1 by CDK1 is required for stem cell pluripotency and bladder carcinogenesis. EMBO Mol. Med 12, e10880. 10.15252/emmm.201910880. [DOI] [PMC free article] [PubMed] [Google Scholar]
- 20.Liu K, Zhang Y, Liu D, Ying QL, and Ye S (2017). TFCP2L1 represses multiple lineage commitment of mouse embryonic stem cells through MTA1 and LEF1. J. Cell Sci 130, 3809–3817. 10.1242/jcs.206532. [DOI] [PubMed] [Google Scholar]
- 21.Sun H, You Y, Guo M, Wang X, Zhang Y, and Ye S (2018). Tfcp2l1 safeguards the maintenance of human embryonic stem cell self-renewal. J. Cell. Physiol 233, 6944–6951. 10.1002/jcp.26483. [DOI] [PubMed] [Google Scholar]
- 22.Wang X, Wang X, Zhang S, Sun H, Li S, Ding H, You Y, Zhang X, and Ye SD (2019). The transcription factor TFCP2L1 induces expression of distinct target genes and promotes self-renewal of mouse and human embryonic stem cells. J. Biol. Chem 294, 6007–6016. 10.1074/jbc.RA118.006341. [DOI] [PMC free article] [PubMed] [Google Scholar]
- 23.Werth M, Schmidt-Ott KM, Leete T, Qiu A, Hinze C, Viltard M, Paragas N, Shawber CJ, Yu W, Lee P, et al. (2017). Transcription factor TFCP2L1 patterns cells in the mouse kidney collecting ducts. Elife 6, e24265. 10.7554/eLife.24265. [DOI] [PMC free article] [PubMed] [Google Scholar]
- 24.Zhang M, Ji J, Wang X, Zhang X, Zhang Y, Li Y, Wang X, Li X, Ban Q, and Ye SD (2021). The transcription factor Tfcp2l1 promotes primordial germ cell-like cell specification of pluripotent stem cells. J. Biol. Chem 297, 101217. 10.1016/j.jbc.2021.101217. [DOI] [PMC free article] [PubMed] [Google Scholar]
- 25.Tun HW, Marlow LA, von Roemeling CA, Cooper SJ, Kreinest P, Wu K, Luxon BA, Sinha M, Anastasiadis PZ, and Copland JA (2010). Pathway signature and cellular differentiation in clear cell renal cell carcinoma. PLoS One 5, e10696. 10.1371/journal.pone.0010696. [DOI] [PMC free article] [PubMed] [Google Scholar]
- 26.Kotarba G, Krzywinska E, Grabowska AI, Taracha A, and Wilanowski T (2018). TFCP2/TFCP2L1/UBP1 transcription factors in cancer. Cancer Lett. 420, 72–79. 10.1016/j.canlet.2018.01.078. [DOI] [PubMed] [Google Scholar]
- 27.Taracha A, Kotarba G, and Wilanowski T (2018). Neglected functions of TFCP2/TFCP2L1/UBP1 transcription factors may offer valuable insights into their mechanisms of action. Int. J. Mol. Sci 19, 2852. 10.3390/ijms19102852. [DOI] [PMC free article] [PubMed] [Google Scholar]
- 28.Xi Y, Kim T, Brumwell AN, Driver IH, Wei Y, Tan V, Jackson JR, Xu J, Lee DK, Gotts JE, et al. (2017). Local lung hypoxia determines epithelial fate decisions during alveolar regeneration. Nat. Cell Biol 19, 904–914. 10.1038/ncb3580. [DOI] [PMC free article] [PubMed] [Google Scholar]
- 29.Penkala IJ, Liberti DC, Pankin J, Sivakumar A, Kremp MM, Jayachandran S, Katzen J, Leach JP, Windmueller R, Stolz K, et al. (2021). Age-dependent alveolar epithelial plasticity orchestrates lung homeostasis and regeneration. Cell Stem Cell 28, 1775–1789.e5. 10.1016/j.stem.2021.04.026. [DOI] [PMC free article] [PubMed] [Google Scholar]
- 30.Amarelle L, Quintela L, Hurtado J, and Malacrida L (2021). Hyperoxia and lungs: what we have learned from animal models. Front. Med 8, 606678. 10.3389/fmed.2021.606678. [DOI] [PMC free article] [PubMed] [Google Scholar]
- 31.Mach WJ, Thimmesch AR, Pierce JT, and Pierce JD (2011). Consequences of hyperoxia and the toxicity of oxygen in the lung. Nurs. Res. Pract 2011, 260482. 10.1155/2011/260482. [DOI] [PMC free article] [PubMed] [Google Scholar]
- 32.Matute-Bello G, Frevert CW, and Martin TR (2008). Animal models of acute lung injury. Am. J. Physiol. Lung Cell Mol. Physiol 295, L379–L399. 10.1152/ajplung.00010.2008. [DOI] [PMC free article] [PubMed] [Google Scholar]
- 33.Chen CM, Wang LF, Chou HC, Lang YD, and Lai YP (2007). Upregulation of connective tissue growth factor in hyperoxia-induced lung fibrosis. Pediatr. Res 62, 128–133. 10.1203/PDR.0b013e3180987202. [DOI] [PubMed] [Google Scholar]
- 34.Haghverdi L, Buettner F, and Theis FJ (2015). Diffusion maps for high-dimensional single-cell analysis of differentiation data. Bioinformatics 31, 2989–2998. 10.1093/bioinformatics/btv325. [DOI] [PubMed] [Google Scholar]
- 35.Bergen V, Lange M, Peidli S, Wolf FA, and Theis FJ (2020). Generalizing RNA velocity to transient cell states through dynamical modeling. Nat. Biotechnol 38, 1408–1414. 10.1038/s41587-020-0591-3. [DOI] [PubMed] [Google Scholar]
- 36.La Manno G, Soldatov R, Zeisel A, Braun E, Hochgerner H, Petukhov V, Lidschreiber K, Kastriti ME, Lönnerberg P, Furlan A, et al. (2018). RNA velocity of single cells. Nature 560, 494–498. 10.1038/s41586-018-0414-6. [DOI] [PMC free article] [PubMed] [Google Scholar]
- 37.Liberti DC, and Morrisey EE (2021). Organoid models: assessing lung cell fate decisions and disease responses. Trends Mol. Med 27, 1159–1174. 10.1016/j.molmed.2021.09.008. [DOI] [PubMed] [Google Scholar]
- 38.Al-Garawi AA, Fattouh R, Walker TD, Jamula EB, Botelho F, Goncharova S, Reed J, Stampfli MR, O’Byrne PM, Coyle AJ, and Jordana M (2009). Acute, but not resolved, influenza A infection enhances susceptibility to house dust mite-induced allergic disease. J. Immunol 182, 3095–3104. 10.4049/jimmunol.0802837. [DOI] [PubMed] [Google Scholar]
- 39.Jang H, Boltz D, McClaren J, Pani AK, Smeyne M, Korff A, Webster R, and Smeyne RJ (2012). Inflammatory effects of highly pathogenic H5N1 influenza virus infection in the CNS of mice. J. Neurosci 32, 1545–1559. 10.1523/JNEUROSCI.5123-11.2012. [DOI] [PMC free article] [PubMed] [Google Scholar]
- 40.Frank DB, Peng T, Zepp JA, Snitow M, Vincent TL, Penkala IJ, Cui Z, Herriges MJ, Morley MP, Zhou S, et al. (2016). Emergence of a wave of Wnt signaling that regulates lung alveologenesis by controlling epithelial self-renewal and differentiation. Cell Rep. 17, 2312–2325. 10.1016/j.celrep.2016.11.001. [DOI] [PMC free article] [PubMed] [Google Scholar]
- 41.Basil MC, Cardenas-Diaz FL, Kathiriya JJ, Morley MP, Carl J, Brumwell AN, Katzen J, Slovik KJ, Babu A, Zhou S, et al. (2022). Human distal airways contain a multipotent secretory cell that can regenerate alveoli. Nature 604, 120–126. 10.1038/s41586-022-04552-0. [DOI] [PMC free article] [PubMed] [Google Scholar]
- 42.Jacob A, Morley M, Hawkins F, McCauley KB, Jean JC, Heins H, Na CL, Weaver TE, Vedaie M, Hurley K, et al. (2017). Differentiation of human pluripotent stem cells into functional lung alveolar epithelial cells. Cell Stem Cell 21, 472–488.e10. 10.1016/j.stem.2017.08.014. [DOI] [PMC free article] [PubMed] [Google Scholar]
- 43.Ye S, Li P, Tong C, and Ying QL (2013). Embryonic stem cell self-renewal pathways converge on the transcription factor Tfcp2l1. EMBO J. 32, 2548–2560. 10.1038/emboj.2013.175. [DOI] [PMC free article] [PubMed] [Google Scholar]
- 44.Leach JP, and Morrisey EE (2018). Repairing the lungs one breath at a time: how dedicated or facultative are you? Genes Dev. 32, 1461–1471. 10.1101/gad.319418.118. [DOI] [PMC free article] [PubMed] [Google Scholar]
- 45.Heo J, Lee J, Nam YJ, Kim Y, Yun H, Lee S, Ju H, Ryu CM, Jeong SM, Lee J, et al. (2022). The CDK1/TFCP2L1/ID2 cascade offers a novel combination therapy strategy in a preclinical model of bladder cancer. Exp. Mol. Med 54, 801–811. 10.1038/s12276-022-00786-0. [DOI] [PMC free article] [PubMed] [Google Scholar]
- 46.Dobin A, Davis CA, Schlesinger F, Drenkow J, Zaleski C, Jha S, Batut P, Chaisson M, and Gingeras TR (2013). STAR: ultrafast universal RNA-seq aligner. Bioinformatics 29, 15–21. 10.1093/bioinformatics/bts635. [DOI] [PMC free article] [PubMed] [Google Scholar]
- 47.Ritchie ME, Phipson B, Wu D, Hu Y, Law CW, Shi W, and Smyth GK (2015). Limma powers differential expression analyses for RNA-sequencing and microarray studies. Nucleic Acids Res. 43, e47. 10.1093/nar/gkv007. [DOI] [PMC free article] [PubMed] [Google Scholar]
- 48.Leek JT, Johnson WE, Parker HS, Jaffe AE, and Storey JD (2012). The sva package for removing batch effects and other unwanted variation in high-throughput experiments. Bioinformatics 28, 882–883. 10.1093/bioinformatics/bts034. [DOI] [PMC free article] [PubMed] [Google Scholar]
- 49.Wu T, Hu E, Xu S, Chen M, Guo P, Dai Z, Feng T, Zhou L, Tang W, Zhan L, et al. (2021). clusterProfiler 4.0: a universal enrichment tool for interpreting omics data. Innovation 2, 100141. 10.1016/j.xinn.2021.100141. [DOI] [PMC free article] [PubMed] [Google Scholar]
- 50.Hao Y, Hao S, Andersen-Nissen E, Mauck WM 3rd, Zheng S, Butler A, Lee MJ, Wilk AJ, Darby C, Zager M, et al. (2021). Integrated analysis of multimodal single-cell data. Cell 184, 3573–3587.e29. 10.1016/j.cell.2021.04.048. [DOI] [PMC free article] [PubMed] [Google Scholar]
- 51.Wolf FA, Angerer P, and Theis FJ (2018). SCANPY: large-scale single-cell gene expression data analysis. Genome Biol. 19, 15. 10.1186/s13059-017-1382-0. [DOI] [PMC free article] [PubMed] [Google Scholar]
Associated Data
This section collects any data citations, data availability statements, or supplementary materials included in this article.
Supplementary Materials
Data Availability Statement
All data reported in this paper will be shared by the lead contact upon request. The Tfcp2l1AT2–KO and control RNA-seq and scRNA-seq datasets have been deposited in the NCBI GEO database at https://www.ncbi.nlm.nih.gov/geo/query/acc.cgi under GEO accession number GSE204787.
This paper does not report original code. Any additional information required to reanalyze the data reported in this paper is available from the lead contact upon request.