

Abstract
Amblyopia is the most common cause of vision loss in children and can persist into adulthood in the absence of effective intervention. Previous clinical and neuroimaging studies have suggested that the neural mechanisms underlying strabismic amblyopia and anisometropic amblyopia may be different. Therefore, we performed a systematic review of magnetic resonance imaging studies investigating brain alterations in patients with these two subtypes of amblyopia; this study is registered with PROSPERO (registration ID: CRD42022349191). We searched three online databases (PubMed, EMBASE, and Web of Science) from inception to April 1, 2022; 39 studies with 633 patients (324 patients with anisometropic amblyopia and 309 patients with strabismic amblyopia) and 580 healthy controls met the inclusion criteria (e.g., case-control designed, peer-reviewed articles) and were included in this review. These studies highlighted that both strabismic amblyopia and anisometropic amblyopia patients showed reduced activation and distorted topological cortical activated maps in the striate and extrastriate cortices during task-based functional magnetic resonance imaging with spatial-frequency stimulus and retinotopic representations, respectively; these may have arisen from abnormal visual experiences. Compensations for amblyopia that are reflected in enhanced spontaneous brain function have been reported in the early visual cortices in the resting state, as well as reduced functional connectivity in the dorsal pathway and structural connections in the ventral pathway in both anisometropic amblyopia and strabismic amblyopia patients. The shared dysfunction of anisometropic amblyopia and strabismic amblyopia patients, relative to controls, is also characterized by reduced spontaneous brain activity in the oculomotor cortex, mainly involving the frontal and parietal eye fields and the cerebellum; this may underlie the neural mechanisms of fixation instability and anomalous saccades in amblyopia. With regards to specific alterations of the two forms of amblyopia, anisometropic amblyopia patients suffer more microstructural impairments in the precortical pathway than strabismic amblyopia patients, as reflected by diffusion tensor imaging, and more significant dysfunction and structural loss in the ventral pathway. Strabismic amblyopia patients experience more attenuation of activation in the extrastriate cortex than in the striate cortex when compared to anisometropic amblyopia patients. Finally, brain structural magnetic resonance imaging alterations tend to be lateralized in the adult anisometropic amblyopia patients, and the patterns of brain alterations are more limited in amblyopic adults than in children. In conclusion, magnetic resonance imaging studies provide important insights into the brain alterations underlying the pathophysiology of amblyopia and demonstrate common and specific alterations in anisometropic amblyopia and strabismic amblyopia patients; these alterations may improve our understanding of the neural mechanisms underlying amblyopia.
Key Words: amblyopia, anisometropia, brain, function, magnetic resonance imaging, oculomotor system, precortical pathway, strabismus, structure, visual cortex
Introduction
Abnormal visual input (strabismus and anisometropia being the most common conditions) disrupts the organization of brain circuitry during visual development, thus giving rise to amblyopia (Holmes and Clarke, 2006). This is the most common cause of vision loss in children and can persist into adulthood in the absence of effective intervention (Force et al., 2017). Different visual experiences in early life can result in functional losses in patients with amblyopia (McKee et al., 2003). Most patients with strabismic amblyopia (SA) have poor binocular sensory fusion or stereoacuity, while stereoacuity and binocular motion sensitivity are usually less affected in patients with anisometropic amblyopia (AA) (Webber, 2018). In addition, patients with SA demonstrate worse feature counting performance than AA patients under dichoptic viewing (Wong-Kee-You et al., 2020). In a recent study, after the same perceptual learning treatment, a group of patients with AA showed improved visual acuity, while those in an SA group showed improved stereoacuity (Liu et al., 2020). Therefore, there appear to be differences in neural mechanisms between the two subtypes of amblyopia, making it necessary to understand how the differences in visual experience can impact the maturation of the central nervous system to provide personalized amblyopia therapy (Kanonidou, 2011).
Neuroanatomical and neurophysiological research has delineated the structural and functional characteristics of the brain visual network. For precortical pathways, visual information is conducted via the optic nerve and converges in the optic chiasm and passes into the optic tract to both hemispheres via the magnocellular and parvocellular pathways. After entering the lateral geniculate nucleus (LGN), visual information is transferred through optic radiation to the striate visual cortex (the primary cortex or visual area V1) (Covington and Al Khalili, 2021). This information is then transmitted to extrastriate visual areas and then to the association cortex for perceptual analysis. This transfer occurs in two broad streams: the parvocellular pathway or ventral stream provides information about the identity of visual information, while the magnocellular pathway or dorsal stream provides spatial location information (briefly summarized in Figure 1) (Cushing et al., 2019; Choi et al., 2020). Both SA and AA are believed to impact brain regions in visual networks (Li et al., 2007), although the nature of the locations of these effects, and the way they differ in the two primary forms of amblyopia, remain to be established.
Figure 1.
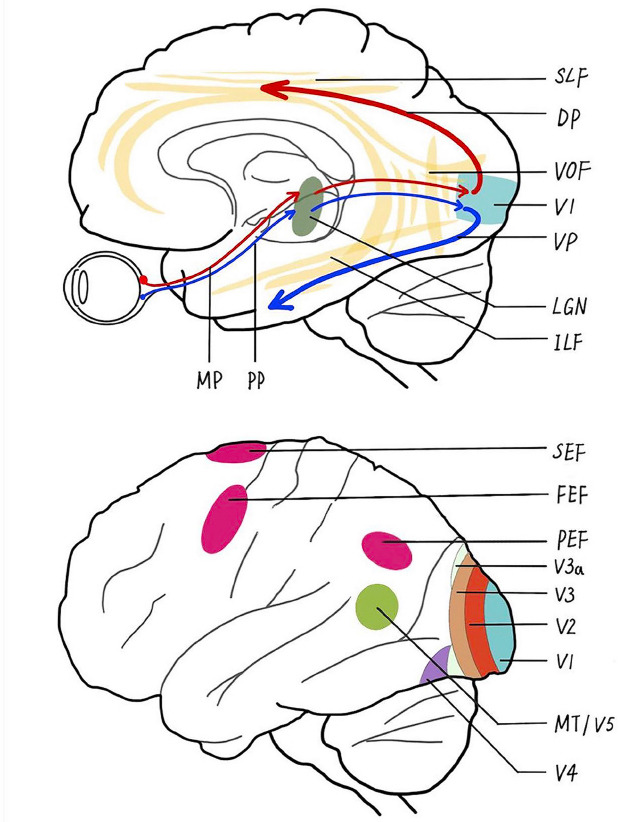
Simplified schematic representation of the main visual pathways and brain regions in humans.
The precortical pathway is composed of the magnocellular pathway (MP) and parvocellular pathway (PP) extending from the retina, through the dorsal lateral geniculate nucleus (LGN), and up to the primary visual cortex (V1). Through the intermediate visual areas [V2, V3, V3 accessory (V3a), and V4], the ventral pathway (VP) starts from V1 and goes to the inferior temporal cortex along the inferior longitudinal fasciculus (ILF), and the dorsal pathway (DP) proceeds to the middle temporal visual area (MT/V5) through the superior longitudinal fasciculus (SLF), where the vertical occipital fasciculus (VOF) connects the dual visual pathways. As a developmental disease, amblyopia manifests dysfunction and structural abnormalities in these visual pathways and regions, as well as alterations in the oculomotor cortices, including the frontal eye fields (FEFs), supplementary eye field (SEF), parietal eye fields (PEFs), and cerebellum.
In recent decades, advances in non-invasive magnetic resonance imaging (MRI) have enabled clinical investigation of altered brain anatomy and function in amblyopia (Miller et al., 2020). These investigations can help us to gain a better understanding of the pathogenesis of amblyopia and evaluate the effects of treatment. For example, in precortical regions, patients with unilateral amblyopia were found to have reduced fractional anisotropy (FA) in the optic nerve when compared with healthy controls (Altintas et al., 2017). With regards to the visual cortex, previous studies reported that amblyopia is associated with a reduction in gray matter volume (GMV) in V1 (Xiao et al., 2007), reduced functional activation in V1 under a flickering checkerboard task (Algaze et al., 2002), and higher functional connectivity (FC) between para-foveal and eccentric representations within V1 that was correlated with poor acuity of the worse amblyopic eye (Mendola et al., 2018). In addition to V1, Chen et al. (2022) analyzed resting-state functional MRI (rfMRI) data using Granger causality analysis and identified reduced effective connectivity from the ventral V2 to the lateral occipital cortex in patients with amblyopia when compared with controls; this was positively correlated with stereoscopic deficits and increased when patients were treated by perceptual learning. Moreover, when compared with controls, patients with AA showed decreased FA values in the left inferior longitudinal fasciculus/inferior fronto-occipital fasciculus and right superior longitudinal fasciculus (Li et al., 2015). SA patients also demonstrate increased mean diffusivity (MD) in the left inferior longitudinal fasciculus (Duan et al., 2015). Furthermore, patients with AA exhibit reduced GMV in the ventral temporal cortex when compared with patients with SA (Mendola et al., 2005). However, the number of studies comparing brain alterations between AA and SA patients is limited, thus precluding our understanding of the shared and distinct neural correlates for AA and SA.
To date, there has not been a comprehensive review of these typically small studies to clarify the common and specific brain alterations of these two types of amblyopia or how the neural mechanisms responsible for their occurrence in pediatric and adult patients with amblyopia. Therefore, we conducted this systematic review to provide an overview of brain MRI studies of patients with two different forms of amblyopia.
Methods
Selection of studies
Data collection followed the Preferred Reporting Items for Systematic reviews and Meta-Analyses (PRISMA) guidelines (Additional file 1; Page et al., 2021). This review was registered on the prospective register of systematic reviews (PROSPERO) platform (Registration ID: CRD42022349191). Studies were identified by manually searching electronic databases, including PubMed, EMBASE, and Web of Science, from inception to April 1, 2022, using the following keywords: (anisometropic amblyopia OR strabismic amblyopia OR amblyopia) AND (neuroimaging OR (sMRI OR structural MRI) OR (DTI OR diffusion tensor imaging) OR (fMRI OR functional MRI)). Studies were included according to the following criteria: (1) original publications in English from peer-reviewed journals; (2) studies conducted in humans with SA or AA; and (3) MRI studies exploring the brain structure and functional alterations of patients with amblyopia by using neuroimaging methods to perform whole-brain voxel/surface-based analyses and region of interest (ROI) analyses. The exclusion criteria were as follows: (1) conference abstracts, theoretical papers, and reviews; (2) studies with mixed AA and SA patients but not performing subgroup analyses of AA or SA patients; and (3) no comparisons between patients and controls, or no comparisons between the two subtypes if there were no healthy controls. All included studies were imported to EndNote version 20 (Clarivate Analytics (US) LLC, Chandler, AZ, USA) and we examined the reference lists of the included studies to identify additional studies missed from the original electronic searches. Two of the authors (YXW and YW) conducted the literature search independently. The results of these two searches were compared and any inconsistencies were discussed until a consensus was reached about the appropriateness of the study for this systematic review.
Additional file 1.
PRISMA 2020 Checklist
| Section and Topic | Item # | Checklist item | Location where item is reported |
|---|---|---|---|
| TITLE | |||
| Title | 1 | Identify the report as a systematic review. | P1 |
| ABSTRACT | |||
| Abstract | 2 | See the PRISMA 2020 for Abstracts checklist. | P1 |
| INTRODUCTION | |||
| Rationale | 3 | Describe the rationale for the review in the context of existing knowledge. | P1-P2 |
| Objectives | 4 | Provide an explicit statement of the objective(s) or question(s) the review addresses. | P2 |
| METHODS | |||
| Eligibility criteria | 5 | Specify the inclusion and exclusion criteria for the review and how studies were grouped for the syntheses. | P2 |
| Information sources | 6 | Specify all databases, registers, websites, organisations, reference lists and other sources searched or consulted to identify studies. Specify the date when each source was last searched or consulted. | P2 |
| Search strategy | 7 | Present the full search strategies for all databases, registers and websites, including any filters and limits used. | P2-P3 |
| Selection process | 8 | Specify the methods used to decide whether a study met the inclusion criteria of the review, including how many reviewers screened each record and each report retrieved, whether they worked independently, and if applicable, details of automation tools used in the process. | P2-P3 |
| Data collection process | 9 | Specify the methods used to collect data from reports, including how many reviewers collected data from each report, whether they worked independently, any processes for obtaining or confirming data from study investigators, and if applicable, details of automation tools used in the process. | P2-P3 |
| Data items | 10a | List and define all outcomes for which data were sought. Specify whether all results that were compatible with each outcome domain in each study were sought (e.g. for all measures, time points, analyses), and if not, the methods used to decide which results to collect. | P2 |
| 10b | List and define all other variables for which data were sought (e.g. participant and intervention characteristics, funding sources). Describe any assumptions made about any missing or unclear information. | P2 | |
| Study risk of bias assessment | 11 | Specify the methods used to assess risk of bias in the included studies, including details of the tool(s) used, how many reviewers assessed each study and whether they worked independently, and if applicable, details of automation tools used in the process. | P2 |
| Effect measures | 12 | Specify for each outcome the effect measure(s) (e.g. risk ratio, mean difference) used in the synthesis or presentation of results. | P2 |
| Synthesis methods | 13a | Describe the processes used to decide which studies were eligible for each synthesis (e.g. tabulating the study intervention characteristics and comparing against the planned groups for each synthesis (item #5)). | P2-P3 |
| 13b | Describe any methods required to prepare the data for presentation or synthesis, such as handling of missing summary statistics, or data conversions. | P2-P3 | |
| 13c | Describe any methods used to tabulate or visually display results of individual studies and syntheses. | P2 | |
| 13d | Describe any methods used to synthesize results and provide a rationale for the choice(s). If meta-analysis was performed, describe the model(s), method(s) to identify the presence and extent of statistical heterogeneity, and software package(s) used. | P2 | |
| 13e | Describe any methods used to explore possible causes of heterogeneity among study results (e.g. subgroup analysis, meta-regression). | P2 | |
| 13f | Describe any sensitivity analyses conducted to assess robustness of the synthesized results. | P2 | |
| Reporting bias assessment | 14 | Describe any methods used to assess risk of bias due to missing results in a synthesis (arising from reporting biases). | P3 |
| Certainty assessment | 15 | Describe any methods used to assess certainty (or confidence) in the body of evidence for an outcome. | P2, PA7-PA8 |
| RESULTS | |||
| Study selection | 16a | Describe the results of the search and selection process, from the number of records identified in the search to the number of studies included in the review, ideally using a flow diagram. | P2-P3 |
| 16b | Cite studies that might appear to meet the inclusion criteria, but which were excluded, and explain why they were excluded. | P2 | |
| Study characteristics | 17 | Cite each included study and present its characteristics. | P2, PA1-PA6 |
| Risk of bias in studies | 18 | Present assessments of risk of bias for each included study. | PA7-PA8 |
| Results of individual studies | 19 | For all outcomes, present, for each study: (a) summary statistics for each group (where appropriate) and (b) an effect estimate and its precision (e.g. confidence/credible interval), ideally using structured tables or plots. | PA1-PA6 |
| Results of syntheses | 20a | For each synthesis, briefly summarize the characteristics and risk of bias among contributing studies. | P2-P3 |
| 20b | Present results of all statistical syntheses conducted. If meta-analysis was done, present for each the summary estimate and its precision (e.g. confidence/credible interval) and measures of statistical heterogeneity. If comparing groups, describe the direction of the effect. | P2-P7, PA1-PA6 | |
| 20c | Present results of all investigations of possible causes of heterogeneity among study results. | P2-P3 | |
| 20d | Present results of all sensitivity analyses conducted to assess the robustness of the synthesized results. | - | |
| Reporting biases | 21 | Present assessments of risk of bias due to missing results (arising from reporting biases) for each synthesis assessed. | P3 |
| Certainty of evidence | 22 | Present assessments of certainty (or confidence) in the body of evidence for each outcome assessed. | PA7 -PA8 |
| DISCUSSION | |||
| Discussion | 23a | Provide a general interpretation of the results in the context of other evidence. | P5-P6 |
| 23b | Discuss any limitations of the evidence included in the review. | P5-P7 | |
| 23c | Discuss any limitations of the review processes used. | P6 | |
| 23d | Discuss implications of the results for practice, policy, and future research. | P6-P7 | |
| OTHER INFORMATION | |||
| Registration and protocol | 24a | Provide registration information for the review, including register name and registration number, or state that the review was not registered. | P1-P2 |
| 24b | Indicate where the review protocol can be accessed, or state that a protocol was not prepared. | P1-P2 | |
| 24c | Describe and explain any amendments to information provided at registration or in the protocol. | P2 | |
| Support | 25 | Describe sources of financial or non-financial support for the review, and the role of the funders or sponsors in the review. | P7 |
| Competing interests | 26 | Declare any competing interests of review authors. | P7 |
| Availability of data, code and other materials | 27 | Report which of the following are publicly available and where they can be found: template data collection forms; data extracted from included studies; data used for all analyses; analytic code; any other materials used in the review. | PA1-PA6 |
P, page in the main text; PA, page in the file of additional tables 1-4.
Data extraction
Critical characteristics from all included studies were extracted and recorded (Additional Tables 1–3). The extracted data included the characteristics of participants (sample size, age, amblyopic eye and type, and treatment history), the modality of MRI technology (structural or functional MRI), analysis method (whole-brain analysis or ROI), and main between-group brain MRI findings (in precortical pathway or vision-related cortical regions). Two co-authors (YXW and YW) independently conducted the data extraction and double-checked the information. Any inconsistencies and disagreements were discussed, and a consensus was reached.
Additional Table 1.
Summary of 12 DTI and structural MRI studies in amblyopia, some of which combined with task-based or resting-state functional MRI
| Studies | Modality | Analysis method | Amblyopiceye and type | Patients number and age* | Ways and proportion of treatment received | Controls number and age* | Main findings |
|---|---|---|---|---|---|---|---|
| Liang et al., 2019 | 3DT1 | SBM(ROI) | AA: 12OS, 8OD | 9M/11F, 25.2±9.9 y | All had undergone treatment while the details were NA | 8M/12F, 26.7±7.4 y | Thinner cortical thickness in the bilateral V1, left V2, ventral V3, V4, and V5/MT+ were found in AA than HC. The cortical thicknesses in bilateral V1 negatively correlated with the difference value of the binocular refractive power in patients withAA. |
| Mendola et al.,2005 | 3DT1 | VBM (whole brain, ROI) | PediatricAA: 6OS, 10OD; Adult AA: 5OS, 4OD; PediatricSA: 5OS, 5OD; 8ES,2EX; Adult SA: 9OS, 4OD; 9ES, 4EX | Pediatric AA: 16, 9.8±1.2y; Adult AA: 9, 28.9±6.5y; Pediatric SA: 10, 9.7±1.5y; Adult SA: 13, 24.8±5.5y | Surgery: pediatric SA 5/10, adult SA 9/13. Patch: pediatric SA 9/10, adult of SA 10/13, pediatric AA 14/15, adult AA 8/9 | 17children, 10.2±1.5y; 10 adults, 25.2±3.8y | Pediatric AA and SA showed lower GMV in bilateral calcarine and paracalcarine cortex, medial parieto-occipital junction (but only in the right hemisphere for SA), lateral parieto-occipital junction, and ventral temporal cortex (wider reduction in AA than SA) than their respective pediatric HC. Adult AA and SA both showed lower GMV in calcarine cortex than their respective adult HC, the areas of which is larger inAA than SA. |
| Su et al., 2022 | 3DT1 | VBM (whole brain) | SA: 5ES, 11EX | SA: 5M/11F; 24.4±6.0 y | Noophthalmic surgery | 5M/11F; 25.7±5.9 y | Smaller GMV were found in the right superior temporal gyrus, and the posterior and anterior areas of cerebellum in patients with SA, and the mean GMV values in these areas were negatively correlated with the angle of strabismus in SA. |
| Barnes et al., 2010 | 3DT1, tfMRI | VBM and brain activation (ROI) | Adult SA: 7OS, 9OD; 14ES, 2EX | 10M/6F, 37.9±13.6 (20-69) y | Patch11/16 Surgery 3/16 Glasses 5/16 | 11, 34±5 y | SA had less gray matter density in the lateral geniculate nucleus than HC, which was correlated with the brain functional activation difference in V1 between AME and fellow eye. |
| Lu et al., 2020 | 3DT1, rfMRI | VBM and ReHo (whole brain) | PediatricAA: 16OS | 10M/6F, 6.9±2.3 y | Untreated | 8M/6F, 8.1±2.2 y | Lower ReHo in rightSTG and MFG and larger GMV in the right lobules 4 and 5 of the cerebellum and fusiform gyrus (which was negatively correlated with theReHo of MFG in patients) were foundin pediatric AA than controls. |
| Lin et al., 2012 | 3DT1, rfMRI | VBM and ReHo (whole brain) | AA: 7OS, 5OD, 1OU | 5M/8F, 22.3±7.2 (17-43) y | NA | 8M/13F, 23.5±2.1 y | In AA, there was no GMV alteration but lower ReHo in the right precuneus, left medial prefrontal cortex, inferior frontal gyrus, and cerebellum, as well as higher ReHo in the right middle occipital gyrus, left STG, and left fusiform gyrus compared with HC. |
| Qi et al., 2016 | 3DT1, DTI | SBM (whole brain), FA (ROI) | PediatricAA: 8OS, 7OD | 9M/6F, 8.0±1.3 (6.5-10.3) y | NA, but excluding patients who underwent long-term amblyopiatreatment | 8M/7F, 7.9±0.8 y | AA showed thicker cortical thickness in V1 but thinner extrastraite cortex of V2, lateral occipitotemporal gyrus, occipital lobe, inferior parietal lobe, and superior occipital cortex than HC. The FA in the bilateral optic radiations was correlated with the thinner cortex of V2, occipital gyrus, lateral occipitotemporal gyrus, lunate cortex. |
| Li et al., 2013b | 3DT1, DTI | VBM and FA (whole brain) | PediatricAA: 7OS, 8OD | 10M/5F, (6-15) y | Untreated | 15, (5-14) y | Compared to HC, AA showed reduced GMV in the left inferior occipital gyrus, increased GMV in the lingual gyrus, lower FA in the optic radiation, andhigher FA in the rightprecuneus and left middle occipital area in patients. |
| Li et al., 2015 | DTI | FA (whole brain, ROI) | PediatricAA: 8OS, 12OD | 15M/5F, 9.6±2.9 (5-14) y | Glasses 5/20 | 9M/9F, 10.8±2.1 (5-14) y | Smaller FA values was found in the right optic radiation, left ILF/IFO and right SLF of patients than HC, which were correlated with visual acuity of amblyopes. |
| Allen et al., 2018 | DTI | FA and MD (ROI) | AA: 6OS, 2OD; SA: 4OS, 1OD; | AA: 4M/4F, (13-37) y; SA: 4M/1F, (14-40) y | allhad undergone treatment while the details were NA | 13, 21.0±5.5 (14-34) y | AA showed lower FA values in the optic nerve and optic tract and greater MD in the optic radiation than controls. No differences between SA and AA nor between SA and controls. |
| Duan et al., 2015 | DTI | FA and MD (ROI) | Adult SA: 13ES, 3EX | 8M/8F, 45.3±13.3 (20-67) y | Surgery 11/16 | 15M/17F, 45.0±13.8y | Higher MD values were found in the left optic radiation, anterior frontal corpus callosum, right vertical occipital fasciculus, and left ILF of SA than HC. |
| Gupta et al., 2016 | DTI, tfMRI | FA and Brain activation (ROI) | PediatricSA: 5OS, 4OD | 4M/5F, 8±1.8 (6-10) y | Base line: untreated Patch:5 | 4M/6F, 8.8±2 (7-13) y | Under a flickering checkerboard task, less activation in the left occipital lobe evoked to the amblyopic eye was found in SA before the treatment than HC. The activation in striate cortex and exstrastriate cortex were increased after the treatment in patients. The FA of V1 and V5 in SA were significantly lower thancontrols, but thatwas nodifference after occlusion therapy. |
*Age represented as mean ± standard deviation or range. 3DT1: Three-dimensional T1-weighted imaging; AA: anisometropic amblyopia; DTI: diffusion tensor imaging; ES: esotropia; EX: exotropia; F: female; FA: fractional anisotropy; GMV: gray matter volume; HC: healthy controls; ILF/IFO: inferior longitudinal fasciculus/inferior fronto-occipital fasciculus; M, male; MD, mean diffusivity; MFG: middle frontal gyrus; MRI: magnetic resonance imaging; MT+: middle temporal complex; NA: not applicable; OD: right eye; OS: left eye; OU: both eyes; ReHo: regional homogeneity; ROI: region of interest; rs/tfMRI: resting-state/task-based functional MRI; SA: strabismic amblyopia; SBM: surface-based morphometry; SLF: superior longitudinal fasciculus; STG: superior temporal gyrus; VBM: voxel-based morphometry; WMV: white matter volume; y: years
Additional Table 3.
Summary of 14 studies in amblyopia used a single modality of resting-state functional MRI
| Studies | Analysis method | Amblyopiceye and type | Patients number and age* | Ways and proportionof treatment received | Controls number and age* | Main findings |
|---|---|---|---|---|---|---|
| Regionalhomogeneity (ReHo) | ||||||
| Yang et al., 2019 | ReHo (whole brain) | Adult SA: 5OS, 7OD | 4M/8F, 23.9±5.3 (18-35) y | NA | 12M/22F, 24.1±2.8 y | SA showed lower ReHo in V1, V2 and superior occipital gyrus and higher ReHo in the precuneus than HC. The ReHo of the precuneus negatively correlated with the age of AA patients. |
| Shao et al., 2019 | ReHo (whole brain) | Adult SA: 5ES, 11EX | 6M/10F, 24.5±5.9 y | No ophthalmic surgery | 6M/10F, 24.9±5.2 y | Higher ReHo in V2, bilateral middle occipital gyrus, precentral gyrus and right precuneus and lower ReHo in the left inferior frontal gyrus were found in SA than HC. |
| Amplitudeof low frequency fluctuation (ALFF) | ||||||
| Lianget al., 2016 | ALFF (whole brain) | Pediatric AA: 9OS, 6OD; Adult AA: 10OS, 5OD | Pediatric AA: 6M/9F,10.2±1.5 (8-12) y; Adult AA: 10M/5F, 21.5±4.7 (18-30) y | No amblyopia treatment inthe past month | Children:6M/7F, 10.9±2.1 (7-13) y; Adults: 10M/8F, 22.8±3.7 (18-30) y | Higher ALFF in bilateral V1 and left V2 was demonstrated in pediatric AA than HC. Lower ALFF in bilateral precuneus of adult AA positively correlated with patients’ amountof anisometropia. |
| Tanget al., 2017 | ALFF (whole brain) | AA: 8OD | 4F/4M, 14.5±5.0 (9-25) y | No surgery | 4F/6M, 19.4 ± 5.0 (10-25) y | Higher ALFF in the right inferior semi-lunar lobe, left inferior parietal lobe, and left superior temporal gyrus and lower ALFF in bilateral MFG were found in patients with AA thanHC. |
| Minet al., 2018 | ALFF (whole brain) | Adult SA: 5ES, 11EX | 6M/10F, 24.5±5.9 y | No ophthalmic surgery | 6M/10F, 24.9±5.2 y | SA showed higher ALFF in the left cuneus, right superior frontal gyrus, bilateral precentral gyrus, and precuneus and lower ALFF in the left cerebellum and left MFG thanHC. |
| Functionalconnectivity (FC) | ||||||
| Shiet al., 2022 | Voxel-wise FC | Pediatric SA: NA | 14M/12F, 8.2±2.1 y | No ophthalmic surgery | 14M/12F, 8.4 ± 1.9 y | Compared withHC, lower global FCD in the left cerebellum, and superior frontal gyrus, and higher globalFCD inthe bilateral angular gyrus, right superior parietal gurus, and rightMFG were foundin patientswith SA. The local FCD was lower in the bilateral cerebellum andhigher inrightsuperior parietalgyrus inSA than HC. |
| Peng et al., 2021 | VMHC | Pediatric SA: 14ES, 10EX | 16M/8F, 9.3±3.2 y | No ophthalmic surgery | 16M/8F, 9.9±2.8 y | SA showed lower VMHC in bilateral inferior temporal gyrus, bilateral cerebellum, bilateral frontal superior orbital gyrus, and bilateral superior frontal gyrus than HC. |
| Zhanget al., 2021 | VMHC | Adult SA: NA | 8M/9F, 23.6±5.2 y | No ophthalmic surgery | 8M/9F, 23.2±5.8 y | SA showed higher VMHC values in bilateral caudate, anterior cingulate gyrus 1, and cerebellum crus than HC. The esotropia deviations of patients correlated with the VMHCof the cerebellum crus 1. |
| Wu et al., 2020 | DC (whole brain) | Adult SA: 5ES, 11EX | 6M/10F, 24.5±5.9 y | No ophthalmic surgery | 6M/10F, 24.9±5.2 y | SA showed higher DC in left fusiform gyrus, right lingual gyrus, and right middle occipital gyrus and lower DC in the left middle frontal gyrus and bilateral angular gyri than HC. |
| Liu et al., 2022 | ROI-wise FC | Adult SA: 6ES ,10EX | 5M/11F, 25.7±4.9 y | No ophthalmic surgery | 5M/11F, 25.0± 5.3 y | Lower FC between left V1 and bilateral lingual/angular gyri, and lower FC between right V1 and left cuneus, right inferior occipital gyrus, and left inferior parietal lobule were found inpatients with SA thanHC. |
| Lianget al., 2017 | VMHC | SA: 12OS, 6OD; 12ES, 6EX; AA: 13OS, 6OD | SA: 8M/10F, 24.3±6.9 y; AA: 13M/6F, 21.2±5.1 y | SA: Surgery 18/18 AA: NA | 12M/8F, 22.8±4.2 y | Compared with HC, higher VMHC was founded in the fusiform gyrus of AA, which was lower in patients of SA than HC. Both patients with SA and AA showed higher VMHC in lingual gyrus than HC, and AA showed higher VMHC in lingual than SA. The VMHC in fusiform gyrus positively correlated with the amount of anisometropia inAA group. |
| Wang et al., 2014 | Voxel-wise FC, ROI-wise FC | Pediatric AA: 6OS, 8OD | 11M/3F, 9.6±2.9 (5-15) y | Glasses 3/14 | 6M/3F, 11.3±2.9 (5-15) y | AA showed lower short-range FCD in the left inferior temporal gyrus/fusiform gyrus and left dorsal parieto-occipital cortex, and lower long-range FCD in frontal-insular cortex, premotor cortex, and dorsal inferior parietal lobe than HC. Most regions with reduced long-range FCD showed reduced FC with occipital and posterior parietal cortices. |
| Lu et al., 2019 | ROI-wise FC | Adult AA: NA | 12M/6F, 23.7±1.9 (20-27) y | NA | 14M/4F, 25.2±1.8 (23-29) y | AA showed less FC in the extrastriate network (key nodes including V2, V3, and V4) and visuospatial network (key nodes including superior parietal lobule, intraparietal area 3, and frontal eye field, etc.) compared to HC. The local efficiency in V3, V4, and inferior parietal area was lower in patients with AA thanHC. |
| Ding et al., 2013 | ROI-wise FC | AA: 7OS, 5OD,1OU | AA: 5M/8F, 22.3±7.2 (17-43) y | No ophthalmic surgery | 8M/13F, 23.5±2.1 y | AA showed lower FC between bilateral V1 and the inferior parietal lobe and cerebellum, respectively, than HC. |
* Age represented as mean ± standard deviation or range. AA: anisometropic amblyopia; DC: degree centrality; ES: esotropia; EX: exotropia; F: female; FCD: functional connectivity density; HC: healthy controls; M: male; MFG: middle frontal gyrus; MRI: magnetic resonance imaging; NA: not applicable; OD: right eye; OS: left eye; OU: both eyes; ROI: region of interest; SA: strabismic amblyopia; SFG: superior frontal gyrus;VMHC: voxel-mirrored homotopic connectivity; y: years.
Quality assessment and data analysis
We used an eight-item checklist to assess the quality of the study and the risk of bias; this checklist was compiled in accordance with the Regulation on Extended Reporting of Observational Epidemiological Studies (von Elm et al., 2007; Additional Table 4). A maximal score of one was given for each item. The checklist focused on the characteristics of participants to consider the heterogeneity of diagnosis, including an evaluation of whether the descriptions of patients and controls were clear and adequate. In addition, items assessing the imaging methodology and statistical analysis results were taken into account. Any study scoring more than five points was included in this systematic review. Two independent authors (YXW and YW) performed the quality assessment and had discussions to reach a consensus on disagreements. Differences in the structure and function of brains between patients with amblyopia and controls, or between the two subgroups of amblyopia, were qualitatively described and divided into two sections regarding effects in the precortical pathway and vision-related cortical regions.
Additional Table 4.
The checklist of quality assessment for included studies in the present systematic review
| Study | Qualityassessment criteria | ||||||||
|---|---|---|---|---|---|---|---|---|---|
| 1.Were the descriptions of the patient group clear and adequate? (e.g., inclusion criteria strabismus or refraction) 1= yes, 0= no or too less information | 2. Were thedescriptions of the control group clear and adequate? (e.g., inclusion criteria, age, and gender)1= yes, 0=no or tooless information | 3. Were the patient group comparable to the control group in terms of age and gender? 1= yes, 0= no | 4. Whether patientswere combined with other subtypes ?= yes, 1= no | 5. Whatis the magnetic field strength? 1=3.0 Tesla, 0= 1.5Tesla | 6.Whether the descriptions of the imaging technique were clear sothat it couldbe reproduced? 1=yes, 0= no | 7. Whether statisticalresults were corrected for multiple comparison?1= corrected, 0= uncorrected | 8. Whether the conclusions were consistentwith the results obtained, andthe limitations were discussed? 1=yes, 0= no | Total score | |
| Lianget al., 2019 | 1 | 1 | 1 | 1 | 1 | 1 | 1 | 1 | 8 |
| Mendola et al., 2005 | 1 | 1 | 1 | 0 | 0 | 1 | 0 | 1 | 5 |
| Su et al., 2022 | 1 | 1 | 1 | 1 | 1 | 1 | 1 | 1 | 8 |
| Barnes et al., 2010 | 1 | 1 | 1 | 0 | 0 | 1 | 1 | 1 | 6 |
| Lu et al., 2020 | 1 | 1 | 1 | 1 | 0 | 1 | 0 | 1 | 6 |
| Lin et al., 2012 | 1 | 1 | 1 | 1 | 1 | 1 | 1 | 1 | 8 |
| Qi et al., 2016 | 1 | 1 | 1 | 0 | 1 | 1 | 1 | 1 | 7 |
| Li et al., 2013b | 1 | 1 | 1 | 1 | 0 | 1 | 0 | 1 | 6 |
| Li et al., 2015 | 1 | 1 | 1 | 1 | 0 | 1 | 0 | 1 | 6 |
| Allen et al., 2018 | 1 | 1 | 1 | 1 | 1 | 1 | 0 | 1 | 7 |
| Duanet al., 2015 | 1 | 1 | 1 | 1 | 1 | 1 | 0 | 1 | 7 |
| Gupta et al., 2016 | 1 | 1 | 1 | 1 | 0 | 1 | 1 | 1 | 7 |
| Lee et al.,2001 | 1 | 1 | 1 | 1 | 0 | 1 | 1 | 1 | 7 |
| Wang et al., 2012 | 1 | 1 | 1 | 1 | 1 | 1 | 0 | 1 | 7 |
| Li et al., 2012 | 1 | 1 | 1 | 1 | 0 | 1 | 0 | 1 | 6 |
| Li et al., 2013a | 1 | 0 | 1 | 1 | 1 | 1 | 0 | 1 | 6 |
| Muckli et al., 2006 | 1 | 1 | 1 | 0 | 0 | 1 | 1 | 1 | 6 |
| Hou et al.,2016 | 1 | 1 | 1 | 0 | 1 | 1 | 1 | 1 | 7 |
| Wang et al., 2017 | 1 | 1 | 1 | 0 | 1 | 1 | 1 | 0 | 6 |
| Thompson et al., 2019 | 1 | 1 | 1 | 0 | 1 | 1 | 1 | 1 | 7 |
| Ho and Giaschi, 2009 | 1 | 1 | 1 | 0 | 1 | 1 | 1 | 1 | 7 |
| Bonhomme et al., 2006 | 1 | 0 | 1 | 1 | 0 | 1 | 0 | 1 | 5 |
| Farivar et al., 2019 | 1 | 1 | 1 | 1 | 1 | 1 | 0 | 1 | 7 |
| Huanget al., 2017 | 1 | 1 | 1 | 1 | 1 | 1 | 1 | 0 | 7 |
| Clavagnier et al., 2015 | 1 | 1 | 1 | 0 | 1 | 1 | 1 | 1 | 7 |
| Yanget al., 2019 | 1 | 1 | 1 | 1 | 1 | 1 | 1 | 1 | 8 |
| Shao et al., 2019 | 1 | 1 | 1 | 1 | 1 | 1 | 1 | 1 | 8 |
| Lianget al., 2016 | 1 | 1 | 1 | 1 | 1 | 1 | 1 | 1 | 8 |
| Tang et al., 2017 | 1 | 1 | 1 | 1 | 1 | 1 | 1 | 1 | 8 |
| Min et al., 2018 | 1 | 1 | 1 | 1 | 1 | 1 | 1 | 1 | 8 |
| Shi et al., 2022 | 1 | 1 | 1 | 1 | 1 | 1 | 1 | 1 | 8 |
| Peng et al., 2021 | 1 | 1 | 1 | 1 | 1 | 1 | 1 | 1 | 8 |
| Zhang et al., 2021 | 1 | 1 | 1 | 1 | 1 | 1 | 1 | 1 | 8 |
| Wu et al., 2020 | 1 | 1 | 1 | 1 | 1 | 1 | 1 | 1 | 8 |
| Liu et al., 2022 | 1 | 1 | 1 | 1 | 1 | 1 | 1 | 1 | 8 |
| Lianget al., 2017 | 1 | 1 | 1 | 1 | 1 | 1 | 1 | 1 | 8 |
| Wang et al., 2014 | 1 | 1 | 1 | 1 | 0 | 1 | 1 | 1 | 7 |
| Lu et al., 2019 | 1 | 1 | 1 | 1 | 1 | 1 | 1 | 1 | 8 |
| Ding et al., 2013 | 1 | 1 | 1 | 1 | 1 | 1 | 1 | 1 | 8 |
Results
Search results and quality assessment
Figure 2 shows a flowchart of the search and selection process. Thirty-nine studies were included in the present review, with 16 studies investigating AA (Bonhomme et al., 2006; Li et al., 2012, 2013a, b, 2015; Lin et al., 2012; Ding et al., 2013; Wang et al., 2014; Liang et al., 2016, 2019; Qi et al., 2016; Huang et al., 2017; Tang et al., 2017; Farivar et al., 2019; Lu et al., 2019, 2020), 16 studies investigating SA (Barnes et al., 2010; Clavagnier et al., 2015; Duan et al., 2015; Gupta et al., 2016; Hou et al., 2016; Wang et al., 2017; Min et al., 2018; Shao et al., 2019; Thompson et al., 2019; Yang et al., 2019; Wu et al., 2020; Peng et al., 2021; Zhang et al., 2021; Liu et al., 2022; Shi et al., 2022; Su et al., 2022), and seven studies including both AA and SA as separate subgroups for analyses (Lee et al., 2001; Mendola et al., 2005; Muckli et al., 2006; Ho and Giaschi, 2009; Wang et al., 2012; Liang et al., 2017; Allen et al., 2018). Notably, during our selection process, we identified 32 studies that recruited a mixture of patients with AA and SA but combined them as a whole patient group for analysis without performing subgroup analyses for AA and SA; these 32 studies (e.g., Algaze et al., 2002; Xiao et al., 2007; Wen et al., 2021) were excluded from our review, as shown in Figure 2. The descriptions of the patient and control groups for all of the included studies were detailed and adequate (three scores for 11 studies and four scores for 28 studies). Most studies (33/39) had a high methodological quality assessment score (three or four). Quality scores for all studies are reported in Additional Table 4.
Figure 2.
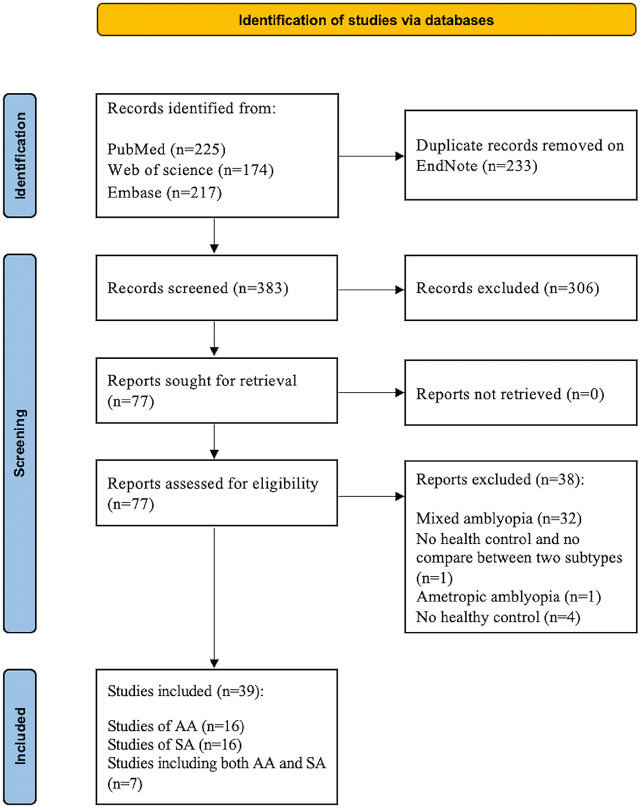
Flowchart of the selection procedure for the present review of brain magnetic resonance imaging (MRI) studies in patients with anisometropic amblyopia (AA) and strabismic amblyopia (SA).
Study characteristics
There were 633 patients (324 patients with AA and 309 patients with SA) and 580 healthy controls in the 39 studies included in the present review. Most studies featured similar proportions of male and female participants (Bonhomme et al., 2006; Muckli et al., 2006; Barnes et al., 2010; Li et al., 2012; Lin et al., 2012; Wang et al., 2012, 2017; Ding et al., 2013; Clavagnier et al., 2015; Duan et al., 2015; Gupta et al., 2016; Hou et al., 2016; Qi et al., 2016; Tang et al., 2017; Min et al., 2018; Liang et al., 2019; Shao et al., 2019; Lu et al., 2020; Wu et al., 2020; Zhang et al., 2021; Shi et al., 2022), although the sex of the participants was not reported in two studies (Mendola et al., 2005; Ho and Giaschi, 2009). Eight studies included more male patients than female patients (no less than a ratio of 2:1) (Wang et al., 2014; Li et al., 2015; Huang et al., 2017; Farivar et al., 2019; Lu et al., 2019; Thompson et al., 2019; Peng et al., 2021). Three studies included more female patients than male patients (almost a ratio of 2:1) (Yang et al., 2019; Liu et al., 2022; Su et al., 2022), and one study recruited more male adult patients and similar proportions of male and female pediatric patients (Liang et al., 2016). One study recruited more female patients with SA than male patients and similar proportions of males and females with AA (Allen et al., 2018). Two studies recruited more male patients than female patients with AA and similar proportions of males and females with SA (Lee et al., 2001; Liang et al., 2017).
Twelve studies focused on children and adolescents (4–18 years of age) (Bonhomme et al., 2006; Ho and Giaschi, 2009; Li et al., 2012, 2013b, 2015; Wang et al., 2012, 2014; Gupta et al., 2016; Qi et al., 2016; Lu et al., 2020; Peng et al., 2021; Shi et al., 2022); 16 studies mainly focused on adult patients (age ≥ 18 years) (Muckli et al., 2006; Barnes et al., 2010; Clavagnier et al., 2015; Duan et al., 2015; Hou et al., 2016; Huang et al., 2017; Min et al., 2018; Farivar et al., 2019; Lu et al., 2019; Shao et al., 2019; Thompson et al., 2019; Yang et al., 2019; Wu et al., 2020; Zhang et al., 2021; Liu et al., 2022; Su et al., 2022); two studies recruited both child and adult patients and analyzed these populations separately (Mendola et al., 2005; Liang et al., 2016); eight studies included patients with a broad range of ages (10–43 years) without subgroup analyses based on age (Lin et al., 2012; Ding et al., 2013; Li et al., 2013a; Liang et al., 2017, 2019; Tang et al., 2017; Wang et al., 2017; Allen et al., 2018); and in one study, the patients with AA were children and adolescents (age 8–17 years), while SA patients were children and adults (age 5–23 years) (Lee et al., 2001).
Patients in 12 studies received patch therapy, glasses, or surgery, before undergoing MRI scans (Mendola et al., 2005; Bonhomme et al., 2006; Muckli et al., 2006; Ho and Giaschi, 2009; Barnes et al., 2010; Wang et al., 2014, 2017; Clavagnier et al., 2015; Duan et al., 2015; Li et al., 2015; Hou et al., 2016; Thompson et al., 2019). In two studies, although all patients were previously treated for amblyopia, the authors did not mention the specific treatment methods (Allen et al., 2018; Liang et al., 2019). In another study, patients with SA had undergone surgery, but the treatment history of AA patients was not mentioned (Liang et al., 2017). Three studies included patients who did not receive treatment (Li et al., 2013a, b; Lu et al., 2020). One study involved patients who did not receive treatment for amblyopia over the past month (Liang et al., 2016). Ten studies included patients who did not undergo ophthalmic surgery (Ding et al., 2013; Tang et al., 2017; Min et al., 2018; Shao et al., 2019; Wu et al., 2020; Peng et al., 2021; Zhang et al., 2021; Liu et al., 2022; Shi et al., 2022; Su et al., 2022), and one study excluded patients who continued long-term treatment of the amblyopic eye (Qi et al., 2016). One longitudinal study excluded patients with a history of prior patching, atropine penalization, or pharmacological therapy for amblyopia at baseline (Gupta et al., 2016). For eight studies (Lee et al., 2001; Li et al., 2012; Lin et al., 2012; Wang et al., 2012; Huang et al., 2017; Farivar et al., 2019; Lu et al., 2019; Yang et al., 2019), we could not acquire a detailed treatment history for patients before their MRI scans even after we contacted the corresponding authors for the missing information by email (i.e., gender and treatment history).
MR neuroimaging modalities
We identified only one longitudinal study (Gupta et al., 2016); all of the other 38 studies were cross-sectional with a case-control design. Of the 39 studies, three studies used a single modality of structural MRI (sMRI, referring to three-dimensional high-resolution T1-weighted MR imaging (Zhao et al., 2022)) to assess brain morphology using voxel-based morphology and surface-based morphometry (Mendola et al., 2005; Liang et al., 2019; Su et al., 2022); of these three studies, one combined whole-brain and ROI approaches (Mendola et al., 2005), one performed ROI analysis (Liang et al., 2019), and one performed whole-brain analysis (Su et al., 2022).
One study combined sMRI and task-based functional MRI (tfMRI) to investigate the correlation between structural and functional alterations in the brain (Barnes et al., 2010) and two other studies combined sMRI and rfMRI to investigate the correlation between structural alterations and spontaneous brain activity in patients with amblyopia (Lin et al., 2012; Lu et al., 2020). Two studies combined sMRI and diffusion tensor imaging (DTI) to explore both GMV and white matter microstructure alterations in patients with amblyopia (Li et al., 2013b; Qi et al., 2016). Three studies employed a single modality of DTI to investigate microstructural changes in the FA or MD of white matter (Duan et al., 2015; Li et al., 2015; Allen et al., 2018). One longitudinal study combined DTI and tfMRI to explore changes in FA and cortical functional activation in patients with SA following occlusion therapy (Gupta et al., 2016).
To investigate alterations in functional brain activation responding to visual stimuli, thirteen studies used a single modality of tfMRI, which implemented temporospatial resolution stimuli through various temporal and spatial phase-reversing black and white checkerboards (Lee et al., 2001; Li et al., 2012, 2013a; Wang et al., 2012) or gratings (Muckli et al., 2006), measured the effect of attention modulation (Ho and Giaschi, 2009; Hou et al., 2016; Wang et al., 2017; Thompson et al., 2019) and motion perception (Bonhomme et al., 2006), and explored the functional activation patterns and magnitude of retinotopic representations in patients with amblyopia (Clavagnier et al., 2015; Huang et al., 2017; Farivar et al., 2019). Fourteen studies used rfMRI to evaluate spontaneous neural functional alterations and connections using regional homogeneity (ReHo) (Shao et al., 2019; Yang et al., 2019), amplitude of low-frequency fluctuation (ALFF) (Liang et al., 2016; Tang et al., 2017; Min et al., 2018), and FC (Ding et al., 2013; Wang et al., 2014; Liang et al., 2017; Lu et al., 2019; Wu et al., 2020; Peng et al., 2021; Zhang et al., 2021; Liu et al., 2022; Shi et al., 2022).
Alterations in the precortical pathway
With regards to white matter pathways in patients with amblyopia, Allen et al. compared eight patients with AA aged 13 to 37 years with 13 age-matched controls and found that AA patients exhibited a significantly lower FA in the optic nerve and the optic tract and a higher MD in the optic radiation than controls (Allen et al., 2018). Other studies of children with AA also demonstrated lower FA values in optic radiation (Li et al., 2013b, 2015; Qi et al., 2016) which were positively correlated with the reduced thickness of the visual cortex of the V2, lunate, occipital, and occipitotemporal cortex (Qi et al., 2016). These findings revealed that the integrity of optic radiation not only affects the function of the visual cortex of AA patients but also influences the structural organization of the visual cortex (Toosy et al., 2004).
For patients with SA aged 14 to 40 years, there were no differences in FA values in the optic nerve, optic tract, or optic radiation when compared with those for controls (Allen et al., 2018). However, Duan et al. reported increased MD values in the left optic radiation in an adult group of SA patients relative to those of controls (Duan et al., 2015). In addition, reduced gray matter density was identified in the LGN of adults with SA when compared with that in controls; this was negatively correlated with the brain activity in V1 of SA patients when stimulated by retinotopic wedge and annulus checkerboards (Barnes et al., 2010).
Alterations in cortical regions
MRI findings in AA patients
Structural MRI
Compared with 15 healthy controls, 15 young children with AA had a greater cortical thickness in V1 but a lower cortical thickness in the bilateral V2, lateral temporo-occipital gyrus, and inferior parietal lobe (Qi et al., 2016). However, Liang et al. (2019) investigated structural alterations in 20 early adult AA patients and reported reduced cortical thicknesses in the bilateral V1 and left V2, V3, V4, and V5. Similarly, Mendola et al. (2005) reported a smaller GMV in the transverse occipital sulcus, collateral sulcus, parieto-occipital sulcus, and ventral temporal cortex of AA patients; more restricted alterations in the same areas were seen in the adult AA group compared with that in the pediatric AA group. Reduced GMV was also demonstrated in the left inferior occipital gyrus but was increased in the lingual gyrus in pediatric AA patients when compared with that in healthy controls (Li et al., 2013b); these discrepancies in the structure of the visual cortex may be due to variant courses of amblyopia. Two other studies reported no GMV alteration in the visual cortex (Lin et al., 2012; Lu et al., 2020) but greater GMV in right cerebellar lobules 4 and 5 in AA patients (Lu et al., 2020); this increase in GMV was correlated with ReHo of the right middle frontal gyrus (Lu et al., 2020). With regards to the white matter tracts connecting visual and other cerebral cortices, microstructural diffusivity alterations were reported in the left inferior longitudinal fasciculus/inferior fronto-occipital fasciculus and right superior longitudinal fasciculus in pediatric AA patients (Li et al., 2015); furthermore, the FA values in these areas were correlated with visual acuity.
Task-based functional MRI
Patients with amblyopia are characterized by reduced contrast responses; the visual cortex of the occipital lobe is the central part of the cerebral cortex responsible for processing visual information. Li et al. (2012) reported reduced functional activation in striate and extrastriate cortices evoked from the amblyopic eye when compared with that of the other eye in children with AA; this effect did not exist between the eyes of healthy volunteers when viewing reversible black and white checkerboard stimuli. Compared with that in healthy controls, activation in V1 (Lee et al., 2001; Wang et al., 2012; Li et al., 2013a), V2 (Wang et al., 2012; Li et al., 2013a), V3 accessory (V3a)/ventral posterior area, lateral occipital complex, and V4+/V8 (Muckli et al., 2006) evoked from the amblyopic eyes of AA patients was significantly lower at all spatial and temporal stimuli, especially at higher spatial-frequency gratings. Reduced activation in V3a and V5 was also identified in pediatric AA patients when amblyopic eyes were stimulated with moving rings (Bonhomme et al., 2006). Moreover, AA patients demonstrated differences in activated cluster size from amblyopic eyes when compared with controls. Huang et al. compared 20 adult AA patients with 10 controls and reported that the activated cluster size in V1, V2, and V3 responding to the retinotopic stimulus was smaller than that of the dominant eye of controls; this was negatively correlated with amblyopia acuity in fovea and parafovea eccentricities (Huang et al., 2017). The multifocal stimulation paradigm in fMRI can be applied to simultaneously determine the amplitude of the blood oxygenation level-dependent (BOLD) signal and the responsive location using unpredictable stimulation of multiple rotating checkerboards with different sizes arranged in different concentric circles (Vanni et al., 2005). Using this paradigm, Farivar et al. (2019) compared 19 adults with AA with ten controls and showed that the AA patients demonstrated more significant interocular deviations of the response peak location and lower activation intensity in V1, V2, and V3; moreover, both brain functional activation and interocular location differences were correlated with interocular visual acuity difference in amblyopia patients, especially in V2 and V3.
Resting-state functional MRI
The application of rfMRI has led to the detection of altered regional brain spontaneous function in AA patients. Most previous studies explored ALFF and ReHo values in patients with amblyopia; ALFF reflects the amplitude of the low-frequency oscillations at rest (Zou et al., 2008) while ReHo delineates functional similarity and synchronization between the resting BOLD signal time series of a given voxel and its nearest neighbors (Zang et al., 2004). For example, higher ReHo and ALFF values have been demonstrated in the bilateral V1, V2, and V3 of AA patients (Lin et al., 2012; Liang et al., 2016). Liang et al. (2016) found that a higher ALFF in children with AA involved more extensive areas, such as the bilateral calcarine and left middle occipital gyrus, while adult patients only demonstrated lower ALFF in the bilateral precuneus when compared to controls. Furthermore, compared with controls, pediatric AA patients demonstrated a lower ReHo in the superior temporal gyrus (Lu et al., 2020); however, ReHo values were identified in AA patients in the 17–43-year-old age range (Lin et al., 2012). This may reflect age-related disparity due to adaptive and compensatory processes in patients with AA. In addition, Tang et al. detected a higher ALFF in the superior temporal gyrus of patients with AA (Tang et al., 2017). AA patients have also been reported to demonstrate widespread lower ALFF and ReHo values in the nonvisual cortex, including the oculomotor system, including the posterior inferior and middle frontal gyrus and cerebellum (Lin et al., 2012; Tang et al., 2017; Lu et al., 2020). Lower ReHo and ALFF values in the precuneus were reported in patients with AA (Lin et al., 2012; Liang et al., 2016) and the ALFF of the precuneus correlated with binocular acuity differences in AA patients (Liang et al., 2016).
To explore FC patterns of visual areas, Ding et al. reported a lower FC between bilateral V1 and the higher visual cortex of the bilateral inferior parietal lobe in 13 AA patients than 21 controls (Ding et al., 2013). Lu et al. (2019) explored FC among 19 ROIs located in the bilateral V1, extrastriate network (key areas including bilateral V2, V3, and V4), and visuospatial networks (mainly including the intraparietal area 3, superior parietal lobule, and frontal eye fields [FEF]) and detected lower FC in the extrastriate network and the visuospatial network in adult AA patients than in controls. In one study, pediatric AA patients demonstrated lower long-range FC density (FCD) in the fronto-insular cortex, premotor cortex, and dorsal inferior parietal lobe and lower short-range FCD in the parieto-occipital cortex and inferior temporal gyrus/fusiform gyrus when compared with controls (Wang et al., 2014).
MRI findings in SA patients
Structural MRI
Mendola et al. reported a lower GMV in the bilateral calcarine and paracalcarine cortex, lateral parieto-occipital junction, and ventral temporal cortex of pediatric SA patients when compared to the GMV of controls and indicated that areas with a lower GMV were more limited in adult patients (Mendola et al., 2005). Barnes et al. (2010) and Su et al. (2022) both reported no gray matter concentration or volume alterations in the striate cortex of adult SA patients; however, a lower GMV was found in the right superior temporal gyrus and both posterior and anterior areas of the cerebellum, and a negative correlation was found between the GMV in those areas and the angle of strabismus in SA patients (Su et al., 2022). In another study, Duan et al. (2015) compared 16 adult SA patients with 32 age-matched controls and found higher MD values in the anterior corpus callosum, left inferior longitudinal fasciculus and optic radiation, and right vertical occipital fasciculus. The FA in V1 and V5 of pediatric SA patients were significantly lower than that of controls, but these alterations recovered to normal levels after occlusion therapy (Gupta et al., 2016).
Task-based functional MRI
To explore the spatial-frequency dependence of fMRI response in amblyopia patients, Lee et al. (2001) compared five adults with SA and three healthy controls at a spatial frequency of 2, 1, 0.5, or 0.25 cycles per degree and found no reduced ratio of V1 activation from the amblyopic eye in SA patients at high spatial frequency; however, the ratio of activated voxel numbers of fellow and amblyopic eye monocular stimulations was smaller in the V1 of adult SA patients than in AA patients and controls. Compared with healthy controls, pediatric patients with SA showed reduced brain activation in the striate and extrastriate cortex when viewing various temporospatial stimuli, especially in V2 at high spatial-frequency stimulation (Wang et al., 2012). Similarly, during a flickering checkerboard task, lower activation was reported in V1 from the right amblyopic eye of pediatric SA patients when compared to that in the dominant eye of controls; moreover, there was lower activation in the left temporal gyrus from the left amblyopic eye of pediatric SA patients when compared to that in the non-dominant eye of controls. Of note, there was increased activation in the parieto-occipital pathway after occlusion treatment in five patients with left SA (Gupta et al., 2016).
Clavagnier et al. (2015) investigated the cortical functional deficits of SA patients by applying population receptive field (pRF) fMRI. pRF fMRI has been actively applied to various aspects of research over recent years. This technique aims to acquire the location and size of the pRF, which is defined as a group of neurons within an fMRI imaging voxel responding to sensory stimulation (Klein et al., 2014; Welbourne et al., 2018). The cortical magnification factor (CMF) refers to the cortical surface distance between two points 1° apart from the visual field position (Daniel and Whitteridge, 1961). Receptive fields, as basic structural and functional units of the visual system, are fundamental properties of the visual cortex together with the CMF. Compared with healthy controls, adult SA patients showed normal CMF and greater pRF sizes in the amblyopic eye, as well as more disarray in the pRF distribution between two eyes in V1, V2, and V3. This finding may suggest fewer activated neurons, more disrupted receptive fields, a reduced contribution from smaller receptive fields for the visual input from the amblyopic eye, and neuronic ectopia in patients with amblyopia (Clavagnier et al., 2015). Clavagnier et al. (2015) used corticocortical pRF analysis to predict visual cortex representation from that of V1 to assess how pRF alterations in V2 and V3 depend on the properties of V1 and found that the corticocortical pRF sizes in V2 and V3 (when multiplied by the CMF in V1) decreased along with eccentricity in amblyopic SA eyes when compared to fellow eyes and normal eyes. This finding suggested that there might be additional components in the functional deficiencies of V2 and V3 beyond those directly resulting from V1 deficits.
To evaluate the deficit of attention modulation in adult SA patients, Thompson et al. used dichoptic non-overlapping stimuli and found no interocular differences in fMRI signal amplitude in V1, V2, and V3, and no alterations in effective connectivity between V1 and V2 or between V2 and V3 according to responses in the amblyopic eye compared with the responses in normal participants (Thompson et al., 2019). This finding suggested that alterations in the attention modulation of SA patients may depend on alterations in more rostral cortical regions. Hou et al. used grating stimuli with the Michelson luminance contrast increment to assess the extent of selective attention modulation in V1, V4, and the MT complex (MT+) of adult SA patients (Hou et al., 2016). Weaker activations in V1, V4, and MT+ from the amblyopic eye were identified, and the weaker activation in V1 from the amblyopic eye was correlated with the magnitude of interocular suppression and the interocular acuity difference of SA. However, lower activation did not exist in V1 from the fellow eye of amblyopic patients when compared to that in controls (Hou et al., 2016). Furthermore, Wang et al. (2017) assessed the functional activation of areas in the fronto-parieto-occipital network in SA patients and found that SA patients demonstrated weaker activation in V1 from the amblyopic eye than healthy controls in terms of both motion salience and voluntary saccade tasks, as well as decreased FC between the FEF and V1, and between FEF and V5, in the amblyopic eye when compared to both the fellow eye of amblyopia patients and controls during the motion salience task.
Resting-state functional MRI
Two studies revealed higher ReHo and ALFF values in the visual cortex (e.g., V1 and V2) of adult SA patients, when compared to controls (Min et al., 2018; Shao et al., 2019), although Yang et al. (2019) detected a lower ReHo in V1 and V2 of adult SA patients than in controls. These findings are not consistent, and discrepancies in V1 and V2 findings may reflect the small sample sizes and clinical heterogeneities of study populations. Furthermore, when compared with controls, adult SA patients have intrinsic brain functional alterations, such as lower ReHo and ALFF values in the nonvisual cortices associated with the visuomotor coordination system (e.g., inferior frontal gyrus, medial frontal gyrus, and cerebellum) (Min et al., 2018) but higher ReHo and ALFF values in the bilateral precentral gyrus and precuneus (Min et al., 2018; Shao et al., 2019; Yang et al., 2019).
Based on graph theory, FCD is a functional imaging feature that quantifies the number of local or global functional connections for each voxel in the brain, while degree centrality (DC) is used to quantify the local centrality and the extent to which a brain area is relevant to the brain networks (Li et al., 2019; Qi et al., 2020). Compared with healthy controls, adult SA patients showed a lower DC and higher global FCD in the angular gyrus (Wu et al., 2020; Shi et al., 2022) and higher DC in the right lingual gyrus, right middle occipital lobe, and fusiform gyrus (Wu et al., 2020). In visuomotor coordination areas, pediatric SA patients demonstrated lower FCD in the cerebellum and superior frontal gyrus (Shi et al., 2022) and higher global-range FCD and lower DC in the medial frontal gyrus (Wu et al., 2020; Shi et al., 2022).
With regards to intrinsic functional coupling, Liu et al. (2022) compared 16 adult SA patients with age- and sex-matched controls and found that the left V1 showed lower FC with the bilateral lingual/angular gyri, and the right V1 demonstrated lower FC with the left cuneus, right inferior occipital gyrus, and left inferior parietal lobule in patients with SA. Voxel-mirrored homotopic connectivity (VMHC) was evaluated by quantifying FC between each voxel in bilateral hemispheric symmetric brain regions to measure interhemispheric information exchange (Cao et al., 2022). For adult SA patients, there were higher VMHC values in the bilateral caudate, anterior cingulate gyrus, and cerebellum crus 1; moreover, the angle of esotropia deviations in adult SA patients was correlated with the VMHC values of the bilateral cerebellum crus 1 (Zhang et al., 2021). In contrast, pediatric SA patients showed lower VMHC values in the bilateral cerebellum, orbitofrontal cortex, and inferior temporal gyrus (Peng et al., 2021). The contrasting values in the cerebellum may be due to the different atlases adopted by different studies but may also represent brain maturation and compensatory effects in children and adults.
Direct comparisons between AA and SA patients
With regards to studies that described quantitative comparisons between the two types of amblyopia, children with SA showed a smaller area of reduced GMV in the ventral temporal cortex than that of AA patients (Mendola et al., 2005). Compared with children with AA, pediatric SA patients demonstrated reduced activation in V1 (Lee et al., 2001) and the extrastriate cortex (Wang et al., 2012), including V2 and temporal and parietal lobe regions at all spatial frequencies. Intriguingly, Muckli et al. (2006) did not find consistent differences in the intraocular activation between SA and AA patients, although the pattern of activation in V1 and V2 was more variably distributed in SA patients when compared to that in AA patients at all spatial frequencies. In addition, adult SA patients exhibit lower VMHC in the fusiform gyrus than controls, while AA patients represented stronger VMHC versus controls; furthermore, the VMHC between the bilateral fusiform was positively correlated with the severity of AA (Liang et al., 2017). Both AA and SA patients exhibited higher VMHC in the bilateral V2 than controls; furthermore, AA patients showed higher VMHC than SA patients (Liang et al., 2017).
Maximum motion displacement is the maximum point movement where the direction of motion can be correctly distinguished in a random dot kinematic diagram (RDK), which has been used to explore the relationship between low- and high-level feature-matching motion mechanisms (Braddick, 1974). High-level RDKs elicit a functional response more towards high-level visual areas, including V3a, MT+, and parieto-occipital areas, while the low-level feature-matching motion elicits activations in low-level areas (i.e., posterior occipital areas) (Snowden and Braddick, 1990). Ho and Giaschi (2009) utilized this paradigm and reported that children with AA showed the same pattern of cortical activation as controls, although the magnitude of activation differences between low and high RDKs was lower in the extrastriate cortex of patients than in that of controls. However, there was no difference in cortical activity for low- and high-level RDKs in children with SA, and activation was lower relative to both controls and AA patients, especially in high-level visual areas.
Discussion
In this review, 39 original studies were retrieved and assessed to qualitatively characterize brain MRI findings in AA and SA patients. These studies identified alterations in anatomy and dysfunction from the optic nerve to the neocortex in patients with amblyopia, with shared and differing brain alterations in patients with AA and SA subtypes.
The precortical pathway
Although most studies of amblyopia have focused on neocortical brain features, a small number of studies have investigated the structural integrity of the precortical pathways in amblyopia patients (Altintas et al., 2017; Allen et al., 2018). Based on articles included in our analysis, it is apparent that AA patients suffered more than SA patients in terms of the precortical pathway; this was mainly characterized by a lower FA in the optic nerve and optic tract, a greater MD and lower FA in the optic radiation (Li et al., 2013b, 2015; Allen et al., 2018), and a greater reduction in FA in the optic radiation that was related to loss of visual acuity in AA patients (Li et al., 2015).
Clinically, AA patients exhibit lower contrast sensitivity than SA patients, while stereopsis defects are more common in SA patients (McKee et al., 2003). It is likely that AA manifests its main pathological abnormalities in the retina and optic nerve/tract (Yen et al., 2004) while SA is more associated with abnormalities in the LGN and then the optic radiation (Allen et al., 2018). Zele et al. (2007) identified functional deficits in the magnocellular and parvocellular pathways in the precortical areas of AA patients by extensive psychophysical testing. Altered visual signals through the retina play a role in alterations in the precortical pathway. For example, the lower FA in the optic nerve of patients with glaucoma correlates with lower retinal nerve fiber layer thickness (Mendoza et al., 2022) while progressive optic nerve degeneration extends to the distal segments of the optic nerve as the disease progresses (Bolacchi et al., 2012). Thus, we cannot overlook an anterograde nature to the process of amblyopia.
The precortical pathway receives visual signals not only from the retina but also from V1. Patients with AA have more robust structural alterations in V1 than SA patients (Mendola et al., 2005; Wang et al., 2012). Furthermore, retrograde degeneration in the precortical pathways might occur as a consequence of the functional or structural abnormalities of V1 (Atapour et al., 2017). However, the causal neural relationship between precortical pathway changes in AA and corresponding retinopathy or visual cortical deficits remains unclear. Further efforts are needed to explore the relationship between AA and alterations in the retina or neocortex to better establish the role of feedforward and retrograde components in AA. Recent advances in DTI scanning methods, such as the use of readout segmentation for long variable echo-trains (Echevarria-Cooper et al., 2022), can diminish susceptibility artifacts to obtain high-resolution brain images with high quality. These may help to reflect the white matter tracts in the anterior visual pathway clearly under the effects of orbital fat, sphenoid sinus air, sphenoid bone, and eye movements; and could be used to help explore the relationship between the precortical pathway and retinal or visual cortex alterations in amblyopia.
Cortical regions
Common alterations in AA and SA patients
In humans, the visual system uses two distinct pathways to transmit and process visual information in a broad manner (Figure 1). A dorsal stream through the parietal to frontal cortex via the superior longitudinal fasciculus (Ffytche et al., 2010) involves processing spatial representations for action planning (Norman, 2002) and stereoscopic depth perception (Chen et al., 2020). This system selectively responds to low spatial frequencies (Cushing et al., 2019). The ventral stream, including the inferior longitudinal fasciculus and inferior fronto-occipital fasciculus that connect the inferior frontal, temporal, and occipital lobes, specializes in form perception (Nestmann et al., 2021) and object recognition (de Haan and Cowey, 2011) and responds more robustly to high spatial frequencies (Cushing et al., 2019). Our analysis indicated that there are common abnormal functional and morphological alterations of the ventral and dorsal pathways in SA and AA patients.
In our analysis, both AA and SA patients demonstrated reduced GMV in the dorsal pathway, including the bilateral calcarine and paracalcarine cortex and the lateral and medial parieto-occipital junction, when compared with controls (Mendola et al., 2005). With regards to white matter fiber tracks, a lower FA in AA patients (Li et al., 2015) and a higher MD in SA patients (Duan et al., 2015) were found in the inferior longitudinal fasciculus that links the ventral pathway. A reduction in FA was demonstrated in the superior longitudinal fasciculus which is associated with the dorsal pathway in AA patients (Li et al., 2015). Furthermore, an increased MD was demonstrated in the vertical occipital fasciculus in patients with SA (Duan et al., 2015). FA and MD reflect the number of axons, intravoxel orientational dispersion, myelination, packing density, and membrane permeability and thus reflect white matter tract integrity (Jones et al., 2013). The reduced FA and higher MD of the two visual pathways in patients with amblyopia may thus reflect abnormalities of myelin and the integrity of fiber axons in the microstructure of the white matter. The development of visual brain networks lies in normal visual experience, and the positive correlation between FA values and the visual acuity of patients with AA suggests that abnormal visual processing in amblyopia can disrupt the microstructure of the white matter in the two visual pathways (Li et al., 2015).
The activation amplitude evoked from the amblyopic eyes of AA patients was reduced in V1, V2, the V3a/ventral posterior area, the lateral occipital complex, and V4+/V8, when compared to controls during the processing of various spatial-frequency stimuli (Lee et al., 2001; Muckli et al., 2006; Wang et al., 2012; Li et al., 2013a). In addition, reduced activation amplitude and cluster sizes have been detected in V1, V2, and V3 during the presentation of multifocal stimuli (Huang et al., 2017; Farivar et al., 2019). Poorer acuity is known to be related to reduced fMRI activation amplitude (Farivar et al., 2019). Compared to controls, the activation amplitude evoked from the amblyopic eyes of patients with SA was also reduced in V1, V2, V3, V4, the lateral occipital complex, and MT+ (Lee et al., 2001; Muckli et al., 2006; Wang et al., 2012, 2017; Hou et al., 2016). These reduced brain functional activations were interpreted to represent reduced neural activity in cells driven by the amblyopic eye (Clavagnier et al., 2015). In contrast to studies of activation magnitude, two studies reported the distortion of topological cortical maps in V1, V2, and V3 (especially in the extrastriate cortex) in AA and SA patients with regards to retinotopic representations (Clavagnier et al., 2015; Farivar et al., 2019), thus suggesting spatial disarray among visual neurons. Due to anomalous interocular, active top-down, and lateral interactions (Farivar et al., 2019), such abnormal retinotopic mapping may be an important feature underlying spatial perceptual distortions and reduced positional accuracy in patients with AA and SA (Barrett et al., 2003). However, because complex task designs for vision experiments are needed for tfMRI—such as black and white checkerboards to stimulate functional activation in response to the flickering frequency of visual stimuli and motion salience tasks to investigate visual attention and eye movements—and because tfMRI is time-consuming and requires that participants understand the task rule and cooperate actively, it is not easy for individuals to perform these tasks successfully, especially children.
Compared with tfMRI, rfMRI has the advantages of having simple scanning paradigms that do not require individuals to perform any experimental task and being easy to implement in clinical practice. For intrinsic brain function during the resting state, three studies reported increased spontaneous brain activity in the visual cortical regions, including V1, V2, V3, the fusiform gyrus, and inferior temporal gyrus of AA patients (Lin et al., 2012; Liang et al., 2016; Tang et al., 2017). Two studies focused on SA and reported increased spontaneous activities in V1 and V2 i (Min et al., 2018; Shao et al., 2019). This increase may imply the functional plasticity of neurons and a compensatory increase for the deficit of visual input from the amblyopic eye (Turrigiano, 2012). For resting-state FC, both AA and SA patients demonstrated lower FC within the dorsal pathway (Ding et al., 2013; Wang et al., 2014; Liu et al., 2022). Thus, defects in the dorsal pathways might account for impaired high-level visual perception defects, such as spatial uncertainty (Hamm et al., 2014) and stereoscopic depth perception (Wallace et al., 2011). Increased VMHC in V2, which has been related to stereoacuity impairments, has been reported in both AA and SA patients (Liang et al., 2017). V2 neurons provide a depiction of feature configuration that is not explicitly represented in V1 by stronger suppressive tuning; this configuration is the basis of stereopsis and other types of higher-level perception (Willmore et al., 2010). Therefore, increased synchronized activity in the bilateral V2 may represent a consequence of increased negative feedback for the enormous binocular disparity of patients with amblyopia.
Specific alterations in AA or SA patients
In addition to abnormal microstructure in the ventral pathway revealed by DTI, AA patients exhibited clear dysfunction, although these data were reported in only a limited number of SA studies. A recent electrophysiological study demonstrated that the form/position-specific responses of patients with AA were more vulnerable when compared to motion/transient perceptions at an early stage of the abnormal visual experience of anisometropia (Chen et al., 2019) where the ventral visual pathway accounts for form perception. In the visual system, high spatial-frequency signals are primarily processed by the ventral pathway (Cushing et al., 2019); furthermore, visual cortex activation in response to higher spatial-frequency stimuli from the amblyopic eye was more suppressed in patients with AA than in those with SA, thus indicating that AA may lead to more disruption in the ventral pathway (Lee et al., 2001; Muckli et al., 2006; Wang et al., 2012). Furthermore, amblyopia has been associated with face processing deficits; the fusiform gyrus underlies the ability to process faces as a key node in the ventral pathway (Kanwisher et al., 1997). Consistent blurred input due to AA may increase visual noise during face perception processing (Bach and Dolan, 2012) and lead to a higher VMHC in the fusiform gyrus of AA patients but a lower VMHC in SA patients relative to healthy individuals; this may be relevant to the impaired brain development and visual perceptual abilities in patients with amblyopia (Liang et al., 2017). From the perspective of resting-state function, the inferior temporal gyrus and fusiform gyrus have been reported to have a greater reduction of short-range FCD in AA patients than in SA patients (Wang et al., 2014; Shi et al., 2022). AA patients also exhibit a lower FC within the ventral pathway and reduced local efficiency in the ventral part of V3 and V4, thus implying a lower fault tolerance of the ventral pathway (Lu et al., 2019).
It is well known that the functional development of the visual system follows a hierarchical order (Zhang et al., 2005). The decreased signal output from V1 may damage downstream neuron maturation, thus resulting in more extensive deficits in the extrastriate cortex and relevant associated regions (Tao et al., 2014). The ratio of functional brain activation in the fellow and amblyopic eye under monocular stimulations is reduced in V1 of SA patients but not AA patients, thus suggesting that disrupted binocular interaction could impact brain dysfunction in patients with SA (Lee et al., 2001); moreover, SA tends to have more cortical activation impairments in the extrastriate cortex than in the striate cortex when compared to AA patients (Ho and Giaschi, 2009; Wang et al., 2012). Bi et al. (2011) reported abnormal spatial frequency and orientation selectivity in V2 neurons due to binocular suppression in V1 and imbalanced ocular dominance in V2; these effects may be amplified downstream from V1 to V2. From a top-down point of view, SA patients expressed amblyopia-related binocular suppression in V1, which has been considered as a form of selective attentional neglect of the visual input to the amblyopic eye and involves impaired feedback from higher cortical areas (V4 and MT+) (Hou et al., 2016). Moreover, weak attentional modulation in V1 was influenced by the difference in interocular acuity in SA patients (Hou et al., 2016). During a motion salience task, SA patients exhibited reduced activations in dorsal attention and sensorimotor regions, including the FEF, intraparietal sulcus, and V5, along with reduced FCs between FEF and V1 and between FEF and V5 (Wang et al., 2017). These findings suggest that SA involves a breakdown of binocular interaction in the extrastriate cortex (Thompson et al., 2019; Zhang et al., 2021) and a weaker contribution of the amblyopic eye to binocular contrast interactions (Hou et al., 2021). These processes not only impact the processing of visual input from the amblyopic eye (bottom-up) but also disrupt higher visual perception modulated by top-down processes that depend upon prior experience in SA patients (Adamek et al., 2022).
Oculomotor coordination
It has been shown that amblyopia is associated with fixation instability and anomalous saccades, and that the latter can be aggravated by severe amblyopia and stereopsis (Birch et al., 2019). The cerebellum, FEF, and supplementary eye field are considered the second and highest levels of the three-level hierarchy in the oculomotor system (Figure 1). The cerebellum participates in object selection and the onset and precision of eye movements, and the frontal and parietal eye fields trigger saccades (Perdziak et al., 2014). In AA patients, there was a negative correlation between ReHo in the frontal regions and the increased GMV of lobules 4 and 5 in the cerebellum (Lu et al., 2020). In SA patients, GMV has been shown to be reduced in the posterior and anterior lobes of the cerebellum and correlated with the angle of strabismus (Su et al., 2022).
In our analysis, five studies reported reduced spontaneous activities in the frontal and supplementary eye fields in AA patients (Lin et al., 2012; Tang et al., 2017; Lu et al., 2020) and SA patients (Min et al., 2018; Shao et al., 2019), as well as lower spontaneous function in the cerebellum in AA (Lin et al., 2012) and SA patients (Min et al., 2018). With regards to connections, AA patients exhibited a reduced FCD in the premotor cortex and dorsal inferior parietal lobule (Wang et al., 2014). SA patients exhibited a reduced FCD in the cerebellum, superior frontal gyrus, and superior parietal lobule (Shi et al., 2022). A reduction in VMHC was also demonstrated in the cerebellum and superior frontal gyrus of SA patients (Peng et al., 2021). Previous studies showed that activation in the FEF was reduced and that the connection between the FEF and visual cortex was reduced during visual stimulus tracking by the amblyopic eye (Secen et al., 2011; Wang et al., 2017). Similar reductions in FC have been detected in early blind individuals (Liu et al., 2007). Thus, a reduction in FC and a reduction in spontaneous brain activity in the cerebellum, frontal and supplementary eye fields, and parietal lobule, may implicate the neural impairments underlying defective oculomotor function in SA and AA patients.
Differences between adult and pediatric amblyopia
Some studies recruited pediatric and adult amblyopic patients and found that children exhibited more widespread brain neuroimaging alterations in the neocortex than adults with the same type of amblyopia (Mendola et al., 2005; Liang et al., 2016, 2019; Qi et al., 2016; Peng et al., 2021; Zhang et al., 2021). A thinner cortex was identified in the regions of both cerebral hemispheres in children with AA (Qi et al., 2016), but only in the left extrastriate cortex in adult patients with AA (Liang et al., 2019) and did not depend on the eye affected or sex ratio. During visual development, cortical responses to global form stimuli are lateralized, but are altered in amblyopia (Meier and Giaschi, 2017). Furthermore, responses to form coherence stimuli or higher spatial-frequency stimuli are stronger in the left hemispheres in most adults, while these responses in infants are more bilateral (Wattam-Bell et al., 2010). Thus, the lateralized findings in adult patients with amblyopia may be related to developmental brain maturity.
Second, adult patients with amblyopia demonstrate fewer regions of GMV reduction (Mendola et al., 2005), fewer regions with altered spontaneous brain activity (Liang et al., 2016), and fewer reductions in VMHC (Peng et al., 2021; Zhang et al., 2021) than pediatric patients with amblyopia. Two factors may explain these differences. First, Gupta et al. detected enhanced activity in bilateral hemispheres in the striate and extrastriate regions after occlusion therapy (Gupta et al., 2016). Furthermore, appropriate treatment may progressively benefit adults by activating cortical plasticity (Grieco et al., 2020). In addition, experience-dependent brain plasticity can drive the sensory cortex to undertake new task-specific cognitive/perceptual roles (Castaldi et al., 2020). For instance, blind adults exhibited brain activity in low-level visual areas during sophisticated reading or when solving tasks involving mathematical equations (Bedny, 2017). Thus, adult patients with amblyopia with more extensive treatment histories may benefit more from the high-level cognitive network-medicated recruitment of visual areas for higher-order cognitive functions and multisensory integration. Further longitudinal work, investigating the effects of occlusive treatment and other interventions (e.g., strabismus surgery and pharmacological therapy) on brain anatomy and function, is now needed to determine whether the observed differences between pediatric and adult patients are due to prior treatment, as these differences may also reflect the brain maturational trajectory in patients with amblyopia.
Limitations and recommendations
There are some limitations associated with this review that need to be considered. First, the sample size of most of the included studies was small (i.e., less than 10 subjects (Muckli et al., 2006; Gupta et al., 2016; Wang et al., 2017)); this might yield insufficient statistical significance and increase variability in findings across studies. Second, previous studies found no differences in the prevalence of amblyopia when compared between men and women (Pai et al., 2012), although there is no study investigating sex differences in pure SA or AA patients. Although different studies with varied sex ratios in amblyopic patients have reported inconsistent brain MR imaging results, no study has directly investigated the impact of sex on alterations in brain function and structure in patients with SA or AA. Further studies are now recommended to investigate the potential effect of sex in AA and SA patients. Third, most patients received treatment before MRI examinations, and limited details about prior amblyopia treatment were available from several of our reviewed studies. This is important as occlusive treatments and other interventions have perceptual effects; the potential impact of treatments on brain anatomy and function requires considerable attention and thus has an impact on prior published amblyopia research. Fourth, it is difficult to establish causality between amblyopia and brain alterations in cross-sectional studies. In the future, a longitudinally designed study with a large sample size of untreated patients with AA or SA could explore the maturational and compensatory aspects of brain function in amblyopia. Fifth, from a methodological point of view, previous studies implemented tfMRI for regional activation and rfMRI for static FC and neglected the dynamic interactions among visual and oculomotor systems in amblyopia; therefore, dynamic functional analysis (Luo et al., 2021, 2023; Li et al., 2022; Yin et al., 2022; You et al., 2022) may reveal complementary information about the temporally dynamic functional organization to investigate the dynamic neurophysiology in amblyopia. Finally, if the quality and validity of brain MRI data are insufficient, such as imaging data with a low resolution (Bonhomme et al., 2006) from a low-field MR scanner (Mendola et al., 2005; Li et al., 2013b), no matter how our analysis methods and techniques are improved, the final information provided to clinical practice will be biased. Thus, to explore altered intricate microstructure and morphometry, along with fine-scale functional activation and connection in the visual systems of patients with amblyopia patients, there is clear requirement to develop and validate high-quality and stable brain MRI data with standardized scanning protocols (Li et al., 2021; Luo et al., 2022).
Conclusion
Although the pathogenetic mechanisms of AA and SA might be different, the effects of these two conditions on the brain are not clear and are largely neglected in clinical practice since amblyopia usually does not cause macroscopic brain abnormalities that can be detected by conventional neuroimaging techniques. Our analysis found that advanced multimodal MRI methods that yield a high spatial resolution can help us to detect micro/macrostructural and functional alterations in the brains of patients with amblyopia, and are promising for future implementation in clinical examinations. For instance, DTI revealed abnormal precortical fiber tract microstructure while rfMRI demonstrated that the primary visual cortex, extrastriate cortex, and oculomotor regions are all involved in amblyopic vision deficits with altered functional organization and spontaneous function. In this article, we systematically reviewed the literature and found brain alterations in the visual pathway from the retina to cortical regions. For example, AA patients have greater precortical structural impairments from the retina to V1 than SA patients, while both AA and SA patients demonstrated reduced functional activation in the striate and extrastriate cortices (some of which was correlated with the interocular acuity difference of amblyopes) and reduced FC and GMV in the dorsal pathway. Finally, we have included Table 1 and Figure 3 to summarize our current review of brain MRI results in AA and SA patients. These data provide new insights into the common and specific neurobiological alterations underlying the pathophysiology of AA and SA, brain correlates with amblyopic symptom severity, and potential neuroimaging changes from youth to adulthood.
Table 1.
Brief summary of brain magnetic resonance imaging results in AA and SA in the present systematic review
| Common brain alterations in AA and SA patients |
|---|
| • AA and SA patients both demonstrated reduced functional activations in the striate and extrastriate cortices (such as V1, V2, and V3)* observed during the processing of spatial-frequency stimuli, and the topological cortical activated maps in V1, V2, and V3 were more distorted under retinotopic representations, which might result from abnormal visual experience. Evidence also indicated increased spontaneous brain function during the resting state in these regions in the two conditions, the causes and mechanisms of which require further investigation. |
| • AA and SA patients both showed reduced FC and GMV in the dorsal pathway and aberrant white matter microstructure in the ventral pathway, thus suggesting attenuated functional and structural connections in the dorsal and ventral pathways, respectively. |
| • The dysfunction of AA and SA patients was also characterized by reduced spontaneous brain activity in the oculomotor cortex relative to controls, mainly involving the frontal and parietal eye fields and the cerebellum, which might underlie the neural mechanism of fixation instability and anomalous saccades in amblyopia. |
| Distinct brain alterations in AA and SA patients |
| • AA has a greater impact than SA in the precortical pathway as AA patients demonstrate structural impairments from the retina to V1, while SA patients’ alterations were more prominent in the lateral geniculate nucleus and optic radiation. |
| • In the ventral pathway, AA patients showed reduced functional activation while viewing high-frequency stimuli, reduced FC relative to controls, and greater reductions in GMV than SA patients. |
| • SA patients showed more attenuated functional activation in the extrastriate cortex than in the striate cortex during visual tasks compared to AA patients, suggesting abnormal visual (bottom-up) correlated with disrupted binocular interaction and regulated by a top-down modulation of attentional regulation mechanisms. |
| Differences in amblyopic children and adults |
| • Reduced cortical thickness tended to be more lateralized in adult AA patients than in pediatric AA patients. |
| • Brain regions with reduced GMV and altered spontaneous brain activity tended to be more limited in adult amblyopia patients than in amblyopic children. |
AA: Anisometropic amblyopia; FC: functional connectivity; GMV: gray matter volume; SA: strabismic amblyopia. *Note: the visual cortex includes the primary visual cortex (also called striate cortex or V1) and extrastriate visual cortex (including, for example, visual area two [V2], three [V3], four [V4], and five (V5]).
Figure 3.

Brief summaries of brain structural and functional alterations in anisometropic amblyopia (AA) and strabismic amblyopia (SA).
Each panel represents shared findings in AA and SA (A), specific results in AA (B) and SA (C), and differences in pediatric and adult patients (D), respectively. A literal explanation of this figure refers to Table 1. CB: Cerebellum; FEF: frontal eye field; FG: fusiform gyrus; ITG: inferior temporal gyrus; LGN: lateral geniculate nucleus; LOC: lateral occipital complex; PEF: parietal eye field.
Additional files:
Additional file 1: PRISMA 2020 Checklist.
Additional Table 1: Summary of 12 DTI and structural MRI studies in amblyopia, some of which combined with task-based or resting-state functional MRI.
Additional Table 2: Summary of 13 studies in amblyopia used a single modality of task-based functional MRI.
Additional Table 2.
Summary of 13 studies in amblyopia used a single modality of task-based functional MRI
| Studies | Analysis method | Amblyopiceye and type | Patients number and age* | Ways and proportion oftreatment received | Controls number and age* | Main findings |
|---|---|---|---|---|---|---|
| Temporospatial resolution stimuli (black and whitecheckerboards or grating) | ||||||
| Lee et al., 2001 | Brain activation (ROI) | PediatricAA: 1OS, 5OD; SA: 3OS, 2OD; 4ES, 1EX | AA: 5M/1F, (8-17) y; SA: 3M/2F, (5-23) y | NA | 2M/1F, (18-22) y | Cortical activations in V1 at the higher spatial frequency decreased in AA than HC, not in SA vs HC. The ratio of the activated voxel numbers of fellow and amblyopic eye monocular stimulations in V1 of SA was smaller than both AA and HC. |
| Wanget al., 2012 | Brain activation (ROI) | PediatricAA and SA: NA | AA: 20, 8.0±1.6 (7-12) y; SA: 17, 7.0±2.3 (7-12) y | NA | 16, 8.5±1.3 (7-12) y | Amblyopia showed lower activation in the striate and extrastriate cortex than HC. SA showed lower brain activation in V2 and temporal and parietal lobes than AA at all spatial frequencies. Lower cortical activations were found especially in V1 of AA but mainly inV2 of SA athigh spatialfrequency compared to HC. |
| Li et al., 2012 | Brain activation(ROI) | PediatricAA: 6OS, 4OD | 5M/5F, (5-11) y | NA | 10, (5-12) y | Weaker fMRI activation in the striate cortex and extrastriate cortices of AA evoked from the AME than the fellow eye, which did not exist in HC during the checkerboard stimulation. |
| Li et al., 2013a | Brain activation(ROI) | AA: 2OS, 3OD | 3M/2F, (16-27) y | Untreated | 4, (25-28) y | Weaker fMRI activation was reported in the V1 and V2 at all spatial and temporal frequencystimuli withAME of AA than thatof the non-dominant eye of HC. |
| Muckli et al., 2006 | Brain activation(ROI) | Adult AA: 2OS, 2OD; Adult SA: 2OS, 2OD | AA: 2F/2M, (24-67) y; SA: 2F/2M, (25-46) y | Patch SA 2/4, AA 1/4 | 3F/1M, (19-67) y | Lower cortical activations in V3a/VP, V4/V8, and lateral occipital complex were found in AA and SA than HC, respectively, especially in the lateral occipital complex evoked by high spatial frequencygrating stimuli. |
|
| ||||||
| Tasks tomeasure the functional defect of attention modulation and motion perception | ||||||
| Hou et al., 2016 | Brain activation (ROI), ROI-wise FC | Adult SA: 3ES, 10EX | 6M/7F, 42.5±12.9(24-62) y | Patch9/13Surgery 7/13 | 7M/5F, 40.1±9.8 (25-60) y | During an attentional modulation task, activations in V1, V4, and MT+ were weaker in the AME of SA, which existed in V4 and MT+, not V1 of the fellow eye than HC. The activation in V1 was correlated with interocular visual acuity difference and interocular suppression inpatients with SA. |
| Wanget al., 2017 | Brain activation (ROI), ROI-wise FC | SA: 4OS, 4OD; 4ES, 4EX | 4M/4F, 22.6±5.1 (17-30) y | Surgery 8/8 | 8, 26.3±1.8 (24-30) y | Weaker brain activations corresponded to AME of SA were found in the intraparietal sulcus, FEF, and V5 than HC for both motion salience task and voluntary saccade task. Lower activation in V1 during the voluntary saccade task was shown in AME of SA than both the fellow eye of SA and HC. There was lower FC between FEF with V1 and V5 during the motion salience task in AME than the fellow eye of SA when compared with HC. |
| Thompsonet al., 2019 | Brain activation (ROI), ROI-wise FC | Adult SA: 3OS, 2OD; 4ES,1EX | 4M/1F, (21-49) y | Glasses 1/5 Patch2/5 Surgery 2/5 | 5, mean age 35 (25-28) y | During the dichoptic stimuli long-range suppression task, there was no interocular differences in brain activation magnitude in V1, V2, and V3 and no altered effective connectivitybetween V1 and V2, V2 and V3 between adult SA and controls. |
| Hoand Giaschi, 2009 | Brain activation (whole brain voxel-wise), ROI | PediatricSA: 1ES, 2EX; PediatricAA: 2ES, 1EX, 1orthophoria | SA: 3, 14.4±1 (13.5-15.5) y; AA: 4, 14.2±1.1 (12.9-15.7) y | Patch SA 1/3, AA 4/4 Surgery SA 1/3 | 4, 15.4±0.9 (14-16) y | For healthy controls, low-level RDKs elicited stronger functional activity in posterior occipital areas and high-level RDKs elicited greater activations in extrastriate and occipitoparietal areas. AA showed the same pattern of cortical activation but with a less extent of activation than controls. For SA, there was almost no difference in the activation between low and high level RDKs. |
| Bonhommeet al., 2006 | Brain activation (ROI) | AA: 2OS | 1M/1F, 12/13 y | Glasses 1/2 | 4, NA for age | Less activation in motion sensitive areas V5 and V3a evoked from the AME than the fellow eye of amblyopes compared tocontrols during motion stimulation. |
| Tasks toexplore the functional activation pattern and magnitude of retinotopic representations | ||||||
| Farivar et al., 2019 | Brain activation (ROI) | Adult AA: NA | AA: NA 15M/4F, 24.2±2.2(20-28) y | NA | 4F/6M, 25.2±1.2 y | Lower fMRI activation magnitude evoked from AME and greater interocular deviations of fMRI response location in V1, V2, and V3 were found in patients with AA than HC. Both interocular magnitude ratio and location deviations of fMRI response correlated withinterocular visual acuitydifference in AA. |
| Huang et al., 2017 | Brain activation (ROI) | Adult AA: NA | 16M/4F, 24.2±2.2 (20-28) y | NA | 10, 25.2±1.2y | Smaller activated cluster sizes were found in V1, V2, and V3 evoked from the AME of AA than that of the fellow eye of AA and the dominant eye of HC, and the cluster sizes in V1, V2, and V3 evoked from the AME correlated negatively with the visual acuity of AME at fovea andparafovea eccentricities. |
| Clavagnier et al., 2015 | Brain activation (ROI) | Adult SA: 2OS, 6OD; 4EX, 4ES | 3M/5F, mean age 33.5 (20-60) y | Patch7/8 Surgery 2/8 | 4M, mean age 27.5 (21-31) y | Larger population receptive field sizes and more disarrayed population receptive field were found in V1, V2, and V3 of patients with SA. There was no difference in the cortical magnification factor inV1, V2, and V3 of SA vs HC. |
*Age represented as mean ± standard deviation or range. AA: anisometropic amblyopia; AME: amblyopic eye; ES: esotropia; EX: exotropia; F: female; FC: functional connectivity; FEF: frontal eye fields; fMRI: functional MRI; HC: healthy controls; M: male; MRI: magnetic resonance imaging; MT+: middle temporal complex; NA: not applicable; OD: right eye; OS: left eye; RDKs: random-dot kinematogram stimuli; ROI: region of interest; SA: strabismic amblyopia; V3a: V3 accessory; VP: ventral posterior area; y: years.
Additional Table 3: Summary of 14 studies in amblyopia used a single modality of resting-state functional MRI.
Additional Table 4: The checklist of quality assessment for included studies in the present systematic review.
Acknowledgments:
The authors would like to thank Professor John A, Sweeney (Department of Psychiatry and Behavioral Neuroscience, University of Cincinnati) for his assistance and suggestion with manuscript preparation and Dr. Qian Zhang, who is from Huaxi MR Research Center (HMRRC), Department of Radiology, West China Hospital of Sichuan University, for her drawing the schematic figure in the manuscript.
Footnotes
Conflicts of interest: All authors declare no potential conflicts of interest with regard to this manuscript.
Data availability statement: All data and articles supporting the conclusions of this systematic review are included in this manuscript and its Additional files.
C-Editor: Zhao M; S-Editor: Li CH; L-Editors: Li CH, Song LP; T-Editor: Jia Y
References
- 1.Adámek P, Langová V, Horáček J. Early-stage visual perception impairment in schizophrenia, bottom-up and back again. Schizophrenia (Heidelb) 2022;8:27. doi: 10.1038/s41537-022-00237-9. [DOI] [PMC free article] [PubMed] [Google Scholar]
- 2.Algaze A, Roberts C, Leguire L, Schmalbrock P, Rogers G. Functional magnetic resonance imaging as a tool for investigating amblyopia in the human visual cortex:A pilot study. J Aapos. 2002;6:300–308. doi: 10.1067/mpa.2002.124902. [DOI] [PubMed] [Google Scholar]
- 3.Allen B, Schmitt MA, Kushner BJ, Rokers B. Retinothalamic white matter abnormalities in amblyopia. Invest Ophthalmol Vis Sci. 2018;59:921–929. doi: 10.1167/iovs.17-22930. [DOI] [PubMed] [Google Scholar]
- 4.Altintas O, Gumustas S, Cinik R, Anik Y, Ozkan B, Karabas L. Correlation of the measurements of optical coherence tomography and diffuse tension imaging of optic pathways in amblyopia. Int Ophthalmol. 2017;37:85–93. doi: 10.1007/s10792-016-0229-0. [DOI] [PubMed] [Google Scholar]
- 5.Atapour N, Worthy KH, Lui LL, Yu HH, Rosa MGP. Neuronal degeneration in the dorsal lateral geniculate nucleus following lesions of primary visual cortex:comparison of young adult and geriatric marmoset monkeys. Brain Struct Funct. 2017;222:3283–3293. doi: 10.1007/s00429-017-1404-4. [DOI] [PubMed] [Google Scholar]
- 6.Bach DR, Dolan RJ. Knowing how much you don't know:a neural organization of uncertainty estimates. Nat Rev Neurosci. 2012;13:572–586. doi: 10.1038/nrn3289. [DOI] [PubMed] [Google Scholar]
- 7.Barnes GR, Li X, Thompson B, Singh KD, Dumoulin SO, Hess RF. Decreased gray matter concentration in the lateral geniculate nuclei in human amblyopes. Invest Ophthalmol Vis Sci. 2010;51:1432–1438. doi: 10.1167/iovs.09-3931. [DOI] [PubMed] [Google Scholar]
- 8.Barrett BT, Pacey IE, Bradley A, Thibos LN, Morrill P. Nonveridical visual perception in human amblyopia. Invest Ophthalmol Vis Sci. 2003;44:1555–1567. doi: 10.1167/iovs.02-0515. [DOI] [PubMed] [Google Scholar]
- 9.Bedny M. Evidence from blindness for a cognitively pluripotent cortex. Trends Cogn Sci. 2017;21:637–648. doi: 10.1016/j.tics.2017.06.003. [DOI] [PubMed] [Google Scholar]
- 10.Bi H, Zhang B, Tao X, Harwerth RS, Smith EL, 3rd, Chino YM. Neuronal responses in visual area V2 (V2) of macaque monkeys with strabismic amblyopia. Cereb Cortex. 2011;21:2033–2045. doi: 10.1093/cercor/bhq272. [DOI] [PMC free article] [PubMed] [Google Scholar]
- 11.Birch EE, Kelly KR, Giaschi DE. Fellow eye deficits in amblyopia. J Binocul Vis Ocul Motil. 2019;69:116–125. doi: 10.1080/2576117X.2019.1624440. [DOI] [PMC free article] [PubMed] [Google Scholar]
- 12.Bolacchi F, Garaci FG, Martucci A, Meschini A, Fornari M, Marziali S, Mancino R, Squillaci E, Floris R, Cerulli L, Simonetti G, Nucci C. Differences between proximal versus distal intraorbital optic nerve diffusion tensor magnetic resonance imaging properties in glaucoma patients. Invest Ophthalmol Vis Sci. 2012;53:4191–4196. doi: 10.1167/iovs.11-9345. [DOI] [PubMed] [Google Scholar]
- 13.Bonhomme GR, Liu GT, Miki A, Francis E, Dobre MC, Modestino EJ, Aleman DO, Haselgrove JC. Decreased cortical activation in response to a motion stimulus in anisometropic amblyopic eyes using functional magnetic resonance imaging. J AAPOS. 2006;10:540–546. doi: 10.1016/j.jaapos.2006.07.008. [DOI] [PubMed] [Google Scholar]
- 14.Braddick O. A short-range process in apparent motion. Vision Res. 1974;14:519–527. doi: 10.1016/0042-6989(74)90041-8. [DOI] [PubMed] [Google Scholar]
- 15.Cao ZM, Chen YC, Liu GY, Wang X, Shi AQ, Xu LF, Li ZJ, Huo JW, Zhang YN, Liu N, Yan CQ, Wang J. Abnormalities of thalamic functional connectivity in patients with migraine:a resting-state fMRI Study. Pain Ther. 2022;11:561–574. doi: 10.1007/s40122-022-00365-1. [DOI] [PMC free article] [PubMed] [Google Scholar]
- 16.Castaldi E, Lunghi C, Morrone MC. Neuroplasticity in adult human visual cortex. Neurosci Biobehav Rev. 2020;112:542–552. doi: 10.1016/j.neubiorev.2020.02.028. [DOI] [PubMed] [Google Scholar]
- 17.Chen NH, Chen ZM, Fang F. Functional specialization in human dorsal pathway for stereoscopic depth processing. Exp Brain Res. 2020;238:2581–2588. doi: 10.1007/s00221-020-05918-4. [DOI] [PubMed] [Google Scholar]
- 18.Chen SI, Chandna A, Nicholas S, Norcia AM. Differential experience-dependent plasticity of form and motion mechanisms in anisometropic amblyopia. Invest Ophthalmol Vis Sci. 2019;60:4109–4119. doi: 10.1167/iovs.19-27005. [DOI] [PMC free article] [PubMed] [Google Scholar]
- 19.Chen X, Liao M, Jiang P, Sun H, Liu L, Gong Q. Abnormal effective connectivity in visual cortices underlies stereopsis defects in amblyopia. Neuroimage Clin. 2022;34:103005. doi: 10.1016/j.nicl.2022.103005. [DOI] [PMC free article] [PubMed] [Google Scholar]
- 20.Choi SH, Jeong G, Kim YB, Cho ZH. Proposal for human visual pathway in the extrastriate cortex by fiber tracking method using diffusion-weighted MRI. Neuroimage. 2020;220:117145. doi: 10.1016/j.neuroimage.2020.117145. [DOI] [PubMed] [Google Scholar]
- 21.Clavagnier S, Dumoulin SO, Hess RF. Is the cortical deficit in amblyopia due to reduced cortical magnification, loss of neural resolution, or neural disorganization? J Neurosci. 2015;35:14740–14755. doi: 10.1523/JNEUROSCI.1101-15.2015. [DOI] [PMC free article] [PubMed] [Google Scholar]
- 22.Covington BP, Al Khalili Y. In: StatPearls [Internet] Treasure Island (FL): StatPearls Publishing; 2021. Neuroanatomy, nucleus lateral geniculate. [PubMed] [Google Scholar]
- 23.Cushing CA, Im HY, Adams RB, Ward N, Kveraga K. Magnocellular and parvocellular pathway contributions to facial threat cue processing. Soc Cogn Affect Neur. 2019;14:151–162. doi: 10.1093/scan/nsz003. [DOI] [PMC free article] [PubMed] [Google Scholar]
- 24.Daniel PM, Whitteridge D. The representation of the visual field on the cerebral cortex in monkeys. J Physiol. 1961;159:203–221. doi: 10.1113/jphysiol.1961.sp006803. [DOI] [PMC free article] [PubMed] [Google Scholar]
- 25.de Haan EHF, Cowey A. On the usefulness of 'what'and 'where'pathways in vision. Trends Cogn Sci. 2011;15:460–466. doi: 10.1016/j.tics.2011.08.005. [DOI] [PubMed] [Google Scholar]
- 26.Ding K, Liu Y, Yan X, Lin X, Jiang T. Altered functional connectivity of the primary visual cortex in subjects with amblyopia. Neural Plast. 2013;2013:612086. doi: 10.1155/2013/612086. [DOI] [PMC free article] [PubMed] [Google Scholar]
- 27.Duan Y, Norcia AM, Yeatman JD, Mezer A. The structural properties of major white matter tracts in strabismic amblyopia. Invest Ophthalmol Vis Sci. 2015;56:5152–5160. doi: 10.1167/iovs.15-17097. [DOI] [PMC free article] [PubMed] [Google Scholar]
- 28.Echevarria-Cooper SL, Zhou G, Zelano C, Pestilli F, Parrish TB, Kahnt T. Mapping the microstructure and striae of the human olfactory tract with diffusion MRI. J Neurosci. 2022;42:58–68. doi: 10.1523/JNEUROSCI.1552-21.2021. [DOI] [PMC free article] [PubMed] [Google Scholar]
- 29.Farivar R, Zhou J, Huang Y, Feng L, Zhou Y, Hess RF. Two cortical deficits underlie amblyopia:A multifocal fMRI analysis. Neuroimage. 2019;190:232–241. doi: 10.1016/j.neuroimage.2017.09.045. [DOI] [PubMed] [Google Scholar]
- 30.Ffytche DH, Blom JD, Catani M. Disorders of visual perception. J Neurol Neurosurg Psychiatry. 2010;81:1280–1287. doi: 10.1136/jnnp.2008.171348. [DOI] [PubMed] [Google Scholar]
- 31.Force USPST, Grossman DC, Curry SJ, Owens DK, Barry MJ, Davidson KW, Doubeni CA, Epling JW, Jr, Kemper AR, Krist AH, Kurth AE, Landefeld CS, Mangione CM, Phipps MG, Silverstein M, Simon MA, Tseng CW. Vision screening in children aged 6 months to 5 years:US preventive services task force recommendation statement. JAMA. 2017;318:836–844. doi: 10.1001/jama.2017.11260. [DOI] [PubMed] [Google Scholar]
- 32.Grieco SF, Qiao X, Zheng X, Liu Y, Chen L, Zhang H, Yu Z, Gavornik JP, Lai C, Gandhi SP, Holmes TC, Xu X. Subanesthetic ketamine reactivates adult cortical plasticity to restore vision from amblyopia. Curr Biol. 2020;30:3591–3603.e3598. doi: 10.1016/j.cub.2020.07.008. [DOI] [PMC free article] [PubMed] [Google Scholar]
- 33.Gupta S, Kumaran SS, Saxena R, Gudwani S, Menon V, Sharma P. BOLD fMRI and DTI in strabismic amblyopes following occlusion therapy. Int Ophthalmol. 2016;36:557–568. doi: 10.1007/s10792-015-0159-2. [DOI] [PubMed] [Google Scholar]
- 34.Hamm LM, Black J, Dai S, Thompson B. Global processing in amblyopia:a review. Front Psychol. 2014;5:583. doi: 10.3389/fpsyg.2014.00583. [DOI] [PMC free article] [PubMed] [Google Scholar]
- 35.Ho CS, Giaschi DE. Low- and high-level motion perception deficits in anisometropic and strabismic amblyopia:evidence from fMRI. Vision Res. 2009;49:2891–2901. doi: 10.1016/j.visres.2009.07.012. [DOI] [PubMed] [Google Scholar]
- 36.Holmes JM, Clarke MP. Amblyopia. Lancet. 2006;367:1343–1351. doi: 10.1016/S0140-6736(06)68581-4. [DOI] [PubMed] [Google Scholar]
- 37.Hou C, Kim YJ, Lai XJ, Verghese P. Degraded attentional modulation of cortical neural populations in strabismic amblyopia. J Vis. 2016;16:16. doi: 10.1167/16.3.16. [DOI] [PMC free article] [PubMed] [Google Scholar]
- 38.Hou C, Tyson TL, Uner IJ, Nicholas SC, Verghese P. Excitatory contribution to binocular interactions in human visual cortex is reduced in strabismic amblyopia. J Neurosci. 2021;41:8632–8643. doi: 10.1523/JNEUROSCI.0268-21.2021. [DOI] [PMC free article] [PubMed] [Google Scholar]
- 39.Huang YF, Feng LX, Zhou YF. Reduced response cluster size in early visual areas explains the acuity deficit in amblyopia. Neuroreport. 2017;28:397–403. doi: 10.1097/WNR.0000000000000767. [DOI] [PubMed] [Google Scholar]
- 40.Jones DK, Knosche TR, Turner R. White matter integrity, fiber count, and other fallacies: The do's and don'ts of diffusion MRI. Neuroimage. 2013;73:239–254. doi: 10.1016/j.neuroimage.2012.06.081. [DOI] [PubMed] [Google Scholar]
- 41.Kanonidou E. Amblyopia:a mini review of the literature. Int Ophthalmol. 2011;31:249–256. doi: 10.1007/s10792-011-9434-z. [DOI] [PubMed] [Google Scholar]
- 42.Kanwisher N, McDermott J, Chun MM. The fusiform face area:a module in human extrastriate cortex specialized for face perception. J Neurosci. 1997;17:4302–4311. doi: 10.1523/JNEUROSCI.17-11-04302.1997. [DOI] [PMC free article] [PubMed] [Google Scholar]
- 43.Klein BP, Harvey BM, Dumoulin SO. Attraction of position preference by spatial attention throughout human visual cortex. Neuron. 2014;84:227–237. doi: 10.1016/j.neuron.2014.08.047. [DOI] [PubMed] [Google Scholar]
- 44.Lee KM, Lee SH, Kim NY, Kim CY, Sohn JW, Choi MY, Gyu Choi D, Hwang JM, Ho Park K, Lee DS, Suk Yu Y, Hyun Chang K. Binocularity and spatial frequency dependence of calcarine activation in two types of amblyopia. Neurosci Res. 2001;40:147–153. doi: 10.1016/s0168-0102(01)00220-6. [DOI] [PubMed] [Google Scholar]
- 45.Li CM, Cheng L, Yu QW, Xie B, Wang J. Relationship of visual cortex function and visual acuity in anisometropic amblyopic children. Int J Med Sci. 2012;9:115–120. doi: 10.7150/ijms.9.115. [DOI] [PMC free article] [PubMed] [Google Scholar]
- 46.Li F, Sun H, Biswal BB, Sweeney JA, Gong Q. Artificial intelligence applications in psychoradiology. Psychoradiology. 2021;1:94–107. doi: 10.1093/psyrad/kkab009. [DOI] [PMC free article] [PubMed] [Google Scholar]
- 47.Li H, Yang X, Gong Q, Chen H, Liao M, Liu L. BOLD responses to different temporospatial frequency stimuli in V1 and V2 visual cortex of anisometropic amblyopia. Eur J Ophthalmol. 2013a;23:147–155. doi: 10.5301/ejo.5000211. [DOI] [PubMed] [Google Scholar]
- 48.Li H, Cao W, Zhang X, Sun B, Jiang S, Li J, Liu C, Yin W, Wu Y, Liu T, Yao D, Luo C. BOLD-fMRI reveals the association between renal oxygenation and functional connectivity in the aging brain. Neuroimage. 2019;186:510–517. doi: 10.1016/j.neuroimage.2018.11.030. [DOI] [PubMed] [Google Scholar]
- 49.Li Q, Jiang Q, Guo M, Li Q, Cai C, Yin X. Grey and white matter changes in children with monocular amblyopia:voxel-based morphometry and diffusion tensor imaging study. Br J Ophthalmol. 2013b;97:524–529. doi: 10.1136/bjophthalmol-2012-302218. [DOI] [PubMed] [Google Scholar]
- 50.Li Q, Zhai L, Jiang Q, Qin W, Li Q, Yin X, Guo M. Tract-based spatial statistics analysis of white matter changes in children with anisometropic amblyopia. Neurosci Lett. 2015;597:7–12. doi: 10.1016/j.neulet.2015.04.027. [DOI] [PubMed] [Google Scholar]
- 51.Li Q, Yao L, You W, Liu J, Deng S, Li B, Luo L, Zhao Y, Wang Y, Wang Y, Zhang Q, Long F, Sweeney JA, Gu S, Li F, Gong Q. Controllability of functional brain networks and its clinical significance in first-episode schizophrenia. Schizophr Bull. 2022:sbac177. doi: 10.1093/schbul/sbac177. [DOI] [PMC free article] [PubMed] [Google Scholar]
- 52.Li X, Dumoulin SO, Mansouri B, Hess RF. Cortical deficits in human amblyopia:their regional distribution and their relationship to the contrast detection deficit. Invest Ophthalmol Vis Sci. 2007;48:1575–1591. doi: 10.1167/iovs.06-1021. [DOI] [PubMed] [Google Scholar]
- 53.Liang M, Xie B, Yang H, Yin X, Wang H, Yu L, He S, Wang J. Altered interhemispheric functional connectivity in patients with anisometropic and strabismic amblyopia:a resting-state fMRI study. Neuroradiology. 2017;59:517–524. doi: 10.1007/s00234-017-1824-0. [DOI] [PubMed] [Google Scholar]
- 54.Liang M, Xiao H, Xie B, Yin X, Wang J, Yang H. Morphologic changes in the visual cortex of patients with anisometropic amblyopia:a surface-based morphometry study. BMC Neurosci. 2019;20:39. doi: 10.1186/s12868-019-0524-6. [DOI] [PMC free article] [PubMed] [Google Scholar]
- 55.Liang ML, Xie B, Yang H, Yu LH, Yin XT, Wei LQ, Wang J. Distinct patterns of spontaneous brain activity between children and adults with anisometropic amblyopia:a resting-state fMRI study. Graef Arch Clin Exp. 2016;254:569–576. doi: 10.1007/s00417-015-3117-9. [DOI] [PubMed] [Google Scholar]
- 56.Lin X, Ding K, Liu Y, Yan X, Song S, Jiang T. Altered spontaneous activity in anisometropic amblyopia subjects:revealed by resting-state FMRI. PLoS One. 2012;7:e43373. doi: 10.1371/journal.pone.0043373. [DOI] [PMC free article] [PubMed] [Google Scholar]
- 57.Liu LQ, Li QY, Zhang ZH, Wu SN, Shu HY, Zhang LJ, Liang RB, Pan YC, Shao Y. Altered functional connectivity of primary visual cortex in adults with strabismus and amblyopia:a resting-state fMRI study. J Integr Neurosci. 2022;21:4. doi: 10.31083/j.jin2101004. [DOI] [PubMed] [Google Scholar]
- 58.Liu S, Zou LL, Wen W, Wang S, Liu GS, Li YL, Yang GK, Chang XR, Liu H, Liao RF. Binocular treatment in adult amblyopia is based on parvocellular or magnocellular pathway. Eur J Ophthalmol. 2020;30:658–667. doi: 10.1177/1120672119841216. [DOI] [PubMed] [Google Scholar]
- 59.Liu Y, Yu C, Liang M, Li J, Tian L, Zhou Y, Qin W, Li K, Jiang TZ. Whole brain functional connectivity in the early blind. Brain. 2007;130:2085–2096. doi: 10.1093/brain/awm121. [DOI] [PubMed] [Google Scholar]
- 60.Lu W, Yu X, Zhao L, Zhang Y, Zhao F, Wang Y, Qiu J. Enhanced gray matter volume compensates for decreased brain activity in the ocular motor area in children with anisometropic amblyopia. Neural Plast. 2020;2020:8060869. doi: 10.1155/2020/8060869. [DOI] [PMC free article] [PubMed] [Google Scholar]
- 61.Lu Z, Huang Y, Lu Q, Feng L, Nguchu BA, Wang Y, Wang H, Li G, Zhou Y, Qiu B, Zhou J, Wang X. Abnormal intra-network architecture in extra-striate cortices in amblyopia:a resting state fMRI study. Eye Vis (Lond) 2019;6:20. doi: 10.1186/s40662-019-0145-2. [DOI] [PMC free article] [PubMed] [Google Scholar]
- 62.Luo L, Li Q, You W, Wang Y, Tang W, Li B, Yang Y, Sweeney JA, Li F, Gong Q. Altered brain functional network dynamics in obsessive-compulsive disorder. Hum Brain Mapp. 2021;42:2061–2076. doi: 10.1002/hbm.25345. [DOI] [PMC free article] [PubMed] [Google Scholar]
- 63.Luo L, You W, DelBello MP, Gong Q, Li F. Recent advances in psychoradiology. Phys Med Biol. 2022 doi: 10.1088/1361-6560/ac9d1e. doi:10.1088/1361-6560/ac9d1e. [DOI] [PubMed] [Google Scholar]
- 64.Luo L, Chen L, Wang Y, Li Q, He N, Li Y, You W, Wang Y, Long F, Guo L, Luo K, Sweeney JA, Gong Q, Li F. Patterns of brain dynamic functional connectivity are linked with attention-deficit/hyperactivity disorder-related behavioral and cognitive dimensions. Psychol Med. 2023:1–12. doi: 10.1017/S0033291723000089. [DOI] [PMC free article] [PubMed] [Google Scholar]
- 65.McKee SP, Levi DM, Movshon JA. The pattern of visual deficits in amblyopia. J Vis. 2003;3:380–405. doi: 10.1167/3.5.5. [DOI] [PubMed] [Google Scholar]
- 66.Meier K, Giaschi D. Unilateral amblyopia affects two eyes:fellow eye deficits in amblyopia. Invest Ophthalmol Vis Sci. 2017;58:1779–1800. doi: 10.1167/iovs.16-20964. [DOI] [PubMed] [Google Scholar]
- 67.Mendola JD, Lam J, Rosenstein M, Lewis LB, Shmuel A. Partial correlation analysis reveals abnormal retinotopically organized functional connectivity of visual areas in amblyopia. Neuroimage Clin. 2018;18:192–201. doi: 10.1016/j.nicl.2018.01.022. [DOI] [PMC free article] [PubMed] [Google Scholar]
- 68.Mendola JD, Conner IP, Roy A, Chan ST, Schwartz TL, Odom JV, Kwong KK. Voxel-based analysis of MRI detects abnormal visual cortex in children and adults with amblyopia. Hum Brain Mapp. 2005;25:222–236. doi: 10.1002/hbm.20109. [DOI] [PMC free article] [PubMed] [Google Scholar]
- 69.Mendoza M, Shotbolt M, Faiq MA, Parra C, Chan KC. Advanced diffusion MRI of the visual system in glaucoma:from experimental animal models to humans. Biology (Basel) 2022;11:454. doi: 10.3390/biology11030454. [DOI] [PMC free article] [PubMed] [Google Scholar]
- 70.Miller NP, Aldred B, Schmitt MA, Rokers B. Impact of amblyopia on the central nervous system. J Binocul Vis Ocul Motil. 2020;70:182–192. doi: 10.1080/2576117X.2020.1841710. [DOI] [PubMed] [Google Scholar]
- 71.Min YL, Su T, Shu YQ, Liu WF, Chen LL, Shi WQ, Jiang N, Zhu PW, Yuan Q, Xu XW, Ye L, Shao Y. Altered spontaneous brain activity patterns in strabismus with amblyopia patients using amplitude of low-frequency fluctuation:a resting-state fMRI study. Neuropsychiatr Dis Treat. 2018;14:2351–2359. doi: 10.2147/NDT.S171462. [DOI] [PMC free article] [PubMed] [Google Scholar]
- 72.Muckli L, Kiess S, Tonhausen N, Singer W, Goebel R, Sireteanu R. Cerebral correlates of impaired grating perception in individual, psychophysically assessed human amblyopes. Vision Res. 2006;46:506–526. doi: 10.1016/j.visres.2005.10.014. [DOI] [PubMed] [Google Scholar]
- 73.Nestmann S, Wiesen D, Karnath HO, Rennig J. Temporo-parietal brain regions are involved in higher order object perception. Neuroimage. 2021;234:117982. doi: 10.1016/j.neuroimage.2021.117982. [DOI] [PubMed] [Google Scholar]
- 74.Norman J. Two visual systems and two theories of perception:An attempt to reconcile the constructivist and ecological approaches. Behav Brain Sci. 2002;25((1)):73–144. doi: 10.1017/s0140525x0200002x. [DOI] [PubMed] [Google Scholar]
- 75.Page MJ, McKenzie JE, Bossuyt PM, Boutron I, Hoffmann TC, Mulrow CD, Shamseer L, Tetzlaff JM, Akl EA, Brennan SE, Chou R, Glanville J, Grimshaw JM, Hróbjartsson A, Lalu MM, Li T, Loder EW, Mayo-Wilson E, McDonald S, McGuinness LA, et al. The PRISMA 2020 statement:an updated guideline for reporting systematic reviews. Syst Rev. 2021;10:89. doi: 10.1186/s13643-021-01626-4. [DOI] [PMC free article] [PubMed] [Google Scholar]
- 76.Pai AS, Rose KA, Leone JF, Sharbini S, Burlutsky G, Varma R, Wong TY, Mitchell P. Amblyopia prevalence and risk factors in Australian preschool children. Ophthalmology. 2012;119:138–144. doi: 10.1016/j.ophtha.2011.06.024. [DOI] [PubMed] [Google Scholar]
- 77.Peng J, Yao F, Li Q, Ge Q, Shi W, Su T, Tang L, Pan Y, Liang R, Zhang L, Shao Y. Alternations of interhemispheric functional connectivity in children with strabismus and amblyopia:a resting-state fMRI study. Sci Rep. 2021;11:15059. doi: 10.1038/s41598-021-92281-1. [DOI] [PMC free article] [PubMed] [Google Scholar]
- 78.Perdziak M, Witkowska D, Gryncewicz W, Przekoracka-Krawczyk A, Ober J. The amblyopic eye in subjects with anisometropia show increased saccadic latency in the delayed saccade task. Front Integr Neurosci. 2014;8:77. doi: 10.3389/fnint.2014.00077. [DOI] [PMC free article] [PubMed] [Google Scholar]
- 79.Qi R, Luo Y, Zhang L, Weng Y, Surento W, Li L, Cao Z, Lu GM. Effects of COMT rs4680 and BDNF rs6265 polymorphisms on brain degree centrality in Han Chinese adults who lost their only child. Transl Psychiatry. 2020;10:46. doi: 10.1038/s41398-020-0728-7. [DOI] [PMC free article] [PubMed] [Google Scholar]
- 80.Qi S, Mu YF, Cui LB, Li R, Shi M, Liu Y, Xu JQ, Zhang J, Yang J, Yin H. Association of optic radiation integrity with cortical thickness in children with anisometropic amblyopia. Neurosci Bull. 2016;32:51–60. doi: 10.1007/s12264-015-0005-6. [DOI] [PMC free article] [PubMed] [Google Scholar]
- 81.Secen J, Culham J, Ho C, Giaschi D. Neural correlates of the multiple-object tracking deficit in amblyopia. Vision Res. 2011;51:2517–2527. doi: 10.1016/j.visres.2011.10.011. [DOI] [PubMed] [Google Scholar]
- 82.Shao Y, Li QH, Li B, Lin Q, Su T, Shi WQ, Zhu PW, Yuan Q, Shu YQ, He Y, Liu WF, Ye L. Altered brain activity in patients with strabismus and amblyopia detected by analysis of regional homogeneity:A restingstate functional magnetic resonance imaging study. Mol Med Rep. 2019;19:4832–4840. doi: 10.3892/mmr.2019.10147. [DOI] [PMC free article] [PubMed] [Google Scholar]
- 83.Shi YD, Ge QM, Lin Q, Liang RB, Li QY, Shi WQ, Li B, Shao Y. Functional connectivity density alterations in children with strabismus and amblyopia based on resting-state functional magnetic resonance imaging (fMRI) BMC Ophthalmol. 2022;22:49. doi: 10.1186/s12886-021-02228-3. [DOI] [PMC free article] [PubMed] [Google Scholar]
- 84.Snowden RJ, Braddick OJ. Differences in the processing of short-range apparent motion at small and large displacements. Vision Res. 1990;30:1211–1222. doi: 10.1016/0042-6989(90)90176-l. [DOI] [PubMed] [Google Scholar]
- 85.Su T, Zhu PW, Li B, Shi WQ, Lin Q, Yuan Q, Jiang N, Pei CG, Shao Y. Gray matter volume alterations in patients with strabismus and amblyopia:voxel-based morphometry study. Sci Rep. 2022;12:458. doi: 10.1038/s41598-021-04184-w. [DOI] [PMC free article] [PubMed] [Google Scholar]
- 86.Tang AC, Chen TL, Zhang JR, Gong QY, Liu LQ. Abnormal spontaneous brain activity in patients with anisometropic amblyopia using resting-state functional magnetic resonance imaging. J Pediat Ophth Strab. 2017;54:303–310. doi: 10.3928/01913913-20170320-05. [DOI] [PubMed] [Google Scholar]
- 87.Tao XF, Zhang B, Shen GF, Wensveen J, Smith EL, Nishimoto S, Ohzawa I, Chino YM. Early monocular defocus disrupts the normal development of receptive-field structure in V2 neurons of macaque monkeys. J Neurosci. 2014;34:13840–13854. doi: 10.1523/JNEUROSCI.1992-14.2014. [DOI] [PMC free article] [PubMed] [Google Scholar]
- 88.Thompson B, Maehara G, Goddard E, Farivar R, Mansouri B, Hess RF. Long-range interocular suppression in adults with strabismic amblyopia:a pilot fMRI study. Vision (Basel) 2019;3:2. doi: 10.3390/vision3010002. [DOI] [PMC free article] [PubMed] [Google Scholar]
- 89.Toosy AT, Ciccarelli O, Parker GJ, Wheeler-Kingshott CA, Miller DH, Thompson AJ. Characterizing function-structure relationships in the human visual system with functional MRI and diffusion tensor imaging. Neuroimage. 2004;21:1452–1463. doi: 10.1016/j.neuroimage.2003.11.022. [DOI] [PubMed] [Google Scholar]
- 90.Turrigiano G. Homeostatic synaptic plasticity:local and global mechanisms for stabilizing neuronal function. Cold Spring Harb Perspect Biol. 2012;4:a005736. doi: 10.1101/cshperspect.a005736. [DOI] [PMC free article] [PubMed] [Google Scholar]
- 91.Vanni S, Henriksson L, James AC. Multifocal fMRI mapping of visual cortical areas. Neuroimage. 2005;27:95–105. doi: 10.1016/j.neuroimage.2005.01.046. [DOI] [PubMed] [Google Scholar]
- 92.von Elm E, Altman DG, Egger M, Pocock SJ, Gotzsche PC, Vandenbroucke JP, Initiative S. The Strengthening the Reporting of Observational Studies in Epidemiology (STROBE) statement:guidelines for reporting observational studies. Ann Intern Med. 2007;147:573–577. doi: 10.7326/0003-4819-147-8-200710160-00010. [DOI] [PubMed] [Google Scholar]
- 93.Wallace DK, Lazar EL, Melia M, Birch EE, Holmes JM, Hopkins KB, Kraker RT, Kulp MT, Pang Y, Repka MX, Tamkins SM, Weise KK Pediatric Eye Disease Investigator G. Stereoacuity in children with anisometropic amblyopia. J Aapos. 2011;15:455–461. doi: 10.1016/j.jaapos.2011.06.007. [DOI] [PMC free article] [PubMed] [Google Scholar]
- 94.Wang H, Crewther SG, Liang M, Laycock R, Yu T, Alexander B, Crewther DP, Wang J, Yin Z. Impaired activation of visual attention network for motion salience is accompanied by reduced functional connectivity between frontal eye fields and visual cortex in strabismic amblyopia. Front Hum Neurosci. 2017;11:195. doi: 10.3389/fnhum.2017.00195. [DOI] [PMC free article] [PubMed] [Google Scholar]
- 95.Wang T, Li Q, Guo M, Peng Y, Li Q, Qin W, Yu C. Abnormal functional connectivity density in children with anisometropic amblyopia at resting-state. Brain Res. 2014;1563:41–51. doi: 10.1016/j.brainres.2014.03.015. [DOI] [PubMed] [Google Scholar]
- 96.Wang X, Cui D, Zheng L, Yang X, Yang H, Zeng J. Combination of blood oxygen level-dependent functional magnetic resonance imaging and visual evoked potential recordings for abnormal visual cortex in two types of amblyopia. Mol Vis. 2012;18:909–919. [PMC free article] [PubMed] [Google Scholar]
- 97.Wattam-Bell J, Birtles D, Nystrom P, von Hofsten C, Rosander K, Anker S, Atkinson J, Braddick O. Reorganization of global form and motion processing during human visual development. Curr Biol. 2010;20:411–415. doi: 10.1016/j.cub.2009.12.020. [DOI] [PubMed] [Google Scholar]
- 98.Webber AL. The functional impact of amblyopia. Clin Exp Optom. 2018;101:443–450. doi: 10.1111/cxo.12663. [DOI] [PubMed] [Google Scholar]
- 99.Welbourne LE, Morland AB, Wade AR. Population receptive field (pRF) measurements of chromatic responses in human visual cortex using fMRI. Neuroimage. 2018;167:84–94. doi: 10.1016/j.neuroimage.2017.11.022. [DOI] [PMC free article] [PubMed] [Google Scholar]
- 100.Wen W, Wang Y, Zhou J, He S, Sun X, Liu H, Zhao C, Zhang P. Loss and enhancement of layer-selective signals in geniculostriate and corticotectal pathways of adult human amblyopia. Cell Rep. 2021;37:110117. doi: 10.1016/j.celrep.2021.110117. [DOI] [PubMed] [Google Scholar]
- 101.Willmore BD, Prenger RJ, Gallant JL. Neural representation of natural images in visual area V2. J Neurosci. 2010;30:2102–2114. doi: 10.1523/JNEUROSCI.4099-09.2010. [DOI] [PMC free article] [PubMed] [Google Scholar]
- 102.Wong-Kee-You AMB, Wei H, Hou C. Feature counting under dichoptic viewing in anisometropic and strabismic amblyopia. Transl Vis Sci Technol. 2020;9:13. doi: 10.1167/tvst.9.6.13. [DOI] [PMC free article] [PubMed] [Google Scholar]
- 103.Wu KR, Yu YJ, Tang LY, Chen SY, Zhang MY, Sun T, Wu SN, Yu K, Li B, Shao Y. Altered brain network centrality in patients with adult strabismus with amblyopia:a resting-state functional magnetic resonance imaging (fMRI) study. Med Sci Monit. 2020;26:e925856. doi: 10.12659/MSM.925856. [DOI] [PMC free article] [PubMed] [Google Scholar]
- 104.Xiao JX, Xie S, Ye JT, Liu HH, Gan XL, Gong GL, Jiang XX. Detection of abnormal visual cortex in children with amblyopia by voxel-based morphometry. Am J Ophthalmol. 2007;143:489–493. doi: 10.1016/j.ajo.2006.11.039. [DOI] [PubMed] [Google Scholar]
- 105.Yang X, Lu L, Li Q, Huang X, Gong Q, Liu L. Altered spontaneous brain activity in patients with strabismic amblyopia:A resting-state fMRI study using regional homogeneity analysis. Exp Ther Med. 2019;18:3877–3884. doi: 10.3892/etm.2019.8038. [DOI] [PMC free article] [PubMed] [Google Scholar]
- 106.Yen MY, Cheng CY, Wang AG. Retinal nerve fiber layer thickness in unilateral amblyopia. Invest Ophthalmol Vis Sci. 2004;45:2224–2230. doi: 10.1167/iovs.03-0297. [DOI] [PubMed] [Google Scholar]
- 107.Yin Y, He S, He N, Zhang W, Luo L, Chen L, Liu T, Tian M, Xu J, Chen S, Li F. Brain alterations in sensorimotor and emotional regions associated with temporomandibular disorders. Oral Dis. 2022 doi: 10.1111/odi.14466. doi:10.1111/odi.14466. [DOI] [PubMed] [Google Scholar]
- 108.You W, Luo L, Yao L, Zhao Y, Li Q, Wang Y, Wang Y, Zhang Q, Long F, Sweeney JA, Gong Q, Li F. Impaired dynamic functional brain properties and their relationship to symptoms in never treated first-episode patients with schizophrenia. Schizophrenia (Heidelb) 2022;8:90. doi: 10.1038/s41537-022-00299-9. [DOI] [PMC free article] [PubMed] [Google Scholar]
- 109.Zang Y, Jiang T, Lu Y, He Y, Tian L. Regional homogeneity approach to fMRI data analysis. Neuroimage. 2004;22:394–400. doi: 10.1016/j.neuroimage.2003.12.030. [DOI] [PubMed] [Google Scholar]
- 110.Zele AJ, Pokorny J, Lee DY, Ireland D. Anisometropic amblyopia:spatial contrast sensitivity deficits in inferred magnocellular and parvocellular vision. Invest Ophthalmol Vis Sci. 2007;48:3622–3631. doi: 10.1167/iovs.06-1207. [DOI] [PubMed] [Google Scholar]
- 111.Zhang B, Zheng J, Watanabe I, Maruko I, Bi H, Smith EL, 3rd, Chino Y. Delayed maturation of receptive field center/surround mechanisms in V2. Proc Natl Acad Sci U S A. 2005;102:5862–5867. doi: 10.1073/pnas.0501815102. [DOI] [PMC free article] [PubMed] [Google Scholar]
- 112.Zhang S, Gao GP, Shi WQ, Li B, Lin Q, Shu HY, Shao Y. Abnormal interhemispheric functional connectivity in patients with strabismic amblyopia:a resting-state fMRI study using voxel-mirrored homotopic connectivity. BMC Ophthalmol. 2021;21:255. doi: 10.1186/s12886-021-02015-0. [DOI] [PMC free article] [PubMed] [Google Scholar]
- 113.Zhao Y, Zhang Q, Shah C, Li Q, Sweeney JA, Li F, Gong Q. Cortical thickness abnormalities at different stages of the illness course in schizophrenia:a systematic review and meta-analysis. JAMA Psychiatry. 2022;79:560–570. doi: 10.1001/jamapsychiatry.2022.0799. [DOI] [PMC free article] [PubMed] [Google Scholar]
- 114.Zou QH, Zhu CZ, Yang Y, Zuo XN, Long XY, Cao QJ, Wang YF, Zang YF. An improved approach to detection of amplitude of low-frequency fluctuation (ALFF) for resting-state fMRI:fractional ALFF. J Neurosci Methods. 2008;172:137–141. doi: 10.1016/j.jneumeth.2008.04.012. [DOI] [PMC free article] [PubMed] [Google Scholar]
Refereces
- 115.Allen B, Schmitt MA, Kushner BJ, Rokers B. Retinothalamic White Matter Abnormalities in Amblyopia. Invest Ophthalmol Vis Sci. 2018;59:921–929. doi: 10.1167/iovs.17-22930. [DOI] [PubMed] [Google Scholar]
- 116.Barnes GR, Li X, Thompson B, Singh KD, Dumoulin SO, Hess RF. Decreased gray matter concentration in the lateral geniculate nuclei in human amblyopes. Invest Ophthalmol Vis Sci. 2010;51:1432–1438. doi: 10.1167/iovs.09-3931. [DOI] [PubMed] [Google Scholar]
- 117.Bonhomme GR, Liu GT, Miki A, Francis E, Dobre MC, Modestino EJ, Aleman DO, Haselgrove JC. Decreased cortical activation in response to a motion stimulus in anisometropic amblyopic eyes using functional magnetic resonance imaging. J Aapos. 2006;10:540–546. doi: 10.1016/j.jaapos.2006.07.008. [DOI] [PubMed] [Google Scholar]
- 118.Clavagnier S, Dumoulin SO, Hess RF. Is the Cortical Deficit in Amblyopia Due to Reduced Cortical Magnification. Loss of Neural Resolution or Neural Disorganization? Journal of Neuroscience. 2015;35:14740–14755. doi: 10.1523/JNEUROSCI.1101-15.2015. [DOI] [PMC free article] [PubMed] [Google Scholar]
- 119.Ding K, Liu Y, Yan X, Lin X, Jiang T. Altered functional connectivity of the primary visual cortex in subjects with amblyopia. Neural Plast. 2013;2013:612086. doi: 10.1155/2013/612086. [DOI] [PMC free article] [PubMed] [Google Scholar]
- 120.Duan Y, Norcia AM, Yeatman JD, Mezer A. The structural properties of major white matter tracts in strabismic amblyopia. Invest Ophthalmol Vis Sci. 2015;56:5152–5160. doi: 10.1167/iovs.15-17097. [DOI] [PMC free article] [PubMed] [Google Scholar]
- 121.Farivar R, Zhou J, Huang Y, Feng L, Zhou Y, Hess RF. Two cortical deficits underlie amblyopia:A multifocal fMRI analysis. Neuroimage. 2019;190:232–241. doi: 10.1016/j.neuroimage.2017.09.045. [DOI] [PubMed] [Google Scholar]
- 122.Gupta S, Kumaran SS, Saxena R, Gudwani S, Menon V, Sharma P. BOLD fMRI and DTI in strabismic amblyopes following occlusion therapy. Int Ophthalmol. 2016;36:557–568. doi: 10.1007/s10792-015-0159-2. [DOI] [PubMed] [Google Scholar]
- 123.Ho CS, Giaschi DE. Low- and high-level motion perception deficits in anisometropic and strabismic amblyopia:Evidence from fMRI. Vision Research. 2009;49:2891–2901. doi: 10.1016/j.visres.2009.07.012. [DOI] [PubMed] [Google Scholar]
- 124.Hou C, Kim YJ, Lai XJ, Verghese P. Degraded attentional modulation of cortical neural populations in strabismic amblyopia. J Vis. 2016;16:16. doi: 10.1167/16.3.16. [DOI] [PMC free article] [PubMed] [Google Scholar]
- 125.Huang YF, Feng LX, Zhou YF. Reduced response cluster size in early visual areas explains the acuity deficit in amblyopia. Neuroreport. 2017;28:397–403. doi: 10.1097/WNR.0000000000000767. [DOI] [PubMed] [Google Scholar]
- 126.Lee KM, Lee SH, Kim NY, Kim CY, Sohn JW, Choi MY, Gyu Choi D, Hwang JM, Ho Park K, Lee DS, Suk Yu Y, Hyun Chang K. Binocularity and spatial frequency dependence of calcarine activation in two types of amblyopia. Neurosci Res. 2001;40:147–153. doi: 10.1016/s0168-0102(01)00220-6. [DOI] [PubMed] [Google Scholar]
- 127.Li CM, Cheng L, Yu QW, Xie B, Wang J. Relationship of Visual Cortex Function and Visual Acuity in Anisometropic Amblyopic Children. Int J Med Sci. 2012;9:115–120. doi: 10.7150/ijms.9.115. [DOI] [PMC free article] [PubMed] [Google Scholar]
- 128.Li H, Yang X, Gong Q, Chen H, Liao M, Liu L. BOLD responses to different temporospatial frequency stimuli in V1 and V2 visual cortex of anisometropic amblyopia. Eur J Ophthalmol. 2013a;23:147–155. doi: 10.5301/ejo.5000211. [DOI] [PubMed] [Google Scholar]
- 129.Li Q, Jiang Q, Guo M, Li Q, Cai C, Yin X. Grey and white matter changes in children with monocular amblyopia:voxel-based morphometry and diffusion tensor imaging study. Br J Ophthalmol. 2013b;97:524–529. doi: 10.1136/bjophthalmol-2012-302218. [DOI] [PubMed] [Google Scholar]
- 130.Li Q, Zhai L, Jiang Q, Qin W, Li Q, Yin X, Guo M. Tract-based spatial statistics analysis of white matter changes in children with anisometropic amblyopia. Neurosci Lett. 2015;597:7–12. doi: 10.1016/j.neulet.2015.04.027. [DOI] [PubMed] [Google Scholar]
- 131.Liang M, Xie B, Yang H, Yin X, Wang H, Yu L, He S, Wang J. Altered interhemispheric functional connectivity in patients with anisometropic and strabismic amblyopia:a resting-state fMRI study. Neuroradiology. 2017;59:517–524. doi: 10.1007/s00234-017-1824-0. [DOI] [PubMed] [Google Scholar]
- 132.Liang M, Xiao H, Xie B, Yin X, Wang J, Yang H. Morphologic changes in the visual cortex of patients with anisometropic amblyopia:a surface-based morphometry study. BMC Neurosci. 2019;20:39. doi: 10.1186/s12868-019-0524-6. [DOI] [PMC free article] [PubMed] [Google Scholar]
- 133.Liang ML, Xie B, Yang H, Yu LH, Yin XT, Wei LQ, Wang J. Distinct patterns of spontaneous brain activity between children and adults with anisometropic amblyopia:a resting-state fMRI study. Graef Arch Clin Exp. 2016;254:569–576. doi: 10.1007/s00417-015-3117-9. [DOI] [PubMed] [Google Scholar]
- 134.Lin X, Ding K, Liu Y, Yan X, Song S, Jiang T. Altered spontaneous activity in anisometropic amblyopia subjects:revealed by resting-state FMRI. PLoS One. 2012;7:e43373. doi: 10.1371/journal.pone.0043373. [DOI] [PMC free article] [PubMed] [Google Scholar]
- 135.Liu LQ, Li QY, Zhang ZH, Wu SN, Shu HY, Zhang LJ, Liang RB, Pan YC, Shao Y. Altered functional connectivity of primary visual cortex in adults with strabismus and amblyopia:a resting-state fMRI study. J Integr Neurosci. 2022;21:4. doi: 10.31083/j.jin2101004. [DOI] [PubMed] [Google Scholar]
- 136.Lu W, Yu X, Zhao L, Zhang Y, Zhao F, Wang Y, Qiu J. Enhanced gray matter volume compensates for decreased brain activity in the ocular motor area in children with anisometropic amblyopia. Neural Plast. 2020;2020:8060869. doi: 10.1155/2020/8060869. [DOI] [PMC free article] [PubMed] [Google Scholar]
- 137.Lu Z, Huang Y, Lu Q, Feng L, Nguchu BA, Wang Y, Wang H, Li G, Zhou Y, Qiu B, Zhou J, Wang X. Abnormal intra-network architecture in extra-striate cortices in amblyopia:a resting state fMRI study. Eye Vis (Lond) 2019;6:20. doi: 10.1186/s40662-019-0145-2. [DOI] [PMC free article] [PubMed] [Google Scholar]
- 138.Mendola JD, Conner IP, Roy A, Chan ST, Schwartz TL, Odom JV, Kwong KK. Voxel-based analysis of MRI detects abnormal visual cortex in children and adults with amblyopia. Hum Brain Mapp. 2005;25:222–236. doi: 10.1002/hbm.20109. [DOI] [PMC free article] [PubMed] [Google Scholar]
- 139.Min YL, Su T, Shu YQ, Liu WF, Chen LL, Shi WQ, Jiang N, Zhu PW, Yuan Q, Xu XW, Ye L, Shao Y. Altered spontaneous brain activity patterns in strabismus with amblyopia patients using amplitude of low-frequency fluctuation:a resting-state fMRI study. Neuropsychiatr Dis Treat. 2018;14:2351–2359. doi: 10.2147/NDT.S171462. [DOI] [PMC free article] [PubMed] [Google Scholar]
- 140.Muckli L, Kiess S, Tonhausen N, Singer W, Goebel R, Sireteanu R. Cerebral correlates of impaired grating perception in individual, psychophysically assessed human amblyopes. Vision Res. 2006;46:506–526. doi: 10.1016/j.visres.2005.10.014. [DOI] [PubMed] [Google Scholar]
- 141.Peng J, Yao F, Li Q, Ge Q, Shi W, Su T, Tang L, Pan Y, Liang R, Zhang L, Shao Y. Alternations of interhemispheric functional connectivity in children with strabismus and amblyopia:a resting-state fMRI study. Sci Rep. 2021;11:15059. doi: 10.1038/s41598-021-92281-1. [DOI] [PMC free article] [PubMed] [Google Scholar]
- 142.Qi S, Mu YF, Cui LB, Li R, Shi M, Liu Y, Xu JQ, Zhang J, Yang J, Yin H. Association of Optic Radiation Integrity with Cortical Thickness in Children with Anisometropic Amblyopia. Neurosci Bull. 2016;32:51–60. doi: 10.1007/s12264-015-0005-6. [DOI] [PMC free article] [PubMed] [Google Scholar]
- 143.Shao Y, Li QH, Li B, Lin Q, Su T, Shi WQ, Zhu PW, Yuan Q, Shu YQ, He Y, Liu WF, Ye L. Altered brain activity in patients with strabismus and amblyopia detected by analysis of regional homogeneity:A restingstate functional magnetic resonance imaging study. Mol Med Rep. 2019;19:4832–4840. doi: 10.3892/mmr.2019.10147. [DOI] [PMC free article] [PubMed] [Google Scholar]
- 144.Shi YD, Ge QM, Lin Q, Liang RB, Li QY, Shi WQ, Li B, Shao Y. Functional connectivity density alterations in children with strabismus and amblyopia based on resting-state functional magnetic resonance imaging (fMRI) Bmc Ophthalmol. 2022;22 doi: 10.1186/s12886-021-02228-3. [DOI] [PMC free article] [PubMed] [Google Scholar]
- 145.Su T, Zhu PW, Li B, Shi WQ, Lin Q, Yuan Q, Jiang N, Pei CG, Shao Y. Gray matter volume alterations in patients with strabismus and amblyopia:voxel-based morphometry study. Scientific Reports. 2022;12 doi: 10.1038/s41598-021-04184-w. [DOI] [PMC free article] [PubMed] [Google Scholar]
- 146.Tang AC, Chen TL, Zhang JR, Gong QY, Liu LQ. Abnormal Spontaneous Brain Activity in Patients With Anisometropic Amblyopia Using Resting-State Functional Magnetic Resonance Imaging. J Pediat Ophth Strab. 2017;54:303–310. doi: 10.3928/01913913-20170320-05. [DOI] [PubMed] [Google Scholar]
- 147.Thompson B, Maehara G, Goddard E, Farivar R, Mansouri B, Hess RF. Long-Range Interocular Suppression in Adults with Strabismic Amblyopia:A Pilot fMRI Study. Vision (Basel) 2019;3 doi: 10.3390/vision3010002. [DOI] [PMC free article] [PubMed] [Google Scholar]
- 148.Wang H, Crewther SG, Liang ML, Laycock R, Yu T, Alexander B, Crewther DP, Wang J, Yin ZQ. Impaired Activation of Visual Attention Network for Motion Salience Is Accompanied by Reduced FunctionalConnectivity between Frontal Eye Fields and Visual Cortex in Strabismic Amblyopia. Front Hum Neurosci. 2017;11 doi: 10.3389/fnhum.2017.00195. [DOI] [PMC free article] [PubMed] [Google Scholar]
- 149.Wang T, Li Q, Guo M, Peng Y, Li Q, Qin W, Yu C. Abnormal functional connectivity density in children with anisometropic amblyopia at resting-state. Brain Res. 2014;1563:41–51. doi: 10.1016/j.brainres.2014.03.015. [DOI] [PubMed] [Google Scholar]
- 150.Wang X, Cui D, Zheng L, Yang X, Yang H, Zeng J. Combination of blood oxygen level-dependent functional magnetic resonance imaging and visual evoked potential recordings for abnormal visual cortex intwo types of amblyopia. Mol Vis. 2012;18:909–919. [PMC free article] [PubMed] [Google Scholar]
- 151.Wu KR, Yu YJ, Tang LY, Chen SY, Zhang MY, Sun T, Wu SN, Yu K, Li B, Shao Y. Altered brain network centrality in patients with adult strabismus with amblyopia:a resting-state functional magnetic resonance imaging (fMRI) study. Med Sci Monit. 2020;26:e925856. doi: 10.12659/MSM.925856. [DOI] [PMC free article] [PubMed] [Google Scholar]
- 152.Yang X, Lu L, Li Q, Huang X, Gong Q, Liu L. Altered spontaneous brain activity in patients with strabismic amblyopia:A resting-state fMRI study using regional homogeneity analysis. Exp Ther Med. 2019;18:3877–3884. doi: 10.3892/etm.2019.8038. [DOI] [PMC free article] [PubMed] [Google Scholar]
- 153.Zhang S, Gao GP, Shi WQ, Li B, Lin Q, Shu HY, Shao Y. Abnormal interhemispheric functional connectivity in patients with strabismic amblyopia:a resting-state fMRI study using voxel-mirrored homotopicconnectivity. BMC Ophthalmol. 2021;21:255. doi: 10.1186/s12886-021-02015-0. [DOI] [PMC free article] [PubMed] [Google Scholar]