

SUMMARY
Tissue health is dictated by the capacity to respond to perturbations and then return to homeostasis. Mechanisms that initiate, maintain, and regulate immune responses in tissues are therefore essential. Adaptive immunity plays a key role in these responses, with memory and tissue-residency being cardinal features. A corresponding role for innate cells is unknown. Here we have identified a population of innate lymphocytes that we term tissue-resident memory-like natural killer (NKRM) cells. In response to murine cytomegalovirus infection, we show that circulating NK cells were recruited in a CX3CR1-dependent manner to the salivary glands where they formed NKRM cells, a long-lived tissue-resident population that prevented autoimmunity via TRAIL-dependent elimination of CD4+ T cells. Thus, NK cells develop adaptive-like features, including long-term residency in nonlymphoid tissues, to modulate inflammation, restore immune equilibrium and preserve tissue health. Modulating the functions of NKRM cells may provide additional strategies to treat inflammatory and autoimmune diseases.
Keywords: Natural Killer cells, memory, tissue-residency, viral infection, inflammation, autoimmunity, immune-regulation, cytomegalovirus
eTOC blurb
Immune activation can be damaging if responses are not adequately controlled. Schuster et al reveal that following cytomegalovirus infection, circulating Natural Killer cells are recruited into non-lymphoid tissues, including the salivary glands where they establish a tissue-resident memory-like population that prevents immune-mediated damage and safeguards tissue health by preventing autoimmunity.
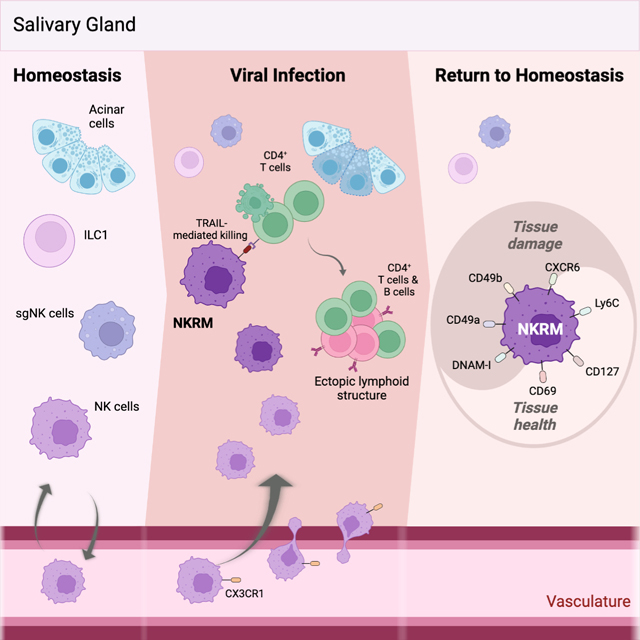
Graphical Abstract
INTRODUCTION
While the importance of effective pathogen protective immunity is clear, balancing these responses to avoid immune-mediated damage is critical to safeguarding tissue function. The importance of regulating immune responses is highlighted by the observations that excessive or misdirected pathogen-protective immunity can lead to multiple pathologies. Overly vigorous production of inflammatory cytokines can result in a lethal cytokine release syndrome, as has been noted following SARS-CoV2 infection1, while uncontrolled inflammation can damage tissues and contribute to the development of autoimmunity2. Thus, mechanisms to maintain immune equilibrium, by ensuring that immune responses are appropriately regulated, are essential to prevent immune-mediated damage and maintain tissue health.
The first line of defence against many pathogens, especially viruses, involves activities mediated by NK cells, innate lymphocytes that patrol the circulation and lymphoid tissues and promptly respond to pathogen challenges3. In non-lymphoid tissues, sentinel function and protection from pathogens are mediated by innate lymphoid cell (ILC) populations4,5 that reside within tissues, as well as adaptive lymphocytes that are recruited and retained in tissues following infection, such as tissue-resident memory T cells (TRM)6,7. Ongoing protection against recurring and reinvading infections requires immunological memory, a function historically considered a hallmark of adaptive immunity, but recently shown to extend to innate lymphocytes, including NK cells and ILCs3.
Despite the emerging similarities between adaptive and innate immunity, whether circulating innate lymphocytes, like NK cells, can be recruited to non-lymphoid tissue and establish long-term residency in response to infection remains unclear. Memory cells are known to provide ongoing protection against pathogens, but whether immunological memory contributes to maintaining immune equilibrium, and which cells are involved, remains unknown.
Here, we investigated type I innate lymphocyte responses elicited in a non-lymphoid tissue in response to chronic viral infection and identified a population of circulating NK cells that are recruited to the salivary glands, where they establish long-term residency (termed NKRM cells). Importantly, in contrast to their adaptive counterparts (TRM), the role of NKRM cells is to limit inflammation and safeguard tissue function.
RESULTS
NK cells are recruited and retained in non-lymphoid tissue following MCMV infection
To address whether innate lymphocyte populations can establish residency and participate in long-term pathogen protection and/or controlling immune homeostasis, we examined these responses after cytomegalovirus (CMV) infection. CMV establishes a chronic, latent infection in several tissues, including the lungs and salivary glands (SG). The SG are particularly relevant as CMV persists and propagates within the SG, enabling transmission of viral progeny to new hosts in saliva secretions8. Analysis of lymphocytes in the SG of naïve mice revealed that, under steady-state conditions, NKp46+ innate lymphocyte populations could be distinguished based on expression of the Eomesodermin (Eomes) transcription factor, the surface integrin CD49b, and the ILC1 marker CD200R9 (Figure S1). As described previously10–13, classical ILC1 (Eomes−CD49b−), classical NK cells (Eomes+CD49b+), and a population of cells which express Eomes but lack CD49b, referred herein as salivary gland-specific NK cells (sgNK, Eomes+CD49b−) were present in the SG (Figure S1). These populations had distinct transcriptional signatures (Figure S2A and S2B) and different reliance on the transcription factors Eomes and T-bet for their development (Figure S2C and S2D), consistent with published reports10–13. Parabiosis studies revealed that the ILC1 and sgNK cells were embedded in the tissue in the steady state, whereas over 50% of the classical NK cells were derived from the circulation in naïve mice (Figure S2E). Next, we examined the impact of viral infection and found that MCMV infection resulted in a significant increase in the frequency and number of NK cells within the SG during acute (day 7) and chronic (day 25) infection, while the frequency of ILC1 and sgNK cells decreased following infection with no significant changes in numbers (Figure 1A). Phenotypic changes were also observed, principally in NK cells, which exhibited increased expression of the tissue-residency integrin CD49a14 and the activation markers CD11b and TRAIL (Figure 1B) with no changes in the expression of CD200R. Thus, MCMV infection results in a preferential accumulation of activated NK cells in the SG.
Figure 1. NK cells accumulate in the SG after MCMV infection.

Flow cytometry analysis of group 1 ILCs from the SG of MCMV infected BALB/c mice at days 7 and 25 PI. (A) Representative plots (n = 2–4 independent experiments) show CD49b vs Eomes expression in live Lin− (CD3−CD19−TCRb−) NKp46+ cells from naïve and infected mice. Gates define ILC1 (black), sgNK (blue) and NK (pink) cells. Frequencies and total numbers of the 3 populations over the course of MCMV infection are plotted. Mean ± SEM are shown, and significance tested by two-way ANOVA with multiple comparisons. (B) Representative histogram overlays and percentages of NK cells expressing the indicated markers from naïve (filled) or MCMV infected mice at days 7 (solid line, no fill) and 25 PI (dashed line, no fill). The data in (A) and (B) are pooled from 2–4 (naïve: 4 experiments) and 2 (day 7 and 25 PI; 2 experiments) independent experiments (naïve n = 5, day 7 PI n = 9, day 25 PI n = 10). Mean ± SEM are shown, and significance tested by Mann-Whitney t test. *p <0.05, **p <0.01, ***p <0.001, ****p <0.0001. See also Figures S1 and S2.
The parabiosis data indicated that circulating NK cells trafficked through the SG (Figure S2E). To examine whether this trafficking explained the increase in NK cells observed in the SG following MCMV infection, adoptive transfer experiments were performed. Splenic NK cells (NKp46+ and Lin− i.e. CD3− CD19−) were transferred into MCMV infected mice and, at days 18 (chronic infection with active viral replication)8 and 40 after infection (resolved infection with no active viral replication)8,15, cells were harvested for analysis, immediately following intravenous injection of a fluorescent pan-CD45 antibody to distinguish intravascular (IV+) and intratissue (IV−) cells (Figure 2A). Transferred cells were found in the SG in significant numbers at day 18 post infection (PI) (Figure 2B) with approximately 50% located in the SG parenchyma, as demonstrated by the lack of intravascular (IV) labelling (Figure 2C). Most of the transferred cells were classical NK cells (Lin−Eomes+CD49b+) (Figure 2D) and lacked CD200R (Figure 2E). Notably, CD49a expression was significantly higher on cells that had migrated into the SG parenchyma (i.e. IV−) compared to circulating NK cells (Figure 2E). A similar response was observed in the endogenous NK cell population (Figure 2F). Thus, NK cells are recruited into the SG in response to MCMV infection and the cells that remain in the tissue are phenotypically distinct from their circulating counterparts. The observations made at day 18 PI were confirmed at day 40, when active viral infection has been controlled in all tissues, including the SG8. At day 40 after infection, all the transferred cells localized to the SG parenchyma (Figure 2G). In addition to the tissue-residency integrin CD49a, the transferred cells also expressed Ly6C (Figure 2H), a phenotypic marker expressed by memory NK cells generated either in response to MCMV antigen recognition or cytokine exposure16. The endogenous NK cells (Lin−Eomes+CD49b+) showed a similar response, including a significant increase in the expression of Ly6C compared to cells from naïve mice (Figure 2I). Thus, in response to MCMV infection circulating NK cells are recruited into the SG and are retained in the tissue long-term.
Figure 2. NK cells are recruited and retained in the SG after MCMV infection.

(A) Schematic overview of in vivo transfer experiments using congenically marked spleen-purified Lin−NKp46+ cells. (B) Representative plots of live SG Lin−NKp46+ cells showing endogenous (CD45.1+CD45.2−) and transferred cells (CD45.1−CD45.2+: purple gate) in control mice and mice at day 18 PI. Transferred cells in the SG are enumerated in the graph. (C) Representative plots of transferred Lin−NKp46+ cells showing IV+ and IV− fractions in the SG (left) and Eomes versus CD49b expression in transferred IV− and IV+ cells (right). (D) Frequency of the various NKp46+ cell subsets. (E) Frequencies of cells within the IV− and IV+ fraction of the transferred cells expressing CD200R and CD49a in the SG at day 18 PI. Data in (B) to (E) are representative of (plots) or pooled (graphs) from 2 independent experiments (naïve n = 3, day 18 PI n = 12), except for CD200R which is from one experiment where n = 6. Means ± SEM are shown, and significance tested using a Mann Whitney t test. **p <0.01, ****p <0.0001. (F) Representative plot of endogenous (blue gate) Lin−NKp46+ cells IV+ and IV− fractions in the SG at day 18 PI and expression of Eomes versus CD49b. Plot is representative of 2 independent experiments. Data are pooled from the 2 independent experiments (naïve n = 3, day 18 PI n = 12). (G) Representative plots of transferred Lin−NKp46+ cells at day 40 PI. The IV status and frequencies show transferred cells are resident (IV−) by day 40 PI. Plots are representative of 2 independent experiments. Data are pooled from the 2 independent experiments, n = 10. (H) Plot of Eomes versus CD49b expression in transferred cells resident (IV−) in the SG, and CD200R, CD49a and Ly6C expression in transferred cells (IV− vs IV+) at day 40 PI (n = 4, representative of 2 independent experiments). (I) Representative plot of endogenous Lin−NKp46+ cells showing resident (IV−) and circulating (IV+) fractions (left) and Eomes versus CD49b expression (middle). Frequencies of cells expressing CD49a in endogenous (IV− vs IV+) cells (middle right) and frequency of IV− NK cells expressing Ly6C in naïve and MCMV infected mice (far right). Plot is representative of 2 independent experiments. Data are pooled from the 2 independent experiments (naïve n = 3, day 40 PI n = 14). Means ± SEM are shown, and significance tested by Mann Whitney t test. **p < 0.01.
NK cells in non-lymphoid tissue form a long-lived tissue resident population with a distinct transcriptional profile
Important paradigms in NK cell immunity have been defined in the context of CMV infection3,17–23. Following MCMV infection, NK cells, like T cells, expand, contract, and generate a long-lived memory pool of circulating cells with enhanced functionality to MCMV reencounter24. NK cells recruited to tissue may represent an innate equivalent of memory T cells residing in non-lymphoid tissues, TRM. We therefore examined whether the NK cells in the SG exhibited additional features of adaptive immune cells. After MCMV infection, NK cells in the SG displayed kinetics of expansion (day 18), contraction (day 40) and persistence (day 120), not observed in ILC1 or sgNK cells (Figure 3A). Analysis of the NK cells present in the SG at day 120 PI identified a population expressing CD49a and Ly6C (Figure 3B), markers present on NK cells localized to the SG parenchyma after adoptive transfer (Figure 2H). The nature of the NK cells that persist in the SG after MCMV infection and how they relate to previously described populations of memory and/or adaptive-like NK cells was investigated by single-cell RNA sequencing (scRNAseq). A pool of NK cells defined based on the expression of NKp46, CD49b and CD200R (NKp46+, CD49b+ and CD200R−) was sorted from the SG of MCMV infected mice at day 120 after infection for scRNAseq (Figure S3A). We confirmed by flow cytometry that the sorted cells used for scRNAseq included CD49a+ Ly6C+ cells (Figure S3B). Unsupervised hierarchical clustering of the scRNAseq data identified seven clusters (Figure 3C), each distinguishable by a set of five cluster defining transcripts (Figure 3D). Ly6C, a marker of the MCMV-induced NK cells that were retained in the SG parenchyma (Figures 2H, I and 3B), mapped to cluster 5 (Figure 3E). This cluster represents a population defined by transcripts including Il7r, Cxcr6 and Cd226 (encoding DNAM1) (Figure 3F). Access to IL7 is essential for the survival of TRM cells under homeostatic conditions25 and CXCR6 regulates the localization of TRM cells and is included in the core TRM cell signature in mice and humans26. Other canonical markers of tissue residency such as Itga1 (CD49a), Cxcr3, Cd69 and Rgs1 were also enriched in cluster 5 (Figure 3F). Cluster 5 also showed increased expression of transcriptional regulators that are over-represented in TRM25, including Maf, Rora, Ikzf2 (Helios) and Ahr (Figure 3F). Like TRM, cells in cluster 5 displayed reduced S1pr1 and S1pr5 transcripts (Figure 3F). S1PR1 is targeted by CD69 for degradation, thereby preventing egress from tissues to the circulation27 and S1PR5 regulates the retention of TRM and ILC1 in tissues28. Unlike TRM, cells in cluster 5 expressed Eomes and Tcf7 (Figure S3C) and unlike ILC19 lacked Cd200r but expressed IL7R, usually considered an ILC1 marker.
Figure 3. NK cells expand, contract and persists as a long-lived tissue resident memory-like population following MCMV infection.

(A) NK cells (pink), ILC1 (grey) and sgNK (blue) populations were enumerated in the SG of MCMV infected BALB/c mice and are plotted over time. Data are representative of 6 independent experiments and shown as mean ± SEM (naïve n = 12, day 18 n = 8, day 40 n = 13, day 120 n = 6). Significance tested by two-way ANOVA with multiple comparisons. ***p < 0.001. (B) Representative plot of Eomes and CD49b expression in SG Lin−NKp46+ cells at day 120 PI (left) and frequencies of cells expressing CD49a and Ly6C in naïve and infected mice (right). Plot is representative of 4 independent experiments. Data are pooled from the 4 independent experiments (naïve n = 6, day 120 n = 12), plotted as mean ± SEM with significance tested by Mann Whitney t test. ns > 0.05, ***p < 0.001. (C) SG NK cells were sorted (see Figure S3A) from mice (n = 12) at day 120 PI and transcriptome analysis performed by scRNAseq. Clustering of single cell data identifies seven clusters shown on UMAP projection. (D) Pseudo-bulk heat map showing the top 5 cluster defining genes for each cluster. (E) Pseudo-bulk heat map of top 20 transcripts defining cluster 5 and their expression in other clusters is shown. (F) Dot plot showing expression of cluster 5 defining genes grouped by functional associations. See also Figure S3.
Adaptive-like NK cells have been identified in the blood of CMV-seropositive individuals29 and are thought to represent the counterpart of memory NK cells in the mouse3. Cluster 5 lacks the defining features of memory NK cells, instead displaying reduced expression of transcripts for cytotoxic molecules (Gzma, Gzmb, Prf1) and other memory-NK cell defining markers (e.g. Klrg1, Irf8, Klra3)22. Further analysis revealed that cluster 5 was defined by a transcriptional profile (Figure S3D) similar to that characterizing a population of human NK cells recently identified as adaptive-like NK cells that specifically reside in the human lung30 (Figure S3E).
Altogether these analyses demonstrate that MCMV infection leads to the development of a population of NK cells with a distinct transcriptional signature consistent with tissue residency and adaptive memory-like features, which we therefore termed tissue resident memory-like NK cells (NKRM). NKRM differ from CMV-specific memory NK cells which have previously been described in lymphoid organs3.
Long-lived memory-like tissue resident NK cells have a distinct and stable phenotypic profile
Given the heterogeneity of the NK cell populations defined by scRNAseq in the SG of MCMV infected mice (Figure 3C), we examined whether a distinct population of NKRM with a stable phenotypic profile could be identified long-term after MCMV infection. Transcripts that distinguished cluster 5 were used in high-parameter flow cytometry analysis to determine whether NKRM could be identified ex vivo.
Multidimensional UMAP analysis of manually gated tissue resident (IV−) NK cells (Lin−, NKp46+, CD49b+, CD200R−) identified a population of NK cells in the SG at day 40 after MCMV infection that was not present in naïve mice (Figure 4A). To gain further insights into the changes that occur in NK cells following infection we used FlowSOM, an unsupervised clustering approach (Figure S4A) and identified a cluster present only in cells from MCMV infected mice (Figure 4B), characterized by Ly6C, CD49a, CXCR6 and CD127 (Figure 4C) as well as CD226 (DNAM-1), together with reduced expression of KLRG1, CD11b and IRF8 (Figure S4B), corresponding to the transcriptional characteristics of cluster 5 (Figure S3). This phenotype remained stable out to three months (day 120) after infection (Figure 4D – F, Figure S4C and S4D).
Figure 4. Phenotypic profile of long-lived memory-like tissue resident NK cells.

BALB/c mice were infected with MCMV and SG NK cells from naïve and MCMV infected mice at days 40 (A – C) and 120 PI (D – F) analysed by high-parameter flow cytometry. (A) UMAP plots comparing NK cell clustering in naïve and infected mice at day 40 PI. The NKRM gate identifies a distinct population of cells present in MCMV-infected mice. (B) FlowSOM unsupervised clustering analysis based Minimal Spanning Tree. The meta-cluster branch composed of NKRM is indicated, (naïve n = 2, infected n = 5). (C) Histogram overlays showing expression of indicated markers in NKRM (FlowSOM population 7) compared to all other SG NK cells in infected mice. Data are concatenated from 5 mice. (D – F) as above but compare naïve to day 120 MCMV-infected mice. (naïve n = 4, infected n = 6) (F) Histogram overlays show expression of indicated markers in NKRM (FlowSOM population 7) compared to all other SG NK cells in infected mice. Data are concatenated from 6 mice and are representative of at least 2 independent experiments. Dimensional reduction was calculated on parameters KLRG1, CD49a, CD11b, IRF8, GzmB, Ly6C, CXCR6, CD127, DNAM-1, CD69 and CD62L. See also Figures S4, S5 and S6.
Analyses of IV− NK cells in other tissues, using the same unsupervised UMAP dimensional reduction approach used for the SG, identified a population of NK cells in the lungs of mice at day 80 after MCMV infection that was not found in naïve mice (Figure S5A); these cells resided in the lung parenchyma (IV−) and phenotypically (Figure S5B) resembled the NKRM found in the SG and human lung30 (Figure S3E).
Of note, NKRM were absent in lymphoid tissues like the spleen, where a population of cells (which we termed NKmem) with features previously attributed to MCMV-specific Ly49H+ NK cells (e.g. CD11b+, KLRG1hi, IRF8hi, GzmB+, CXCR6−)31,32 could be identified instead (Figure S6A and S6B).
Altogether, these data demonstrate that following MCMV infection, a phenotypically distinct and readily identifiable NKRM population is present long-term in a non-lymphoid tissue.
CX3CR1 signalling and inflammation guide the formation of NKRM cells
Next, we examined the signals that contribute to NKRM formation. IFNγ mediates NK cell recruitment in anti-viral responses33,34 and CD8+ T cells expressing this cytokine increased in the SG and peripheral blood during MCMV infection (Figure S7A). Increases in the IFN-induced chemokines CXCL9, CXCL10 and CX3CL1 were also noted (Figure S7B). CXCR3 is known to be expressed by NK cells34 and we also found substantial CX3CR1 expression on trafficking NK cells after infection (Figure S7C), suggesting a role for these chemokine axes. Blocking CXCR3 did not alter the number of NK cells (Eomes+CD49b+) present in the SG after MCMV infection (Figure S7D). In contrast, a significant reduction in the number of NK cells was found in the SG of CX3CR1-deficient mice compared to WT mice after MCMV infection (Figure S7E). Thus, following MCMV infection accumulation of NK cells in the SG is altered in the absence of CX3CR1-mediated signals.
Memory NK cells form in response to specific receptor activation (i.e. Ly49H engagement of MCMV viral protein m157) or in the context of an inflammatory cytokine environment22. Inflammatory signals also play a critical role in the fate of T cells recruited into anti-viral responses, including the formation of TRM cell populations35. To examine the role of these factors in the formation of NKRM, we infected congenic BALB/c.Ly49H+ mice with a virus lacking m157 (MCMV Δm157), the Ly49H ligand, or WT MCMV. In these infections, the differential engagement of Ly49H by m157 results in distinct viral replication kinetics early in infection and is accompanied by differing amounts of pro-inflammatory cytokines (e.g. IFNγ, TNF, IL-12, IL-18)36–38. Comparative UMAP analyses of tissue resident (IV−) SG NK cells in naïve and MCMVΔm157 infected mice revealed the presence of an NK cell population in infected mice (Figure 5A) with an NKRM phenotype that lacked Ly49H expression (Figure 5B). In BALB/c.Ly49H+ mice infected with MCMV WT, where Ly49H-mediated control of acute infection occurs, NKRM cells were present (Figure 5C and D), albeit to a lesser extent than in mice infected with MCMVΔm157.
Figure 5. Inflammation is a key driver of NKRM formation.

BALB/c.Ly49H+ or C57BL/6J mice were infected with MCMVΔm157 or WT MCMV and SG NK cells from naïve and MCMV infected mice at day 80 PI analysed by high-parameter flow cytometry. (A – B) BALB/c.Ly49H+ + MCMVΔm157, (C – D) BALB/c.Ly49H+ + WT MCMV (E – F) C57BL/6J + MCMVΔm157 (G – H) C57BL/6J + WT MCMV. UMAP plots (left) comparing NK cell clustering in naïve and infected mice at day 80 PI. The gates identify a distinct population of cells present in MCMV-infected mice (naïve n = 4, infected n = 5). Histogram overlays (right) of the indicated markers show the phenotype of infection-related NK cell populations compared to other NK cells localized to the SG of infected mice. The data are representative of 2 independent experiments.
To further define the role of genetic differences, the relevance of which has been highlighted recently by SARS-CoV2 infection, we infected C57BL/6 mice with MCMV and MCMVΔm157 viruses. Although a distinct NK cell population was generated in these infections (Figure 5E and G), the cells lacked expression of NKRM defining markers, including Ly6C, CXCR6, DNAM-1 and CD127 (Figure 5F and H). Thus, NKRM cells formation is maximal under high inflammatory conditions and shaped by the host’s genetic makeup.
NKRM cells protect tissue integrity and maintain optimal tissue function
Prevailing dogma suggests that tissue resident memory cells are positioned to provide sentinel immunity and protect tissues against reinfection and/or reactivation of pathogens. However, in CX3CR1-deficient mice which displayed impaired accumulation of NK cells in the SG (Figure S7E), viral control in this organ was improved compared to WT mice (Figure S7F). Notably, viral loads in other tissues were equivalent in Cx3cr1−/− and WT mice (Figure S7F). Consistent with these findings, we previously showed that depletion of NK cells during chronic infection does not affect viral control in the SG19, however it is unclear whether such depletion had an impact on NKRM formation. To address this, we performed timed depletion of NK cells starting prior to the establishment of NKRM and ensuring that early NK cell-mediated anti-viral responses are not affected. UMAP analysis of SG IV− NK cells at day 80 post MCMV infection showed a reduction in the frequency of cells within the NKRM population in the SG of depleted mice (Figure 6A). While the numbers of canonical NK cells were comparable in control and treated mice (Figure 6B, left), NKRM numbers were significantly reduced in mice that received the depletion treatment (Figure 6B, right). Examination of other lymphocyte populations in the SG revealed a significant increase in CD4+ T cells (Figure 6C). This increase was accompanied by the accumulation of lymphocytic aggregates (Figure 6D) comprised of CD4+ T cells and B cells in the SG (Figure 6E), a feature of ectopic lymphoid structures (ELS). Both the number and complexity of the ELS increased in mice depleted of NKRM cells (Figure 6F). ELS frequently develop in chronically inflamed tissues and participate in the pathology observed in autoimmune diseases39,40. To determine whether a lack of NKRM resulted in the induction of SG-specific autoimmunity following MCMV infection, we measured SG specific autoantibodies and SG function at long term timepoints post infection. Consistent with the histopathology observed in the absence of NKRM (Figure 6D–F), we found heightened autoantibodies targeting SG proteins (Figure 6G) and impaired exocrine function (Figure 6H), measured as a sustained reduction in saliva production.
Figure 6. Depletion of NKRM leads to autoimmunity and loss of salivary gland function in MCMV infected mice.

MCMV-infected BALB.B6-CT6 (NK1.1+) were either control treated or treated with anti-NK1.1 antibody on days 9, 13, 17, and 22 PI and SG NK cells were analysed by high-parameter flow cytometry on day 80 PI. (A) UMAP plots comparing NK cell clustering in control or NKRM depleted mice at day 80 PI. NKRM cells are gated. Plots are representative of 2 independent experiments. (B) The total number of NK cells (left), NKRM (right) and (C) CD4+ T cells in the SG of control and NKRM depleted mice at day 80 PI (control n = 4, NKRM depleted n = 4, representative of 2 independent experiments). (D) Representative H&E image of SG (left) and lymphocytic aggregate score in SG (right) taken at day 152 from BALB.B6-CT6 infected with MCMV and NKRM depleted. (E) Representative images showing CD4 (green) and B220 (pink) staining in the SG from NKRM depleted mice at day 152 PI. White arrows locate ELS. The composition of a representative ELS (circled) is shown at higher magnification (n = 4 per group). The data in D and E are representative of 2 independent experiments.
(F) The number of ELS (top) and ELS score (that combines ELS number and complexity, bottom) in SG sections, stained as in D, are shown. Mean ± SEM are shown, and significance tested by Mann Whitney t test. (G) Violin plots show SG-specific IgG autoantibodies at indicated times PI in control (grey) and NKRM depleted (purple) mice. Data are pooled from 2 independent experiments (n = 7 – 9 per group). Median, 1st and 3rd quartile are shown. Significance was tested with a one-way ANOVA with Kruskal-Wallis rank test, outliers excluded based on ROUT test. (H) Violin plots show saliva production at indicated times PI in control (grey) and NKRM depleted (purple) mice (n = 8 − 9 per group). Significance was tested by Mann Whitney t test. *p < 0.05, **p < 0.01 and ***p < 0.001. See also Figure S7.
To confirm the results obtained with our late NK cell depletion protocol in an independent setting and given that the formation of NKRM appeared to require CX3CR1-dependent signals (Figure S7C and E), we examined responses in the absence of CX3CR1. Adoptive transfer of CX3CR1-deficient NK cells into congenic BALB/c mice (Figure 7A) infected with MCMV validated that cells lacking CX3CR1 cannot form a population of NKRM cells (Figure 7B). Further analyses in Cx3cr1−/− mice at day 18 after infection demonstrated that as well as reduced numbers of NKRM cells in the SG (Figure S7E), Cx3cr1−/− mice had significantly higher numbers of SG CD4+ T cells (Figure 7C), as observed in mice depleted of NKRM cells (Figure 6C). The negative correlation between NKRM and CD4+ T cell numbers in the SG suggests that NKRM may be poised to eliminate CD4+ T cells to prevent the development of autoimmunity. We therefore examined whether NKRM can kill SG CD4+ T cells and if so, what mechanisms are involved, considering that NKRM lack many cytotoxic molecules (Figure 3F). Co-culture of SG CD4+ T cells with sort purified SG NKRM cells led to a loss of CD4+ T cells, which did not occur when CD4+ T cells were co-cultured with all other SG NK cells (Figure 7D). In contrast to NKRM isolated from WT mice, NKRM cells from mice lacking TRAIL, the death receptor upregulated on SG NK cells (Figure 1B), were unable to eliminate SG CD4+ T cells. Thus, the elimination of SG CD4+ T cells is the remit of NKRM cells and TRAIL-mediated activities are key to this function of NKRM cells.
Figure 7. NKRM cells eliminate SG CD4+ T cells in a TRAIL-dependent manner to maintain SG function.

(A) Schematic overview of in vivo transfer experiment where Lin−NKp46+ cells were purified from CX3CR1-deficient mice (CD45.2) and transferred into WT (CD45.1) mice at day 4 PI. (B) Concatenated plot of live, IV− SG NKp46+ cells showing endogenous (CD45.1+CD45.2−) and transferred cells (CD45.1−CD45.2+) (left panel). The frequency of transferred cells expressing the NKRM markers Ly6C and CD49a is shown (middle panel) and the number of transferred WT and Cx3cr1−/− NK cells in the SG at day 40 PI (right panel). Plots are concatenated from n = 5 and representative of 2 independent experiments. (C) Total number of CD4+ T cells in the SG of WT and Cx3cr1−/− mice on day 18 PI. Data are plotted as mean ± SEM (n = 7 − 9 per group), pooled from 2 independent experiments. (D) NKRM (pink line) and all other NK cells (grey line) were sorted from the SG of WT (solid line) or TRAIL-deficient (dashed line) mice, cultured with sorted SG CD4+ T cells for 20 hrs and killing of CD4+ T cells measured. Data are pooled from 3 independent experiments (n = 5 − 6 mice/group per experiment). (E) Schematic overview of in vivo transfer experiment where Lin− NKp46+ cells purified from WT or CX3CR1-deficient mice are transferred into MCMV-infected TRAIL-deficient mice at day 4 PI. (F) Total number of CD4+ T cells in the SG and (G) saliva production on day 70 PI. Data are plotted as mean ± SEM (n = 3 – 6 per group, representative of 2 independent experiments). Statistical analysis was performed using a Mann Whitney t test. *p < 0.05, **p < 0.01 and ****p <0.0001. See also Figure S7.
Having shown that CX3CR1-deficient NK cells cannot form NKRM (Figure 7B), we transferred WT and CX3CR1-deficient NK cells into Tnfsf10−/− mice lacking TRAIL (Figure 7E) which develop a Sjogren’s Syndrome like pathology after MCMV infection19. Significantly higher numbers of CD4+ T cells were present in the SG of MCMV infected Tnfsf10−/− mice that received CX3CR1-deficient NK cells compared to mice that received WT NK cells (Figure 7F). Notably, transfer of WT but not CX3CR1-deficient NK cells restored increased saliva production in Tnfsf10−/− mice (Figure 7G). These results provide independent evidence that NKRM cells protect the SG from immune-mediated pathology, that their protective effects are mediated via TRAIL, and that CX3CR1 is critical for the formation of NKRM cells.
Altogether, these data establish that NKRM, a population that develops following MCMV infection, represent tissue resident memory-like NK cells with some features analogous to TRM (i.e. elicited by pathogen encounter and inflammation, with long-lived tissue residency), but poised to regulate immune responses, thereby ensuring the preservation of tissue integrity and function, in the face of virus-induced inflammation.
DISCUSSION
Although historically the innate and adaptive immune systems have been considered as entirely separate entities, more recently it has become clear that innate lymphocytes share several features of adaptive immunity. Akin to T cells, in response to CMV infection, NK cells can selectively expand and differentiate into long-lived memory cells that provide superior sentinel functions24. In non-lymphoid tissues pathogen protection has been ascribed to ILC1s, cells that sit in tissue at steady state9 and which have recently been shown to also acquire adaptive-like features of immune memory in response to CMV infection41. Thus, ILC1s may be thought to represent an innate counterpart to TRM in that they are tissue-resident (although not specifically recruited in response to infection) pathogen-focused effector cells. Here, we have described NKRM, a population drawn from circulating NK cells in response to infection and inflammation to form a long-lived memory-like population that establishes long-term residency in non-lymphoid tissues, thus displaying key parallels with TRM cells. However, in contrast to TRM, memory NK cells and memory ILC1, whose principal function is to provide sentinel protection to the host, we have shown that NKRM serve an opposing function to these effector populations. Indeed, we have shown that NKRM cells play a key role in controlling an adaptive immune response, thereby protecting the SG from immunopathology, and preserving tissue function. These features resemble those of regulatory T cells and therefore the current findings provide evidence that innate lymphocytes may share additional features of adaptive immunity.
The mechanisms that guide the formation of NKRM, including whether specific antigen recognition is an essential prerequisite, remain to be defined.
While CMV infection is known to result in the expansion of virus-specific NK cells with memory features, the NKRM population identified here is distinct both in phenotype and function. In mice, long lived virus-specific memory Ly49H+ NK cells (CD11b+, KLRG1hi, IRF8hi, GzmB+, CXCR6−) that undergo clonal expansion and afford superior protection against MCMV re-encounter have been described3. The phenotypic profile of the NKRM population identified in this study (Ly6C+, CD49a+, CXCR6+, CD127+, CD11b−, KLRG1−) differs from that of virus-specific memory NK cells, and unlike Ly49H+ memory NK cells, NKRM cells function as regulatory cells rather than providing pathogen protection. A subset of uterine NK cells (uNK), Eomes+ uterine trNK cells, shares phenotypic markers with SG NKRM cells42; uNK cells play important roles in placentation and fetal growth, but like NKRM, it is possible that they may also be involved in uterine physiology by safeguarding tissue homeostasis. In addition to the SG, we identified cells with an NKRM phenotype in the lungs of MCMV infected mice, and the transcriptional profile of murine SG NKRM cells is similar to that of a lung resident NK cell population identified in humans30. Defining the role of lung NKRM in mice and how these cells relate to transcriptionally similar NK cell populations in humans will provide further insight into the function of these populations.
The NKRM population described here has an unusual phenotype characterized by features of both NK cells and ILC1. Similar features have been noted in long-lived ILC1-like innate lymphocytes thought to originate from NK cell conversion following infection with Toxoplasma gondi 43. NKRM are CD200R−, retain Eomes expression and notably do not expand in circulation or in lymphoid organs (e.g blood and spleen), a feature of T. gondii-induced ILC1-like cells43. Our current findings provide evidence for genetic factors and inflammatory signals as key determinants of NKRM development, whilst excluding a role for engagement of the Ly49H NK cell receptor that guides the formation of MCMV-specific memory NK cells in lymphoid organs. In this context it is worth noting that adaptive-like NK cells can be generated independently of antigen recognition by exposure to pro-inflammatory cytokines44 and that differentiation of group 1 ILC in the SG has also been linked to TGF-β45, a cytokine required for the development and maintenance of TRM in various tissues46. TGF-ß signaling can also shape the phenotype and function of NK cells. In the SG, TGF-ß guides the differentiation of NKp46+ group 1 ILC populations, in synchrony with SG development45. In lymphoid tissues, and in some tumor microenvironments, non-canonical signaling through TGFßR1 has also been shown to modulate the phenotype and function of NKp46+ cell subsets47, 48. In the latter settings however TGFßR1 signaling does not recapitulate the phenotype of cells in the SG, supporting the premise that TGF-ß imprinting is tissue dependent45. Thus, TGF-ß signaling may participate in the formation of NKRM cells, and this is the subject on ongoing investigations.
Our finding that NKRM cells preferentially form in BALB/c mice illustrates the importance of host genetics in determining the responses to viral infections, including downstream pathologies, something that has been clearly illustrated by SARS-CoV2 infection and COVID outcomes and that requires greater attention in preclinical models. The cytokine and inflammatory responses of BALB/c and C57Bl/6 mice to many challenges, including MCMV, differ. Our current findings using Ly49H congenic strains illustrate that in the context of MCMV infection, differences cannot be attributed solely to engagement of this activating NK cell receptor. It is worth noting that considerable differences between mouse strains across approximately one third of the genome have been reported49 which will likely influence several physiological processes, including the response to viral infections. The role of genetic differences is a key consideration and mirrors outcomes in humans, where the responses to and the outcome of viral infections can vary extensively. The examination of immune responses in multiple mouse strains should therefore be more widely considered as it will likely provide important insights into the physiological relevance and translatability of mouse models.
Although NKRM share characteristics of TRM, they function to prevent tissue damage and, in this respect, share similarities with regulatory T cells. Like T regulatory type 1 (Tr1) cells, NKRM express CD49b, CD226, ICOS and CCR550. Regulatory T cells play a critical role in limiting immune responses, maintaining immune homeostasis, and thereby preventing tissue damage, including autoimmunity. They can reside in non-lymphoid tissues as memory-like Treg cells, however in the absence of ongoing antigen presence they appear to have limited persistence51. The NKRM population described here persists long-term in the absence of viral antigen, and it is therefore possible that in a non-lymphoid tissue they serve the principal immunoregulatory functions, as they may be best poised to moderate local inflammation without compromising pathogen control.
Our current study focused on the SG where we demonstrated that NKRM cells play a critical role in limiting autoimmunity by eliminating CD4+ T cells in a TRAIL-mediated manner thereby preventing a pathology consistent with Sjogren’s Syndrome, one of the most common human autoimmune diseases19. We also showed that NKRM cells established in the lungs after CMV infection, a finding of particular interest given the detrimental role that local inflammation plays in the context of CMV in lung transplantation52,53.
Whether NKRM are induced in response to other viral infections remains to be determined. Our data demonstrating that inflammation is a driver of NKRM formation suggest that this regulatory population may be induced in response to other infections, especially in tissues where infection leads to inflammation that puts the health of the tissue at risk. Examining NKRM in other physiological and clinical settings is therefore warranted. Our study identified TRAIL-dependent killing as a key mechanism in the elimination of CD4+ T cells in the SG. It is possible that NKRM cells regulate immune responses via additional mechanisms. In particular, the possibility that NKRM regulate immune responses in some tissues via the production of cytokines, such as IL-10, should be considered given previous reports that NK cells can secrete this anti-inflammatory cytokine in response to various challenges including MCMV infection54,55.
Herpesviruses, like CMV and EBV, have been suggested to cause low-grade ongoing inflammation the consequences of which have remained largely unclear2. Recent findings on the role of EBV in the etiology of Multiple Sclerosis56,57 have highlighted the importance of considering the impact of viral infection in autoimmunity. Here, we have shown that NKRM, a population of long-lived NK cells, establishes after CMV infection to modulate pathogenic processes that, if left unchecked, lead to autoreactivity that manifests as a Sjogren’s Syndrome like disease.
While inflammation is an essential component of protective immunity, a return to homeostasis is key for tissue health. Mechanisms that return the immune system to an equilibrium exist for both innate and adaptive immunity. Here we have shown that in response to CMV infection, circulating NK cells form a population of long-lived resident cells in non-lymphoid tissue to ensure a return to immune equilibrium and preservation of optimal tissue function.
Limitations of the study
In this study we characterized NKRM and their function after MCMV infection and focused on their characterization in the salivary gland. Further studies examining whether NKMR are found in other viral infections, autoimmune and/or inflammatory diseases are required to better understand the broader relevance of NKRM. Although the murine pathology described here has the cardinal features of Sjogren’s Syndrome, we did not have the opportunity to investigate NKRM in human samples. Finally, the molecular pathways required for NKRM formation and additional functions of NKRM remain to be defined.
STAR * Methods
RESOURCE AVAILABILITY
Lead Contact
Further information and requests should be directed to the lead contact, Mariapia A. Degli-Esposti
Material Availability
This study did not generate new unique reagents.
Data and code availability
All data are in the main text and supplementary material. Bulk RNA sequencing data are available at Gene Expression Omnibus (GEO) under accession number GSE219243 and the single cell RNA sequencing data are available under accession number GSE222613.
EXPERIMENTAL MODEL AND SUBJECT DETAILS
Mice
BALB/c (CD45.2) and C57BL6/J mice were purchased from the Animal Resources Centre (Perth, Western Australia). BALB.B6-CT6 (NK1.1+), BALB.Ly49H+ (CT8 or Cmv1r, NK1.1+ Ly49H+)58, BALB/c.Tnfsf10−/− (TRAIL-deficient) and BALB/c.CD45.1 mice were bred at the Perkins Bioresources Facility (Perth, Western Australia). BALB/c.Cx3cr1gfp/gfp were bred at the Monash Animal Research Platform (Clayton, Victoria). BALB/c.GREAT mice59 (Ifng-YFP reporters) were obtained from the Animal Services Facility of the QIMR Berghofer (Brisbane, Australia). C57BL/6 (CD45.2), C57BL/6.CD45.1, C57Bl/6.EomesGFP transgenic60, C57BL6.Tbx21−/−, C57BL6.Ncr1Cre x Eomesfl/fl mice were bred at Memorial Sloan Kettering Cancer Center. All animal experimentation was performed with the approval of the local Animal Ethics and Experimentation Committees and performed in accordance with national guidelines.
METHOD DETAILS
Surgery
Parabiosis experiments were performed as previously described61. Briefly, 6 – 8-week-old female congenic CD45.2 and CD45.1 mice were surgically connected in parabiosis. After lateral skin incisions were made from the elbow to knee in each mouse, forelimbs and hind limbs were tied together using nylon suture, and the skin incisions were closed using stainless steel wound clips. After surgery, mice were maintained on a diet supplemented with trimethoprim/sulfamethoxazole for prophylaxis against infection. The % donor derived cells localised to the tissues was calculated as follows: number of donor derived cells for each of the indicated cell populations/total number of the indicated cell population in the tissue x100.
Viral Infections
Mice were infected with MCMV-K181Perth (WT MCMV) or K181delm157 (MCMVΔm157) by intraperitoneal (i.p.) injection of 5 × 10³ plaque-forming units (PFU) of SG-propagated virus, except for viral control analyses where mice were infected with 1×10⁴ PFU. Female mice (8 – 14 weeks old) were used for all experiments and were randomly allocated into treatment groups.
In Vivo Treatments
NK cells were depleted by i.p. injection of 200 μg /mouse of anti-NK1.1 mAb (clone PK136, made in house) on days 9, 13, 17, and 22 PI. Blocking of CXCR3 was achieved by i.p. injection of 200 μg each of anti-CXCR3 (clone CXCR3–173, BioXCell) and anti-CXCL9 (clone MIG-2F5.5, BioXCell) per mouse i.p. on days 9, 13 and 17 PI62,63.
Isolation of Leukocytes
Mice were humanly euthanised by CO2 asphyxiation and tissues excised for preparation of leukocytes. Where indicated, 2.5 μg of pan-CD45 specific antibody were administered intravenously via the retro-orbital sinus 3 minutes prior to euthanasia to allow for the fluorescent labelling of intravasculature leukocytes. Salivary glands were minced and digested in 1 mL digestion solution (1 mg/mL Collagenase IV (Thermo Fisher) and 10 μg/mL of DNaseI (Merck) in PBS) for 30 min at 37 °C while shaking. Tissues were then processed through metal sieves and filtered through 40 μm strainers. Spleens were dissociated by processing through metal sieves. Red blood cells in salivary gland and spleen were removed using ACK lysis buffer.
Flow Cytometry
Cell surface staining of single-cell suspensions was performed using fluorescently conjugated antibodies. Intracellular staining was performed following fixing and permeabilization with the eBioscience FoxP3/ Transcription Factor Staining Buffer Set (ThermoFisher). Dead cells were excluded using propidium iodide, 4’, 6-diamidino-2-phenylindole hydrate (DAPI), FVS 620 (BD Biosciences) or FVS 440UV (BD Biosciences). Cells were acquired on a LSRFortessa X20 or FACSymphony A3 cell analyser running FACSDiva (BD Biosciences). Data analysis was performed with FlowJo software (BD Biosciences) including Uniform Manifold Approximation and Projection (UMAP) for dimensional reduction and FlowSOM unsupervised clustering64 analyses for which the standard FlowJo plugin settings were applied. Clustering parameters were KLRG1, CD49a, CD11b, IRF8, GzmB, Ly6C, CXCR6, CD127, DNAM-1, CD69 and CD62L.
Adoptive Transfer
Splenocytes were isolated from naïve BALB/c.CD45.2 or BALB/c.Cx3cr1−/− mice and enriched for T and NK cells using a nylon wool column (LEUKO-PAK Leukocyte Filter; Fenwal)65. NKp46+ cells were then isolated using a mouse NK cell enrichment kit (StemCell Technologies) as per the manufacturer’s instructions. Cell purity was assessed by flow cytometry. 3 – 3.5 × 10⁶ of the enriched cells were transferred intravenously via the retro-orbital sinus into BALB/c.CD45.1 or BALB/c.Tnfsf10−/− mice infected with 5 × 10³ PFU of MCMV 4 days prior.
Generation of Chimeras
Chimeric mice were generated as described previously66.
CD4+ T cell Killing Assay
SG NKRM cells (NKp46+ CD49b+ CD49a+ Ly6C+), non-NKRM cells (NKp46+ CD49b+ Ly6C−) and CD4+ T cells were sorted from WT BALB/c or BALB/c.Tnfsf10−/− salivary glands at day 20 PI. NK cells or NKRM were co-cultured with CD4+ T cells at the indicated ratios for 20 hrs and viable cells enumerated by trypan blue exclusion. The proportion of CD4+ T cells remaining in cultures was determined by flow cytometry analysis. % lysis was calculated by subtracting background death (i.e. CD4+ T cells cultured in the absence of NK cells) from the death in test cultures.
Bulk RNA Sequencing
C57BL/6.EomesGFP mice were euthanized via CO2 asphyxiation and salivary gland excised, finely minced with surgical scissors and digested in RPMI, 2 % FBS and collagenase D (Roche) at 37 °C for 45 min, shaking gently. Red blood cells lysed was performed with ACK lysis buffer and lymphocytes purified by resuspension in 40 % Percoll and centrifuging at 400 × g for 12 min at RT. Cells were then stained with a cocktail containing fluorescently labelled antibodies specific for CD45, CD3, CD19, NK1.1, CD49b and CD200R before sorting live CD45+TCRb−CD3−CD19−NK1.1+ cells into NK cells (CD49b+Eomes+), sgNK cells (CD49b−Eomes−) and ILC1 (CD49b−Eomes−) subsets using a BD FACSAria III. RNA was isolated from sorted cells using TRIzol (Invitrogen) followed by SMARTer amplification and Illumina next-generation sequencing. Paired-end reads were mapped and counted at the gene level with HISAT2 (v. 2.0.5) and Rsubread (v. 1.30.9), using the same gene annotation and arguments as described previously9. DESeq2 (v. 1.14.1)67 was used to perform differential expression analysis. To define SG ILC subset signatures, contrasts were performed for each SG cell type versus the average of the other two subtypes by including the argument “listValues = c(1, −1/2)” in the results() function. DE genes were defined as padj < 0.05, |log2FC| > 1, and baseMean > 50, and categorized by the direction of their fold change. Counts used for heatmap visualization and principal component analysis (PCA) were log2 transformed using the DESeq2 rlog() function. Heatmap values were corrected for experimental batches. PCA was performed on genes of the NK vs. ILC1 signature defined previously9. Counts from the current study were merged with counts from this previous study9.
Single cell RNA Sequencing
BALB/c mice were infected with 5 × 10³ PFU of MCMV-K181 i.p. and salivary glands collected on day 120 PI. Leukocytes were isolated and live CD45+TCRb−CD3−CD19−NKp46+CD49b+CD200R− cells. scRNAseq data was generated with a 10X Genomics Chromium using the Single Cell 3’ v3 chemistry and sequenced on a MGI (MGI-SEQ2000RS) producing 360 million reads. The raw sequence data was processed by the Cell Ranger pipeline (v5.0.1) against Mouse reference, mm10 (GENCODE vM23/Ensembl 98) resulting in 6,650 estimated cells with 54,108 reads per cell. The expression matrix was then analysed by Seurat (v4.0.1)68 using standard parameters to normalize and scale expression, and nearest-neighbour graph built using the top ten principal components, and clustering calculated at a resolution of 0.5. Clustering and cell-cycle scoring identified a group of cells as outliers by expression which were removed leaving 5,917 cells for further analysis. UMAP projection (Fig 2c) was calculated and differentially expressed genes were found per cluster using the standard Seurat workflow.
Immunofluorescence
Mice were euthanized, salivary glands excised, embedded in Tissue-Tek® O.C.T. Compound, frozen on isopentane over dry ice and stored at −80 °C. Cryostat sections (5 μm thick) were fixed in 4 % paraformaldehyde, quenched in 50 mM ammonium chloride and blocked in PBS containing 10% normal goat serum to prevent non-specific binding. Cryosections were washed in PBS and stained overnight with antibodies Alexa-Fluor-488-conjugated rat anti-mouse CD4 (RM4–5; Biolegend) and Alexa-Fluor-647-conjugated rat anti-mouse B220 (RA3–6B2; Becton Dickinson). Cell nuclei were subsequently stained with DAPI. Glass coverslips were mounted with Fluoromount™ Aqueous Mounting Medium (Sigma). Confocal images were acquired using the Leica SP5 inverted confocal microscope at 2048 × 2048 pixels with an 8-bit sensitivity and analysed in Fiji (ImageJ). The ectopic lymphoid structure (ELS) score was determined by average the ELS score for each sample, where large ELS (>50 cells) were weighted as 3, medium size ELS (20 − 50 cells) as 2 and small ELS (<20 cells) as 1.
Histology
Salivary glands were excised, fixed, cut and stained with hematoxylin and eosin were analysed with a light microscope (Olympus) and images collected at magnifications indicated. The lymphocytic aggregate score was determined by average the score for each sample, where large aggregates (>50 cells) were weighted as 3, medium size aggregates (20 − 50 cells) as 2 and small aggregates (<20 cells) as 1.
Autoantibody ELISA
Autoantibodies were detected as described previously 19. Briefly, 96-well EIA/RIA plates (Costar) were coated with a salivary gland homogenate and washed. Serum samples (1:25 dilution) were then added and incubated for 1 hr at room temperature. Plates were washed followed by the addition of anti-mouse IgG peroxidase conjugated antibody (Thermo Scientific). Tetramethylbenzidine substrate (Sigma) was added, and plates incubated in the dark for 5–20 minutes at room temperature before terminating the reaction with 1 M sulphuric acid. Plates were read on an Epoch plate reader (BioTek) by reading the absorbance at 450 nm.
Measurement of Saliva Production
Mice were injected with pilocarpine (50 mg/100 g body weight) and rested for 5 min and saliva then collected using a sterile cotton swab for a period of 5 minutes. The swab was weighed before and after saliva collection and the amount of saliva produced expressed as mg of saliva per g of body weight.
Quantification of Viral Loads
MCMV viral titres were determined as described19. Briefly, tissues were homogenized in Minimum Essential Medium (MEM) (Gibco) supplemented with 2 % newborn calf serum (NCS) (Gibco). Homogenates were centrifuged at 1,800 × g for 15 min at 4 °C, and the supernatant collected and stored at −80 °C. Serial dilutions of viral supernatants were prepared in MEM+2% NCS and transferred to an M210B4 cell monolayer in 24-well tissue culture trays. After 1 hr at 37 °C the supernatant was removed and cells overlayed with 1 ml of 0.01 % carboxy-methylcellulose (Sigma-Aldrich) diluted 1:2 in MEM+2 % NCS. Trays were incubated at 37 °C/5 % CO2 for 4 days, fixed, and stained with 0.5 % methylene blue in 10 % formaldehyde for 1 day at RT. Plaques in the M210B4 monolayer were counted and numbers of plaques per organ calculated.
QUANTIFICATION AND STATISTICAL ANALYSIS
Statistical Analysis
All data were analyzed and graphed as mean ± SEM using Prism (GraphPad Software). Statistical significance was determined by the nonparametric Mann-Whitney test when comparing two groups. An ANOVA with multiple comparison test or Kruskal-Wallis rank test was used when more than two groups were compared. A ROUT test was used to identify outliers.
Supplementary Material
KEY RESOURCES TABLE
| REAGENT or RESOURCE | SOURCE | IDENTIFIER |
|---|---|---|
| Antibodies | ||
| PerCP-Cy™5.5 Hamster Anti-Mouse CD3e | BD Biosciences | Cat# 551163; RRID:AB_394082 |
| BUV661 Rat Anti-Mouse CD4 | BD Biosciences | Cat# 612974; RRID:AB_2870246 |
| BV711 Rat Anti-Mouse CD4 | BD Biosciences | Cat# 563726; RRID:AB_2738389 |
| BUV737 Rat Anti-Mouse CD8a | BD Biosciences | Cat# 612759; RRID:AB_2870090 |
| BV650 Rat Anti-Mouse CD8a | BD Biosciences | Cat# 563234; RRID:AB_2738084 |
| BV510 Rat Anti-CD11b | BD Biosciences | Cat# 562950; RRID:AB_2737913 |
| PerCP-Cy™5.5 Rat Anti-CD11b | BD Biosciences | Cat# 550993; RRID:AB_394002 |
| Alexa Fluor® 700 Rat anti-CD11b | BD Biosciences | Cat# 557960; RRID:AB_396960 |
| APC Hamster Anti-Mouse CD11c | BD Biosciences | Cat# 550261; RRID:AB_398460 |
| FITC Rat Anti-Mouse CD19 | BD Biosciences | Cat# 553785, RRID:AB_395049 |
| PerCP-Cy™5.5 Rat Anti-Mouse CD19 | BD Biosciences | Cat# 551001, RRID:AB_394004 |
| PE-Cy™7 Rat Anti-Mouse CD45 | BD Biosciences | Cat# 552848; RRID:AB_394489 |
| APC-Cy™7 Rat Anti-Mouse CD45 | BD Biosciences | Cat# 561037; RRID:AB_10563075 |
| BV650 Mouse Anti-Mouse CD45.1 | BD Biosciences | Cat# 563754; RRID:AB_2738405 |
| APC-Cy™7 Mouse Anti-Mouse CD45.2 | BD Biosciences | Cat# 560694; RRID:AB_1727492 |
| BUV737 Hamster Anti-Rat/Mouse CD49a | BD Biosciences | Cat# 741776; RRID:AB_2871130 |
| BV711 Hamster Anti-Rat/Mouse CD49a | BD Biosciences | Cat# 564863; RRID:AB_2738987 |
| BUV563 Hamster Anti-Mouse CD49b | BD Biosciences | Cat# 741280; RRID:AB_2870819 |
| PE/Dazzle™ 594 anti-mouse CD49b | BioLegend | Cat# 108923; RRID:AB_2565270 |
| Biotin Rat Anti-Mouse CD49b | BD Biosciences | Cat# 553856, RRID:AB_395092 |
| BV605 Rat Anti-Mouse CD62L | BD Biosciences | Cat# 563252, RRID:AB_2738098 |
| BV750 Rat Anti-Mouse CD62L | BD Biosciences | Cat# 624380 |
| BV605 Hamster Anti-Mouse CD69 | BD Biosciences | Cat# 563290; RRID:AB_2738120 |
| PE/Cyanine5 anti-mouse CD69 Antibody | BioLegend | Cat# 104510; RRID:AB_313113 |
| BV750 Rat Anti-Mouse CD103 | BD Biosciences | Cat# 747478; RRID:AB_2872154 |
| BV786 Rat Anti-Mouse CD127 | BD Biosciences | Cat# 563748; RRID:AB_2738403 |
| Alexa Fluor® 647 anti-mouse CD127 (IL-7Rα) | BioLegend | Cat# 135020; RRID:AB_1937209 |
| PE anti-mouse CD200R (OX2R) | BioLegend | Cat# 123908; RRID:AB_2074080 |
| CD200 Receptor Monoclonal Antibody (OX110), APC | Thermo Fisher Scientific | Cat# 17–5201-82; RRID:AB_10717289 |
| PE/Dazzle™ 594 anti-mouse CD226 (DNAM-1) | BioLegend | Cat# 128817; RRID:AB_2632822 |
| Brilliant Violet 711™ anti-mouse CD186 (CXCR6) | BioLegend | Cat# 151111; RRID:AB_2721558 |
| PE/Dazzle™ 594 anti-mouse CD186 (CXCR6) | BioLegend | Cat# 151117; RRID:AB_2721700 |
| EOMES Monoclonal Antibody (Dan11mag), PE-Cyanine7 | Thermo Fisher Scientific | Cat# 25–4875-80; RRID:AB_2573453 |
| EOMES Monoclonal Antibody (Dan11mag), PerCP-eFluor 710 | Thermo Fisher Scientific | Cat# 46–4875-82; RRID:AB_10597455 |
| Brilliant Violet 711™ anti-mouse F4/80 | BioLegend | Cat# 123112; RRID:AB_893482 |
| IRF8 Monoclonal Antibody (V3GYWCH), APC | Thermo Fisher Scientific | Cat# 17985282; RRID:AB_2573318 |
| Alexa Fluor® 700 Mouse anti-Human Granzyme B | BD Biosciences | Cat# 560213; RRID:AB_1645453 |
| BV650 Rat Anti-Mouse I-A/I-E | BD Biosciences | Cat# 563415; RRID:AB_2738192 |
| BUV395 Hamster Anti-Mouse KLRG1 | BD Biosciences | Cat# 740279; RRID:AB_2740018 |
| APC Hamster Anti-Mouse KLRG1 | BD Biosciences | Cat# 561620; RRID:AB_10895798 |
| BUV661 Rat Anti-Mouse Ly-6A/E | BD Biosciences | Cat# 741466; RRID:AB_2870934 |
| Brilliant Violet 570™ anti-mouse Ly-6C | BioLegend | Cat# 128030; RRID:AB_2562617 |
| Alexa Fluor® 700 Rat Anti-Mouse Ly-6C | BD Biosciences | Cat# 561237; RRID:AB_10612017 |
| BV605 Rat Anti-Mouse LY-6G | BD Biosciences | Cat# 563005; RRID:AB_2737946 |
| BV480 Mouse anti-Mouse Ly-49H | BD Biosciences | Cat# 746493; RRID:AB_2743793 |
| BV421 Mouse Anti-Mouse NK-1.1 | BD Biosciences | Cat# 562921; RRID:AB_2728688 |
| PE-Cy™7 Mouse Anti-Mouse NK-1.1 | BD Biosciences | Cat# 552878; RRID:AB_394507 |
| BV421 Rat Anti-Mouse CD335 | BD Biosciences | Cat# 562850; RRID:AB_2737837 |
| PE/Cyanine7 anti-mouse CD335 (NKp46) Antibody | BioLegend | Cat# 137618; RRID:AB_11219186 |
| BV786 Streptavidin | BD Biosciences | Cat# 563858; RRID:AB_2869529 |
| BV510 Hamster Anti-Mouse TCR β Chain | BD Biosciences | Cat# 563221; RRID:AB_2738078 |
| PerCP-Cy™5.5 Hamster Anti-Mouse TCR β Chain | BD Biosciences | Cat# 560657; RRID:AB_1727575 |
| FITC Hamster Anti-Mouse TCR β Chain | BD Biosciences | Cat# 553170; RRID:AB_394682 |
| PE anti-mouse CD253 (TRAIL) | BioLegend | Cat# 109305; RRID:AB_2303575 |
| InVivoMAb anti-mouse CXCR3 (CD183) | BioXCell | Cat# BE0249, RRID:AB_2687730 |
| InVivoMAb anti-mouse CXCL9 (MIG) | BioXCell | Cat# BE0309; RRID:AB_2736989 |
| NK1.1+ depletion antibody | In house | Clone PK136 (PubMed ID: 6500587) |
| Alexa Fluor® 488 Rat Anti-Mouse CD4 | BD Biosciences | Cat# 557667; RRID:AB_396779 |
| Alexa Fluor® 647 anti-mouse/human CD45R/B220 | BioLegend | Cat# 103226; RRID:AB_389330 |
| Goat anti-Mouse IgG Fc Secondary Antibody, HRP | Thermo Fisher Scientific | Cat# A16084; RRID:AB_2534758 |
| Bacterial and virus strains | ||
| MCMV-K181Perth | MA Degli-Esposti | N/A |
| MCMV-K181Perth-delm157 | MA Degli-Esposti | N/A |
| Chemicals, peptides, and recombinant proteins | ||
| Collagenase type IV | Thermo Fisher Scientific | Cat# 17104019 |
| DNase I recombinant, RNase-free | Merck | Cat# 4536282001 |
| Brilliant Staining Buffer | BD Biosciences | Cat# 563794 |
| eBioscience FoxP3/ Transcription Factor Staining Buffer Set | Thermo Fisher Scientific | Cat# 00–5523-00 |
| Fixable Viability Stain 440UV | BD Biosciences | Cat# 566332 |
| Fixable Viability Stain 620 | BD Biosciences | Cat# 564996 |
| Fetal Bovine Serum | Thermo Fisher Scientific | Cat# 10499–044 |
| 4’, 6-diamidino-2-phenylindole hydrate | Merck | Cat# D8417–5MG |
| Percoll | Merck | Cat# GEHE17–0891-01 |
| propidium iodide | Merck | Cat# 81845 |
| EasySep™ Mouse NK Cell Isolation Kit | STEMCELL Technologies | CAT# 19855 |
| LEUKO-PAK Leukocyte Filter; Fenwal | Fenwal Laboratories | Code# 4C2401 |
| TRIzol REagent | Thermo Fisher Scientific | Cat# 15596018 |
| Fluoromount™ Aqueous Mounting Medium | Merck | Cat# F4680 |
| 3,3′,5,5′-Tetramethylbenzidine (TMB) Liquid Substrate System | Merck | Cat# T8665 |
| Pilocarpine hydrochloride | Merck | Cat# P6503–5G |
| Newborn Calf Serum | Thermo Fisher Scientific | Cat# 16010159 |
| carboxy-methylcellulose | Merck | Cat# C5013 |
| PureLink RNA Mini Kit | Thermo Fisher Scientific | Cat# 12183018A |
| Sso Advanced Universal SYBR® Green Supermix | Bio-Rad | Cat# 1725271 |
| RNAlater | Merck | Cat# R0901 |
| Trypan Blue Solution | Merck | Cat# T8154–100mL |
| CELL LINES | ||
| M210B4 cells | ATCC | Cat# CRL-1972 |
| Critical commercial assays | ||
| SMART-Seq v4 Ultra Low Input RNA Kit | TaKaRa | Cat#634892 |
| KAPA Hyper Prep Kit | Roche Sequencing Solutions | KAPA Hyper Prep Kit |
| HiSeq 3000/4000 SBS Kit | Illumina | Cat# FC-410–1001 |
| 10X Genomics Chromium Single Cell 3’ V3.1 | 10x Genomics | N/A |
| MGIEasy RNA Library Prep Set | MGI | Cat#1000006383 |
| MGITech MGISEQ2000RS platform | MGI | N/A |
| Deposited data | ||
| RNA-seq on steady-state tissue group 1 innate lymphocytes | This study | Gene Expression Omnibus: GSE219243 |
| Single cell RNA-seq on salivary gland NK cells | This study | Gene Expression Omnibus: GSE222613 |
| Experimental models: Mice | ||
| BALB/c | Animal Resource Centre, Perth Western Australia | N/A |
| C57BL/6 | Animal Resource Centre, Perth Western Australia | N/A |
| BALB.B6-CT6 | Laboratory of M.A. Degli-Esposti | N/A |
| BALB.B6-CT8 | Laboratory of M.A. Degli-Esposti | N/A |
| BALB.B6-Cmv1r | Laboratory of M.A. Degli-Esposti | N/A |
| BALB.CD45.1 | Laboratory of M.A. Degli-Esposti | N/A |
| BALB/c.Tnfsf10−/− | Laboratory of M.A. Degli-Esposti | N/A |
| BALB/c.Cx3cr1−/− | Laboratory of M.A. Degli-Esposti | N/A |
| C57BL/6.CD45.1 | Laboratory of J.C. Sun | N/A |
| C57BL6.Tbx21−/− | Laboratory of J.C. Sun | N/A |
| C57Bl/6.EomesGFP | Laboratory of J.C. Sun | N/A |
| C57BL6.Ncr1Cre x Eomesfl/fl | Laboratory of J.C. Sun | N/A |
| BALB/c.Ifng.YFP | Gifted by Geoff Hill QIMR, Brisbane | N/A |
| Oligonucleotides | ||
| qRT-PCR primers | ||
| Cx3cr1 F- GAGTATGACGATTCTGCTGAGG R- CAGACCGAACGTGAAGACGAG |
Integrated DNA Technologies | NA |
| Cxcl9 F- ACTTCTGAGGCTCACGTCAC R- AGGTTCTGAAGGCCAACTCT |
Integrated DNA Technologies | N/A |
| Cxcl10 F- CAAAAGTAACTGCCGAAGCA R- CTGAGCTAGGGAGGACAAGG |
Integrated DNA Technologies | N/A |
| L32 F- CATCGGTTATGGGAGCAAC R- GCACACAAGCCATCTACTCAT |
Integrated DNA Technologies | N/A |
| Software and algorithms | ||
| FlowJo v10 | BD Biosciences | N/A |
| GraphPad Prism v9 | GraphPad Software | N/A |
| Fiji (Image J) | NIH | N/A |
| Illustrator | Adobe | N/A |
| HISAT2 (v. 2.0.5) | Kim Laboratory, Bioinformatics Department, University of Texas Southwestern | http://daehwankimlab.github.io/hisat2/ |
| Rsubread (v. 1.30.9), | Bioconductor | https://bioconductor.org/packages/release/bioc/html/Rsubread.html |
| DESeq2 (v. 1.14.1) | Bioconductor | https://bioconductor.org/packages/release/bioc/html/DESeq2.html |
| ComplexHeatmap (v. 1.99.7) | Bioconductor | https://www.bioconductor.org/packages/release/bioc/html/ComplexHeatmap.html |
| R Project | https://www.r-project.org/ | 4.0.2 |
| Seurat | CRAN | 4.0.1 |
Highlights.
NK cells are recruited and retained in non-lymphoid tissues after CMV infection
NK cells form a long-lived tissue resident memory-like population: NKRM cells
NKRM regulation of CD4+ T cell responses in the SG requires TRAIL
NKRM cells prevent immune-mediated damage and safeguard optimal tissue function
ACKNOWLEDGMENTS:
We thank Nicole La Gruta and Jamie Rossjohn for insightful discussions and critical reading of the manuscript, Ian Rankin for assistance with graphical design. We thank Simone Ross and the Bioresources Animal Research Staff (Perth, Western Australia) and the following Monash University Platforms for technical support: FlowCore, Monash Animal Research Platform, Monash Bioinformatics Platform, Micromon, Monash Histology Platform, Monash Micro Imaging. We acknowledge the use of the Integrated Genomics Operation Core, funded by the NCI Cancer Center Support Grant (CCSG, P30CA08748), Cycle for Survival, and the Marie-Josée and Henry R. Kravis Center for Molecular Oncology. This work was supported by: National Health and Medical Research Council of Australia (NHMRC) Grants (1125357; 2004397) (MAD-E and CEA) and an NHMRC Principal Research Fellowship (1119298) (MAD-E); Raine Medical Research Foundation Healy Research Collaboration Award (ISS); National Institutes of Health Grants (AI100874, AI130043), the Ludwig Center for Cancer Immunotherapy, the American Cancer Society, and the Burroughs Wellcome Fund (JCS); Cancer Research Institute, Carson Family Fellowship (CML).
Footnotes
INCLUSION AND DIVERSITY: We support inclusive, diverse, and equitable conduct of research.
DECLARATION OF INTERESTS: The authors declare no competing interests.
Publisher's Disclaimer: This is a PDF file of an unedited manuscript that has been accepted for publication. As a service to our customers we are providing this early version of the manuscript. The manuscript will undergo copyediting, typesetting, and review of the resulting proof before it is published in its final form. Please note that during the production process errors may be discovered which could affect the content, and all legal disclaimers that apply to the journal pertain.
REFERENCES
- 1.Chen LYC, and Quach TTT (2021). COVID-19 cytokine storm syndrome: a threshold concept. Lancet Microbe 2, e49–e50. 10.1016/S2666-5247(20)30223-8. [DOI] [PMC free article] [PubMed] [Google Scholar]
- 2.Furman D, Campisi J, Verdin E, Carrera-Bastos P, Targ S, Franceschi C, Ferrucci L, Gilroy DW, Fasano A, Miller GW, et al. (2019). Chronic inflammation in the etiology of disease across the life span. Nat Med 25, 1822–1832. 10.1038/s41591-019-0675-0. [DOI] [PMC free article] [PubMed] [Google Scholar]
- 3.Mujal AM, Delconte RB, and Sun JC (2021). Natural Killer Cells: From Innate to Adaptive Features. Annu Rev Immunol 39, 417–447. 10.1146/annurev-immunol-101819-074948. [DOI] [PubMed] [Google Scholar]
- 4.McFarland AP, and Colonna M. (2020). Sense and immuno-sensibility: innate lymphoid cell niches and circuits. Curr Opin Immunol 62, 9–14. 10.1016/j.coi.2019.11.003. [DOI] [PMC free article] [PubMed] [Google Scholar]
- 5.Vivier E, Artis D, Colonna M, Diefenbach A, Di Santo JP, Eberl G, Koyasu S, Locksley RM, McKenzie ANJ, Mebius RE, et al. (2018). Innate Lymphoid Cells: 10 Years On. Cell 174, 1054–1066. 10.1016/j.cell.2018.07.017. [DOI] [PubMed] [Google Scholar]
- 6.Kok L., Masopust D., and Schumacher TN. (2021). The precursors of CD8(+) tissue resident memory T cells: from lymphoid organs to infected tissues. Nat Rev Immunol. 10.1038/s41577-021-00590-3. [DOI] [PMC free article] [PubMed] [Google Scholar]
- 7.Paik DH, and Farber DL (2021). Anti-viral protective capacity of tissue resident memory T cells. Curr Opin Virol 46, 20–26. 10.1016/j.coviro.2020.09.006. [DOI] [PMC free article] [PubMed] [Google Scholar]
- 8.Andrews DM, Estcourt MJ, Andoniou CE, Wikstrom ME, Khong A, Voigt V, Fleming P, Tabarias H, Hill GR, van der Most RG, et al. (2010). Innate immunity defines the capacity of antiviral T cells to limit persistent infection. J Exp Med 207, 1333–1343. 10.1084/jem.20091193. [DOI] [PMC free article] [PubMed] [Google Scholar]
- 9.Weizman OE, Adams NM, Schuster IS, Krishna C, Pritykin Y, Lau C, Degli-Esposti MA, Leslie CS, Sun JC, and O’Sullivan TE (2017). ILC1 Confer Early Host Protection at Initial Sites of Viral Infection. Cell 171, 795–808 e712. 10.1016/j.cell.2017.09.052. [DOI] [PMC free article] [PubMed] [Google Scholar]
- 10.McFarland AP, Yalin A, Wang SY, Cortez VS, Landsberger T, Sudan R, Peng V, Miller HL, Ricci B, David E, et al. (2021). Multi-tissue single-cell analysis deconstructs the complex programs of mouse natural killer and type 1 innate lymphoid cells in tissues and circulation. Immunity 54, 1320–1337 e1324. 10.1016/j.immuni.2021.03.024. [DOI] [PMC free article] [PubMed] [Google Scholar]
- 11.Erick TK, Anderson CK, Reilly EC, Wands JR, and Brossay L. (2016). NFIL3 Expression Distinguishes Tissue-Resident NK Cells and Conventional NK-like Cells in the Mouse Submandibular Glands. J Immunol 197, 2485–2491. 10.4049/jimmunol.1601099. [DOI] [PMC free article] [PubMed] [Google Scholar]
- 12.Cortez VS, Fuchs A, Cella M, Gilfillan S, and Colonna M. (2014). Cutting edge: Salivary gland NK cells develop independently of Nfil3 in steady-state. J Immunol 192, 4487–4491. 10.4049/jimmunol.1303469. [DOI] [PubMed] [Google Scholar]
- 13.Yomogida K, Bigley TM, Trsan T, Gilfillan S, Cella M, Yokoyama WM, Egawa T, and Colonna M. (2021). Hobit confers tissue-dependent programs to type 1 innate lymphoid cells. Proc Natl Acad Sci U S A 118. 10.1073/pnas.2117965118. [DOI] [PMC free article] [PubMed] [Google Scholar]
- 14.Bromley SK, Akbaba H, Mani V, Mora-Buch R, Chasse AY, Sama A, and Luster AD (2020). CD49a Regulates Cutaneous Resident Memory CD8(+) T Cell Persistence and Response. Cell Rep 32, 108085. 10.1016/j.celrep.2020.108085. [DOI] [PMC free article] [PubMed] [Google Scholar]
- 15.Martins JP, Andoniou CE, Fleming P, Kuns RD, Schuster IS, Voigt V, Daly S, Varelias A, Tey SK, Degli-Esposti MA, and Hill GR (2019). Strain-specific antibody therapy prevents cytomegalovirus reactivation after transplantation. Science 363, 288–293. 10.1126/science.aat0066. [DOI] [PubMed] [Google Scholar]
- 16.Nabekura T, and Lanier LL (2016). Tracking the fate of antigen-specific versus cytokine-activated natural killer cells after cytomegalovirus infection. J Exp Med 213, 2745–2758. 10.1084/jem.20160726. [DOI] [PMC free article] [PubMed] [Google Scholar]
- 17.Degli-Esposti MA, and Smyth MJ (2005). Close encounters of different kinds: dendritic cells and NK cells take centre stage. Nat Rev Immunol 5, 112–124. 10.1038/nri1549. [DOI] [PubMed] [Google Scholar]
- 18.van Dommele SL., Sumari N., Schreibe RD., Scalz AA., Smyt MJ., and Degli-Espost MA. (2006). Perforin and granzymes have distinct roles in defensive immunity and immunopathology. Immunity 25, 835–848. 10.1016/j.immuni.2006.09.010. [DOI] [PubMed] [Google Scholar]
- 19.Schuster IS, Wikstrom ME, Brizard G, Coudert JD, Estcourt MJ, Manzur M, O’Reilly LA, Smyth MJ, Trapani JA, Hill GR, et al. (2014). TRAIL+ NK cells control CD4+ T cell responses during chronic viral infection to limit autoimmunity. Immunity 41, 646–656. 10.1016/j.immuni.2014.09.013. [DOI] [PubMed] [Google Scholar]
- 20.Quatrini L, Wieduwild E, Escaliere B, Filtjens J, Chasson L, Laprie C, Vivier E, and Ugolini S. (2018). Endogenous glucocorticoids control host resistance to viral infection through the tissue-specific regulation of PD-1 expression on NK cells. Nat Immunol 19, 954–962. 10.1038/s41590-018-0185-0. [DOI] [PMC free article] [PubMed] [Google Scholar]
- 21.Kim S, Iizuka K, Kang HS, Dokun A, French AR, Greco S, and Yokoyama WM (2002). In vivo developmental stages in murine natural killer cell maturation. Nat Immunol 3, 523–528. 10.1038/ni796. [DOI] [PubMed] [Google Scholar]
- 22.Cerwenka A, and Lanier LL (2016). Natural killer cell memory in infection, inflammation and cancer. Nat Rev Immunol 16, 112–123. 10.1038/nri.2015.9. [DOI] [PubMed] [Google Scholar]
- 23.Berry R, Watson GM, Jonjic S, Degli-Esposti MA, and Rossjohn J. (2020). Modulation of innate and adaptive immunity by cytomegaloviruses. Nat Rev Immunol 20, 113–127. 10.1038/s41577-019-0225-5. [DOI] [PubMed] [Google Scholar]
- 24.Sun JC, Beilke JN, and Lanier LL (2009). Adaptive immune features of natural killer cells. Nature 457, 557–561. 10.1038/nature07665. [DOI] [PMC free article] [PubMed] [Google Scholar]
- 25.Adachi T, Kobayashi T, Sugihara E, Yamada T, Ikuta K, Pittaluga S, Saya H, Amagai M, and Nagao K. (2015). Hair follicle-derived IL-7 and IL-15 mediate skin-resident memory T cell homeostasis and lymphoma. Nat Med 21, 1272–1279. 10.1038/nm.3962. [DOI] [PMC free article] [PubMed] [Google Scholar]
- 26.Szabo PA, Miron M, and Farber DL (2019). Location, location, location: Tissue resident memory T cells in mice and humans. Sci Immunol 4. 10.1126/sciimmunol.aas9673. [DOI] [PMC free article] [PubMed] [Google Scholar]
- 27.Skon CN, Lee JY, Anderson KG, Masopust D, Hogquist KA, and Jameson SC (2013). Transcriptional downregulation of S1pr1 is required for the establishment of resident memory CD8+ T cells. Nat Immunol 14, 1285–1293. 10.1038/ni.2745. [DOI] [PMC free article] [PubMed] [Google Scholar]
- 28.Evrard M, Wynne-Jones E, Peng C, Kato Y, Christo SN, Fonseca R, Park SL, Burn TN, Osman M, Devi S, et al. (2022). Sphingosine 1-phosphate receptor 5 (S1PR5) regulates the peripheral retention of tissue-resident lymphocytes. J Exp Med 219. 10.1084/jem.20210116. [DOI] [PMC free article] [PubMed] [Google Scholar]
- 29.Lopez-Verge S., Milus JM., Schwart BS., Pand MJ., Jarjour J., Yor VA., Houchin JP., Mille S., Kan SM., Norri PJ., et al. (2011). Expansion of a unique CD57(+)NKG2Chi natural killer cell subset during acute human cytomegalovirus infection. Proc Natl Acad Sci U S A 108, 14725–14732. 10.1073/pnas.1110900108. [DOI] [PMC free article] [PubMed] [Google Scholar]
- 30.Brownlie D, Scharenberg M, Mold JE, Hard J, Kekalainen E, Buggert M, Nguyen S, Wilson JN, Al-Ameri M, Ljunggren HG, et al. (2021). Expansions of adaptive-like NK cells with a tissue-resident phenotype in human lung and blood. Proc Natl Acad Sci U S A 118. 10.1073/pnas.2016580118. [DOI] [PMC free article] [PubMed] [Google Scholar]
- 31.Sun JC, Lopez-Verges S, Kim CC, DeRisi JL, and Lanier LL (2011). NK cells and immune “memory”. J Immunol 186, 1891–1897. 10.4049/jimmunol.1003035. [DOI] [PMC free article] [PubMed] [Google Scholar]
- 32.Adams NM, Lau CM, Fan X, Rapp M, Geary CD, Weizman OE, Diaz-Salazar C, and Sun JC (2018). Transcription Factor IRF8 Orchestrates the Adaptive Natural Killer Cell Response. Immunity 48, 1172–1182 e1176. 10.1016/j.immuni.2018.04.018. [DOI] [PMC free article] [PubMed] [Google Scholar]
- 33.Pak-Wittel MA, Yang L, Sojka DK, Rivenbark JG, and Yokoyama WM (2013). Interferon-gamma mediates chemokine-dependent recruitment of natural killer cells during viral infection. Proc Natl Acad Sci U S A 110, E50–59. 10.1073/pnas.1220456110. [DOI] [PMC free article] [PubMed] [Google Scholar]
- 34.Ali A, Canaday LM, Feldman HA, Cevik H, Moran MT, Rajaram S, Lakes N, Tuazon JA, Seelamneni H, Krishnamurthy D, et al. (2021). Natural killer cell immunosuppressive function requires CXCR3-dependent redistribution within lymphoid tissues. J Clin Invest 131. 10.1172/JCI146686. [DOI] [PMC free article] [PubMed] [Google Scholar]
- 35.Dijkgraaf FE, Kok L, and Schumacher TNM (2021). Formation of Tissue-Resident CD8(+) T-Cell Memory. Cold Spring Harb Perspect Biol 13. 10.1101/cshperspect.a038117. [DOI] [PMC free article] [PubMed] [Google Scholar]
- 36.Robbins SH, Bessou G, Cornillon A, Zucchini N, Rupp B, Ruzsics Z, Sacher T, Tomasello E, Vivier E, Koszinowski UH, and Dalod M. (2007). Natural killer cells promote early CD8 T cell responses against cytomegalovirus. PLoS Pathog 3, e123. 10.1371/journal.ppat.0030123. [DOI] [PMC free article] [PubMed] [Google Scholar]
- 37.Fodil-Cornu N, Lee SH, Belanger S, Makrigiannis AP, Biron CA, Buller RM, and Vidal SM (2008). Ly49h-deficient C57BL/6 mice: a new mouse cytomegalovirus-susceptible model remains resistant to unrelated pathogens controlled by the NK gene complex. J Immunol 181, 6394–6405. 10.4049/jimmunol.181.9.6394. [DOI] [PMC free article] [PubMed] [Google Scholar]
- 38.Brisse E, Imbrechts M, Put K, Avau A, Mitera T, Berghmans N, Rutgeerts O, Waer M, Ninivaggi M, Kelchtermans H, et al. (2016). Mouse Cytomegalovirus Infection in BALB/c Mice Resembles Virus-Associated Secondary Hemophagocytic Lymphohistiocytosis and Shows a Pathogenesis Distinct from Primary Hemophagocytic Lymphohistiocytosis. J Immunol 196, 3124–3134. 10.4049/jimmunol.1501035. [DOI] [PubMed] [Google Scholar]
- 39.Bombardieri M, Lewis M, and Pitzalis C. (2017). Ectopic lymphoid neogenesis in rheumatic autoimmune diseases. Nat Rev Rheumatol 13, 141–154. 10.1038/nrrheum.2016.217. [DOI] [PubMed] [Google Scholar]
- 40.Corsiero E, Nerviani A, Bombardieri M, and Pitzalis C. (2016). Ectopic Lymphoid Structures: Powerhouse of Autoimmunity. Front Immunol 7, 430. 10.3389/fimmu.2016.00430. [DOI] [PMC free article] [PubMed] [Google Scholar]
- 41.Weizman OE., Song E., Adams NM., Hildreth AD., Riggan L., Krishna C., Aguilar OA., Leslie CS., Carlyle JR., Sun JC., and O’Sullivan TE. (2019). Mouse cytomegalovirus-experienced ILC1s acquire a memory response dependent on the viral glycoprotein m12. Nat Immunol 20, 1004–1011. 10.1038/s41590-019-0430-1. [DOI] [PMC free article] [PubMed] [Google Scholar]
- 42.Doisne JM, Balmas E, Boulenouar S, Gaynor LM, Kieckbusch J, Gardner L, Hawkes DA, Barbara CF, Sharkey AM, Brady HJ, et al. (2015). Composition, Development, and Function of Uterine Innate Lymphoid Cells. J Immunol 195, 3937–3945. 10.4049/jimmunol.1500689. [DOI] [PMC free article] [PubMed] [Google Scholar]
- 43.Park E, Patel S, Wang Q, Andhey P, Zaitsev K, Porter S, Hershey M, Bern M, Plougastel-Douglas B, Collins P, et al. (2019). Toxoplasma gondii infection drives conversion of NK cells into ILC1-like cells. Elife 8. 10.7554/eLife.47605. [DOI] [PMC free article] [PubMed] [Google Scholar]
- 44.Cooper MA, Elliott JM, Keyel PA, Yang L, Carrero JA, and Yokoyama WM (2009). Cytokine-induced memory-like natural killer cells. Proc Natl Acad Sci U S A 106, 1915–1919. 10.1073/pnas.0813192106. [DOI] [PMC free article] [PubMed] [Google Scholar]
- 45.Cortez VS, Cervantes-Barragan L, Robinette ML, Bando JK, Wang Y, Geiger TL, Gilfillan S, Fuchs A, Vivier E, Sun JC, et al. (2016). Transforming Growth Factor-beta Signaling Guides the Differentiation of Innate Lymphoid Cells in Salivary Glands. Immunity 44, 1127–1139. 10.1016/j.immuni.2016.03.007. [DOI] [PMC free article] [PubMed] [Google Scholar]
- 46.Zhang N, and Bevan MJ (2013). Transforming growth factor-beta signaling controls the formation and maintenance of gut-resident memory T cells by regulating migration and retention. Immunity 39, 687–696. 10.1016/j.immuni.2013.08.019. [DOI] [PMC free article] [PubMed] [Google Scholar]
- 47.Cortez VS, Ulland TK, Cervantes-Barragan L, Bando JK, Robinette ML, Wang Q, White AJ, Gilfillan S, Cella M, and Colonna M. (2017). SMAD4 impedes the conversion of NK cells into ILC1-like cells by curtailing non-canonical TGF-beta signaling. Nat Immunol 18, 995–1003. 10.1038/ni.3809. [DOI] [PMC free article] [PubMed] [Google Scholar]
- 48.Gao Y, Souza-Fonseca-Guimaraes F, Bald T, Ng SS, Young A, Ngiow SF, Rautela J, Straube J, Waddell N, Blake SJ, et al. (2017). Tumor immunoevasion by the conversion of effector NK cells into type 1 innate lymphoid cells. Nat Immunol 18, 1004–1015. 10.1038/ni.3800. [DOI] [PubMed] [Google Scholar]
- 49.Wade CM, Kulbokas EJ 3rd, Kirby AW, Zody MC, Mullikin JC, Lander ES, Lindblad-Toh K, and Daly MJ (2002). The mosaic structure of variation in the laboratory mouse genome. Nature 420, 574–578. 10.1038/nature01252. [DOI] [PubMed] [Google Scholar]
- 50.Roncarolo MG, Gregori S, Bacchetta R, Battaglia M, and Gagliani N. (2018). The Biology of T Regulatory Type 1 Cells and Their Therapeutic Application in Immune-Mediated Diseases. Immunity 49, 1004–1019. 10.1016/j.immuni.2018.12.001. [DOI] [PubMed] [Google Scholar]
- 51.Rosenblum MD., Way SS., and Abbas AK. (2016). Regulatory T cell memory. Nat Rev Immunol 16, 90–101. 10.1038/nri.2015.1. [DOI] [PMC free article] [PubMed] [Google Scholar]
- 52.Chambers DC, Cherikh WS, Harhay MO, Hayes D Jr., Hsich E, Khush KK, Meiser B, Potena L, Rossano JW, Toll AE, et al. (2019). The International Thoracic Organ Transplant Registry of the International Society for Heart and Lung Transplantation: Thirty-sixth adult lung and heart-lung transplantation Report-2019; Focus theme: Donor and recipient size match. J Heart Lung Transplant 38, 1042–1055. 10.1016/j.healun.2019.08.001. [DOI] [PMC free article] [PubMed] [Google Scholar]
- 53.Paraskeva M, Bailey M, Levvey BJ, Griffiths AP, Kotsimbos TC, Williams TP, Snell G, and Westall G. (2011). Cytomegalovirus replication within the lung allograft is associated with bronchiolitis obliterans syndrome. Am J Transplant 11, 2190–2196. 10.1111/j.1600-6143.2011.03663.x. [DOI] [PubMed] [Google Scholar]
- 54.Lee SH, Kim KS, Fodil-Cornu N, Vidal SM, and Biron CA (2009). Activating receptors promote NK cell expansion for maintenance, IL-10 production, and CD8 T cell regulation during viral infection. J Exp Med 206, 2235–2251. 10.1084/jem.20082387. [DOI] [PMC free article] [PubMed] [Google Scholar]
- 55.Perona-Wright G, Mohrs K, Szaba FM, Kummer LW, Madan R, Karp CL, Johnson LL, Smiley ST, and Mohrs M. (2009). Systemic but not local infections elicit immunosuppressive IL-10 production by natural killer cells. Cell Host Microbe 6, 503–512. 10.1016/j.chom.2009.11.003. [DOI] [PMC free article] [PubMed] [Google Scholar]
- 56.Lanz TV, Brewer RC, Ho PP, Moon JS, Jude KM, Fernandez D, Fernandes RA, Gomez AM, Nadj GS, Bartley CM, et al. (2022). Clonally expanded B cells in multiple sclerosis bind EBV EBNA1 and GlialCAM. Nature 603, 321–327. 10.1038/s41586-022-04432-7. [DOI] [PMC free article] [PubMed] [Google Scholar]
- 57.Bjornevik K, Cortese M, Healy BC, Kuhle J, Mina MJ, Leng Y, Elledge SJ, Niebuhr DW, Scher AI, Munger KL, and Ascherio A. (2022). Longitudinal analysis reveals high prevalence of Epstein-Barr virus associated with multiple sclerosis. Science 375, 296–301. 10.1126/science.abj8222. [DOI] [PubMed] [Google Scholar]
- 58.Scalzo AA, Brown MG, Chu DT, Heusel JW, Yokoyama WM, and Forbes CA (1999). Development of intra-natural killer complex (NKC) recombinant and congenic mouse strains for mapping and functional analysis of NK cell regulatory loci. Immunogenetics 49, 238–241. 10.1007/s002510050486. [DOI] [PubMed] [Google Scholar]
- 59.Reinhardt RL, Liang HE, and Locksley RM (2009). Cytokine-secreting follicular T cells shape the antibody repertoire. Nat Immunol 10, 385–393. 10.1038/ni.1715. [DOI] [PMC free article] [PubMed] [Google Scholar]
- 60.Daussy C, Faure F, Mayol K, Viel S, Gasteiger G, Charrier E, Bienvenu J, Henry T, Debien E, Hasan UA, et al. (2014). T-bet and Eomes instruct the development of two distinct natural killer cell lineages in the liver and in the bone marrow. J Exp Med 211, 563–577. 10.1084/jem.20131560. [DOI] [PMC free article] [PubMed] [Google Scholar]
- 61.Gasteiger G., Fan X., Dikiy S., Lee SY., and Rudensky AY. (2015). Tissue residency of innate lymphoid cells in lymphoid and nonlymphoid organs. Science 350, 981–985. 10.1126/science.aac9593. [DOI] [PMC free article] [PubMed] [Google Scholar]
- 62.Kvestak D, Juranic Lisnic V, Lisnic B, Tomac J, Golemac M, Brizic I, Indenbirken D, Cokaric Brdovcak M, Bernardini G, Krstanovic F, et al. (2021). NK/ILC1 cells mediate neuroinflammation and brain pathology following congenital CMV infection. J Exp Med 218. 10.1084/jem.20201503. [DOI] [PMC free article] [PubMed] [Google Scholar]
- 63.Qu Y, Wen J, Thomas G, Yang W, Prior W, He W, Sundar P, Wang X, Potluri S, and Salek-Ardakani S. (2020). Baseline Frequency of Inflammatory Cxcl9-Expressing Tumor-Associated Macrophages Predicts Response to Avelumab Treatment. Cell Rep 32, 108115. 10.1016/j.celrep.2020.108115. [DOI] [PubMed] [Google Scholar]
- 64.Van Gassen S, Callebaut B, Van Helden MJ, Lambrecht BN, Demeester P, Dhaene T, and Saeys Y. (2015). FlowSOM: Using self-organizing maps for visualization and interpretation of cytometry data. Cytometry A 87, 636–645. 10.1002/cyto.a.22625. [DOI] [PubMed] [Google Scholar]
- 65.Eisen SA, Wedner HJ, and Parker CW (1972). Isolation of pure human peripheral blood T-lymphocytes using nylon wool columns. Immunol Commun 1, 571–577. 10.3109/08820137209022965. [DOI] [PubMed] [Google Scholar]
- 66.Sun JC, and Bevan MJ (2004). Cutting edge: long-lived CD8 memory and protective immunity in the absence of CD40 expression on CD8 T cells. J Immunol 172, 3385–3389. 10.4049/jimmunol.172.6.3385. [DOI] [PubMed] [Google Scholar]
- 67.Love MI, Huber W, and Anders S. (2014). Moderated estimation of fold change and dispersion for RNA-seq data with DESeq2. Genome Biol 15, 550. 10.1186/s13059-014-0550-8. [DOI] [PMC free article] [PubMed] [Google Scholar]
- 68.Hao Y., Hao S., Andersen-Nissen E., Mauck WM, Zheng S., Butler A., Lee MJ., Wilk AJ., Darby C., Zager M., et al. (2021). Integrated analysis of multimodal single-cell data. Cell 184, 3573–3587 e3529. 10.1016/j.cell.2021.04.048. [DOI] [PMC free article] [PubMed] [Google Scholar]
Associated Data
This section collects any data citations, data availability statements, or supplementary materials included in this article.
Supplementary Materials
Data Availability Statement
All data are in the main text and supplementary material. Bulk RNA sequencing data are available at Gene Expression Omnibus (GEO) under accession number GSE219243 and the single cell RNA sequencing data are available under accession number GSE222613.