

Abstract
Photoelectrochemical cells (PECs) are a promising option for directly converting solar energy into chemical energy by producing hydrogen (H2) gas, thus providing a clean alternative to consuming fossil fuels. H2 as fuel is free from any carbon footprints and negative environmental impacts. Therefore, the H2 production, especially directly using sunlight in PECs, is critically important for the rapidly growing energy demand of the world. Although promising, PECs are inefficient and must overcome a few inherent losses in producing H2—the most important being the activation overpotential () required for splitting water. This work analyzes the impact of on solar-to-fuel efficiency () and H2 production rate (HPR). This work also discusses choosing appropriate photo-absorbing materials based on their energy bandgaps and suitable electrode pairs to achieve desired and HPR for different electrical and optical PEC configurations. Significant changes are observed in and HPR when is considered in water splitting.
1. Introduction
Photoelectrochemical cells (PECs) produce hydrogen (H2) gas by splitting water using solar energy and suitable photo-absorbing semiconductors [1], [2], [3], [4]. In PECs, light energy dissociates water molecules into H2 and oxygen (O2) [5], [6]. Conventional energy sources, such as fossil fuels, are limited. Fossil fuels cause irreparable environmental damage by producing greenhouse gases, such as carbon dioxide (CO2). Therefore, reducing CO2 emissions is the most urgent need of time to save the earth's climate. In addition, fossil fuels will not last long and are estimated to be depleted by 2100 if burning continues at the present rate [7]. In the recent UN climate change conference (COP26) in Glasgow, world leaders proposed to reduce the carbon footprint rate to zero by the year 2050 [8]. Therefore, fossil fuel dependency needs to be reduced, and alternative solutions must replace fossil fuels in applications soon. The best alternative energy solutions lie with renewable sources. Among the renewable energy sources, solar energy is drawing significantly more attention [9], [10], [11], [12]. Solar energy can be converted into chemical energy by splitting water and producing H2 gas. Renewable solar H2 gas is a clean and green alternative to fossil fuels, especially for its applications in the automotive sector. When burned in fuel cells, H2 produces only water [13], [14], [15], [16].
The initial reports on electrochemical photolysis drew attention to finding new anode and cathode materials for water splitting [17], [18], [19], [20], [21], [22], [23], [24]. Initial research initiatives also aimed to increase the obtainable voltage and current by exploring different optical and electrical configurations [25]. Significant research has also been conducted to obtain appropriate anode and cathode materials in PECs [2], [5], [26], [27], [28], [29], [30]. Several mixed transition metal oxides have been used in the last two decades for efficient photoelectrochemical H2 production [4]. Due to their exceptional photoelectrochemical stability, low cost, suitable band-edge locations, and widespread bandgap dispersion, metal oxides have drawn much attention. Significant advancements in creating metal oxide nanoparticles for PEC water splitting have been made during these decades. To name a few, TiO2, ZnO, WO3, and Fe2O3 have been thoroughly investigated for PEC water splitting [31]. Recently, semiconductor and carbon quantum dots (QDs) have been increasingly used due to their suitable shapes, sizes, compositions, tunable absorption spectrum, ease of surface functionalization, and outstanding electron transfer efficiency [32], [33], [34]. Their large surface area relative to their volume improves QD's ability to absorb light. In addition to serving as electron reservoirs to support photo-generated electrons with much reduced electron-hole recombination, the newly discovered QDs might also function as photosensitizers to improve solar light harvesting, resulting in significantly improved PEC performance. To date, QD-based photocatalysts, ZnO, Cu2ZnGeS4, CuInSSe/ZnS, Zn-CuInSe2/CuInS2, CdxZnS have been extensively investigated for photocatalytic applications [34], [35], [36].
Although experimental reports of PEC performances are common in literature, a detailed theoretical treatment of this topic is still lacking. In addition, to date, theoretical analyses report solar-to-fuel efficiency () and H2 production rate (HPR) considering only ideal PECs, where and HPR are not affected by any losses [37], [38], [39]. However, losses are inherent to PECs, and realistic implementations of efficient PECs are impossible without considering the losses incurred [40], [41], [42], [43].
The efficiency of an ideal PEC for water splitting will be greater than a PEC working in a practical scenario. In practice, several losses pertinent to the electrodes, electrolyte, and junctions, such as overpotential, shunt losses, resistance losses of the contacts, charge carrier transportation losses, junction losses, thermodynamic and radiative recombination losses, and polarization losses, impact the performance of a PEC. Due to these losses, does not reach the desired level. Among the losses incurred, the overpotential loss within the electrode and the resistance loss within the electrolyte are the primary concerns [13], [44], [45], [46], [47], [48], [49], [50], [51]. The overpotential is the excess potential applied to an electrode to initiate electron transfer from the electrode to the electrolytic solution in an electrochemical cell. The value of , considering the overpotential loss, can be less than half of that when considering an ideal situation [52]. Also, the selection of electrodes is critical due to the losses [53], and the studies of losses due to electrode materials is a crucial issue. The electrode materials should be selected based on high exchange current density, low overpotentials, strong conductivity, and good stability.
Photo-absorbing materials can be used as electrodes in PECs in addition to absorbing light and generating electric potential [5], [54]. In this case, materials must have both photo-absorbing characteristics and those required for water splitting, making it challenging to meet both. For effective light harvesting and electron transfer, photo-absorbing materials should have the following qualities: a bandgap that matches the required potential, a high absorption coefficient, a large surface area to maximize the number of active sites, and stability. For a single photo-absorber, obtaining the required electric potential for water splitting is met only by a single . For double or triple photo-absorber, the standard potential of and would be achieved by s of all photo-absorbing materials. Therefore, different materials are often used for electrodes and photo-absorbers. In this case, photo-absorbing materials are only used to generate the open-circuit voltage () and short-circuit current density () by absorbing the solar irradiance spectrum, as used in this work. Separate electrodes and photo-absorbers offer a negligible loss at the electrode–photo-absorbing material junction, considered an ohmic contact in PEC [55], [56].
The structural designs of PECs may vary in optical and electrical configurations. The optical configuration focuses on efficiently harvesting light, and the electrical configuration is for transporting photo-excited charge carriers. Both optical and electrical configurations may be series, parallel, and a combination of series and parallel. The positions of electrodes depend on the branches of an electrical configuration. Different current densities flow through different branches in a mixed electrical configuration. Hence, and overpotential losses (η) also vary depending on the PEC configuration. Furthermore, the positions of electrodes in an electrical configuration cause current density (J) to vary from branch to branch. Therefore, also varies for different PEC configurations. The variation of leads to significant changes in H2 production.
To date, there are no detailed reports on the effects of on and HPR for H2 generation. This work investigates how depends on bandgap energy and considering different electrode pairs. This work also investigates the effects of on and HPR for different photo-absorbing and electrode materials. Libraries of photo-absorbing and electrode materials have been created. PEC and HPR are analyzed for several combinations of photo-absorbing and electrode materials. The bandgaps of photo-absorbing materials are determined for optimized and HPR for several electrical and optical configurations considering the impact of . Also, this work analyzes the impact of electrode positions in electrical branches and discusses the selection of compatible electrode pairs considering . Due to , choosing compatible photo-absorbers is a difficult task for any PEC configuration as a slight variation of causes a significant change in J. The values of and HPR change significantly when is considered in the calculation. Finally, this work illustrates PEC designs considering the material parameters, electrical and optical configurations, and the number of electrolyzers.
2. Theoretical modeling
At standard conditions, the Gibbs free energy, kJ/mol, changes when H2 and 1/2O2 are obtained from a H2O molecule. The change in free energy indicates eV per electron transferred according to the Nernst equation [5]. Therefore, the photo-absorbing material must absorb photon irradiance with energy >1.23 eV and convert it into H2 and O2. Here, a photon with >1.23 eV has a wavelength ≤1000 nm [57]. However, due to losses in a practical scenario, there is a need for an additional eV for water splitting [29], [52]. A PEC water splitting system must generate two electron-hole pairs per molecule of H2 or four electron-hole pairs per molecule of O2.
A single semiconductor material can drive the H2 (HER) and O2 evolution reactions (OER) using electrons and holes generated under illumination. The material must have an greater than that required to split water and conduction () and valence band-edge energies () that straddle the electrochemical potentials () and () [57]. If a single semiconductor material does not meet the required potential for water splitting, multiple semiconductor materials can be used in tandem, providing sufficient electrochemical potential for HER and OER. Tandem cells are a stack of multiple photo-absorbing materials on top of each other, effectively capturing solar energy. They are classified into two categories: (1) type A tandem cells have two terminals, one connected to the top of the cell and the other to the bottom, and (2) type B tandem cells have multiple terminals, separate connections with each photo-absorber. Band alignment is not a problem for type B cells. However, band alignment is crucial for type A cells for which the conduction band of the photo-absorbing material at the anode side is more negative than the valence band at the cathode side, and the band gap of the photo-absorber should be sufficient for or standard potential for HER and OER [58]. The HER and OER can be written as
| (1a) |
| (1b) |
| (1c) |
Electron transfer processes are critically important to drive the HER and OER given in Eq. (1a), (1b), (1c). The electron transfer processes at the electrode–liquid junctions incur losses due to the concentration and kinetic overpotentials. The overpotential is the difference between the experimentally and theoretically observed values of the required voltages for water splitting in PECs. Among the mechanisms responsible for overpotential, is the most critical and must be accounted for in HER and OER [59], [60].
2.1. Modeling of activation overpotential
Activation overpotential (), the most significant overpotential loss, is the potential difference above the equilibrium potential required to overcome the activation energy of the cell reaction to generate a specified current density. Basically, causes a slow electrode reaction and is associated with the charge transfer between the electrode and the electrolytic solution. Therefore, it depends on the concentration of the electrolytic solution. The overpotential is measured from the difference between an electrode's equilibrium and operating potentials—the difference between the solid and dashed lines in Fig. 1. At an electrode–electrolytic solution junction, opposite polarity charges are accumulated, as shown in Fig. 1. The positive charge polarity exists in the electrolytic solution's inner Helmholtz plane. However, both positive and negative polarity charges exist in the outer Helmholtz plane. An electron participates in the initial reaction after passing through the inner Helmholtz plane. After coming out of the outer Helmholtz plane, the reaction between the electron and H+ completes [61].
Figure 1.

Schematic illustration of the electric double layer (EDL) with Helmholtz plane between an electrode and electrolytic solution and the corresponding cell potential.
Considering the half-cell reactions of cathode and anode, the HER and OER can be written as
| (2a) |
| (2b) |
If the equilibrium concentrations of H+ and O2− are denoted as and , and the non-equilibrium concentrations of H+ and O2− are denoted as and , the Butler-Volmer equation (BVE) for the current density (J), due to the reactions in Eq. (2a), (2b), can be written as [62]
| (3) |
In Eq. (3), is the exchange current density between the electrode and the electrolytic solution in equilibrium condition, n is the number of transferred electrons in HER, F is the Faraday constant, and R is the universal gas constant. Also, β is the symmetry factor of the electrode, which is usually assumed as 0.5 [5], [63]. In PECs, can be defined as the equilibrium current density flowing equally in both directions at a reversible potential.
If the mass transfer coefficient between the electrode surface and the bulk electrolytic solution is greater than the HER rate, the concentration difference of H+ is negligible between these two. In such a scenario, the mass transfer of ions between the electrolytic solution and the outer Helmholtz plane is much faster than the rate at which the ions react at the electrodes [64], [65], [66]. Therefore, we can write , , and . Hence, the BVE becomes
| (4) |
The BVE given in Eq. (4) is not used at anode and cathode simultaneously. The properties of the anode and cathode materials and corresponding are not the same. Also, is different for different electrochemical cells. Hence, it is simplified for two significant cases at the conditions during electrolysis related to (1) large overpotentials, when mV, and (2) small overpotentials, mV. The large overpotential approximation is used for water electrolysis as the optimum current density level is required to meet the minimum requirement of the redox potential. Therefore, the large cathodic or anodic overpotential is expected for water splitting [5], [67].
For large cathodic activation overpotential (), the second term of the BVE can be neglected as the sign of is negative. When is the cathodic exchange current density, Eq. (4) reduces to
| (5) |
In contrast, for large anodic activation overpotential (), the first term of the BVE can be neglected as the sign of is positive. When is the anodic exchange current density, Eq. (4) reduces to
| (6) |
This work used Eqs. (5) and (6) to determine and . The total is the summation of and .
2.2. STF efficiency
Photo-absorbing materials generate by absorbing solar irradiance spectrum in a PEC. If the number of electrolyzers () is one, the voltage required for water splitting from photo-absorbing materials is the sum of water redox potential () and . However, if there are multiple electrolyzers in a PEC, the minimum required voltage from a cell is .
The of a single electrolyzer system is given by , where is the Faradaic efficiency and is the power density of the solar irradiance spectrum. Faradaic efficiency defines the efficiency of photo-excited electron transfers between the electrode and electrolytic solution in electrochemical cells. Consequently, for a water splitting process with 100% charge transfer efficiency, i.e., . If there are electrochemical cells in series, each will have the same J, and will be given by
| (7) |
This work takes a “detailed balance” approach to calculate J by using the standard ideal diode equation and the assumptions that (1) each cell is planar with an abrupt absorption threshold, (2) all photons with an energy greater than the bandgap are absorbed, and (3) there is no multiplication of carriers at the ambient condition and from radiative emission from other cells [40], [47], [68], [69]. Therefore, one photon excites one electron, i.e., the PEC has a unity quantum efficiency [70]. Now, the current-voltage relationship of a single photo-absorber is given by
| (8a) |
| (8b) |
| (8c) |
where is the light-induced current density, is the reverse saturation current density, and is the solar photon flux normal on the earth surface per energy interval dE. The constants q, h, c, and k are the elementary charge, Planck's constant, speed of light, and the Boltzmann constant, respectively.
Two kinds of losses occur when photo-absorbing materials absorb light: The radiative emission and the non-radiative transition [71]. The non-radiative transition is not considered here. The radiative emission is included as a geometric factor , which is equal to one when the radiative emission is limited to the front side, i.e., the photo-absorber has a perfect back reflector. In addition, if the radiative emission can leave from both the front and back sides. Finally, unless stated otherwise, AM 1.5 G spectrum (ASTM G173), as shown in Fig. 2, and K have been considered in this work [72].
Figure 2.

AM 1.5 G terrestrial solar irradiance spectrum on the earth-surface.
2.3. Hydrogen production rate
HPR is an important performance parameter of an electrochemical cell. HPR depends on and the intensity of the solar irradiance spectrum () and can be calculated using [73]
| (9) |
where is the number of photo-absorbers. The HPR given in Eq. (9) is in per unit area of each photo-absorber. The total H2 amount can be obtained by multiplying HPR by a single photo-absorber's effective photo-absorbing area. This work assumes that the effective photo-absorption area of each photo-absorber is the same. The unit of HPR is modified to mL H2/cm2 hour considering ambient temperature (), pressure (P), and molar gas constant (R) by
| (10) |
3. Simulation model
We have investigated several electrical and optical PEC configurations, such as electrically series or parallel, optically series or parallel, and mixed series and parallel. Figs. 3(a) and 3(b) show several electrical and optical PEC configurations. In an optically parallel configuration, photo-absorbing materials are positioned parallelly and not optically connected, thus splitting the solar light equally to each photo-absorber. The effective area of each photo-absorber is assumed to be the same, and the total effective area of all parallel photo-absorbers is calculated by summing up the effective areas of photo-absorbers. In contrast, light propagates from one photo-absorber to another for an optical series configuration. Hence, the effective area of every photo-absorbing material is considered one.
Figure 3.

(a) Different types of optical configurations: (i) single photo-absorbing material, (ii) series-connected double photo-absorbing materials, (iii) series-connected triple photo-absorbing materials, (iv) parallel-connected double photo-absorbing materials, (v, vi) mixture of series- and parallel-connected photo-absorbing materials, (vii) parallel-connected triple photo-absorbing materials. (b) Different types of electrical configurations: (i) single photo-absorbing material, (ii) series-connected double photo-absorbing materials, (iii) parallel-connected double photo-absorbing materials, (iv) series-connected triple photo-absorbing materials, (v) mixture of series- and parallel-connected photo-absorbing materials. (c) Jsc vs. Voc characteristics of series and parallel photovoltaic cell. (d) Schematic diagram for double photo-absorbing materials with double electrolyzers in an optically series and electrically series configuration.
In an electrical configuration, the series connection increases , and the parallel connection increases . Different electrical configurations for PECs are shown in Fig. 3(b). Fig. 3(d) shows a PEC system where double photo-absorbing materials with double electrolyzers are connected optically and electrically in series.
We have calculated by integrating the solar irradiance spectrum considering wavelengths from 280 nm to 4000 nm. The simulations depend on the number of photo-absorbing materials and electrolyzers and the optical, electrical, and electrode configurations. The simulation parameters are given in Table 1. Additionally, we have assumed unity efficiency for the electrolyte to specifically focus on the impact of activation overpotential on the efficiency of PEC devices. Since J and are related to each other, as given in Eqs. (5) and (6), we have solved them iteratively. We have calculated the initial J and V without using Eq. (8a), (8b), (8c) and estimated the initial and using Eqs. (5) and (6). Finally, J, V, and are determined from Eqs. (5), (6), and (8a), (8b), (8c) using the numerical convergence method. Here, the total activation overpotential is . Consequently, and HPR are calculated using Eqs. (7) and (10).
Table 1.
Input parameters for the simulation model.
| Name | Value | Name | Value |
|---|---|---|---|
| Temperature (Ta) | 298.15 K | Pressure (P) | 1 atm |
| Solar irradiance spectrum | AM 1.5 G | Faradaic efficiency (ηf) | 1 |
| Standard redox potential (Erxn) | 1.23 V | Geometric factor (fg) | 1 or 2 |
3.1. Electrode material library
Electrode materials used in this work for H2 production and their corresponding are shown in Table 2. Ten materials are used as cathodes and five materials are used as anodes. The values given in Table 1 are constant considering of 298.15 K and 1 N H2SO4 electrolytic solution [74], [75]. This work utilized these materials to calculate for different PEC configurations.
Table 2.
Electrode materials with their J0 at Ta of 298.15 K in 1N H2SO4 solution.
| Cathode | Cathode | Anode | |||
|---|---|---|---|---|---|
| Palladium (Pd) | 10 | Titanium (Ti) | 7.00 × 10⁻⁴ | PtFe/C | 2.15 × 10⁻³ |
| Platinum (Pt) | 8 | Lead (Pb) | 1.00 × 10⁻⁸ | PtW2C/C | 4.70 × 10⁻⁴ |
| Nickel (Ni) | 0.07 | Cadmium (Cd) | 1.50 × 10⁻⁷ | RuxSey | 2.22 × 10⁻⁴ |
| Gold (Au) | 0.04 | Manganese (Mn) | 1.30 × 10⁻⁷ | RuxFeySez | 4.47 × 10⁻⁴ |
| Tungsten (W) | 0.013 | Mercury (Hg) | 5.00 × 10⁻¹⁰ | Pt | 1.00 × 10⁻⁵ |
3.2. Photo-absorbing material library
Photo-absorbing materials used in this work for H2 production and their corresponding values are shown in Table 3 [5], [76]. This work analyzes the state of H2 production in different PEC combinations using these 30 materials with varying from 0.52 eV to 3.08 eV.
Table 3.
Photo-absorbing materials and their corresponding bandgap energy (Eg).
| Photo-absorber | Eg (eV) | Photo-absorber | Eg (eV) | Photo-absorber | Eg (eV) |
|---|---|---|---|---|---|
| C-Si/CuSnS4 | 0.52 | p-GaAs/Cu2MnSnS4 | 1.4 | Cu4SiS4 | 1.95 |
| Ge | 0.67 | Cu2ZnSnSe4 | 1.48 | Cu3SbSe3 | 2.01 |
| BaSi2 | 0.72 | Cu2BaSnSSe3 | 1.59 | Cu2O | 2.06 |
| Cu2ZnSnSe4 | 0.9 | CuBiS2 | 1.61 | Cu2ZnGeS4 | 2.08 |
| CuSbTe2 | 0.92 | Cu2BaSnSe4 | 1.68 | Cu3SbS3 | 2.13 |
| CuSbSe2 | 1.05 | Cu2FeSnS4 | 1.71 | n-Fe2O3 | 2.2 |
| Cu4GeS4 | 1.15 | Cu2BeSnS4 | 1.76 | p-GaP | 2.3 |
| CuBiSe2 | 1.18 | Cu2BaSnS4 | 1.8 | Cd0.6Zn0.4S | 2.47 |
| p-InP | 1.3 | Cu2SrSnS4 | 1.81 | Penta-C20/Cu2ZnSiS4 | 2.89 |
| CuSbS2 | 1.37 | Cu3BiS3 | 1.88 | ZnO-Ce | 3.08 |
4. Results and discussion
4.1. Activation overpotential in PECs
In PECs, critically depends on , which is calculated from of the photo-absorbing material. In addition, different electrode pairs show a significant variation of due to the difference of among them. Fig. 4 shows vs. and of a photo-absorber for various electrode pairs. Fig. 4(a) shows that decreases as the photo-absorber increases, which is attributed to increasing and decreasing as increases, as shown in Fig. 3(c). By contrast, increases with , as shown in Fig. 4(b).
Figure 4.

Activation overpotential (ηa) vs. bandgap (Eg) and short circuit current density (Jsc) for various electrode pairs. Electrode pairs are denoted by different markers: ★ indicates Au cathode and PtW2C/C anode, ■ indicates Ni cathode and PtW2C/C anode, ● indicates Pt cathode and Pt anode, ◆ indicates Ni cathode and PtFeC/C anode, ✶ indicates Pt cathode and RuxSey anode, ▼ indicates Pt cathode and PtW2C/C anode, and ▲ indicates Pt cathode and PtFe/C anode.
The smallest values are found for Pt cathode and PtFe/C anode with the variation of . On the other hand, the greatest values are found for the Au cathode and PtW2C/C anode. The Pt and PtFe/C electrode pair has a greater than Au and PtW2C/C electrode pair. Hence, the charge transfer kinetics of the Pt and PtFe/C electrode pair is faster than the other.
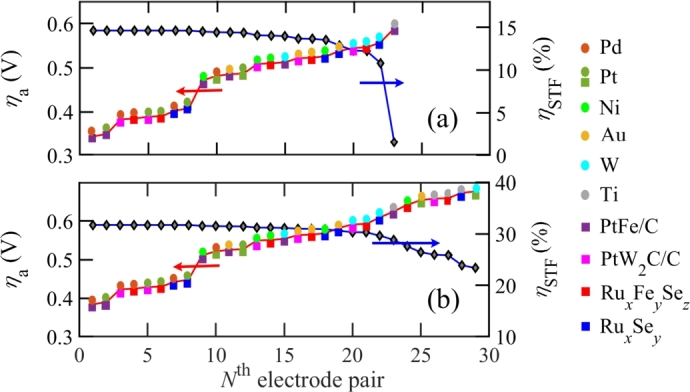
Electrical configurations can have photo-absorbers in different branches along with the electrodes. Different electrical configurations are possible for electrodes placed on different branches, as shown in Fig. 3(b). Fig. 5 shows that there are significant changes in based on the electrode position due to the change in from branch to branch. Therefore, and HPR also vary with the electrode position, making the electrode pair configuration a critical design parameter for H2 production.
Figure 5.

ηa vs. energy bandgaps of photo-absorbers for optical series and electrical series configuration of single photo-absorbing material with parallel-connected double photo-absorbing materials. Electrodes are located in different branches (B1, B2, B3, and B4) of the electrical configuration. (a) Eg2 and Eg3 are varied while Eg1 is constant at 3.08 eV, (b) Eg2 and Eg3 are varied while Eg1 is kept constant at 2.88 eV, (c) Eg1 is varied while Eg2 and Eg3 are kept constant at 1.88 eV, and (d) Eg1 is varied while Eg2 and Eg3 are kept constant at 1.95 eV.
This work analyzed the impacts of electrical series and parallel configurations by considering a mixed PEC configuration, as shown in Fig. 3(b)(v), where four electrical branches are present. Fig. 5 shows against of photo-absorbers in different branches. The bandgaps and of photo-absorbers are the same due to optically parallel connection. In Figs. 5(a) and (b), and are varied equally, while keeping fixed. In all cases, is maximum at branch 4 and minimum at branch 1 since is proportional to . Therefore, is less in branch 1 as is the smallest in branch 1 among all branches. The same feature is also observed in branches 2 and 3 where is greater than that of branch 1. Since of branch 4 is the summation of of branches 1, 2, and 3, the maximum occurs at branch 4. In Figs. 5(c) and (d), is varied while keeping and fixed, and a similar change in has been obtained. The features shown in Fig. 5 show the electrical branch where the electrode should be placed so that the optimized and HPR are found.
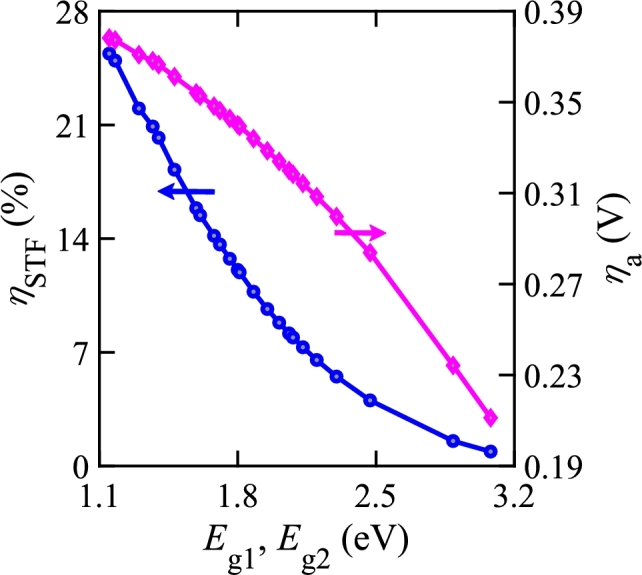
impacts of any PEC significantly. Due to the presence of , a higher potential is needed to split water than in an ideal situation. Eventually, , on which depends proportionally, decreases. Therefore, decreases as well with . Fig. 6 shows against and with and without . In both cases, the PEC consists of a single photo-absorbing material and a single electrolyzer. The electrolyzer uses Pt as the cathode and PtFe/C as the anode. When , can be up to 30%. However, drops to 18% when is considered. Notably, for V if is considered, although if is not considered. Fig. 6(b) shows that a higher is achieved for a smaller since increases when decreases. Since is fixed for a particular electrode pair, varies with following Eqs. (5) and (6).
Figure 6.

ηSTF against Eg for a single photo-absorbing material in a single electrolyzer (a) without and (b) with considering ηa. In each case, Pt is used as the cathode and PtFe/C is used as the anode. ηa values are shown in (b) beside corresponding data points.
4.2. Choice of electrode materials
In this work, PEC performances are analyzed for different electrode pairs. The choice of the proper electrode pair is essential as depends on it. A greater with a suitable is obtained for an electrode pair if is less. Fig. 7 shows for different electrode pairs considering . Fig. 7(a) shows for different pairs of electrode materials for a single photo-absorber, while Fig. 7(b) shows that for double photo-absorbers connected in series both electrically and optically. Here, eV is used for the single photo-absorber, and eV and 0.72 eV are used in double photo-absorbers. Fig. 7 shows that and depend inversely on each other. If increases, decreases for any pair of cathode and anode. As a result, for the anode and cathode materials considered, the bottom left pairs of Fig. 7 can be preferable for any PECs as they have a smaller due to larger . Fig. 7(b) shows that depends more sensitively on the choice of electrode materials for double photo-absorbers than a single photo-absorber in a PEC configuration.
Figure 7.
ηa and ηSTF for (a) single photo-absorber with Eg = 2.13 eV and (b) double photo-absorbers with Eg1 = 1.4 eV and Eg2 = 0.72 eV. Symbols ● and ■ indicate cathode and anode, respectively. Electrode materials are given as legends.
4.3. PEC configurations
HPR and are calculated considering utilizing photo-absorbing and electrode materials from the libraries. depends on different optical and electrical configurations of PEC. also depends on the number of photo-absorbers, number of electrolyzers, and different electrode pairs. Increasing the number of photo-absorbers increases the absorption of solar energy. Although increases when more electrolyzers are added to the system, the negative gradient of H2 concentration decreases, offering convenient H2 collection. This work compares of each photo-absorbing material utilizing several electrolyzers and electrode pairs.
4.3.1. Single photo-absorber
Fig. 8 shows , , and HPR for a PEC that has a single photo-absorber in an electrolyzer. This PEC has a Pt cathode and a PtFe/C anode. We vary the photo-absorber as given in Table 3. In this case, Fig. 8(a) shows that the maximum is 17.743% when the photo-absorber eV and its corresponding is 0.35982 V. Murphy et al. also reported that the required minimum is almost 2 eV by utilizing AM 1.5 G for single photo-absorber [77]. If is not considered, for the same , as also reported in Ref. 37. We note that for eV if is considered. However, can be obtained for smaller values if is neglected. For example, when eV, is 30.68% without including . However, for the same bandgap, i.e., eV, when is considered in the calculation as the photo-absorber does not meet the required potential for water splitting. Figs. 8(a) and (b) show that and HPR decrease when increases. This is because is proportional to , which decreases with increasing . Since HPR is proportional to , it has a similar trend. On the other hand, decreases when increases as it also depends proportionally on .
Figure 8.

(a) ηSTF and ηa vs. Eg and (b) HPR vs. Eg of a PEC with a single photo-absorber in an electrolyzer.
4.3.2. Double photo-absorbers
We have also analyzed the impact of on for double photo-absorbing materials in a PEC. Four PEC configurations are possible with double photo-absorbers, as shown in Figs. 3(a) and (b). This work investigated only the optical series-electrical series (OS-ES) and optical parallel-electrical series (OP-ES) PEC configurations for double photo-absorbers. Other configurations, such as optical series-electrical parallel (OS-EP) and optical parallel-electrical parallel (OP-EP) are discussed with triple photo-absorbers.
Fig. 9 shows the impact of on for OS-ES PEC configuration with double photo-absorbers. While Figs. 9(a) and (b) illustrate and with for single electrolyzer, Figs. 9(c) and (d) illustrate those for double electrolyzers. For the single electrolyzer, Pt is used as the cathode and PtFe/C is used as the anode. In Figs. 9(a) and (c), the maximum is observed in the left-bottom portion of the range of the bandgaps, showing the maximum power point (MPP), where the cell outputs the maximum net power at a certain and . As increases, also increases but decreases. As a result, at a certain combination of the bandgaps, the MPP is achieved with the maximum . In most cases, does not change significantly. is approximately a constant till the MPP, however, it decreases significantly as the operating point crosses the MPP. Therefore, the output power () and decreases according to
| (11) |
Figure 9.

Optimized ηSTF and corresponding ηa for double photo-absorbing materials with optical and electrical series configuration for (a,b) single electrolyzer and (c,d) for double electrolyzers.
In the double-photo-absorber configuration, , according to Eq. (11). However, of acts as the main driver. When increases linearly, keeping constant, change of is also shown in Figs. 9(a) and (c). sharply decreases as increases for eV. However, when eV, does not change much when increases.
We note that and used in Fig. 9 are chosen from the photo-absorber library given in Table 3. Here, an increase in means an increase in . Keeping constant means keeping constant for the first photo-absorber, and an increase in will not impact as remains constant initially, as shown in Fig. 3(c). When continues to increase, it eventually overcomes the constant value of , and as a result, decreases. Consequently, decreases as well. These phenomena are observed in Fig. 9(a). values for the variations of and are shown in Fig. 9(b). Fig. 9(c) shows for the same configuration as before, except for a PEC with double electrolyzers. Fig. 9(c) also shows that values are right-shifted compared to that in Fig. 9(a) due to high required for water splitting in double electrolyzers. Hence, the range for double electrolyzers is smaller than that of a single electrolyzer. The second electrode pair of the double electrolyzers consists of Ni as the cathode and PtW2/C as the anode. Corresponding is shown in Fig. 9(d), where the values of are higher than single electrolyzer values due to double electrolyzer.
Fig. 10 presents and for OP-ES connection of double photo-absorbers in a single electrolyzer. The electrode pair consists Pt as the cathode and PtFe/C as the anode. The bandgap of each photo-absorber must be the same for an optically parallel connection. Fig. 10 shows that decreases as increases. For double electrolyzers, higher bandgaps are required for water splitting to obtain along with decreasing .
Figure 10.
ηSTF and ηa vs. bandgaps for optical parallel and electrical series configuration with double photo-absorbing materials in a single electrolyzer.
4.3.3. Triple photo-absorbers
Fig. 11 is a scatter plot of and for OS-ES PEC configuration with triple photo-absorbing materials in a single electrolyzer. Figs. 11(a,b) and 11(c,d) are illustrations of and against , respectively. The electrode pair consists of Pt as the cathode and PtFe/C as the anode. We note that when eV, 2.89 eV, and eV. Fig. 11 also gives an idea of for any compatible bandgaps of triple photo-absorbing materials compared to the color from the color bar. The advantage of using triple photo-absorbing materials rather than single or double photo-absorbing materials is that the lower bandgap values can be utilized, and a greater can be obtained in the presence of . For a PEC with double electrolyzers, although the range of bandgaps for photo-absorbers increases, increases as well.
Figure 11.

Optimized ηSTF in (a,b) and corresponding ηa in (c,d) are shown for triple photo-absorbing materials with optical series and electrical series configuration.
For the OP-ES PEC configuration of triple photo-absorbing materials, and follow a similar trend as in the OP-ES PEC configuration of double photo-absorbing materials. However, smaller bandgap materials can be used in triple photo-absorbing materials.
We also investigated a mixed configuration to obtain a detailed analysis of EP PEC configuration. For the mixed configuration of triple photo-absorbing materials, we used the optical configuration from Fig. 3(a)(v) and the electrical configuration from Fig. 3(b)(v). will increase in the EP configuration, whereas will increase in the ES configuration. There are four branches in this mixed configuration. One branch is external, and the rest are internal. The mixed configuration will work fine when an electrolyzer is located in the external branch according to the connections of Fig. 3(b)(v). However, when an electrolyzer is located in the internal branch, then another electrolyzer should be placed in the external branch. Otherwise, the external connection must be open to make the circuitry work, and opening the external connection will eventually make the mixed configuration an ES configuration.
We analyzed and with for the mixed configuration where a single electrolyzer is located in the external branch, as shown in Fig. 12. and show a similar trend where larger values of them are obtained on the top-left portion of the Figs. 12(a) and (b) with eV and , eV. The results we obtained here are also applicable for the EP PEC configuration where is connected in parallel with series connected and .
Figure 12.

(a) Variation of ηSTF with bandgap for the mixed configuration analyzed in this paper. (b) Corresponding ηa for same PEC configuration.
Table 4 is a summary of the optimized and HPR for different PEC configurations, as shown in Figs. 3(a) and 3(b). For each PEC configuration with several electrolyzers, the optimized cathode, anode, and photo-absorbing materials are found from the photo-absorbing and electrode material libraries based on given in Table 4. Corresponding HPR and are also given in Table 4.
Table 4.
Optimized ηSTF and HPR including ηa for different PEC configurations of Fig. 3(a,b).
| Configuration | Nelec | Cathode | Anode | Eg (eV) | ηSTF (%) | HPR | ηa (V) |
|---|---|---|---|---|---|---|---|
| Fig. 3(a)(i), 3(b)(i) | 1 | Pt | PtFe/C | 1.95 | 17.74 | 6.60 | 0.359 |
| Fig. 3(a)(ii), 3(b)(ii) | 1 | Pt | PtFe/C | 1.59, 0.92 | 31.75 | 23.62 | 0.389 |
| 2 | Pt, Ni | PtFe/C, PtW2C/C | 2.3, 1.81 | 21.891 | 16.28 | 0.831 | |
| 3 | Pt, Ni, Au | PtFe/C, PtFe/C, PtW2C/C | 3.08, 2.47 | 5.23 | 3.89 | 1.017 | |
| Fig. 3(a)(iv), 3(b)(ii) | 1 | Pt | PtFe/C | 1.15, 1.15 | 25.39 | 18.89 | 0.378 |
| 2 | Pt, Ni | PtFe/C, PtW2C/C | 2.01, 2.01 | 16.51 | 12.28 | 0.802 | |
| 3 | Pt, Pt, Ni | PtFe/C, PtFe/C, PtW2C/C | 2.89, 2.89 | 4.621 | 3.44 | 0.863 | |
| Fig. 3(a)(iii), 3(b)(iv) | 1 | Pt | PtFe/C | 3.08, 2.47, 0.90 | 36.75 | 41.02 | 0.242 |
| 2 | Pt, Ni | PtFe/C, PtW2C/C | 2.01, 1.48, 1.05 | 35.30 | 29.40 | 0.880 | |
| 3 | Pt, Ni, Au | PtFe/C, PtFe/C, PtW2C/C | 2.47, 2.06, 1.76 | 24.24 | 27.06 | 1.255 | |
| Fig. 3(a), 3(b)(iv) | 1 | Pt | PtFe/C | 0.92, 0.92, 0.92 | 21.28 | 23.75 | 0.369 |
| 2 | Pt, Ni | PtFe/C, PtW2C/C | 1.48, 1.48, 1.48 | 23.97 | 26.75 | 0.840 | |
| 3 | Pt, Pt, Ni | PtFe/C, PtFe/C, PtW2C/C | 1.95, 1.95, 1.95 | 17.57 | 19.61 | 1.069 | |
| Fig. 3(a)(v), 3(b)(v) | 1 | Pt | PtFe/C | 2.47, 1.95, 1.95 | 10.95 | 12.22 | 0.335 |
5. Conclusion
This work is critical to calculating and HPR in realistic PECs. This work includes in calculating and HPR for different configurations and finds photo-absorber and electrode materials for desired PEC performances. It is found that the and HPR are significantly affected when is considered in the calculation. An idea is obtained for selecting appropriate photo-absorbers and electrode pairs for PEC configurations to achieve a desired and HPR. The proper design of electrical branches and the positions of electrodes in branches can be determined based on the optimized and HPR calculated in the presence of . However, it is important to note that this work considers a constant temperature and pressure. This work also does not consider losses due to electrolytes. The results will vary slightly when the impacts of temperature, pressure, and electrolytic losses are considered.
CRediT authorship contribution statement
Abdul Ahad Mamun, Asif Billah: conceived and designed the experiments; performed the experiments; analyzed and interpreted the data; Contributed reagents, materials, analysis tools or data; and wrote the paper.
Muhammad Anisuzzaman Talukder: conceived and designed the experiments; performed the experiments; analyzed and interpreted the data; and wrote the paper.
Declaration of Competing Interest
The authors declare that they have no known competing financial interests or personal relationships that could have appeared to influence the work reported in this paper.
Data availability
Data will be made available on request.
References
- 1.James B.D., Baum G.N., Perez J., Baum K.N. 2009. Technoeconomic analysis of photoelectrochemical (PEC) hydrogen production. DOE Report. [Google Scholar]
- 2.Peter L.M., Upul Wijayantha K. Photoelectrochemical water splitting at semiconductor electrodes: fundamental problems and new perspectives. ChemPhysChem. 2014;15(10):1983–1995. doi: 10.1002/cphc.201402024. [DOI] [PubMed] [Google Scholar]
- 3.Linic S., Christopher P., Ingram D.B. Plasmonic-metal nanostructures for efficient conversion of solar to chemical energy. Nat. Mater. 2011;10(12):911–921. doi: 10.1038/nmat3151. [DOI] [PubMed] [Google Scholar]
- 4.Jang Y.J., Lee J.S. Photoelectrochemical water splitting with p-type metal oxide semiconductor photocathodes. ChemSusChem. 2019;12(9):1835–1845. doi: 10.1002/cssc.201802596. [DOI] [PubMed] [Google Scholar]
- 5.Walter M.G., Warren E.L., McKone J.R., Boettcher S.W., Mi Q., Santori E.A., Lewis N.S. Solar water splitting cells. Chem. Rev. 2010;110(11):6446–6473. doi: 10.1021/cr1002326. [DOI] [PubMed] [Google Scholar]
- 6.Dias P., Mendes A. In: Encyclopedia of Sustainability Science and Technology. Meyers R.A., editor. Springer Science and Business Media LLC; Berlin/Heidelberg, Germany: 2017. Hydrogen production from photoelectrochemical water splitting; pp. 1–52. [Google Scholar]
- 7.Welsby D., Price J., Pye S., Ekins P. Unextractable fossil fuels in a 1.5 C world. Nature. 2021;597(7875):230–234. doi: 10.1038/s41586-021-03821-8. [DOI] [PubMed] [Google Scholar]
- 8.T.U.I.P. on Climate Change (IPCC), UN Climate Change Conference (cop26), Glasgow, United Nations, October-November 2021.
- 9.Kadam K.D., Kim H., Rehman S., Patil H., Aziz J., Dongale T.D., Khan M.F., Kim D.-k. Optimization of ZnO: PEIE as an electron transport layer for flexible organic solar cells. Energy Fuels. 2021;35(15):12416–12424. [Google Scholar]
- 10.Kadam K.D., Kim H., Rehman S., Patil H., Aziz J., Dongale T.D., Khan M.F., Kim D.-k. Compositional dynamics of the electron transport layer (ZnO: PEIE) in P3HT: PC61BM organic solar cells. Mater. Sci. Semicond. Process. 2021;136 [Google Scholar]
- 11.Sutar S.S., Patil S.M., Kadam S.J., Kamat R.K., Kim D.-k., Dongale T.D. Analysis and prediction of hydrothermally synthesized ZnO-based dye-sensitized solar cell properties using statistical and machine-learning techniques. ACS Omega. 2021;6(44):29982–29992. doi: 10.1021/acsomega.1c04521. [DOI] [PMC free article] [PubMed] [Google Scholar]
- 12.Gaikwad M., Suryawanshi M., Maldar P., Dongale T., Moholkar A. Nanostructured zinc oxide photoelectrodes by green routes M-SILAR and electrodeposition for dye sensitized solar cell. Opt. Mater. 2018;78:325–334. [Google Scholar]
- 13.Fakourian S. A theoretical study on overpotential and photocurrent of a photo fuel cell. Theor. Found. Chem. Eng. 2019;53(1):147–150. [Google Scholar]
- 14.Dunyushkina L., Pavlovich A., Khaliullina A. Activation of porous Pt electrodes deposited on YSZ electrolyte by nitric acid treatment. Materials. 2021;14(18):5463. doi: 10.3390/ma14185463. [DOI] [PMC free article] [PubMed] [Google Scholar]
- 15.Varadhan P., Fu H.-C., Kao Y.-C., Horng R.-H., He J.-H. An efficient and stable photoelectrochemical system with 9% solar-to-hydrogen conversion efficiency via InGaP/GaAs double junction. Nat. Commun. 2019;10(1):1–9. doi: 10.1038/s41467-019-12977-x. [DOI] [PMC free article] [PubMed] [Google Scholar]
- 16.Cendula P., Steier L., Losio P.A., Grätzel M., Schumacher J.O. Analysis of optical losses in a photoelectrochemical cell: a tool for precise absorptance estimation. Adv. Funct. Mater. 2018;28(1) [Google Scholar]
- 17.Fujishima A., Honda K. Electrochemical photolysis of water at a semiconductor electrode. Nature. 1972;238(5358):37–38. doi: 10.1038/238037a0. [DOI] [PubMed] [Google Scholar]
- 18.Chen Y., Feng X., Liu Y., Guan X., Burda C., Guo L. Metal oxide-based tandem cells for self-biased photoelectrochemical water splitting. ACS Energy Lett. 2020;5(3):844–866. [Google Scholar]
- 19.Crovetto A., Nielsen R., Stamate E., Hansen O., Seger B., Chorkendorff I., Vesborg P.C. Wide band gap SrSn solar cells from oxide precursors. ACS Appl. Energy Mater. 2019;2(10):7340–7344. [Google Scholar]
- 20.Zhang K., Ma M., Li P., Wang D.H., Park J.H. Water splitting progress in tandem devices: moving photolysis beyond electrolysis. Adv. Energy Mater. 2016;6(15) [Google Scholar]
- 21.Santos J.S., d P., Araújo S., Pissolitto Y.B., Lopes P.P., Simon A.P., d M., Sikora S., Trivinho-Strixino F. The use of anodic oxides in practical and sustainable devices for energy conversion and storage. Materials. 2021;14(2):383. doi: 10.3390/ma14020383. [DOI] [PMC free article] [PubMed] [Google Scholar]
- 22.Yang W., Prabhakar R.R., Tan J., Tilley S.D., Moon J. Strategies for enhancing the photocurrent, photovoltage, and stability of photoelectrodes for photoelectrochemical water splitting. Chem. Soc. Rev. 2019;48(19):4979–5015. doi: 10.1039/c8cs00997j. [DOI] [PubMed] [Google Scholar]
- 23.Hu S., Xiang C., Haussener S., Berger A.D., Lewis N.S. An analysis of the optimal band gaps of light absorbers in integrated tandem photoelectrochemical water-splitting systems. Energy Environ. Sci. 2013;6(10):2984–2993. [Google Scholar]
- 24.Seger B., Hansen O., Vesborg P.C. A flexible web-based approach to modeling tandem photocatalytic devices. Sol. Rrl. 2017;1(1) [Google Scholar]
- 25.Pusch A., Pearce P., Ekins-Daukes N.J. Analytical expressions for the efficiency limits of radiatively coupled tandem solar cells. IEEE J. Photovolt. 2019;9(3):679–687. [Google Scholar]
- 26.Jafari T., Moharreri E., Amin A.S., Miao R., Song W., Suib S.L. Photocatalytic water splitting—the untamed dream: a review of recent advances. Molecules. 2016;21(7):900. doi: 10.3390/molecules21070900. [DOI] [PMC free article] [PubMed] [Google Scholar]
- 27.Jacobsson T.J., Fjällström V., Sahlberg M., Edoff M., Edvinsson T. A monolithic device for solar water splitting based on series interconnected thin film absorbers reaching over 10% solar-to-hydrogen efficiency. Energy Environ. Sci. 2013;6(12):3676–3683. [Google Scholar]
- 28.Kalanur S.S., Duy L.T., Seo H. Recent progress in photoelectrochemical water splitting activity of WO3 photoanodes. Top. Catal. 2018;61(9):1043–1076. [Google Scholar]
- 29.Jiang C., Moniz S.J., Wang A., Zhang T., Tang J. Photoelectrochemical devices for solar water splitting–materials and challenges. Chem. Soc. Rev. 2017;46(15):4645–4660. doi: 10.1039/c6cs00306k. [DOI] [PubMed] [Google Scholar]
- 30.Wang Z., Wang L. Photoelectrode for water splitting: materials, fabrication and characterization. Sci. China Mater. 2018;61(6):806–821. [Google Scholar]
- 31.Yang Y., Niu S., Han D., Liu T., Wang G., Li Y. Progress in developing metal oxide nanomaterials for photoelectrochemical water splitting. Adv. Energy Mater. 2017;7(19) [Google Scholar]
- 32.Wang X., Zhang Y., Li J., Liu G., Gao M., Ren S., Liu B., Zhang L., Han G., Yu J., et al. Platinum cluster/carbon quantum dots derived graphene heterostructured carbon nanofibers for efficient and durable solar-driven electrochemical hydrogen evolution. Small Methods. 2022;6(4) doi: 10.1002/smtd.202101470. [DOI] [PubMed] [Google Scholar]
- 33.Alivisatos A.P. Semiconductor clusters, nanocrystals, and quantum dots. Science. 1996;271(5251):933–937. [Google Scholar]
- 34.Jin L., Zhao H., Wang Z.M., Rosei F. Quantum dots-based photoelectrochemical hydrogen evolution from water splitting. Adv. Energy Mater. 2021;11(12) [Google Scholar]
- 35.Liang Z., Hou H., Fang Z., Gao F., Wang L., Chen D., Yang W. Hydrogenated TiO2 nanorod arrays decorated with carbon quantum dots toward efficient photoelectrochemical water splitting. ACS Appl. Mater. Interfaces. 2019;11(21):19167–19175. doi: 10.1021/acsami.9b04059. [DOI] [PubMed] [Google Scholar]
- 36.Liu G., Wang X., Liu B., Han G., Jiang W., Zhang Y., Zhao H. Band engineering enables highly efficient and stable photoelectrochemical hydrogen evolution. Chem. Eng. J. 2022;450 [Google Scholar]
- 37.Holmes-Gentle I., Hellgardt K. A versatile open-source analysis of the limiting efficiency of photo electrochemical water-splitting. Sci. Rep. 2018;8(1):1–9. doi: 10.1038/s41598-018-30959-9. [DOI] [PMC free article] [PubMed] [Google Scholar]
- 38.He Y.-R., Yan F.-F., Yu H.-Q., Yuan S.-J., Tong Z.-H., Sheng G.-P. Hydrogen production in a light-driven photoelectrochemical cell. Appl. Energy. 2014;113:164–168. [Google Scholar]
- 39.Weber M.F., Dignam M.J. Efficiency of splitting water with semiconducting photoelectrodes. J. Electrochem. Soc. 1984;131(6):1258. [Google Scholar]
- 40.Fountaine K.T., Lewerenz H.J., Atwater H.A. Efficiency limits for photoelectrochemical water-splitting. Nat. Commun. 2016;7(1):1–9. doi: 10.1038/ncomms13706. [DOI] [PMC free article] [PubMed] [Google Scholar]
- 41.Spitler M.T., Modestino M.A., Deutsch T.G., Xiang C.X., Durrant J.R., Esposito D.V., Haussener S., Maldonado S., Sharp I.D., Parkinson B.A., et al. Practical challenges in the development of photoelectrochemical solar fuels production. Sustain. Energy Fuels. 2020;4(3):985–995. [Google Scholar]
- 42.Seitz L.C., Chen Z., Forman A.J., Pinaud B.A., Benck J.D., Jaramillo T.F. Modeling practical performance limits of photoelectrochemical water splitting based on the current state of materials research. ChemSusChem. 2014;7(5):1372–1385. doi: 10.1002/cssc.201301030. [DOI] [PubMed] [Google Scholar]
- 43.Sathre R., Greenblatt J.B., Walczak K., Sharp I.D., Stevens J.C., Ager J.W., Houle F.A. Opportunities to improve the net energy performance of photoelectrochemical water-splitting technology. Energy Environ. Sci. 2016;9(3):803–819. [Google Scholar]
- 44.Rocheleau R.E., Miller E.L. Photoelectrochemical production of hydrogen: engineering loss analysis. Int. J. Hydrog. Energy. 1997;22(8):771–782. [Google Scholar]
- 45.Shockley W., Queisser H.J. Detailed balance limit of efficiency of p-n junction solar cells. J. Appl. Phys. 1961;32(3):510–519. [Google Scholar]
- 46.Bolton J.R., Strickler S.J., Connolly J.S. Limiting and realizable efficiencies of solar photolysis of water. Nature. 1985;316(6028):495–500. [Google Scholar]
- 47.Hanna M., Nozik A. Solar conversion efficiency of photovoltaic and photoelectrolysis cells with carrier multiplication absorbers. J. Appl. Phys. 2006;100(7) [Google Scholar]
- 48.Xu Y., Gong T., Munday J.N. The generalized Shockley-Queisser limit for nanostructured solar cells. Sci. Rep. 2015;5(1):1–9. doi: 10.1038/srep13536. [DOI] [PMC free article] [PubMed] [Google Scholar]
- 49.Buhl M.L., Jr, Bird R.E., Bilchak R.V., Connolly J.S., Bolton J.R. Thermodynamic limits on conversion of solar energy to work or stored energy—effects of temperature, intensity and atmospheric conditions. Sol. Energy. 1984;32(1):75–84. [Google Scholar]
- 50.Hirst L.C., Ekins-Daukes N.J. Fundamental losses in solar cells. Prog. Photovolt. 2011;19(3):286–293. [Google Scholar]
- 51.Patel M.T., Khan M.R., Alam M.A. Thermodynamic limit of solar to fuel conversion for generalized photovoltaic–electrochemical systems. IEEE J. Photovolt. 2018;8(4):1082–1089. [Google Scholar]
- 52.Chu S., Li W., Yan Y., Hamann T., Shih I., Wang D., Mi Z. Roadmap on solar water splitting: current status and future prospects. Nano Futures. 2017;1(2) [Google Scholar]
- 53.Nikolić N.D. Influence of the exchange current density and overpotential for hydrogen evolution reaction on the shape of electrolytically produced disperse forms. J. Electrochem. Sci. Eng. 2020;10(2):111–126. [Google Scholar]
- 54.Seger B., Castelli I.E., Vesborg P.C., Jacobsen K.W., Hansen O., Chorkendorff I. 2-Photon tandem device for water splitting: comparing photocathode first versus photoanode first designs. Energy Environ. Sci. 2014;7(8):2397–2413. [Google Scholar]
- 55.Parkinson B. On the efficiency and stability of photoelectrochemical devices. Acc. Chem. Res. 1984;17(12):431–437. [Google Scholar]
- 56.Papageorgiou N. Counter-electrode function in nanocrystalline photoelectrochemical cell configurations. Coord. Chem. Rev. 2004;248(13–14):1421–1446. [Google Scholar]
- 57.Bookbinder D.C., Lewis N.S., Bradley M.G., Bocarsly A.B., Wrighton M.S. Photoelectrochemical reduction of N, N′-dimethyl-4,4′-bipyridinium in aqueous media at p-type silicon: sustained photogeneration of a species capable of evolving hydrogen. J. Am. Chem. Soc. 1979;101(26):7721–7723. [Google Scholar]
- 58.Chen Q., Fan G., Fu H., Li Z., Zou Z. Tandem photoelectrochemical cells for solar water splitting. Adv. Phys. X. 2018;3(1) [Google Scholar]
- 59.Zhang X., Bieberle-Hütter A. Modeling and simulations in photoelectrochemical water oxidation: from single level to multiscale modeling. ChemSusChem. 2016;9(11):1223–1242. doi: 10.1002/cssc.201600214. [DOI] [PubMed] [Google Scholar]
- 60.Yang J., Wang D., Han H., Li C. Roles of cocatalysts in photocatalysis and photoelectrocatalysis. Acc. Chem. Res. 2013;46(8):1900–1909. doi: 10.1021/ar300227e. [DOI] [PubMed] [Google Scholar]
- 61.Zhang L. Modeling, Dynamics and Control of Electrified Vehicles. Elsevier; 2018. High-power energy storage: ultracapacitors; pp. 39–75. [Google Scholar]
- 62.Noren D., Hoffman M.A. Clarifying the Butler–Volmer equation and related approximations for calculating activation losses in solid oxide fuel cell models. J. Power Sources. 2005;152:175–181. [Google Scholar]
- 63.Vikraman D., Hussain S., Karuppasamy K., Feroze A., Kathalingam A., Sanmugam A., Chun S.-H., Jung J., Kim H.-S. Engineering the novel MoSe2-Mo2C hybrid nanoarray electrodes for energy storage and water splitting applications. Appl. Catal. B, Environ. 2020;264 [Google Scholar]
- 64.Murthy S.K., Sharma A.K., Choo C., Birgersson E. Analysis of concentration overpotential in an all-vanadium redox flow battery. J. Electrochem. Soc. 2018;165(9) [Google Scholar]
- 65.Suwanwarangkul R., Croiset E., Fowler M., Douglas P., Entchev E., Douglas M. Performance comparison of Fick's, dusty-gas and Stefan–Maxwell models to predict the concentration overpotential of a SOFC anode. J. Power Sources. 2003;122(1):9–18. [Google Scholar]
- 66.Gabrielli C., Huet F., Nogueira R. Fluctuations of concentration overpotential generated at gas-evolving electrodes. Electrochim. Acta. 2005;50(18):3726–3736. [Google Scholar]
- 67.Niu S., Li S., Du Y., Han X., Xu P. How to reliably report the overpotential of an electrocatalyst. ACS Energy Lett. 2020;5(4):1083–1087. [Google Scholar]
- 68.Bolton J.R., Haught A.F., Ross R.T. Photochemical Conversion and Storage of Solar Energy. 1981. Photochemical energy storage: an analysis of limits; pp. 297–330. [Google Scholar]
- 69.Nelson J.A. World Scientific Publishing Company; 2003. The Physics of Solar Cells. [Google Scholar]
- 70.Jacobsson T.J., Fjällström V., Edoff M., Edvinsson T. A theoretical analysis of optical absorption limits and performance of tandem devices and series interconnected architectures for solar hydrogen production. Sol. Energy Mater. Sol. Cells. 2015;138:86–95. [Google Scholar]
- 71.El-Sayed M.A. Triplet state. Its radiative and nonradiative properties. Acc. Chem. Res. 1968;1(1):8–16. [Google Scholar]
- 72.Committee G., et al. ASTM International; 2012. Tables for reference solar spectral irradiances: direct normal and hemispherical on 37 tilted surface. [Google Scholar]
- 73.Kim J.H., Hansora D., Sharma P., Jang J.-W., Lee J.S. Toward practical solar hydrogen production–an artificial photosynthetic leaf-to-farm challenge. Chem. Soc. Rev. 2019;48(7):1908–1971. doi: 10.1039/c8cs00699g. [DOI] [PubMed] [Google Scholar]
- 74.Wendt H., Spinacé E.V., Oliveira Neto A., Linardi M. Electrocatalysis and electrocatalysts for low temperature fuel cells: fundamentals, state of the art, research and development. Quím. Nova. 2005;28(6):1066–1075. [Google Scholar]
- 75.Song C., Zhang J. PEM Fuel Cell Electrocatalysts and Catalyst Layers. Springer; 2008. Electrocatalytic oxygen reduction reaction; pp. 89–134. [Google Scholar]
- 76.Chen R., Zamulko S., Huang D., Persson C. Solar Energy Capture Materials. The Royal Society of Chemistry; 2019. Theoretical analyses of copper-based solar cell materials for the next generation of photovoltaics; pp. 193–240. CHAPTER 5. 08 2019. [Google Scholar]
- 77.Murphy A.B., Barnes P.R., Randeniya L.K., Plumb I.C., Grey I.E., Horne M.D., Glasscock J.A. Efficiency of solar water splitting using semiconductor electrodes. Int. J. Hydrog. Energy. 2006;31(14):1999–2017. [Google Scholar]
Associated Data
This section collects any data citations, data availability statements, or supplementary materials included in this article.
Data Availability Statement
Data will be made available on request.