

Abstract
Cardiovascular disease (CVD) is a major cause of mortality and morbidity worldwide and imposes significant socioeconomic burdens, especially with late diagnoses. There is growing evidence of strong correlations between ocular images, which are information-dense, and CVD progression. The accelerating development of deep learning algorithms (DLAs) is a promising avenue for research into CVD biomarker discovery, early CVD diagnosis, and CVD prognostication. We review a selection of 17 recent DLAs on the less-explored realm of DL as applied to ocular images to produce CVD outcomes, potential challenges in their clinical deployment, and the path forward. The evidence for CVD manifestations in ocular images is well documented. Most of the reviewed DLAs analyze retinal fundus photographs to predict CV risk factors, in particular hypertension. DLAs can predict age, sex, smoking status, alcohol status, body mass index, mortality, myocardial infarction, stroke, chronic kidney disease, and hematological disease with significant accuracy. While the cardio-oculomics intersection is now burgeoning, very much remain to be explored. The increasing availability of big data, computational power, technological literacy, and acceptance all prime this subfield for rapid growth. We pinpoint the specific areas of improvement toward ubiquitous clinical deployment: increased generalizability, external validation, and universal benchmarking. DLAs capable of predicting CVD outcomes from ocular inputs are of great interest and promise to individualized precision medicine and efficiency in the provision of health care with yet undetermined real-world efficacy with impactful initial results.
Keywords: Biomarker discovery, cardiovascular disease, cardiovascular risk stratification, deep learning, oculomics
Introduction
Big data – data that are high in volume, velocity, veracity, and variety[1] – and machine learning (ML) hold increasingly major roles in health care and research,[2] especially so in image-heavy specialties such as radiology, dermatology, and ophthalmology.[3] Recent ophthalmologic innovations include accurate detection of refractive errors, diabetic retinopathy (DR),[4-7] age-related macular degeneration (AMD),[7-9] and glaucoma,[7,10] using ocular images.[7]
Outside of ophthalmology, ML has also taken a foothold in the cardiovascular system (CVS) research. Cardiovascular disease (CVD) is the leading cause of death worldwide in 2020[11] and imposes significant socioeconomic burdens with its high morbidity rate. Most CVD cases and deaths have been identified to be caused by a small collection of modifiable risk factors that vary by the income level of a country, such as hypertension (HTN), diabetes, cholesterol level, and physical activity level.[12] Enabling earlier and more accurate screening of these risk factors may prevent or positively affect the management and outcome of CVD.
Risk scores (RSs) that approximate CVD risk (for example, Framingham RS [FRS],[13] ASCVD risk estimator plus, pooled cohort equation [PCE], QRISK3,[14] and SCORE2[15]) are significant in the mitigation of delayed intervention.[16] However, the modalities they require as inputs do not directly measure CV health[17] and systematically underestimate risk in certain demographics.[18,19] This diagnostic problem is further exacerbated: there are no widely accepted biomarkers for screening purposes,[20] and the subclinical levels of CVD produce attenuated signs that require lower detection thresholds. With the rise of precision medicine, physicians are increasingly favoring methods that improve individualized treatment and outcomes.[3,21,22] Therefore, surrogate markers for screening are required to achieve reliable early interventions and reduce disease burden.[23]
Herein, we review the eye-heart connection, CVD outcomes, and the subject matter of deep learning (DL). We evaluate selected latest peer-reviewed applications to detail how the eyes act as a window into CVD biomarker discovery, risk factor stratification, and adverse event prediction. The motivation behind our study is on driving this interdisciplinary sphere forward by identifying research gaps; we, thus, weigh the balance of strengths and challenges and recommend further actions based on the evidence.
Methods
We performed a targeted literature search by combining keywords from ophthalmology (“ophthalmology,” “imaging,” “retinal vasculature,” “oculomics”), cardiovascular disease (“cardiovascular,” “disease,” “biomarker,” “prediction,” “risk stratification”), and artificial intelligence (“deep learning,” “convolutional neural network”). We independently combined each term with each term from another subset using the Boolean operators “AND” and “OR” on MeSH terms and all-field search terms on PubMed, MEDLINE, and Google Scholar. Our inclusion criteria were original research articles, the perceived high quality of research that bridged both specialties, the emphasis on the DL aspect, oculomics, and CVD biomarker discovery, risk factor estimation, and/or predictive capability. We excluded case reports, case series, reviews, surveys, guidelines, and statistical models. We defined DL algorithms (DLAs) as algorithms that must accept ocular images as input and autonomously construct a representation model. All papers were available in English and full text only. We summarized and discussed the selected studies [Table 1].
Table 1.
Selected deep learning algorithms that accept oculomic input for the prediction of cardiovascular disease risk factors
| Authors, year | Modality | Heat map areas | CVD outcomes predicted | Roles in CVS health | Key findings | Training set size, t (origin) internal validation set size, n (origin) | External validation set size, n (origin) | Deep learning architecture (ground truth) |
|---|---|---|---|---|---|---|---|---|
| Poplin et al., 2018[24] | RFP | Vessels and optic discs | CVD risk factors: MACE, age, sex, smoking status, SBP, DBP, and HbA1c | Predictive, screening | CVD risk factors (CVD outcomes column) are present and accurately quantifiable in RFPs alone and quantifiable to high precision | t=96,082 (UKBB) t=1,682,938 (EyePACS) n=24,008 (UKBB) n=1958 (EyePACS-2K) | None | Inception-v3[4,25-27] (three ophthalmologists checked the highlighted features of each image) |
| Vaghefi et al., 2019[28] | RFP | Retinal vasculature, perivascular region, and fovea | CVD risk factors: Smoking status | Predictive, screening | Smoking status is accurately predictable from RFPs alone | 165,104 from DM patients ADESD 60% training: t=99,062 20% test: n=33,020 20% test: n=33,020 | None | One novel CNN (New Zealand Ministry of Health diabetic retinopathy standard)[29] |
| Dai et al., 2020[30] | RFP | Arterial, venous bifurcations | CVD risk factors: HTN | Predictive, screening | RFPs alone can predict HTN | 1419 from SHEH 75% training: t=1064 25% testing: n=355 | None | U-Net[31] (clinical diagnosis) |
| Kim et al., 2020[32] | RFP | Unspecified | CVD risk factors: Age and sex | Predictive, screening | Retinal changes caused by aging and those caused by systemic vascular diseases differ in pathophysiology, but the exact salient features remain unknown | t=216,866 (SBRIA, SNUBH) n=2436 (SBRIA, SNUBH) n=40,659 (SBRIA, SNUBH HTN) n=14,189 (SBRIA, SNUBH diabetes) n=113,510 (SBRIA, SNUBH smoking) n=24,366 test set (SBRIA, SNUBH) | None | ResNet-152[33] (57 licensed ophthalmologists)[34] |
| Sabanayagam et al., 2020[35] | RFP | Dilatation of venules, rarefaction of vessels, and retinopathic changes | CKD | Predictive, screening | CKD is accurately predictable using RFP alone. This may allow early CKD detection in community-based, primary care, or high-risk group settings | t=10,376 (SEED) n=2594 (SEED) | n=7470 (SP2) n=3076 (BES) | CondenseNet[36] (eGFR<60 corresponding to CKD stage 3–5 versus 0–2) |
| Rim et al., 2020[37] | RFP | Age and sex markers: Optic disc and retinal vessels. HCT and hemoglobin markers: Retinal vessels. BMI markers: Optic disc. Others: | Systemic biomarker discovery | Predictive, screening | Multiple markers (CVD outcomes predicted column) are quantifiable in a population with a similar ethnic background | t=86,994 (SMH) n=21,698 (SMH) | n=9324 (Severance Gangnam Hospital) n=4234 (BES) n=63, 275 (SEED) n=50,732 (UKBB) | VGG16[38] (professional graders (non-UKBB data) and self-reported (UKBB data) |
| Percentage of body fat and body weight | ||||||||
| Chang et al., 2020[39] | RFP | Retinal vessels, disc rim, cup-to-disc ratio, peripapillary atrophy, and cotton-wool spots | Carotid artery atherosclerosis | Predictive, screening, risk stratification | First, atherosclerosis is accurately predictable from RFP alone. Second, this prediction is itself an independent predictor of CVD mortality when adjusted for the FRS | t=12,362 (HPC-SNUH) n=1526 validation set (HPC-SNUH) n=1520 test set (HPC-SNUH) | None | Xception for feature extraction,[40] Keras for transfer learning, ImageNet for pretrained weights[41] (sonography reports initially written by board-trained radiologists, reviewed by four board-trained family medicine physicians) |
| Son et al., 2020[42] | RFP | CACS, temporal retinal vasculature, fovea | CVD biomarker discovery | Predictive, screening, risk stratification | Patients can be differentiated based on varying CACS that are accurately detectable from RFP alone. Performance and distinguishing capability saturate at CACS >100. Binocular data from a single patient yielded more predictive results than monocular | The authors split the dataset into five folds for cross-validation and used each fold to calculate the performance of the model they trained with the other four-folds | None | Inception-v3[4,24-27] (CACS information was collected through cardiac CT on a 64-slice multi-detector and calculated through the Agatston score;[43] HTN information was collected by review of medical records) |
| Zhang et al., 2020[44] | RFP | Unspecified | CVD risk factors: HTN, hyperglycemia and dyslipidemia, HCT, MCHC | Predictive, screening, risk stratification | RFP alone can accurately predict hyperglycemia, HTN, and dyslipidemia. To a lower accuracy, DLA can also predict HCT, MCHC, and several other CVD risk factors | t=978 training dataset (primary data from 625 recruited patients) t=122 tuning dataset (primary data from 625 recruited patients) n=122 (primary data from 625 recruited patients) | None | Inception-v3[4,24-27] (smoking, alcohol, and salt intake were self-reported; blood samples, height, weight, hip circumference, and partial RFPs were collected) |
| Zhang et al., 2021[45] | RFP | GFR CKD: Optic nerve, vessel branch points, and arterial-venous junctions. DM: Vascular tortuosity, venous dilatation, retinal hemorrhage, and cotton-wool spots | CKD, DM | Predictive, screening, risk stratification | CKD onset and diagnosis are accurately predictable from a nondiseased baseline. Further, the DLA was robust enough to produce comparable results using fundus images captured through smartphones | t=60,244 training dataset (CC-FII-C) t=8614 tuning dataset t=8612 (CC-FII-C) n=17,454 (CC-FII-C) | n=16,118 external validation set n=6162 external validation smartphone-captured set (COACS) | ResNet-50[33] (10 individuals trained by ophthalmologists, then five ophthalmologists who individually reviewed every image. 20% of images were randomly selected and reviewed by three senior retinal specialists. T2DM laboratory investigations in at least two visits) |
| Rim et al., 2021[46] | RFP | CACS, hemorrhage, and cotton-wool spots RetiCAC is a novel three-tiered score to stratify the longitudinal risk of CAC development | CVD risk factors | Predictive, screening, risk stratification | The performance of predicting CACS from RFP alone is comparable to the current CT scans. DLA shows incremental prognostic performance over the PCE in borderline- and intermediate-risk groups. This is the first study to compare DLA to clinical guidelines | t=5590 (SMH) | n=18,920 (PMC) n=1054 (CMERC-HI) n=17,102 (SEED) n=95,358 (UKBB) | EfficientNet (patient metadata included with corresponding datasets) |
| Cheung et al., 2021[47] | RFP | CRAE, CRVE | CVD risk factors: BP, BMI, total cholesterol, and HbA1c | Screening | DLA performed comparably to expert human graders in CRAE and CRVE measurements. DLA confirmed previously known findings regarding wider CRVE and showed narrower CRAE is associated with increased CVD incidents | t=5309 (SEED) n=5309 (SEED) | n=59,191 (SP2, Dunedin, HKCES, AHES, RICP, IRED, CUHK-STDR, GUSTO, SiDRP, CVD screening study) | SIVA-DLS (novel; professional graders using SIVA software) |
| Nusinovici et al., 2022[48] | RFP | Macula, optic disc margin, and arcade vessels | CVD risk factors: Biological age | Predictive, screening, risk stratification | A novel marker was discovered to risk stratify for mortality and morbidity independent of chronological age and phenotypic markers. This marker is associated with all-cause, CVD, and cancer mortality and with CVD and cancer events | t=129,236 (KHSS) n=129,236 (KHSS) | n=56,301 (UKBB) | RetiAGE (novel; CVD and cancer status were self-reported) |
| Zekavat et al., 2022[49] | RFP | Low retinal vascular fractal dimension and density | Mortality, HTN, congestive HF, and DM | Predictive, screening, risk stratification | Lower microvascular density or fractal branching is associated with a higher risk of incident mortality. DLA-guided PheWAS, GWAS, and Mendelian randomization analyses identified multiple new potential therapeutic targets | t=97,895 (UKBB) | None | Ensemble model of U-Net[31] (hand-labeled vessel segmentations included from the Structured Analysis of the Retina database)[50] |
| Diaz-Pinto et al., 2022[51] | RFP | Retinal vessels | LV mass, LVEDV, and MI | Predictive, screening, risk stratification | Future MI is accurately predictable by a multimodal DLA that jointly learned a latent space between retinal and CMR images. Predictions are comparable to established CVD risk assessment models | t=5663 (UKBB) | n=3010 (AREDS) | mcVAE,[52] ResNet50[33] (manual and automatic delineations of the CMR images were used to estimate LV mass and LV EDV from RFP) |
| Zhu et al., 2022[53] | RFP | Decreased CRAE and arteriolar-to-venule ratio | Stroke risk | Predictive, screening, risk stratification | The retinal age gap can accurately predict incident stroke from RFP alone | t=35,304 (UKBB) | None | Xception[40] (UKBB[54]) |
| Tseng et al., 2023[55] | RFP | Retina | CVD risk factors | Predictive, screening, risk stratification | Patients with ≥10% 10-year CVD risk who are likely to benefit from earlier interventions can be identified from RFP alone. Borderline-QRISK3 patients with 10-year CVD risk between 7.5% and 10% can be stratified granularly | t=48,260 (UKBB) | None | RetiCVD (built on RetiCAC; ground truth taken from a previous study)[4] |
We defined the external validation data set as an independently derived dataset, completely disparate from the training and internal validation datasets in origin. CVD screening study using retinal vascular imaging study. ADESD=Auckland diabetic eye screening database, AHES=Australian heart eye study, AREDS=Age-related eye disease study, AUROC=Area under the receiver operating characteristics curve, BES=Beijing eye study, BMI=Body mass index, BP=Blood pressure, BRAVE=The Beijing research on ageing and vessel, CACS=Coronary artery calcium score, CC-FII-C=China consortium of fundus image investigation cross-sectional dataset, CKD=Chronic kidney disease, CMERC-HI=Cardiovascular and metabolic disease etiology research center-high risk, South Korea, CMR=Cardiac magnetic resonance, CNN=Convolutional neural network, COACS=China suboptimal health cohort study, CRAE=Central renal artery equivalent, CRVE=Central retinal vein equivalent, CT=Computed tomography, CUHK-STDR=Chinese University of Hong Kong sight-threatening diabetic retinopathy study, CVD=Cardiovascular disease, CVS=Cardiovascular system, DBP=Diastolic BP, DLA=Deep learning algorithm, DM=Diabetes mellitus, Dunedin=Dunedin multidisciplinary health and development study, DVA=Dynamic retinal vessel analysis, EDV=End-diastolic volume, eGFR=Estimated glomerular filtration rate, FRS=Framingham risk score, GFR=Glomerular filtration rate, GUSTO=Growing up in Singapore toward healthy outcomes study, GWAS=Genome-wide association study, HbA1c=Glycated hemoglobin, HCT=Hematocrit, HF=Heart failure, HKCES=Hong Kong children eye study, HPC-SNUH=Health Promotion Center of Seoul National University Hospital, HTN=Hypertension, IRED=Retinal imaging in renal disease study, KHSS=Korean health screening study, LV=Left ventricle/ventricular, LVEDV=left ventricular end-diastolic volume, MACE=Major adverse cardiac events, MCHC=Mean corpuscular hemoglobin, MI=Myocardial infarction, PCE=Pooled cohort equation, PheWAS=Phenome-wide association study, PMC=Philip medical center, South Korea, RFP=Retinal fundus photography, RICP=Retinal imaging in chest pain study, SBP=S8888ystolic BP, SBRIA=Seoul National University Bundang Hospital Retina Image Archive, SEED=The Singapore epidemiology of eye diseases study, SHEH=Shenyang He Eye Hospital, SiDRP=Singapore integrated diabetic retinopathy program, SIVA=Singapore I vessel assessment, SMH=Severance Main Hospital, SNUBH=Seoul National University Bundang Hospital, SP2=Singapore Prospective Study Program, UKBB=UK Biobank
The Current State of the Art
Cardio-oculomics
The eye is a unique and singularly captivating organ. Noninvasively, it boasts the only directly observable vascular system in the human body: the retinal microvasculature, which is promoted as a surrogate indicator of CVD.[56] Changes in the shape, color, or caliber of the retinal vessels may be associated with ocular manifestations of CV health and systemic conditions like HTN,[57] or chronic kidney disease (CKD).[58]
Oculomics is an approach integrating big data as retinal images with DLAs. Clinical ophthalmology is spoiled for choice in imaging. Nonexhaustively, there exists direct, indirect, and indirect biomicroscopic ophthalmoscopy, ocular photography, retinal fundus photographs/photography (RFP), fundus autofluorescence, optical coherence tomography (OCT),[59,60] and fluorescein or OCT angiography (OCT-A). Of these, RFP and OCT have been heavily used in oculomics due to a confluence of factors: cost, ease of capture, and information density. RFPs are conveniently captured, noninvasive, and inexpensive. They provide high-resolution images of the retinal blood vessels, retina, and optic nerve. Changes in these areas are significantly associated with CVD risk.[61] On the other hand, OCT uses low-coherence light to capture high-resolution images of ocular morphology. A recent review found 94 open-access ocular datasets, with the most common modalities being RFP (54/94) and OCT/OCT-A (18/94).[62] Our review observed the same trend with most of the DLAs assessed [Table 1].
Cardiovascular disease outcomes
While there are numerous types of CVDs (https://www.nhs.uk/conditions/cardiovascular-disease/, Accessed 31 January 2023), the major ones targeted by DLA appear to be coronary artery disease (characterized by atherosclerosis), stroke, ischemic CVD, and cardiomyopathies. A recent review lists their ocular manifestations.[63] This could be because other CVDs lack sufficiently strong retinal manifestations or they warrant further investigation. Most of the reviewed DLAs target risk factor predictions and biomarker discoveries.
Deep learning
ML drives various facets of modern technology, from web searches to shopping recommendations and trip planning. It is pervasive in everyday devices such as smartphones and smart watches and can identify objects in images, transcribe speech to text, and monitor personal health. However, the capacity of ML techniques to ingest and use raw data is limited.
To function, the ML code must explicitly direct the algorithm to look for specified solutions (i.e., labels) in data that fit certain patterns. The significant degree of domain expertise and effort typically required to code these labels restricts their application. Researchers have developed DL, a newer generation of algorithms, to surmount this problem and are now increasingly using them to analyze natural data autonomously [Figure 1].
Figure 1.

The progression of artificial intelligence. DL is a subset of ML, which is a subset of AI. DL uses statistical methods to abstract layers iteratively from unfiltered natural data without being explicitly instructed. We show the year of major progress in each generation at the bottom. DL: Deep learning, ML: Machine learning, AI: artificial intelligence
DL – a more sophisticated subfield of ML – is a computational model built on ML that performs data representations with multiple levels of abstraction by creating artificial neural networks (NNs) and deep NNs. A DLA can automatically discover, delineate, and extract the features required for pattern recognition (i.e., representation learning).[64] It first creates a representation layer from raw data, which it uses to create the next representation layer at a higher abstraction level without requiring features to be explicitly coded for, unlike in ML [Figure 2]. This permits end-to-end learning on complex datasets and the discovery of subtle details that likely escape human attention. DLAs have produced significantly higher accuracies in several domains and key advances in solving problems that have bested ML algorithms.
Figure 2.

The workflow of a deep learning system. DL mimics the neuronal structure and is analogous to human learning. We can broadly divide it into the feature extraction and classification phases, which are performed unsupervised. Inputs (in blue) are first subsampled to generate feature representations (in red). The initial lower layers (light red) recognize basic features in the raw data, such as edges and objects, while the higher layers identify meaningful outputs (dark red). Iterating through this process nonlinearly composes sufficient layers to amplify relevant features and suppress irrelevant ones. This design was modeled on the neuronal structure of the human brain and analogous to how human learning functions: we learn the structure and laws of the natural world mostly by observation, not by explicit instruction. One aspect of DL that improves on previous neural networks is the ability to process hierarchical features to enable accurate feature classification (in red). The multitude of “interneuron” connections represents the nonlinear abstractions the model performs. Example eye image from https://commons.wikimedia.org/w/index.php?title = File: A_blue_eye.jpg&oldid=705280508 (accessed 31 January 2023). DL: Deep learning
One substantial problem facing the interpretability of DLA results is how the results were derived. A saliency map is an image highlighting how important each pixel of the input image was to a given convolutional layer, with the more influential pixels being colored brighter, for example. This sheds light on what the DLA sought in any input and should correspond to the key edges for object detection in the input. This takes the form of a heatmap superimposed on the input image, with colored pixels concentrated on pixels of interest to the DLA [Figure 3]. This visualization technique shows which intermediate DLA layers produced which patterns to explain the outcome. Some techniques to produce saliency maps include the deconvolutional network approach,[50] image-specific class saliency,[65] guided backpropagation,[66] and Grad-Class Activation Mapping.[67]
Figure 3.

Example of a simple saliency map. (a) Source image. (b) Saliency map. Brightly colored pixels influenced the classification most significantly. The saliency map is concentrated on concentric circles that map closely to major edges in the source image, starting from the pupil in the middle to the edges of the iris immediately surrounding it, the edges of the sclera, and the general contour of the eye. Because the pixels in the pupil are the brightest, the pupils are more important in predicting the output of this classifier. We generated the saliency map using a convolutional neural network that is 19 layers deep pretrained on more than one million images from the ImageNet database, the VGG-19 ConvNet,[34] using PyTorch 1.13.1. Example eye image from https://commons.wikimedia.org/w/index.php?title=File: A_blue_eye.jpg&oldid=705280508 (accessed 31 January 2023)
Discussion
We reviewed 17 recent studies that developed cardio-oculomic DLAs that accept ocular images to predict CVD outcomes. We summarized the study descriptors and key findings in Table 1. Some studies generated and discussed saliency maps which highlighted the most relevant areas used for predictions. We summarized these areas of the eye in Figure 4.
Figure 4.
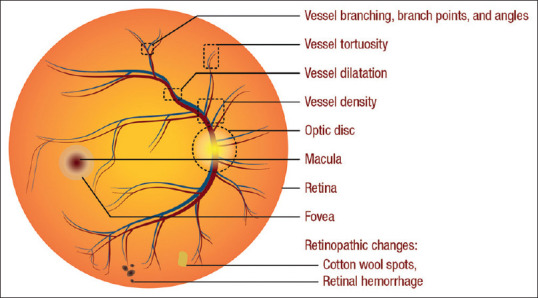
Ocular areas of importance in deep learning predictions of cardiovascular disease, risks, and risk factors. Saliency maps generated in the reviewed studies highlighted these areas [Table 1]
Predicting cardiovascular disease risk
Nusinovici et al. developed a novel DLA (RetiAGE) using retinal photographs to measure the biological age (BA) that risk stratified into quartiles for 10-year all-cause mortality, cancer mortality, and CVD mortality independent of chronological age and phenotypic markers. Compared to patients in the RetiAGE first quartile, patients in the RetiAGE fourth quartile had a 67% higher risk of 10-year all-cause mortality (hazard ratio [HR] = 1.67 [95% confidence interval [CI] = 1.42–1.95]), 60% higher risk of cancer mortality (HR = 1.60 [95% CI = 1.31–1.96]), and 39% and 18% higher risk of CVD and cancer events, respectively (HR = 1.39 [95% CI = 1.14–1.69]), all independent of chronological age and phenotypic markers. They determined that changes in the macula, optic disc margin, and arcade vessels were most responsible for the predictions. Nusinovici et al. externally validated this against one dataset: RetiAGE performance in predicting the probability of being ≥65 years old had an excellent result in their internal testing set (Korean; area under the receiver operating characteristic curve [AUROC] = 0.968 [95% CI 0.965–0.970]), but a poorer performance in their external validation set due to ethnic differences (Caucasian; AUROC = 0.756 [95% CI 0.753–0.759]).[48] The main benefits of this study are: their novel approach to establish BA using retinal photographs (which is far less invasive, costly, and time-consuming versus traditional BA biomarkers) and an extension to predict CVD-related mortality and morbidity beyond traditional BA biomarkers. The decrease in AUROC in the external validation set was mainly attributed to ethnic differences and recall bias in the baseline CVD and cancer ground truth of the external validation dataset. The limitations of this study were the inability to risk stratify based on ethnicity and the inability to process poorer quality RFPs, which may limit the model’s real-world performance, which usually includes a significant proportion of ungradable RFPs.[4]
Zekavat et al. discovered that lower (≥2 standard deviation below the mean) fractal branching or microvascular density was associated with a higher risk of incident mortality (HR, 1.83 [95% CI, 1.39–2.42]), stratified by type 2 diabetes mellitus (T2DM) or HTN. Lower fractal branching was more strongly correlated with incident mortality among patients with T2DM or HTN (HR = 1.83 [95% CI = 1.46–2.3]; P = 2.01 × 1−7) than those without either comorbidity (HR = 1.29 [95% CI, 1.03–1.62]; P = 0.03, Pheterogeneity = 1.36 × 10⁻²⁰). Both findings were adjusted for age, age squared, sex, smoking status, and ethnicity. They extended their study to guide phenome-wide association studies, genome-wide association studies (GWAS), and Mendelian randomization analyses based on DLA findings and identified multiple new potential therapeutic targets. The strengths of this study are: DLAs may be used to understand retinal microvasculature, retinal microvasculature indices may be clinically relevant as CVD risk biomarkers, and the genetic origins of these indices may be avenues for novel therapies. Future cardio-oculomic studies may consider adopting this extension of phenotypic and genotypic analyses. The limitations include the possibility of confounders from conditions that affect RFP quality (for example, cataracts, optical media opacities, and fundus pigmentation), the lack of external validation, and the irreproducibility of GWAS data due to a paucity of datasets.
Myocardial infarction
Diaz-Pinto et al. developed a multimodal DLA trained on a binary dataset of retinal and cardiovascular magnetic resonance (CMR) images to predict future myocardial infarction (MI) accurately (area under the curve [AUC] = 0.80 ± 0.02, sensitivity = 0.74 ± 0.02, and specificity = 0.71 ± 0.03) using only retinal images and demographic data, through the left ventricular mass and left ventricular end-diastolic volume, to a standard comparable to established CVD risk assessment models, externally validated against one dataset. The retinal vessels were the most contributory feature. Crucially, the external validation revealed that DLA performance improved with lower AMD severity and was maximized in the complete absence of AMD, which would otherwise have masked salient macula features. While they employed a novel approach of a previously unused multimodal DLA that jointly learned a latent space between RFPs and CMR images,[51] there is room to work toward granular stratification of CVD risk in these patients as this was a preliminary proof of concept study. Diaz-Pinto et al. acknowledged that the availability of multimodal data was the primary limiting factor in their study design. This study strongly supports our view that there may be many important findings to be discovered at the intersection of cardio-oculomics and that external validation may shed light on previously unconsidered performance-impacting factors.
Stroke
Zhu et al. showed that DLA based on RFP alone gives estimates comparable to the clinical risk factor-based model (AUC = 0.676 vs. AUC = 0.661, and P = 0.511) in stroke prediction based on targeting decreased central retinal artery equivalent (CRAE) and arteriolar-to-venule ratio, and that microvasculature may contain signs of ocular end-organ damage. The authors defined the retinal age gap as the retinal age predicted from RFP minus chronological age, whereby a positive retinal age gap indicated a retina appearing “older” than expected. This study is novel in proving the association between the retinal age gap and stroke risk. However, the authors note that the UKBB training set they used leaned toward younger participants, which may limit generalizability in the stroke context. Although this study could benefit from external validation,[53] it supports the notion that the retina is a good window to systemic CVS changes.[68-70]
Predicting cardiovascular disease risk factors
Several models showed predictive capability over the CVD factors of age, sex, smoking, body mass index (BMI), and dyslipidemia. The models picked up vessel features the most and investigated theCRAE and central retinal vein equivalent (CRVE) from a new angle. The single CVD most explored was HTN, among a broad spectrum of other morbidities [Table 1].
Hypertension, hyperglycemia, and dyslipidemia
Retinal microvascular abnormalities are manifestations of accumulative vascular damage from CVD risk factors such as HTN and aging.[56,71] Poplin et al. performed an early study showing that CVD risk factors of systolic blood pressure (SBP; mean absolute error [MAE] within 11.23 mmHg), age (MAE within 3.26 years), sex (AUROC = 0.97), smoking status (AUROC = 0.71), and major adverse cardiac events (MACE) (MACE; AUROC = 0.70) are present and accurately quantifiable in RFPs alone. The quantifiability of these signals forms the largest impact of this work, which was further improved when clinical parameters were integrated. However, Poplin et al. stopped short of evaluating if their DLA could prospectively predict incident CVD from RFP. This study was limited to images with a 45° field of view and a relatively small training dataset.[24] Dai et al. showed the same (AUROC = 0.6506, accuracy = 60.94%, specificity = 51.54%, precision = 59.27%, and recall = 70.48%), but the performance differed, possibly due to different ethnic populations, HTN phenotypes, and limited by a smaller training dataset.[30] Both studies produced saliency maps that agreed on vessel predominance, with Dai et al. emphasizing the arteriole branch points. Zhang et al. predicted hyperglycemia (AUROC = 0.880 and accuracy = 78.7%), HTN (AUROC = 0.766 and accuracy = 68.8%), and dyslipidemia (AUROC = 0.703 and accuracy = 66.7%) accurately, but could not specify salient features. Poplin et al.’s study may have included bias in the form of self-reported smoking status; likewise, Zhang et al.’s study may have included bias from self-reported questionnaire results.[44] While Poplin and Dai et al.’s works support retinal vessel features being a window to CVS health, all three studies may benefit from external validation to gauge the extent of the generalizability of their novel findings.
Zhang et al. also performed a prospective study for DLA performance in T2DM prediction, achieving excellent results on an external test set for metadata-only (AUROC = 0.796 [95% CI, 0.779–0.814]), fundus-only (AUROC = 0.854 [95% CI, 0.839–0.871]), and combined model (AUROC = 0.871 [95% CI, 0.856–0.885]). Interestingly, they extended their study to include images captured through smartphones: metadata-only (AUROC = 0.762 [95% CI, 0.732–0.786]), fundus-only (AUROC = 0.820 [95% CI, 0.788–0.853]), and combined model (AUROC = 0.845 [95% CI, 0.822–0.869]), which show the robustness of their DLA in using suboptimally captured images. Further investigations suggested that DLA could detect T2DM through RFP before any apparent clinical manifestation of DR and that they could quantify the blood glucose levels from RFP alone. Saliency maps suggested scattered pixels of interest, with some corresponding to classic DR features. However, the authors noted that their DLA appeared to not rely heavily on the features described by the Early Treatment Diabetic Retinopathy Study (ETDRS) standards, as it performed comparably in patients without ETDRS-defined DR.[72] They externally validated this on two datasets (dataset 1: R2 = 0.481, Pearson’s correlation coefficient (PCC) = 0.700, and MAE = 12; dataset 2: R2 = 0.327, PCC = 0.577, and MAE = 11.8).[45] This study supports the use of DLAs for earlier detection of disease, which is especially clinically useful for typically silent conditions like CKD (until its late stages).[35,73]
Predicting subclinical markers
Atherosclerosis
Chang et al., using atherosclerosis as a proxy for HTN,[74] accurately predicted atherosclerosis from RFP (AUROC = 0.713, sensitivity = 0.583, and specificity = 0.891), showing that this prediction is an independent predictor of CVD mortality when adjusted for the FRS and an independent predictor of CVD mortality. Saliency maps showed the predominance of the retinal vessels, disc rim, cup-to-disc ratio, peripapillary atrophy, and cotton-wool spots. The strengths of this study lie in the novelty of predicting atherosclerosis using RFPs, the cross-sectional and longitudinal cohort study design, the use of novel over conventional risk factors, and the evaluation of concordance estimates of cohort analysis. These results were derived from a dataset that was skewed toward an older population, the DLA showed low accuracy and specificity at the designated atherosclerosis threshold, and had inaccuracy in estimating sudden CVDs.[39]
Son et al. demonstrated that DLA distinguishes patients with varying coronary artery calcium scores (CACS), with temporal retinal vasculature and the fovea being important features. Performance and distinguishing capability saturate at CACS >100, and patients with data from both eyes yielded more predictive results than patients with data from only one (bilateral RFP AUROC = 83.2% [95% CI 80.2%–86.3%], unilateral RFP AUROC = 82.3% [95% CI 79.5%–85.0%]). Interestingly, RFPs combined with existing patient biodata increased the AUROC to nearly 90%, which implied the presence of additional information within the RFPs that were unrelated to established risk factors. Both Chang and Son et al.’s studies were limited to the Asian ethnicity and warrant external validation.[42]
Next, Rim et al. developed a novel DLA (RetiCAC) to show that RFP can classify CACS, stratify CVD risk, and calculate ischemic CVD scores; the first study to compare DLA to clinical guidelines. They showed that RFP alone was sufficient for CAC prediction, with performance comparable to the current computed tomography (CT) scans (AUROC = 0.742, [95% CI 0.732–0.753]). The three-tier RetiCAC score ranged from 0 to 1, with a high value suggesting a high probability of CAC. DLA showed an incremental prognostic performance over the PCE in borderline- and intermediate-risk groups. DLA identified hemorrhage and cotton-wool spots as important features.[37] This used very different datasets and algorithms from Chang et al. and Son et al.’s studies, albeit with similar results, suggesting the likelihood of possible common biomarker discovery between them.[39] However, it is still unknown if RFP can predict future CVD events. The strengths of this study include robust external validation against four datasets, which greatly increased its generalizability.
Cheung et al. developed a novel DLA (SIVA-DL System) that performed similarly to expert graders in measuring CRAE and CRVE. This study confirmed previously known findings regarding wider CRVE and showed narrower CRAE is associated with increased CVD incidents but is novel as it employed a DLA quantification strategy to revisit CRAE and CRVE. Their multivariable linear regression analysis of CVD risk factors (dependent variable) and retinal vascular caliber (independent variable) includes age (coefficient of determination, R2 0.195–0.212), sex (R2 0.063–0.089), mean arterial blood pressure (R2 0.199–0.201), BMI (R2 0.244–0.251), glycated hemoglobin (HbA1c, R2 0.202–0.215), smoking status (R2 = 0.045), and total cholesterol (R2 0.067–0.069). The strengths of this study comprise large and diverse clinical samples, training on images of varying quality and source, a complete DLA solution, and robust external validation against multiethnic 10 datasets.[47]
Later, Tseng et al. built on previous work to validate RetiCAC as a marker for CVD (RetiCVD). Using the RetiCAC results as ground truth, RetiCVD stratified CVD risk in the general population with ≥10% 10-year CVD risk, who are likely to benefit from the preventative CVD interventions. Patients with a QRISK3 score between 7.5% and 10% could use RetiCVD as a risk stratification enhancer for identifying high-risk patients for aggressive CVD intervention.[55]
Age and sex
Poplin et al. showed that the macula, optic disc, peripapillary area, and large blood vessels in the posterior pole were used by their DLA to predict age (R2 = 0.74) and sex (R2 = 0.82).[24] Kim et al. later proved that DLA-detectable retinal changes triggered by aging, and those affected by systemic vascular diseases differ in pathophysiology. Their DLA-predicted age (R2 = 0.92 and MAE = 3.06 years) and sex were accurate (AUROC > 0.96). However, their saliency maps did not explain which components affected sex and age classification.[32] Neither study conducted external validation. Rim et al. later concurred that optic disc and retinal vessels are biomarkers for age (R2 0.36–0.83 and MAE 2.43–4.50) and sex (AUROC 0.80–0.96). They externally validated this study against four datasets.[37]
Smoking status
Vaghefi et al. accurately predicted smoking status (AUROC = 0.86, sensitivity = 62.62%, and specificity = 93.87%) from RFPs with saliency maps showing retinal vasculature, perivascular region, and fovea predominance. This model suffered from low sensitivity and was not externally validated.[28]
Alcohol status
Zhang et al. also predicted alcohol status (AUROC = 0.948 and accuracy = 0.863), defined as individuals who currently consumed alcohol and had >12 drinks in the past year with the caveat that the ground truth was based on self-reported drinking history, which may have been influenced by recall bias and/or patient candor.[44]
Body mass index
Rim et al. showed that optic discs are biomarkers for BMI (R2 0.01–0.17 and MAE 2.15–3.52) and externally validated this against four datasets.[37]
Detecting diseases
Chronic kidney disease
Homology between the eye and the kidney suggests that microvascular changes that result in the development of CKD are mirrored in both organs and that the targeting of at-risk patients may be improved with oculomics.[68]
Sabanayagam et al. used two-field retinal images to predict CKD (defined as glomerular filtration rate [eGFR] <60 mL/min per 1.73 m2), highlighting the saliency of venule dilatation, vessel rarefaction, and retinopathic changes (hybrid DLA for the validation set AUROC = 0.928 [95% CI 0.917–0.959], SP2 testing set AUROC = 0.733 [95% CI 0.776–0.844], and BES testing set AUROC = 0.858 [95% CI 0.794–0.922]). They extended the work to show that accounting for RFP images and risk factor metadata has comparable predictive power for CKD risk assessment (hybrid DLA for DM subgroup AUROC = 0.925 [95% CI 0.893–0.957] and HTN subgroup AUROC = 0.918 [95% CI 0.794–0.922]).[35] Extensions of this study could solidify the use of RFP to detect CKD in the community or primary-care settings. This study was limited by the lack of albuminuria ground truth, multiple eGFR measurements (for accurate CKD classification), and cost-effectiveness studies.
Zhang et al. predicted CKD onset (defined as eGFR ≥60 ml/min1 per 1.73 m2 with albuminuria or eGFR <60 ml/min per 1.73 m2) from physiologic baseline and showed that DLA could make diagnoses of early CKD from RFP on an external test set: metadata-only (AUROC = 0.800 [95% CI 0.780–0.824]), fundus-only (AUROC = 0.829 [95% CI, 0.811–0.849]), and combined model (AUROC = 0.848 [95% CI, 0.828–0.869]). Their DLA highlighted the use of the optic nerve, vessel branch points, and arterial-venous junctions. Once again, they extended their study to include images captured through smartphones: metadata-only (AUROC = 0.817 [95% CI 0.785–0.842]), fundus-only (AUROC = 0.870 [95% CI, 0.847–0.893]), and combined model (AUROC = 0.897 [95% CI, 0.855–0.902]).[45] Both Sabanayagam and Zhang et al.’s studies were externally validated against two different datasets, but all datasets used comprised Asian individuals.
Hematological diseases
Anemia causes ocular hypoxia, resulting in increased venous tortuosity, inflammation, and extravascular lesions of exudates, hemorrhages, and cotton-wool spots. Zhang et al.[44] showed that hematocrit (AUROC = 0.759 and accuracy = 0.698) and mean corpuscular hemoglobin (MCHC) concentration (MCHC; AUROC = 0.686 and accuracy = 0.605) could be predicted from RFP, paving the way for future hemato-oculomic studies. This was not externally validated. Rim et al. later showed that retinal vessels are biomarkers for hematocrit (R2 0.09–0.57, MAE 2.03–2.81) and hemoglobin (R2 0.06–0.56 and MAE 0.79-0.98), after externally validating their results against four datasets.[37]
These results have shown promise for early DLA detection and treatment of diseases that can slow or prevent progression to irreversible end-organ damage and/or mortality.
Advantages of deep learning algorithms in health care
In clinical practice and implementation, the attractiveness of targeting ocular images with DLA in recent years is due to noninvasiveness, time savings, cost efficiency, and information density.[75] Arguments for safety are further compounded by decreased exposure to radiation from scans; patient compliance and acceptance may also increase for those afraid of undergoing more invasive diagnostic modalities. Moreover, inter- and intraindividual variability in grading is difficult to eradicate even when under standardized protocols and training, whereas DLA is constant in performance over similar datasets.[76] Training and retaining professional graders come at a high investment cost, and there are too few trained graders in multiple regions worldwide.[77] DLA is also faster and always online, which surpasses human performance at availability and repetitive tasks.
In research and development, DLAs enable the pickup of salient minutiae that may escape the attention of the naked eye by operating on a pixel level. Some examples are increases in retinal microvasculature stiffness and venule alternations associated with high CAC accumulation.[42] These new biomarkers and correlations may support the generation of novel hypotheses.[49]
Clinical and technical challenges
Several challenges stand in the way of transforming cardio-oculomic DLA from a research-intensive and limited-access technology to an economic, ubiquitous application. Indubitably, no “perfect” software exists, and DLAs do not have to overcome all these problems exhaustively. Rather, we propose these as guidelines to lead efforts toward the ideal DLA.
Ethics
The real-world deployment of AI needs to consider ethical considerations[78] and be subjected to multidisciplinary evaluation.[79] Ting et al. identified three key issues surrounding the ethical deployment of AI: model transparency, liability arising from DLA use/misuse, and scalability.[80] In addition to the points Ting et al. discussed, we argue for the need for ethical equity in the form of ethnic inclusivity: racial minorities, not presently included in training datasets, may result in harm if a DLA trained on such datasets is clinically deployed for the care of such minorities. We strongly recommend the equitable inclusion of all ethnicities in various training sets where possible, although we understand that this is limited by financial and logistic considerations. Swarm learning[81] and federated learning[82,83] may be then used to overcome privacy regulations that prevent the sharing of certain datasets; these training techniques permit DLA training without the sharing of raw data.
Confounders
The presence of other ocular diseases, like AMD, has been shown to decrease the predictive capacity of DLA, presumably by obliterating the microvasculature signals DLAs depend on.[51]
Full-stack software
There is no full-stack, end-to-end DL model that accepts oculomic inputs and generates CVS outputs with minimal human interaction. However, the development of independent, open-source, and validated segmentation tools for CVS[84] and oculomics[85,86] is encouraging [Table 1]. For example, although inception-v3 was not developed for medical image recognition initially, it has been successfully used for classifying medical images based on transfer learning methods,[25,26] which include the classification of RFP.[4,24,27]
Training datasets
Few sufficiently large datasets include both eye and heart data for the same individual with both physiological and pathological individuals. In the available sufficiently large datasets, patient demographics are restricted to a specific geography, with authors echoing the need for more heterogenous datasets.[24,28]
Other issues include: the datasets for rarer diseases are naturally smaller; some CVDs may simply not have any biomarker that shows up on common ophthalmological imaging modalities; some datasets are limited in their imaging field of view, which may restrict the generalizability of the results obtained with other fields of view.[24]
While problems associated with small datasets might be partially mitigated through transfer learning, we recommend larger, more heterogenous datasets as the optimal solution. However, in generating new datasets, researchers may face patient consent and confidentiality issues. Data cybersecurity is also a concern: DLA training datasets are usually a magnitude of order larger than large clinical trials. The datasets must, therefore, be aggregated from multiple sources; hence, data security risks increase. Swarm and federated learning may also alleviate these problems.
External validation
Real-world performance on heterogenous populations has yet to be demonstrated for most models. The performance of predictions of different biomarkers such as sex, height, body weight, and SBP has been shown to differ when applied to samples from different races.[37] Due to the overall lack of data sharing in oculomics, most existing studies lack robust external validation [10 of 17 studies in Table 1]. Open access to validation datasets persists as a major unaddressed need in cardio-oculomics. Perhaps, the 94 open-source datasets reviewed by Khan et al. could be leveraged for additional validation and generalization.[62] Indeed, some studies showed it was possible to perform extensive external validation.[46,47]
Result interpretability
Researchers working with DL models sometimes struggle to acquire clinically intelligible features.[45] Better visualization tools are required to support real-time clinicians’ understanding of variables. This may come as more descriptive saliency maps,[28] which would also better explain regions deemed to be abnormal or substantiate differential diagnoses. However, reliably proving causation between the features identified by saliency and corresponding CVD predictions is complicated, despite the strong anatomical correlations between biomarker feature predictions.[28] Ghorbani et al. demonstrated that adversarial perturbations to input images led to identical outcomes but with significantly altered saliency maps,[87] which may easily happen in ocular screening due to inter- and intra-operator variability. Kindermans et al. showed unreliability in certain saliency maps;[88] Adebayo et al. showed further inconsistency in the evaluation metrics used in generating saliency maps themselves.[89] Saliency maps certainly still play important roles, but are an intermediate state of affairs until a more reliable explanatory tool is engineered.
Benchmarking and real-world performance
DLAs that have been trained on datasets that had poor-quality images excluded in data processing may vary in performance with real-world data, which is likely to have images of variable quality.[37] Similarly, DLAs trained on insufficiently heterogeneous datasets are likely to face performance degradation in real-world settings. In a very rare study, Lee et al. performed a head-to-head comparison of seven DLAs for DR screening and concluded that performance varied significantly, calling for rigorous testing before clinical deployment.[90]
The difficulty in comparing different DLAs lies in the variation in designs, accepted input formats, model architectures, and internal performance assessments used in different studies, which make universal benchmarks and meta-analyses challenging to perform. The current data sharing and medicolegal environment could be more conducive for DL research. Under the current climate, DLAs are often kept private, which limits the irreproducibility of results by independent groups.[47] Currently, the gold standard for comparison comes as professional graders; however, predicting some targets (like age or sex) from retinal photographs is not done in clinical practice [Table 1]. Neither has it been shown that human prediction of these targets is possible after training.
Clinical deployment
Clinical deployment remains a large hurdle of four major parts: medicolegal requirements from authorities, sensitivity and specificity in real-world performance, cost-effectiveness, and practical usage. DLA first needs to prove consistently high sensitivity and specificity vis-à-vis physicians and professional graders. Then, cost-effectiveness would have to be proven to justify using DLAs in clinical practice. None of the reviewed literature discussed cost or funding models; a further head-to-head comparison is necessary to derive the value per encounter of deploying a DLA to aid a clinical practice in the real world.[90] The practical usage of DLA should also be as seamless as possible for practitioners.
Patient and physician acceptance
Patients may be unfamiliar with and fear that DLA could make mistakes or perform inconsistently. Other social factors include technophobia, misinformation, lack of digital readiness and acceptance, and digital illiteracy, which may be addressed through better dissemination of health-care information.
Cardio-oculomics DLA bridges specialties; hence, DLA results must be sufficiently convincing to enable paradigm shifts: will cardiologists or renal physicians trust an eye screen enough?
Medical education will need to embrace DLA, just as CT scans and magnetic resonance imaging became taught in medical curricula, to buttress digital literacy among future medical professionals. DLA may also require a network of trained engineers to support and optimize systems.
Strengths, limitations, and delimitations
This targeted review has presented the latest cardio-oculomics DLAs that discover CVD biomarkers, predict CVD risk factors, and/or predict adverse CVD outcomes.
We also acknowledge the limitations faced and explain the delimitations chosen. For brevity, we opted “no” to fulfill the full PRISMA requirements; hence, our review is limited relative to a systematic review. It is also delimited by English, peer-reviewed full texts from January 2018 to January 2023. Given the rapidly growing nature of the field, this review may have missed out on research that was bleeding edge, did not undergo peer review, or was not published in full article form. We further restricted the definition of DL to exclude algorithms that required manual quantifications and a possible selection bias. Because meta-analyses were impossible (see Methods), the findings were discussed and evaluated narratively based on key findings, biomarkers and CVD outcomes, external validation, and key metrics.
Research gaps and recommendations
We recommend researchers to use large, heterogenous datasets where possible to address the issue of generalizability, to perform genotypic and phenotypic investigations where applicable to better understand the pathophysiology of the disease,[49] and to perform more real-world validation, like those performed for subfields such as glaucoma and DR screening. Lastly, regulatory bodies could focus on developing a medicolegal framework and universal benchmarks.
Deep integration
We envision an ideal DLA-augmented pipeline resembling [Figure 5]. A comprehensive DL model should extract germane considerations from electronic medical records (EMR) such as patient history,[44] physical examination, laboratory investigations,[91] and socioeconomic status.[92] The commonly performed ocular screenings would first be piped into a DLA for automated segmentation and identification of features with the production of saliency maps to guide physician advice. A second DLA integrates the multifactorial input to stratify risk and outputs intervention advice. This pipeline may increase the granularity of individualized precision medicine by accounting for minute details in the entire patient encounter and improve health-care outcomes by optimizing intervention.
Figure 5.

Proposed deep learning algorithm-powered clinical pathway. The automated DL segmentation pipeline accepts inputs from ocular screening centers and generates statistics based solely on ocular data. The added value comes from integrating the multifactorial input with patient history and physical examination from physicians, weighed by the deep learning algorithm, to yield multifactorial risk stratification and early intervention in cardiovascular disease. DL: Deep learning
Unrealized advantages of deep learning algorithms in health care
We envision that once optimized, high-throughput cost savings can be obtained with economies of scale since imaging hardware is already in place, and screening data are routinely captured at the community level. Eventually, CVD risk, risk factors, subclinical markers, and associated diseases could be detected early from ocular imaging available in every optician and eye clinic. Further, EMR-integrated DLAs may augment high-throughput analysis pipelines in areas with high population densities. Conversely, a streamlined DLA loaded onto a mobile workstation may extend specialty care into areas with low health-care access.[93]
Conclusions
The eye is a well-defined, information-rich, noninvasively accessible portal into CVD insights – well-exploitable with the current advances in ocular imaging, computational processing, and digital network traffic. Aptly, clinical medicine and patient needs are headed, where DLAs are likely to come in exceptionally effective owing to the increasing number of factors accounted for in clinical practice. This is especially so when combining information-rich imaging modalities with the analytical power of DLAs to redefine what the eye can reveal about CVD.
This review of selected DLAs showed the development of very different DLA strategies and primary datasets to arrive at four major types of predictions: first, predicting CVD risks of MI and stroke, second, predicting CVD risk factors of HTN, third, predicting subclinical markers of atherosclerosis, age, sex, smoking status, alcohol status, and BMI, and fourth, detecting renal and hematological diseases.
The studies strongly support the notion that cardio-oculomics is relatively unexplored but holds great potential in early disease detection, prediction, and screening.[35,44,45,48,51] Further common strengths include that external validation reliably: is crucial to generalizability, can aid the discovery of performance-changing parameters, and decreases performance due to ethnic[48] or age[53] differences in underlying datasets. Different DLAs appear to detect common features even in different datasets, suggesting the possibility of universal markers.[39,42,46] In some instances, combining binocular images with patient metadata (for example, age, sex, and HTN) increased AUROC.[42] The studies also showed a clear preference in RFPs as a modality [Table 1]. Common limitations include the lack of relevant datasets,[49] lack of external validation,[24,30,39] difficulty in dataset sharing,[47] and limiting input data to only high-quality images or certain fields of view.[24]
On a broader note, while the breadth of strategies observed is extremely encouraging in spirit, it exacerbates the problem of benchmarking and objective evaluation with physicians and professional graders being the closest to universal standards, necessitating better-shared datasets and the development of universal criteria. Lastly, relatively less-explored CVDs (i.e., left ventricular hypertrophy) merit more investigation.
We believe the further development and optimization of interdisciplinary DLAs will improve individualized patient outcomes and medical resource allocations. While the unaddressed challenges cloud its real-world utility, DL as applied to cardio-oculomics risk profiling remains exciting, disruptive, and likely impactful.
Financial support and sponsorship
This work received support from the Agency for Science, Technology, and Research (A*STAR) under its RIE2020 Health and Biomedical Sciences (HBMS) Industry Alignment Fund PrePositioning (IAF-PP) Grant No. H20c6a0031 and the Academic Medicine – Enhancing Training, Health care, Outcomes, and Standards (AM-ETHOS) Duke-NUS Medical Student Fellowship Award (AY2022–AY2023) (AM-ETHOS01/FY2022/39-A39). Any opinions, findings, conclusions, or recommendations expressed in this material are those of the author(s) and do not reflect the views of the A*STAR or the AM-ETHOS.
Conflicts of interest
The authors declare that there are no conflicts of interest in this article.
Acknowledgments
The authors thank all peer reviewers and editors for their opinions and suggestions.
References
- 1.Baro E, Degoul S, Beuscart R, Chazard E. Toward a literature-driven definition of big data in healthcare. Biomed Res Int. 2015;2015:639021. doi: 10.1155/2015/639021. [DOI] [PMC free article] [PubMed] [Google Scholar]
- 2.Litjens G, Kooi T, Bejnordi BE, Setio AA, Ciompi F, Ghafoorian M, et al. Asurvey on deep learning in medical image analysis. Med Image Anal. 2017;42:60–88. doi: 10.1016/j.media.2017.07.005. [DOI] [PubMed] [Google Scholar]
- 3.Cheng CY, Soh ZD, Majithia S, Thakur S, Rim TH, Tham YC, et al. Big data in ophthalmology. Asia Pac J Ophthalmol (Phila) 2020;9:291–8. doi: 10.1097/APO.0000000000000304. [DOI] [PubMed] [Google Scholar]
- 4.Gulshan V, Peng L, Coram M, Stumpe MC, Wu D, Narayanaswamy A, et al. Development and validation of a deep learning algorithm for detection of diabetic retinopathy in retinal fundus photographs. JAMA. 2016;316:2402–10. doi: 10.1001/jama.2016.17216. [DOI] [PubMed] [Google Scholar]
- 5.Abràmoff MD, Lou Y, Erginay A, Clarida W, Amelon R, Folk JC, et al. Improved automated detection of diabetic retinopathy on a publicly available dataset through integration of deep learning. Invest Ophthalmol Vis Sci. 2016;57:5200–6. doi: 10.1167/iovs.16-19964. [DOI] [PubMed] [Google Scholar]
- 6.Gargeya R, Leng T. Automated identification of diabetic retinopathy using deep learning. Ophthalmology. 2017;124:962–9. doi: 10.1016/j.ophtha.2017.02.008. [DOI] [PubMed] [Google Scholar]
- 7.Ting DS, Cheung CY, Lim G, Tan GS, Quang ND, Gan A, et al. Development and validation of a deep learning system for diabetic retinopathy and related eye diseases using retinal images from multiethnic populations with diabetes. JAMA. 2017;318:2211–23. doi: 10.1001/jama.2017.18152. [DOI] [PMC free article] [PubMed] [Google Scholar]
- 8.Burlina PM, Joshi N, Pekala M, Pacheco KD, Freund DE, Bressler NM. Automated grading of age-related macular degeneration from color fundus images using deep convolutional neural networks. JAMA Ophthalmol. 2017;135:1170–6. doi: 10.1001/jamaophthalmol.2017.3782. [DOI] [PMC free article] [PubMed] [Google Scholar]
- 9.Grassmann F, Mengelkamp J, Brandl C, Harsch S, Zimmermann ME, Linkohr B, et al. Adeep learning algorithm for prediction of age-related eye disease study severity scale for age-related macular degeneration from color fundus photography. Ophthalmology. 2018;125:1410–20. doi: 10.1016/j.ophtha.2018.02.037. [DOI] [PubMed] [Google Scholar]
- 10.Li F, Wang Z, Qu G, Song D, Yuan Y, Xu Y, et al. Automatic differentiation of Glaucoma visual field from non-glaucoma visual filed using deep convolutional neural network. BMC Med Imaging. 2018;18:35. doi: 10.1186/s12880-018-0273-5. [DOI] [PMC free article] [PubMed] [Google Scholar]
- 11.Dagenais GR, Leong DP, Rangarajan S, Lanas F, Lopez-Jaramillo P, Gupta R, et al. Variations in common diseases, hospital admissions, and deaths in middle-aged adults in 21 countries from five continents (PURE): A prospective cohort study. Lancet. 2020;395:785–94. doi: 10.1016/S0140-6736(19)32007-0. [DOI] [PubMed] [Google Scholar]
- 12.Yusuf S, Joseph P, Rangarajan S, Islam S, Mente A, Hystad P, et al. Modifiable risk factors, cardiovascular disease, and mortality in 155 722 individuals from 21 high-income, middle-income, and low-income countries (PURE): A prospective cohort study. Lancet. 2020;395:795–808. doi: 10.1016/S0140-6736(19)32008-2. [DOI] [PMC free article] [PubMed] [Google Scholar]
- 13.Wilson PW, D'Agostino RB, Levy D, Belanger AM, Silbershatz H, Kannel WB. Prediction of coronary heart disease using risk factor categories. Circulation. 1998;97:1837–47. doi: 10.1161/01.cir.97.18.1837. [DOI] [PubMed] [Google Scholar]
- 14.Hippisley-Cox J, Coupland C, Brindle P. Development and validation of QRISK3 risk prediction algorithms to estimate future risk of cardiovascular disease: Prospective cohort study. BMJ. 2017;357:j2099. doi: 10.1136/bmj.j2099. [DOI] [PMC free article] [PubMed] [Google Scholar]
- 15.SCORE2 working group and ESC Cardiovascular risk collaboration. SCORE2 risk prediction algorithms: New models to estimate 10-year risk of cardiovascular disease in Europe. Eur Heart J. 2021;42:2439–54. doi: 10.1093/eurheartj/ehab309. [DOI] [PMC free article] [PubMed] [Google Scholar]
- 16.Coke LA, Himmelfarb CD. Guideline on the primary prevention of cardiovascular disease: Let's get it into practice!J Cardiovasc Nurs. 2019;34:285–8. doi: 10.1097/JCN.0000000000000586. [DOI] [PubMed] [Google Scholar]
- 17.Hemann BA, Bimson WF, Taylor AJ. The Framingham Risk Score: An appraisal of its benefits and limitations. Am Heart Hosp J. 2007;5:91–6. doi: 10.1111/j.1541-9215.2007.06350.x. [DOI] [PubMed] [Google Scholar]
- 18.Selvarajah S, Kaur G, Haniff J, Cheong KC, Hiong TG, va aaf Y, et al. Comparison of the Framingham Risk Score, score and WHO/ISH cardiovascular risk prediction models in an Asian population. Int J Cardiol. 2014;176:211–8. doi: 10.1016/j.ijcard.2014.07.066. [DOI] [PubMed] [Google Scholar]
- 19.Lloyd-Jones DM, Braun LT, Ndumele CE, Smith SC, Jr, Sperling LS, Virani SS, et al. Use of risk assessment tools to guide decision-making in the primary prevention of atherosclerotic cardiovascular disease: A special report from the American Heart Association and American College of Cardiology. Circulation. 2019;139:e1162–77. doi: 10.1161/CIR.0000000000000638. [DOI] [PubMed] [Google Scholar]
- 20.Gerszten RE, Wang TJ. The search for new cardiovascular biomarkers. Nature. 2008;451:949–52. doi: 10.1038/nature06802. [DOI] [PubMed] [Google Scholar]
- 21.Jill Hopkins J, Keane PA, Balaskas K. Delivering personalized medicine in retinal care: From artificial intelligence algorithms to clinical application. Curr Opin Ophthalmol. 2020;31:329–36. doi: 10.1097/ICU.0000000000000677. [DOI] [PubMed] [Google Scholar]
- 22.Kalra G, Kar SS, Sevgi DD, Madabhushi A, Srivastava SK, Ehlers JP. Quantitative imaging biomarkers in age-related macular degeneration and diabetic eye disease: A step closer to precision medicine. J Pers Med. 2021;11:1161. doi: 10.3390/jpm11111161. [DOI] [PMC free article] [PubMed] [Google Scholar]
- 23.Weintraub WS, Daniels SR, Burke LE, Franklin BA, Goff DC, Jr, Hayman LL, et al. Value of primordial and primary prevention for cardiovascular disease: A policy statement from the American Heart Association. Circulation. 2011;124:967–90. doi: 10.1161/CIR.0b013e3182285a81. [DOI] [PubMed] [Google Scholar]
- 24.Poplin R, Varadarajan AV, Blumer K, Liu Y, McConnell MV, Corrado GS, et al. Prediction of cardiovascular risk factors from retinal fundus photographs via deep learning. Nat Biomed Eng. 2018;2:158–64. doi: 10.1038/s41551-018-0195-0. [DOI] [PubMed] [Google Scholar]
- 25.Kermany DS, Goldbaum M, Cai W, Valentim CC, Liang H, Baxter SL, et al. Identifying medical diagnoses and treatable diseases by image-based deep learning. Cell. 2018;172:1122–31. doi: 10.1016/j.cell.2018.02.010. [DOI] [PubMed] [Google Scholar]
- 26.Chang J, Yu J, Han T, Chang HJ, Park E. A Method for Classifying Medical Images Using Transfer Learning: A Pilot Study on Histopathology of Breast Cancer 2017. IEEE 19th International Conference on e-Health Networking, Applications and Services (Healthcom); 2017. pp. 1–4. [Google Scholar]
- 27.Li Z, Keel S, Liu C, He Y, Meng W, Scheetz J, et al. An automated grading system for detection of vision-threatening referable diabetic retinopathy on the basis of color fundus photographs. Diabetes Care. 2018;41:2509–16. doi: 10.2337/dc18-0147. [DOI] [PubMed] [Google Scholar]
- 28.Vaghefi E, Yang S, Hill S, Humphrey G, Walker N, Squirrell D. Detection of smoking status from retinal images;A Convolutional Neural Network study. Sci Rep. 2019;9:7180. doi: 10.1038/s41598-019-43670-0. [DOI] [PMC free article] [PubMed] [Google Scholar]
- 29.Ministry of Health. Diabetic Retinal Screening, Grading, Monitoring and Referral Guidance. Wellington: Ministry of Health; 2016. [Google Scholar]
- 30.Dai G, He W, Xu L, Pazo EE, Lin T, Liu S, et al. Exploring the effect of hypertension on retinal microvasculature using deep learning on East Asian population. PLoS One. 2020;15:e0230111. doi: 10.1371/journal.pone.0230111. [DOI] [PMC free article] [PubMed] [Google Scholar]
- 31.Ronneberger O, Fischer P, Brox T. U-Net: Convolutional Networks for Biomedical Image Segmentation. Medical Image Computing and Computer-Assisted Intervention–MICCAI 2015:18th International Conference, Munich, Germany, October 5-9, 2015, Proceedings, Part III 18: Springer. 2015:234–41. [Google Scholar]
- 32.Kim YD, Noh KJ, Byun SJ, Lee S, Kim T, Sunwoo L, et al. Effects of hypertension, diabetes, and smoking on age and sex prediction from retinal fundus images. Sci Rep. 2020;10:4623. doi: 10.1038/s41598-020-61519-9. [DOI] [PMC free article] [PubMed] [Google Scholar]
- 33.He K, Zhang X, Ren S, Sun J. Deep Residual Learning for Image Recognition. 2016 IEEE Conference on Computer Vision and Pattern Recognition (CVPR) 2016:770–78. [Google Scholar]
- 34.Son J, Shin JY, Kim HD, Jung KH, Park KH, Park SJ. Development and validation of deep learning models for screening multiple abnormal findings in retinal fundus images. Ophthalmology. 2020;127:85–94. doi: 10.1016/j.ophtha.2019.05.029. [DOI] [PubMed] [Google Scholar]
- 35.Sabanayagam C, Xu D, Ting DS, Nusinovici S, Banu R, Hamzah H, et al. Adeep learning algorithm to detect chronic kidney disease from retinal photographs in community-based populations. Lancet Digit Health. 2020;2:e295–302. doi: 10.1016/S2589-7500(20)30063-7. [DOI] [PubMed] [Google Scholar]
- 36.Xu D, Lee ML, Hsu W. Propagation Mechanism for Deep and Wide Neural Networks. Proceedings of the IEEE/CVF Conference on Computer Vision and Pattern Recognition. 2019:9220–8. [Google Scholar]
- 37.Rim TH, Lee G, Kim Y, Tham YC, Lee CJ, Baik SJ, et al. Prediction of systemic biomarkers from retinal photographs: Development and validation of deep-learning algorithms. Lancet Digit Health. 2020;2:e526–36. doi: 10.1016/S2589-7500(20)30216-8. [DOI] [PubMed] [Google Scholar]
- 38.Xu K, Ba J, Kiros R, Cho K, Courville A, Salakhudinov R, et al. Show, attend and tell: Neural image caption generation with visual attention. Int Conf Mach Learn PMLR. 2015;37:2048–57. [Google Scholar]
- 39.Chang J, Ko A, Park SM, Choi S, Kim K, Kim SM, et al. Association of cardiovascular mortality and deep Learning-Funduscopic atherosclerosis score derived from retinal fundus images. Am J Ophthalmol. 2020;217:121–30. doi: 10.1016/j.ajo.2020.03.027. [DOI] [PubMed] [Google Scholar]
- 40.Chollet F. Xception: Deep learning with depthwise separable convolutions. Proc IEEE Conf Comput Vis Pattern Recognit 2017. :1251–8. [Google Scholar]
- 41.Russakovsky O, Deng J, Su H, Krause J, Satheesh S, Huang Z, et al. ImageNet large scale visual recognition challenge. Int J Comput Vis. 2015;115:211–52. [Google Scholar]
- 42.Son J, Shin JY, Chun EJ, Jung KH, Park KH, Park SJ. Predicting high coronary artery calcium score from retinal fundus images with deep learning algorithms. Transl Vis Sci Technol. 2020;9:28. doi: 10.1167/tvst.9.2.28. [DOI] [PMC free article] [PubMed] [Google Scholar]
- 43.Agatston AS, Janowitz WR, Hildner FJ, Zusmer NR, Viamonte M, Jr, Detrano R. Quantification of coronary artery calcium using ultrafast computed tomography. J Am Coll Cardiol. 1990;15:827–32. doi: 10.1016/0735-1097(90)90282-t. [DOI] [PubMed] [Google Scholar]
- 44.Zhang L, Yuan M, An Z, Zhao X, Wu H, Li H, et al. Prediction of hypertension, hyperglycemia and dyslipidemia from retinal fundus photographs via deep learning: A cross-sectional study of chronic diseases in central China. PLoS One. 2020;15:e0233166. doi: 10.1371/journal.pone.0233166. [DOI] [PMC free article] [PubMed] [Google Scholar]
- 45.Zhang K, Liu X, Xu J, Yuan J, Cai W, Chen T, et al. Deep-learning models for the detection and incidence prediction of chronic kidney disease and type 2 diabetes from retinal fundus images. Nat Biomed Eng. 2021;5:533–45. doi: 10.1038/s41551-021-00745-6. [DOI] [PubMed] [Google Scholar]
- 46.Rim TH, Lee CJ, Tham YC, Cheung N, Yu M, Lee G, et al. Deep-learning-based cardiovascular risk stratification using coronary artery calcium scores predicted from retinal photographs. Lancet Digit Health. 2021;3:e306–16. doi: 10.1016/S2589-7500(21)00043-1. [DOI] [PubMed] [Google Scholar]
- 47.Cheung CY, Xu D, Cheng CY, Sabanayagam C, Tham YC, Yu M, et al. Adeep-learning system for the assessment of cardiovascular disease risk via the measurement of retinal-vessel calibre. Nat Biomed Eng. 2021;5:498–508. doi: 10.1038/s41551-020-00626-4. [DOI] [PubMed] [Google Scholar]
- 48.Nusinovici S, Rim TH, Yu M, Lee G, Tham YC, Cheung N, et al. Retinal photograph-based deep learning predicts biological age, and stratifies morbidity and mortality risk. Age Ageing. 2022;51:afac065. doi: 10.1093/ageing/afac065. [DOI] [PMC free article] [PubMed] [Google Scholar]
- 49.Zekavat SM, Raghu VK, Trinder M, Ye Y, Koyama S, Honigberg MC, et al. Deep learning of the retina enables phenome- and genome-wide analyses of the microvasculature. Circulation. 2022;145:134–50. doi: 10.1161/CIRCULATIONAHA.121.057709. [DOI] [PMC free article] [PubMed] [Google Scholar]
- 50.Zeiler MD, Fergus R. Visualizing and understanding convolutional networks. In: Fleet D, Pajdla T, Schiele B, Tuytelaars T, editors. Computer Vision –ECCV. Cham: Springer International Publishing; 2014. 2014. pp. 818–33. [Google Scholar]
- 51.Diaz-Pinto A, Ravikumar N, Attar R, Suinesiaputra A, Zhao Y, Levelt E, et al. Predicting myocardial infarction through retinal scans and minimal personal information. Nat Mach Intell. 2022;4:55–61. [Google Scholar]
- 52.Antelmi L, Ayache N, Robert P, Lorenzi M. Sparse multi-channel variational autoencoder for the joint analysis of heterogeneous data. Int Conf Mach Learn PMLR. 2019;97:302–11. [Google Scholar]
- 53.Zhu Z, Hu W, Chen R, Xiong R, Wang W, Shang X, et al. Retinal age gap as a predictive biomarker of stroke risk. BMC Med. 2022;20:466. doi: 10.1186/s12916-022-02620-w. [DOI] [PMC free article] [PubMed] [Google Scholar]
- 54.Zhu Z, Shi D, Guankai P, Tan Z, Shang X, Hu W, et al. Retinal age gap as a predictive biomarker for mortality risk. Br J Ophthalmol. 2023;107:547–54. doi: 10.1136/bjophthalmol-2021-319807. [DOI] [PubMed] [Google Scholar]
- 55.Tseng RM, Rim TH, Shantsila E, Yi JK, Park S, Kim SS, et al. Validation of a deep-learning-based retinal biomarker (Reti-CVD) in the prediction of cardiovascular disease: Data from UK Biobank. BMC Med. 2023;21:28. doi: 10.1186/s12916-022-02684-8. [DOI] [PMC free article] [PubMed] [Google Scholar]
- 56.Wong TY, Klein R, Klein BE, Tielsch JM, Hubbard L, Nieto FJ. Retinal microvascular abnormalities and their relationship with hypertension, cardiovascular disease, and mortality. Surv Ophthalmol. 2001;46:59–80. doi: 10.1016/s0039-6257(01)00234-x. [DOI] [PubMed] [Google Scholar]
- 57.Cheung CY, Tay WT, Mitchell P, Wang JJ, Hsu W, Lee ML, et al. Quantitative and qualitative retinal microvascular characteristics and blood pressure. J Hypertens. 2011;29:1380–91. doi: 10.1097/HJH.0b013e328347266c. [DOI] [PubMed] [Google Scholar]
- 58.Sabanayagam C, Shankar A, Koh D, Chia KS, Saw SM, Lim SC, et al. Retinal microvascular caliber and chronic kidney disease in an Asian population. Am J Epidemiol. 2009;169:625–32. doi: 10.1093/aje/kwn367. [DOI] [PubMed] [Google Scholar]
- 59.Waheed NK, Jeng-Miller K, Duker JS. Optical coherence tomography. In: Sadda SR, Schachat AP, Wilkinson CP, Hinton DR, Wiedemann P, Freund KB, et al., editors. Ryan's Retina. 7th ed. Vol. 1 Elsevier Health Sciences; 2022. [Google Scholar]
- 60.Kaakour AH, Kaiser PK. Optical coherence tomography in retinal imaging. In: Yanoff M, Duker JS, editors. Ophthalmology. 6th ed. Ch. 6.7. Elsevier; 2023. pp. 415–20. [Google Scholar]
- 61.Wong TY, Kamineni A, Klein R, Sharrett AR, Klein BE, Siscovick DS, et al. Quantitative retinal venular caliber and risk of cardiovascular disease in older persons: The cardiovascular health study. Arch Intern Med. 2006;166:2388–94. doi: 10.1001/archinte.166.21.2388. [DOI] [PubMed] [Google Scholar]
- 62.Khan SM, Liu X, Nath S, Korot E, Faes L, Wagner SK, et al. Aglobal review of publicly available datasets for ophthalmological imaging: Barriers to access, usability, and generalisability. Lancet Digit Health. 2021;3:e51–66. doi: 10.1016/S2589-7500(20)30240-5. [DOI] [PMC free article] [PubMed] [Google Scholar]
- 63.Singh RB, Saini C, Shergill S, Agarwal A. Window to the circulatory system: Ocular manifestations of cardiovascular diseases. Eur J Ophthalmol. 2020;30:1207–19. doi: 10.1177/1120672120914232. [DOI] [PubMed] [Google Scholar]
- 64.LeCun Y, Bengio Y, Hinton G. Deep learning. Nature. 2015;521:436–44. doi: 10.1038/nature14539. [DOI] [PubMed] [Google Scholar]
- 65.Simonyan K, Vedaldi A, Zisserman A. Deep Inside Convolutional Networks: Visualising Image Classification Models and Saliency Maps. 2014 [Google Scholar]
- 66.Springenberg JT, Dosovitskiy A, Brox T, Riedmiller M. Striving for simplicity: The all convolutional net. arXiv. 2014 [Google Scholar]
- 67.Selvaraju RR, Cogswell M, Das A, Vedantam R, Parikh D, Batra D. Grad-cam: Visual explanations from deep networks via gradient-based localization. Proceedings IEEE Int Conf Comput Vis. 2017;10:618–26. [Google Scholar]
- 68.Farrah TE, Dhillon B, Keane PA, Webb DJ, Dhaun N. The eye, the kidney, and cardiovascular disease: Old concepts, better tools, and new horizons. Kidney Int. 2020;98:323–42. doi: 10.1016/j.kint.2020.01.039. [DOI] [PMC free article] [PubMed] [Google Scholar]
- 69.Xu X, Wang B, Ren C, Hu J, Greenberg DA, Chen T, et al. Recent progress in vascular aging: Mechanisms and its role in age-related diseases. Aging Dis. 2017;8:486–505. doi: 10.14336/AD.2017.0507. [DOI] [PMC free article] [PubMed] [Google Scholar]
- 70.Sierra C, Coca A, Schiffrin EL. Vascular mechanisms in the pathogenesis of stroke. Curr Hypertens Rep. 2011;13:200–7. doi: 10.1007/s11906-011-0195-x. [DOI] [PubMed] [Google Scholar]
- 71.Wong TY, Islam FM, Klein R, Klein BE, Cotch MF, Castro C, et al. Retinal vascular caliber, cardiovascular risk factors, and inflammation: The Multi-Ethnic Study of Atherosclerosis (MESA) Invest Ophthalmol Vis Sci. 2006;47:2341–50. doi: 10.1167/iovs.05-1539. [DOI] [PMC free article] [PubMed] [Google Scholar]
- 72.Grading diabetic retinopathy from stereoscopic color fundus photographs –An extension of the modified Airlie House classification. ETDRS report number 10. Early Treatment Diabetic Retinopathy Study Research Group. Ophthalmology. 1991;98:786–806. [PubMed] [Google Scholar]
- 73.Tuot DS, Plantinga LC, Hsu CY, Jordan R, Burrows NR, Hedgeman E, et al. Chronic kidney disease awareness among individuals with clinical markers of kidney dysfunction. Clin J Am Soc Nephrol. 2011;6:1838–44. doi: 10.2215/CJN.00730111. [DOI] [PMC free article] [PubMed] [Google Scholar]
- 74.Lonardo A, Nascimbeni F, Mantovani A, Targher G. Hypertension, diabetes, atherosclerosis and NASH: Cause or consequence? J Hepatol. 2018;68:335–52. doi: 10.1016/j.jhep.2017.09.021. [DOI] [PubMed] [Google Scholar]
- 75.Goutam B, Hashmi MF, Geem ZW, Bokde ND. A comprehensive review of deep learning strategies in retinal disease diagnosis using fundus images. IEEE Access. 2022;10:57796–823. [Google Scholar]
- 76.Krause J, Gulshan V, Rahimy E, Karth P, Widner K, Corrado GS, et al. Grader variability and the importance of reference standards for evaluating machine learning models for diabetic retinopathy. Ophthalmology. 2018;125:1264–72. doi: 10.1016/j.ophtha.2018.01.034. [DOI] [PubMed] [Google Scholar]
- 77.Campbell JP, Swan R, Jonas K, Ostmo S, Ventura CV, Martinez-Castellanos MA, et al. Implementation and evaluation of a tele-education system for the diagnosis of ophthalmic disease by international trainees. AMIA Annu Symp Proc. 2015;2015:366–75. [PMC free article] [PubMed] [Google Scholar]
- 78.Jobin A, Ienca M, Vayena E. The global landscape of AI ethics guidelines. Nat Mach Intell. 2019;1:389–99. [Google Scholar]
- 79.Abràmoff MD, Tobey D, Char DS. Lessons learned about autonomous AI: Finding a safe, efficacious, and ethical path through the development process. Am J Ophthalmol. 2020;214:134–42. doi: 10.1016/j.ajo.2020.02.022. [DOI] [PubMed] [Google Scholar]
- 80.Evans NG, Wenner DM, Cohen IG, Purves D, Chiang MF, Ting DS, et al. Emerging ethical considerations for the use of artificial intelligence in ophthalmology. Ophthalmol Sci. 2022;2:100141. doi: 10.1016/j.xops.2022.100141. [DOI] [PMC free article] [PubMed] [Google Scholar]
- 81.Warnat-Herresthal S, Schultze H, Shastry KL, Manamohan S, Mukherjee S, Garg S, et al. Swarm learning for decentralized and confidential clinical machine learning. Nature. 2021;594:265–70. doi: 10.1038/s41586-021-03583-3. [DOI] [PMC free article] [PubMed] [Google Scholar]
- 82.Rieke N, Hancox J, Li W, Milletarì F, Roth HR, Albarqouni S, et al. The future of digital health with federated learning. NPJ Digit Med. 2020;3:119. doi: 10.1038/s41746-020-00323-1. [DOI] [PMC free article] [PubMed] [Google Scholar]
- 83.Sheller MJ, Edwards B, Reina GA, Martin J, Pati S, Kotrotsou A, et al. Federated learning in medicine: Facilitating multi-institutional collaborations without sharing patient data. Sci Rep. 2020;10:12598. doi: 10.1038/s41598-020-69250-1. [DOI] [PMC free article] [PubMed] [Google Scholar]
- 84.Tufvesson J, Hedström E, Steding-Ehrenborg K, Carlsson M, Arheden H, Heiberg E. Validation and development of a new automatic algorithm for time-resolved segmentation of the left ventricle in magnetic resonance imaging. Biomed Res Int. 2015;2015:970357. doi: 10.1155/2015/970357. [DOI] [PMC free article] [PubMed] [Google Scholar]
- 85.MMSegmentation Contributors. OpenMMLab Semantic Segmentation Toolbox and Benchmark [Computer software] 2020. [Last accessed on 2023 Jan 31]. Available from:https://github.com/open-mmlab/mmsegmentation .
- 86.Azad R, Asadi-Aghbolaghi M, Fathy M, Escalera S. Bi-directional ConvLSTM U-Net with densley connected convolutions. Proceedings IEEE/CVF Int Conf Comput Vis Workshops. 2019;10:406–15. [Google Scholar]
- 87.Ghorbani A, Abid A, Zou J. Interpretation of neural networks is fragile. Proceedings AAAI Conf Artif Intell. 2019;33:3681–8. [Google Scholar]
- 88.Kindermans PJ, Hooker S, Adebayo J, Alber M, Schütt K T, Dähne S, et al. The (un) reliability of saliency methods. Explainable AI: Interpreting, Explaining and Visualizing Deep Learning. Cham: Springer International Publishing;2019. :267–80. [Google Scholar]
- 89.Adebayo J, Gilmer J, Muelly M, Goodfellow I, Hardt M, Kim B. Sanity checks for saliency maps. Adv Neural Inf Process Syst. 2018;31 [Google Scholar]
- 90.Lee AY, Yanagihara RT, Lee CS, Blazes M, Jung HC, Chee YE, et al. Multicenter, head-to-head, real-world validation study of seven automated artificial intelligence diabetic retinopathy screening systems. Diabetes Care. 2021;44:1168–75. doi: 10.2337/dc20-1877. [DOI] [PMC free article] [PubMed] [Google Scholar]
- 91.Gerrits N, Elen B, Craenendonck TV, Triantafyllidou D, Petropoulos IN, Malik RA, et al. Age and sex affect deep learning prediction of cardiometabolic risk factors from retinal images. Sci Rep. 2020;10:9432. doi: 10.1038/s41598-020-65794-4. [DOI] [PMC free article] [PubMed] [Google Scholar]
- 92.Minhas AM, Jain V, Li M, Ariss RW, Fudim M, Michos ED, et al. Family income and cardiovascular disease risk in American adults. Sci Rep. 2023;13:279. doi: 10.1038/s41598-023-27474-x. [DOI] [PMC free article] [PubMed] [Google Scholar]
- 93.Gilbert C, Rahi J, Eckstein M, O'Sullivan J, Foster A. Retinopathy of prematurity in middle-income countries. Lancet. 1997;350:12–4. doi: 10.1016/S0140-6736(97)01107-0. [DOI] [PubMed] [Google Scholar]