

Abstract
Background:
Determining amyloid positivity is possible with cerebrospinal fluid and brain imaging of amyloid, but these methods are invasive and expensive.
Objective:
To relate plasma amyloid β (Aβ), measured using Single-molecule array (Simoa™) assays, to in-vivo brain Aβ, measured using Positron Emission Tomography (PET), examine the accuracy of plasma Aβ to predict brain Aβ positivity, and the relation of APOE-ε4 with plasma Aβ.
Research Design and Methods:
We performed a cross-sectional analysis in a cohort of 345 late middle-aged Hispanic men and women (age 64 years, 72% women). Our primary plasma variable was Aβ42/Aβ40 ratio measured with Simoa. Brain Aβ burden was measured as global SUVR with 18F-Florbetaben PET examined continuously and categorically.
Results:
Plasma Aβ42/Aβ40 ratio was inversely associated with global Aβ SUVR (β = − 0.13, 95% Confidence Interval (CI): −0.23, −0.03; p = 0.013) and Aβ positivity (Odds Ratio: 0.59, 95% CI: 0.38, 0.91; p = 0.016), independent of demographics and APOE-ε4. ROC curves (AUC = 0.73, 95% CI: 0.64, 0.82; p < 0.0001), showed that the optimal threshold for plasma Aβ42/Aβ40 ratio in relation to brain Aβ positivity was 0.060 with a sensitivity of 82.4% and specificity of 62.8%. APOE-ε4 carriers had lower Aβ42/Aβ40 ratio and a higher Aβ positivity determined with the Aβ42/Aβ40 ratio threshold of 0.060.
Conclusion:
plasma Aβ42/Aβ40 ratio assayed using Simoa is weakly correlated with in-vivo brain amyloid, and has limited accuracy to screen for amyloid positivity and for studying risk factors of brain amyloid burden when in-vivo imaging is not feasible.
Keywords: Plasma, positron emission tomography, amyloid, brain, Alzheimer’s disease, middle age, Hispanics
INTRODUCTION
Decades of advances in Alzheimer’s disease (AD) research, particularly in cerebrospinal fluid (CSF) and brain imaging biomarkers [1, 2], have led to the dominance of brain amyloid as the main AD neuropathological construct, followed by tau and neurodegeneration [1]. These constructs feature prominently in the recent National Institute on Aging (NIA)/Alzheimer’s Association (AA) 2018 research framework [3]. This framework proposes to conduct research in which individuals are classified as having the Alzheimer’s continuum by amyloid positivity, defined by amyloid biomarkers. Determining amyloid positivity has been enabled by the widespread availability of accurate CSF and brain imaging markers of amyloid β (Aβ). As compared with cognitively normal individuals, patients with AD dementia show lower CSF Aβ42 concentration [4] and higher brain amyloid burden on amyloid positron emission tomography (PET) [5]. However, the use of CSF and PET biomarkers of amyloid status is limited by cost and by the relative burden of undergoing brain imaging with radiation exposure or lumbar puncture for the measurement of CSF biomarkers. Thus, inexpensive and safe blood-based biomarkers would be ideal for the ascertainment of Aβ-positivity status. More recently, ultrasensitive immunoassays coupled with mass spectrometry show greater promise [6]. For example, the commercially available Single-molecule array (Simoa™) is a novel method to measure Aβ40 and Aβ42 in plasma [7]. Whereas CSF and brain imaging biomarkers are relatively well-established and standardized in AD research, blood-based biomarkers need further development. Our primary objective was to examine the relation of plasma Aβ42/Aβ40 ratio, Aβ40 and Aβ42 measured using Simoa assays to in-vivo brain Aβ measured using PET in a late middle-aged Hispanic cohort. We also examined the accuracy of plasma Aβ to predict brain amyloid positivity determined quantitatively using PET imaging. Lastly, we explored whether the association between APOE-ε4 genotype and Aβ burden ascertained on PET could be replicated with plasma Aβ [8].
MATERIALS AND METHODS
Study Design and Population
This was a cross-sectional analysis of a community-based cohort of 345 participants of a study focusing on the relation of AD risk factors and brain amyloid in middle-aged Hispanics conducted at Columbia University Irving Medical Center (CUIMC) in New York City, recruited between 03/01/2016 and 07/31/2019 [9]. We targeted Hispanics because they are the most common ethnic group in the community surrounding CUIMC [10] and because there is a paucity of AD biomarkers studies in Non-Whites [1]. Participants were recruited from the community through various outreach activities, including presentations at churches and senior centers, posters at CUIMC and around the community, health fairs, and newspaper ads. Study research staff collaborated with the Community Engagement Core Resource of the Irving Institute for Clinical and Translational Research, the Clinical Translational Science Award at CUIMC, to conduct outreach in the community and promote the study. Recruitment was exclusively community-based and did not include recruitment from clinics or using electronic medical records. Inclusion criteria included men and women aged 55–69 years and who were able to undergo phlebotomy, clinical and neuropsychological assessments, 3T brain magnetic resonance imaging (MRI), and Positron Emission Tomography (PET) with the Aβ radioligand 18F-Florbetaben. Exclusion criteria were a dementia diagnosis, cancer diagnosis other than non-melanoma skin cancer, and MRI contraindications. We screened 659 potential participants; 114 (17.3%) declined to participate, 178 (27.0%) were ineligible, and 16 (2.4%) did not complete study procedures (Supplemental Figure 1). One additional participant (0.2%) was excluded from the analyses due to incomplete data on APOE-ε4 genotype, the most important genetic predictor of in-vivo brain amyloid burden [5]. Five (0.8%) participants were also excluded due to incomplete plasma Aβ data. The mean interval between amyloid PET and MRI was 15.8 ± 33.4 days and the mean interval between PET scan and phlebotomy was 14.0 ± 24.2 days.
Aβ plasma biomarkers
Our primary plasma variable of interest was plasma Aβ42/Aβ40 ratio, as is usual in studies examining plasma Aβ [11–13], but also examined plasma Aβ40 and Aβ42 individually. Plasma Aβ40 and Aβ42 were measured using the commercially available ultrasensitive Simoa™ assays performed by Quanterix™ (Billerica, MA, USA)[14] using frozen plasma aliquots. Aβ40 and Aβ42 were assayed together using a multiplex assay (Human Neurology 3-Plex Total). The Simoa Aβ40 and Aβ42 assays target the N-terminus of beta amyloid and different C-terminus detection antibodies specific to Aβ40 and Aβ42. Aβ42 (mean range: 0–400 pg/mL) has a lower limit of detection of 0.019–0.034 pg/mL, a reproducibility coefficient of variation (CV)=7.5% and repeatability CV=6.7% [14–17]. Aβ40 (mean range: 0–800 pg/mL) has a lower limit of detection of 0.16 pg/mL, a reproducibility CV=5.1% and repeatability CV=3.5% [17–19]. All samples were diluted 4-fold for Aβ42 and 8-fold for Aβ40 using a proper sample diluent (PBS containing carrier protein and detergent) for measurement.
Brain Aβ
Brain Aβ burden was ascertained as global standardized uptake value ratio (SUVR) measured with 18F-Florbetaben PET. MRI was conducted for automatic delineation of the ROI in the PET images. MRI images were acquired in a General Electric Signa Premier 3T scanner and processed with FreeSurfer (v6.0 http://surfer.nmr.mgh.harvard.edu/). Participants underwent 18F-Florbetaben PET imaging in a Siemens Biograph64 mCT/PET scanner (target dose: 8.1 mCi; 4×5 minute frames; iterative reconstruction algorithm; voxel size: 1.6×1.6×1mm3. Images were acquired over 20 minutes starting 90 minutes post-injection. Dynamic PET frames (4 scans) were aligned to the first frame using rigid-body registration and a static PET image was obtained by averaging the four registered frames. The static PET image was then registered with the CT scan obtained for attenuation correction during PET imaging reconstruction by rigid-body registration with information theoretic cost function to generate a fused image with skull. The structural T1-weighted image in FreeSurfer space was registered to the CT/PET fused image using normalized mutual information and six degrees of freedom. A combination of the two transformation matrices obtained from the two rigid-body registrations was used to transfer all Freesurfer regional masks and the cerebellar gray matter from FreeSurfer space to static PET image space using nearest neighbor interpolation [20]. The standardized uptake value (SUV), defined as the decay-corrected brain radioactivity concentration normalized for injected dose and body weight, was calculated in all FreeSurfer regions. The SUV in each region as well as each voxel was normalized to the SUV in cerebellar gray matter to derive the regional and voxel-wise SUVR. Overall mean Aβ burden was calculated from voxel-based, individual region of interests (ROI), including lateral temporal cortex, parietal cortex, cingulate cortex, and frontal cortex.
We categorized Aβ as positive using an SUVR threshold of 1.34 [9], determined using the K-means clustering method, which identifies the partition between the 2 peaks in the Aβ SUVR distribution and quantitatively determines Aβ positivity (Figure 1, Panel A).
Figure 1:
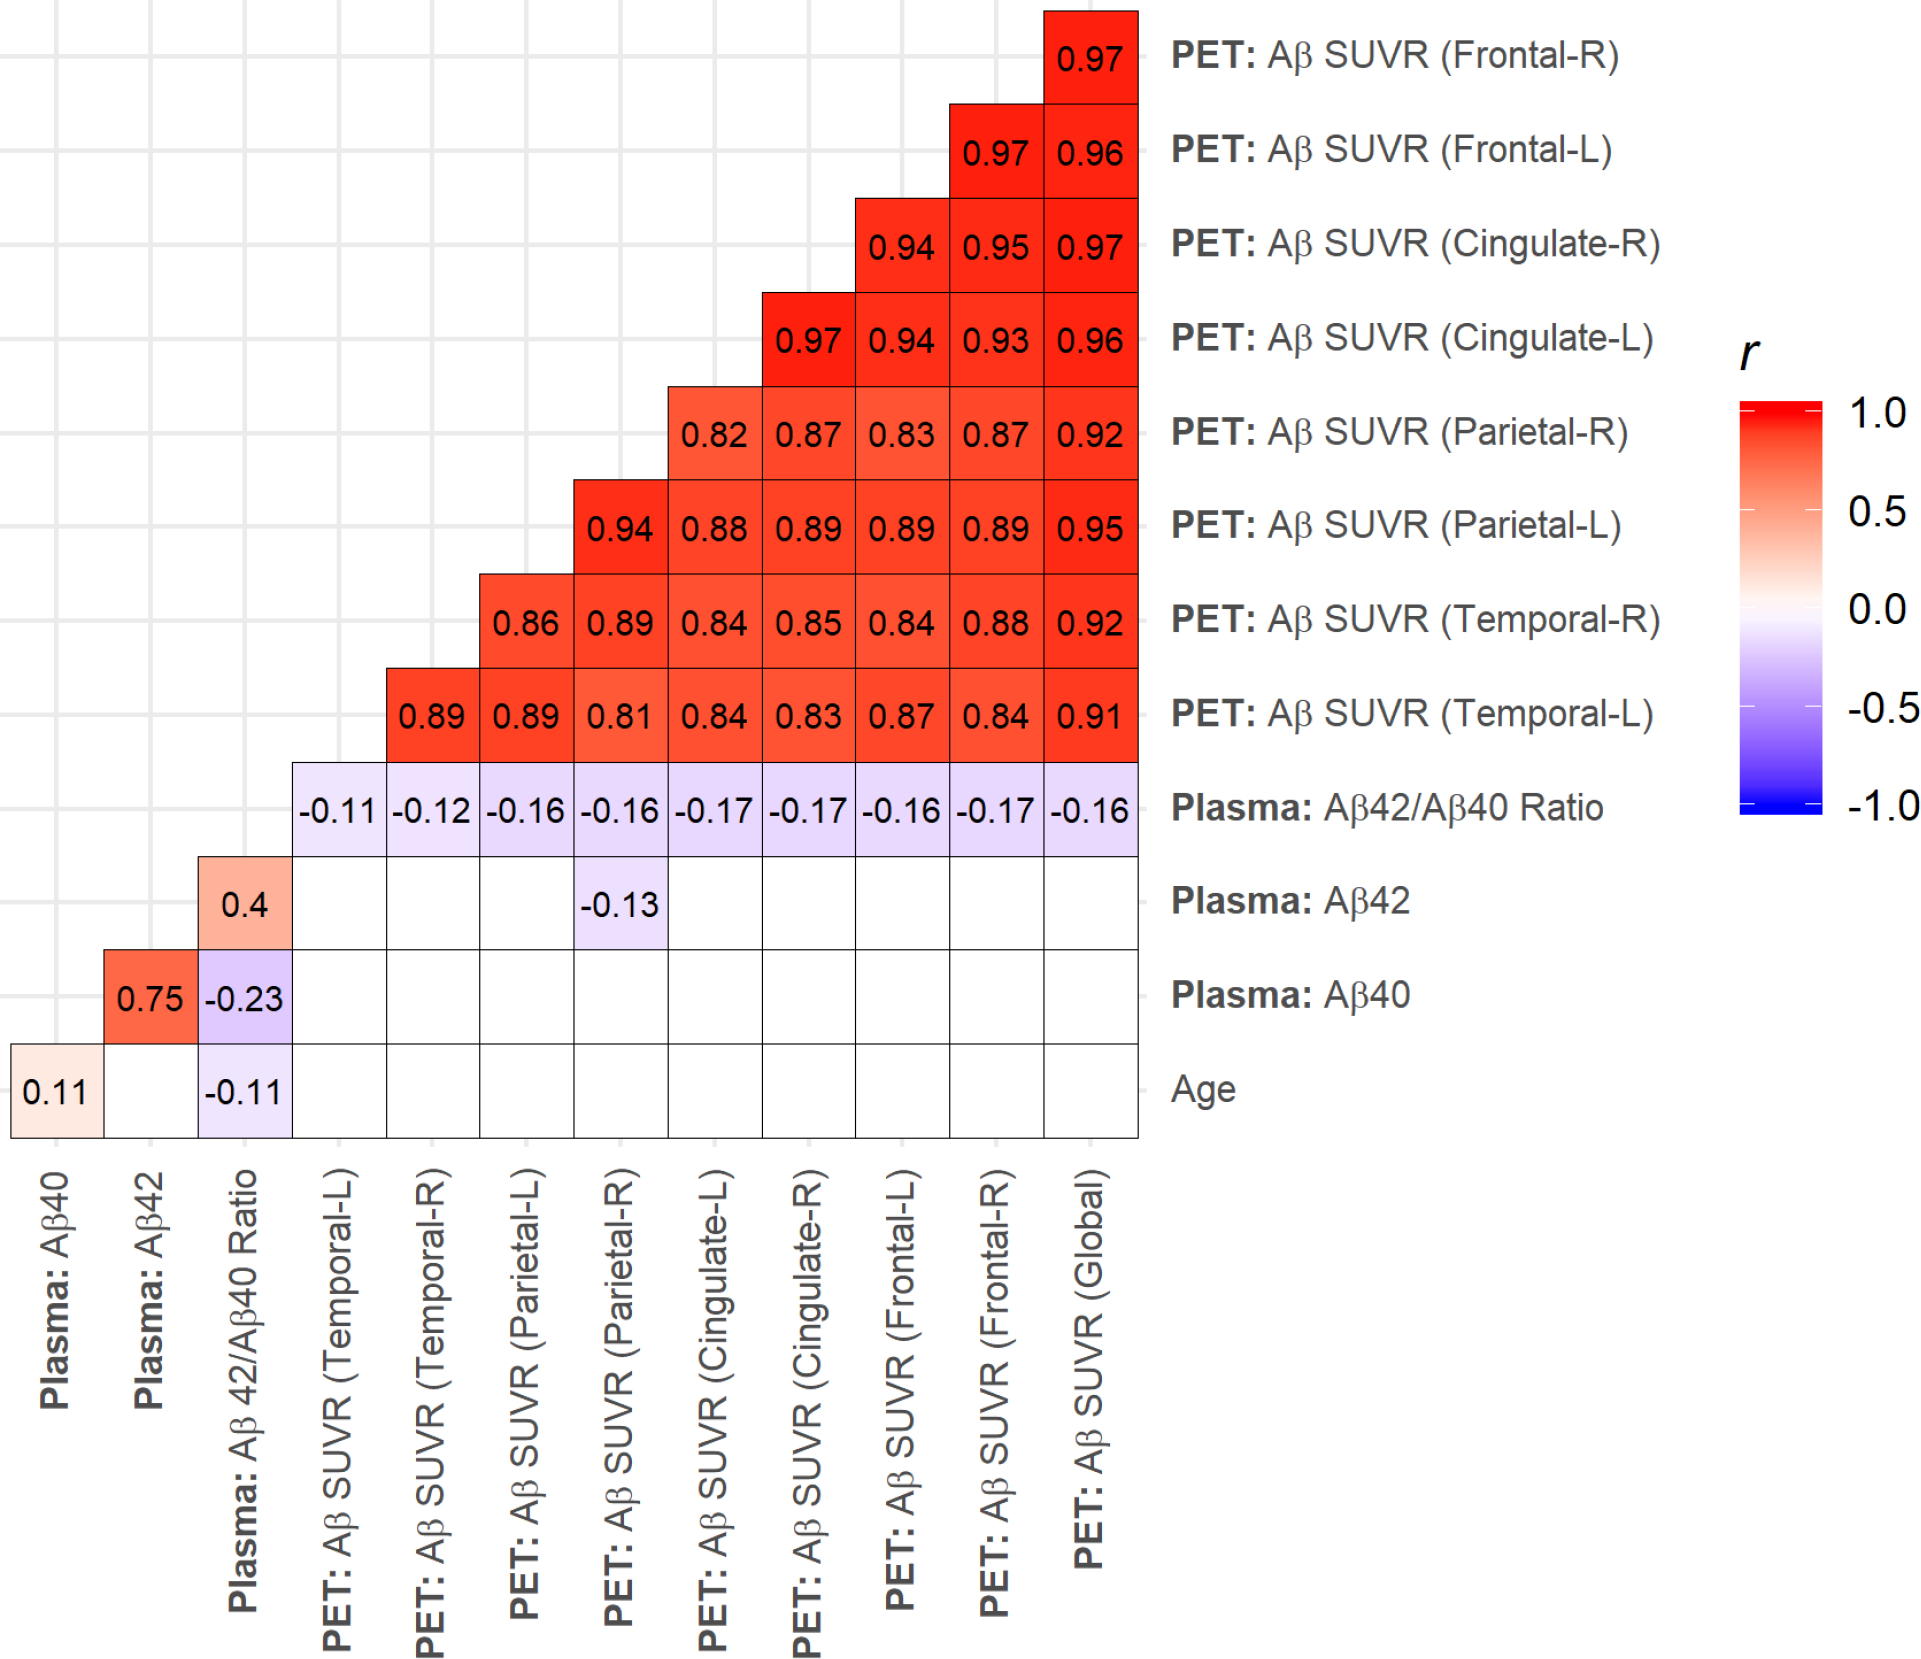
Pearson correlations for age, plasma amyloid β (Aβ) Aβ40, Aβ42, plasma Aβ42/Aβ40 ratio, and global Aβ standardized uptake value ratio (SUVR) measured with 18F-Florbetaben Positron Emission Tomography (PET) imaging in Hispanic baseline (BL) imaging visits (n = 345). Shaded cells indicate significant correlations (p < 0.05).
Covariates
We examined age, education, Hispanic subgroup, and APOE-ε4 genotype, and cystatin C as covariates. Hispanic subgroup was classified following the format of the 2010 Census by country or region of origin (e.g. Mexican, Puerto Rican, Cuban, Dominican) [21]. APOE-ε4 genotyping was conducted by LGC genomics (Beverly, MA) using single nucleotide polymorphisms rs429358 and rs7412. Cystatin C was measured in serum using a particle enhanced immune turbidimetric assay (Cobas Integra 400 plus; Roche Diagnostics, Indianapolis, IN).
The rationale for the covariates is as follows. Age, sex, and education are important predictors of dementia. APOE-ε4 genotype is the strongest risk factor for sporadic dementia due to AD [22], and also the strongest determinant of in-vivo amyloid burden [8, 23]. Thus, we also examined APOE-ε4 genotype as an exposure in relation to Aβ burden ascertained on PET and in plasma. We used cystatin as a measure of renal function to explore whether renal function affected plasma Aβ levels.
Statistical analyses
Global Aβ SUVR (Supplemental Figure 2, Panel A) had a bimodal distribution while plasma Aβ40 (Supplemental Figure 2, Panel C), Aβ42 (Supplemental Figure 2, Panel D), and Aβ42/Aβ40 ratio (Supplemental Figure 2, Panel B) were normally distributed. Descriptive analysis used chi-squared and ANOVA tests to examine differences in demographic characteristics across brain Aβ positivity categories. Pearson correlation coefficients were used to explore the relationship between brain Aβ (both globally and regionally) and plasma Aβ. Correlations were reported as both unadjusted and age-adjusted partial correlations. The association of APOE-ε4 carrier status with brain and plasma Aβ was examined using t-tests. The relationship between plasma Aβ and continuous brain Aβ SUVR was evaluated using multivariable linear regression. The association between plasma Aβ and brain Aβ positivity was examined with multivariable logistic regression. We also examined Cohen’s D effect size to evaluate the standardized difference in plasma Aβ means between brain Aβ positivity groups. Models were adjusted for age, sex, and APOE-ε4 carrier status. We examined plasma Aβ40, Aβ42, and Aβ42/Aβ40 ratio by increments of 1 standard deviation in relation to the outcome. The justification for standardizing the exposures and outcomes was that examining unit increments yielded significant but very small coefficients. We conducted additional sensitivity analyses adjusting models for Cystatin C to control for renal function.
We also assessed the accuracy with which plasma Aβ could predict brain Aβ positivity through the use of receiver operating characteristic (ROC) curves, plotting the true positive rate of these predictions against the false positive rate. The area under these curves (AUC) is a measure of each model’s ability to distinguish between brain Aβ positivity and negativity, where a higher AUC represents a more accurate prediction. These results were compared to the accuracy of APOE-ε4 carrier status in similarly predicting brain Aβ positivity. We calculated 95% confidence intervals for AUC values using stratified bootstrap samples (n = 1000). The general significance of AUC curves was determined using a Wilcoxon test [24]. AUC values were compared using a nonparametric approach outlined in DeLong et al [25]. We determined the optimal value for plasma Aβ42/Aβ40 ratio corresponding with amyloid positivity by identifying which plasma Aβ42/Aβ40 ratio value maximized sensitivity and specificity of the corresponding ROC curve. We calculated the positive predictive value (PPV) and negative predictive value (NPV) for each of these values. Statistical significance was considered at p < 0.05. Analyses were conducted using SAS version 9.4m5 and R version 3.6.0.
RESULTS
The mean age of the sample was 64.1 ± 3.3 years, 72% were women, and the APOE-ε4 carrier prevalence was 35.7% (Table 1). There were no differences in demographic variables between Aβ-negative and Aβ-positive participants (ascertained with PET), but as expected, the prevalence of APOE-ε4 carriers among Aβ-positive participants was more than twice that among Aβ-negative participants. Plasma Aβ40 levels were similar across Aβ positive and Aβ negative participants. Plasma Aβ42 and Plasma Aβ42/Aβ40 ratio were approximately 10% lower among Aβ positive participants compared with Aβ negative participants. Similarly, there were small effect sizes between Aβ positive and Aβ negative participants for Plasma Aβ40 (d = 0.01) levels, while the same differences for Plasma Aβ42 (d = 0.37) and Plasma Aβ42/Aβ40 ratio (d = 0.55) were much larger.
Table 1.
Descriptive statistics for entire sample and by amyloid β (Aβ) positivity determined from Aβ positron emission tomography. Aβ positivity was by k-means clustering (SUVR = 1.34).
| Characteristic | Entire Sample (n = 345) | Aβ Negative (n = 317) | Aβ Positive (n = 28) | p-value |
|---|---|---|---|---|
| Age, mean (SD), yr. | 64.13 (3.32) | 64.06 (3.33) | 64.88 (3.16) | 0.20 |
| Women, No. (%) | 248 (71.88) | 227 (71.61) | 21 (75.00) | 0.87 |
| Education, mean (SD), yr. | 10.55 (3.96) | 10.45 (3.97) | 11.71 (3.68) | 0.092 |
| Ethnicity, No. (%) | ||||
| Dominican | 295 (85.51) | 273 (86.12) | 22 (78.57) | 0.42 |
| Other Caribbean Hispanic | 21 (6.09) | 18 (5.68) | 3 (10.71) | |
| South American | 18 (5.22) | 16 (5.05) | 2 (7.14) | |
| Unspecified Hispanic | 7 (2.03) | 6 (1.89) | 1 (3.57) | |
| Central American | 4 (1.16) | 4 (1.26) | 0 (0) | |
| APOE-ε4, No. (%) | 123 (35.65) | 102 (32.18) | 21 (75.00) | <0.0001 |
| Cystatin C, mean (SD), mg/L | 0.97 (0.43) | 0.98 (0.44) | 0.94 (0.15) | 0.78 |
| SRT: Total Recall, mean (SD), words | 38.94 (8.82) | 39.00 (8.69) | 38.33 (10.40) | 0.75 |
| Plasma Aβ40, mean (SD), pg/mL | 222.98 (61.15) | 223.05 (61.14) | 222.18 (62.33) | 0.94 |
| Plasma Aβ42, mean (SD), pg/mL | 14.27 (3.98) | 14.39 (3.98) | 12.91 (3.77) | 0.057 |
| Aβ42/Aβ40 ratio, mean (SD) | 0.065 (0.013) | 0.065 (0.013) | 0.058 (0.009) | 0.0005 |
Plasma Aβ42/Aβ40 ratio was weakly but significantly inversely correlated with age, plasma Aβ40, global Aβ SUVR, and Aβ SUVR in frontal, cingulate, parietal, and temporal ROIs, and moderately correlated with plasma Aβ42 (Figure 1). One individual had an outlying plasma Aβ42/Aβ40 ratio value (0.17), but the magnitudes of our correlations were remained the same even after removing this value. The magnitudes of our correlations also remained the same after adjusting for age.
We compared the association of APOE-ε4 carrier status with brain Aβ and plasma Aβ (Figure 2). APOE-ε4 carrier status was associated with higher brain Aβ SUVR (β = 0.08; 95% Confidence Interval (CI): 0.05, 0.11; p <0.0001). APOE-ε4 carrier status was not associated with plasma Aβ40 nor plasma Aβ42, but APOE-ε4 carriers had lower plasma Aβ42/Aβ40 ratios (β = − 0.003; 95% CI: −0.006, 0.0002; p = 0.067). However, the outlying plasma Aβ42/Aβ40 ratio value imparted an effect on the association between plasma Aβ42/Aβ40 ratio and APOE-ε4 carrier status, and removing this value resulted in a significant association (β = −0.004; 95% CI: −0.006, −0.001; p = 0.0039). APOE-ε4 carriers also had a higher odds of amyloid positivity compared to non-carriers (OR = 6.32, CI: 2.72, 16.49; p < 0.0001). These results were robust to adjustments for Cystatin C.
Figure 2:
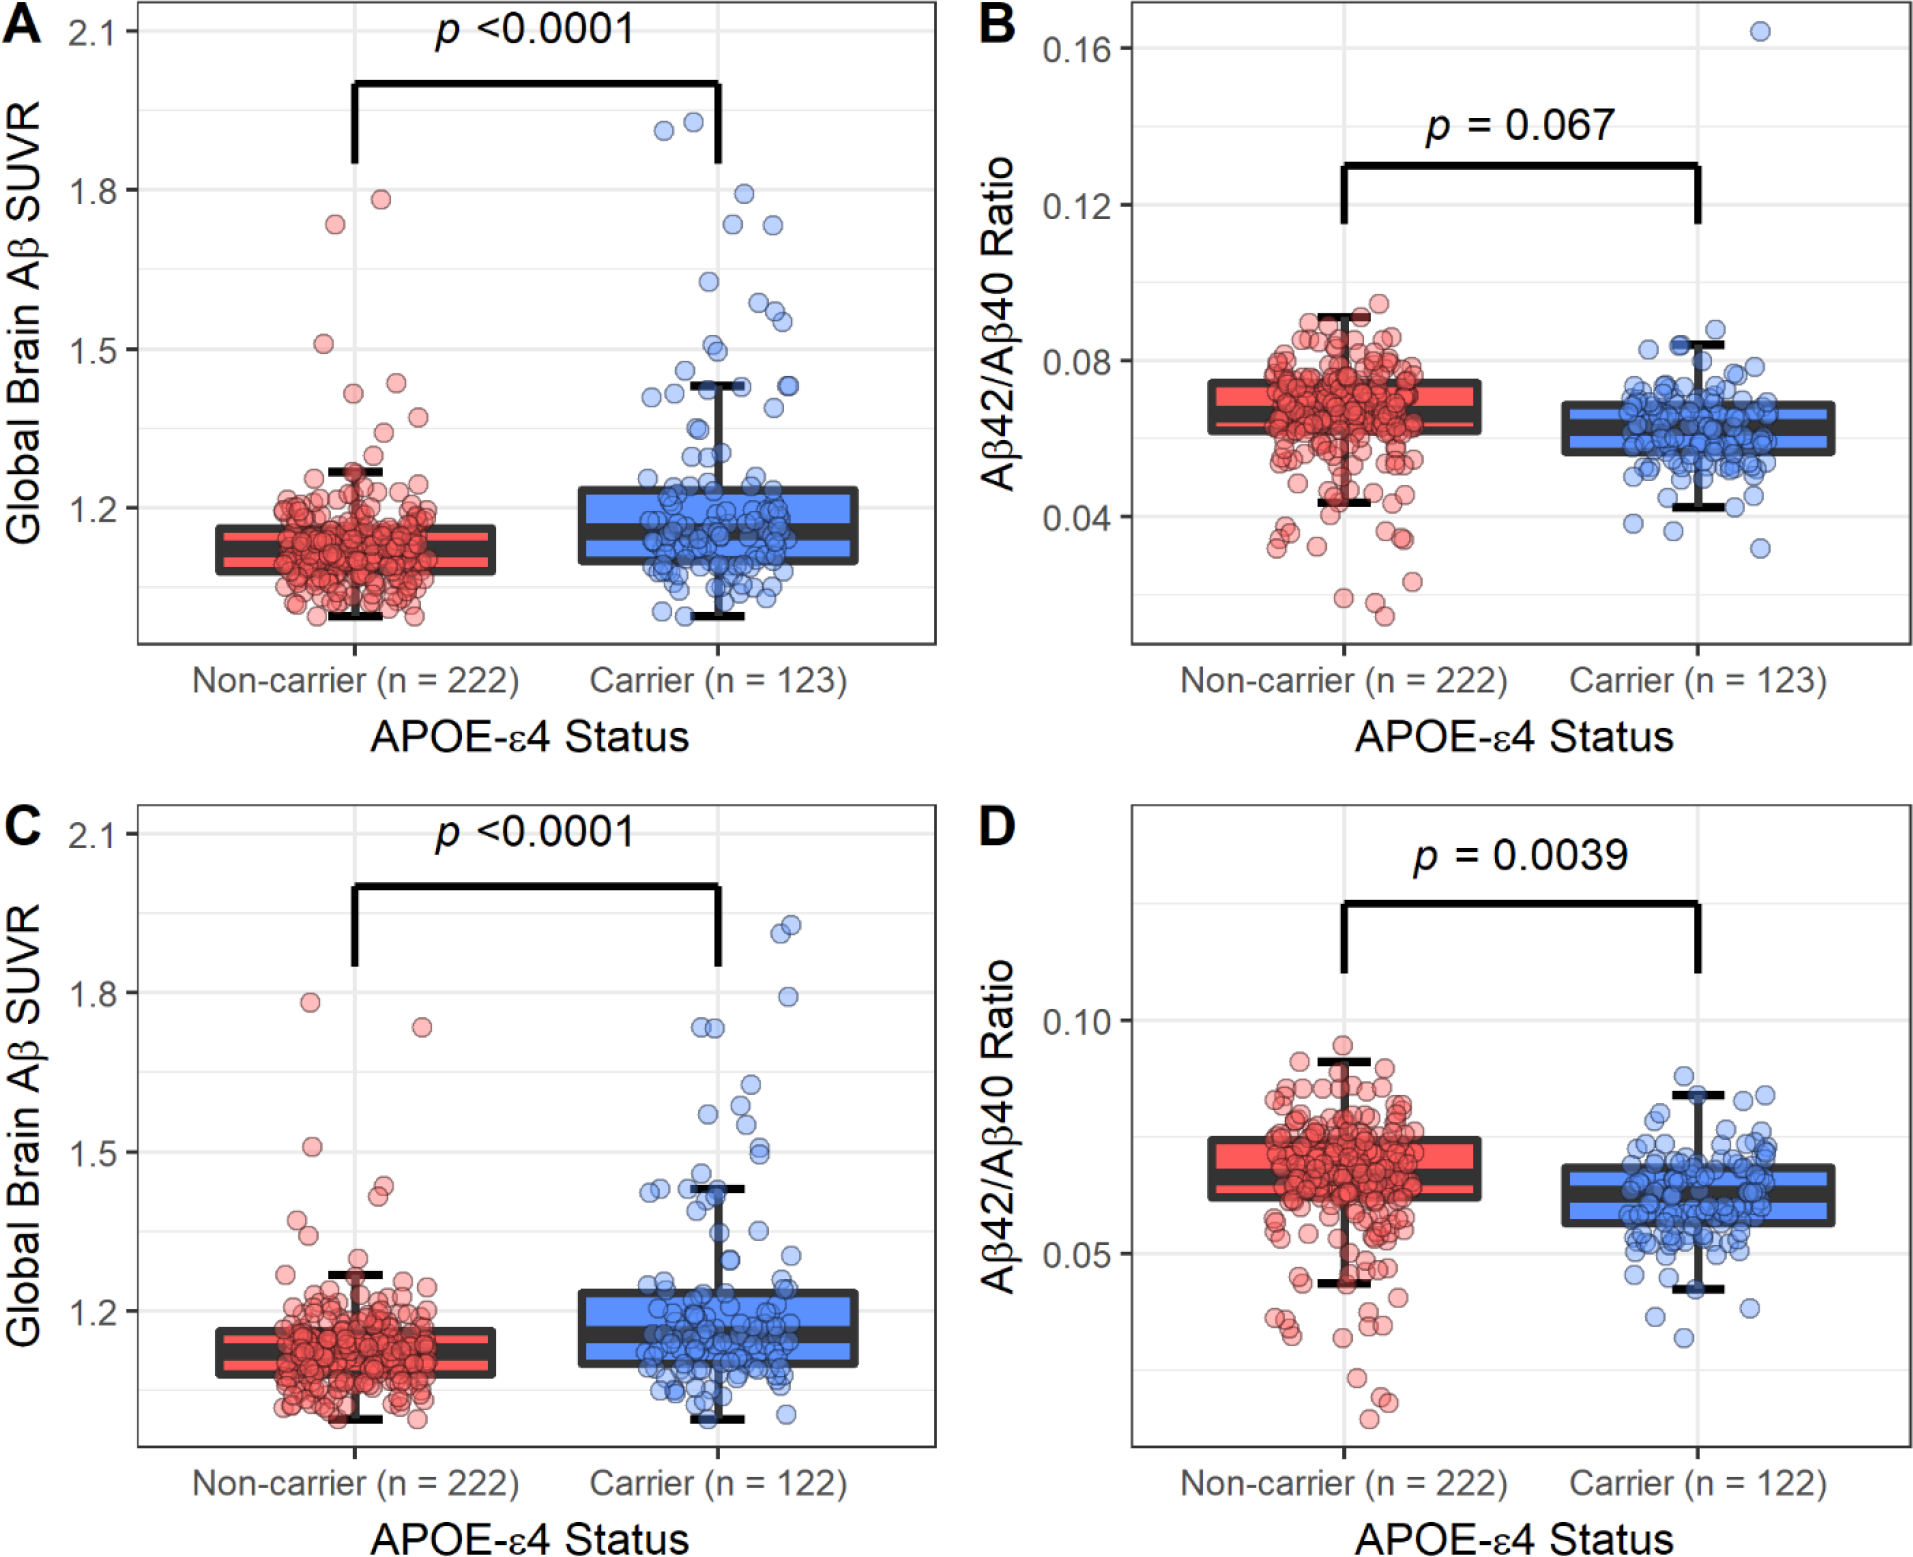
Boxplots comparing the distribution of amyloid β (Aβ) between APOE-ε4 carriers and non-carriers. Aβ measured as global brain Aβ SUVR and the ratio of plasma Aβ42 to Aβ40. Panel A represents a comparison using global brain Aβ SUVR in the full sample (n = 345). Panel B represents a comparison using the ratio of plasma Aβ42 to Aβ40 in the full sample. Panel C represents a comparison using global brain Aβ SUVR removing one subject with an outlying plasma ratio value of 0.165 (n = 344). Panel D represents a comparison using the ratio of plasma Aβ42 to Aβ40 while removing the same outlier. Significance corresponds to a t-test comparing the mean of both groups.
Plasma Aβ42/Aβ40 ratio was inversely associated with global Aβ SUVR and Aβ positivity (Table 2), independent of demographics and APOE-ε4 carrier status. The associations for plasma Aβ42 were weaker, but were in the same direction as for Aβ42/Aβ40 ratio. Plasma Aβ40 was not associated with global Aβ SUVR or Aβ positivity. These results were robust to additional adjustments for Cystatin C.
Table 2.
Regression analysis relating 1 standard deviation increment in plasma amyloid β (Aβ) Aβ40, Aβ42, and Aβ42/Aβ40 ratio in relation to global Aβ derived from PET imaging. Global brain Aβ was examined continuously by linear regression and categorically by logistic regression. Global Aβ positivity was determined by k-means (SUVR = 1.34). Standardized betas and odds ratios are reported. Model 1 is unadjusted. Model 2 adjusts for age, and sex. Model 3 adjusts for age, sex, and APOE-ε4 carrier status.
| Model 1 | Model 2 | Model 3 | ||||||
|---|---|---|---|---|---|---|---|---|
| No. | Aβ Outcome | β (95% CI) OR (95% CI) |
p-value | β (95% CI) OR (95% CI) |
p-value | β (95% CI) OR (95% CI) |
p-value | |
|
β (95% CI)
Global Aβ SUVR | ||||||||
| Aβ40 | 0.03 (−0.08, 0.13) | 0.60 | 0.02 (−0.08, 0.13) | 0.67 | 0.01 (−0.09, 0.11) | 0.86 | ||
| Aβ42 | 345 | −0.09 (−0.20, 0.02) | 0.095 | −0.09 (−0.20, 0.01) | 0.080 | −0.08 (−0.18, 0.02) | 0.14 | |
| Aβ42/Aβ40 | −0.16 (−0.27, −0.06) | 0.0028 | −0.16 (−0.26, −0.05) | 0.0031 | −0.13 (−0.23, −0.03) | 0.013 | ||
|
OR (95% CI)
Aβ Positivity by k-means (SUVR = 1.34) | ||||||||
| Aβ40 | 0.99 (0.64, 1.40) | 0.94 | 0.96 (0.62, 1.37) | 0.84 | 0.94 (0.62, 1.33) | 0.74 | ||
| Aβ42 | 345 | Positive | 0.68 (0.45, 1.01) | 0.060 | 0.68 (0.45, 1.01) | 0.060 | 0.69 (0.44, 1.06) | 0.093 |
| Aβ42/Aβ40 | 0.59 (0.41, 0.86) | 0.0047 | 0.61 (0.42, 0.88) | 0.0081 | 0.59 (0.38, 0.91) | 0.016 | ||
We examined a ROC curve to evaluate the accuracy of the plasma Aβ42/Aβ40 ratio in estimating brain Aβ positivity, and the AUC was 0.73 (95% CI: 0.64, 0.82; p < 0.0001). We also considered alternative methods of predicting estimating brain Aβ positivity, evaluating the accuracy of APOE-ε4 carrier status as a predictor (AUC = 0.71, 95% CI: 0.62, 0.80; p < 0.0001) as well as APOE-ε4 carrier status and plasma Aβ42/Aβ40 ratio used jointly as predictors (AUC = 0.81, 95% CI: 0.73, 0.87; p < 0.0001). There was no statistical difference in predictive strength between the accuracy of the plasma Aβ42/Aβ40 ratio and APOE-ε4 carrier status (p = 0.82) or APOE-ε4 carrier status and plasma Aβ42/Aβ40 ratio modelled simultaneously (p = 0.18) by DeLong’s test. We further explored the point at which the sensitivity and specificity of Aβ positivity predictions were optimized. This was done by finding the point on the ROC curve closest to 100% sensitivity and 100% specificity. This was a threshold of 82.4% sensitivity and 62.8% specificity. This corresponded to a plasma Aβ42/Aβ40 ratio value of 0.06 (Figure 3). We examined the association of APOE-ε4 carrier status with amyloid positivity defined by this plasma Aβ42/Aβ40 ratio threshold (0.06) and found that individuals carrying an ε4 allele had higher odds of amyloid positivity by plasma Aβ42/Aβ40 ratio threshold compared to APOE-ε4 non-carriers (OR = 2.73, 95% CI: 1.69, 4.43; p < 0.0001).
Figure 3:
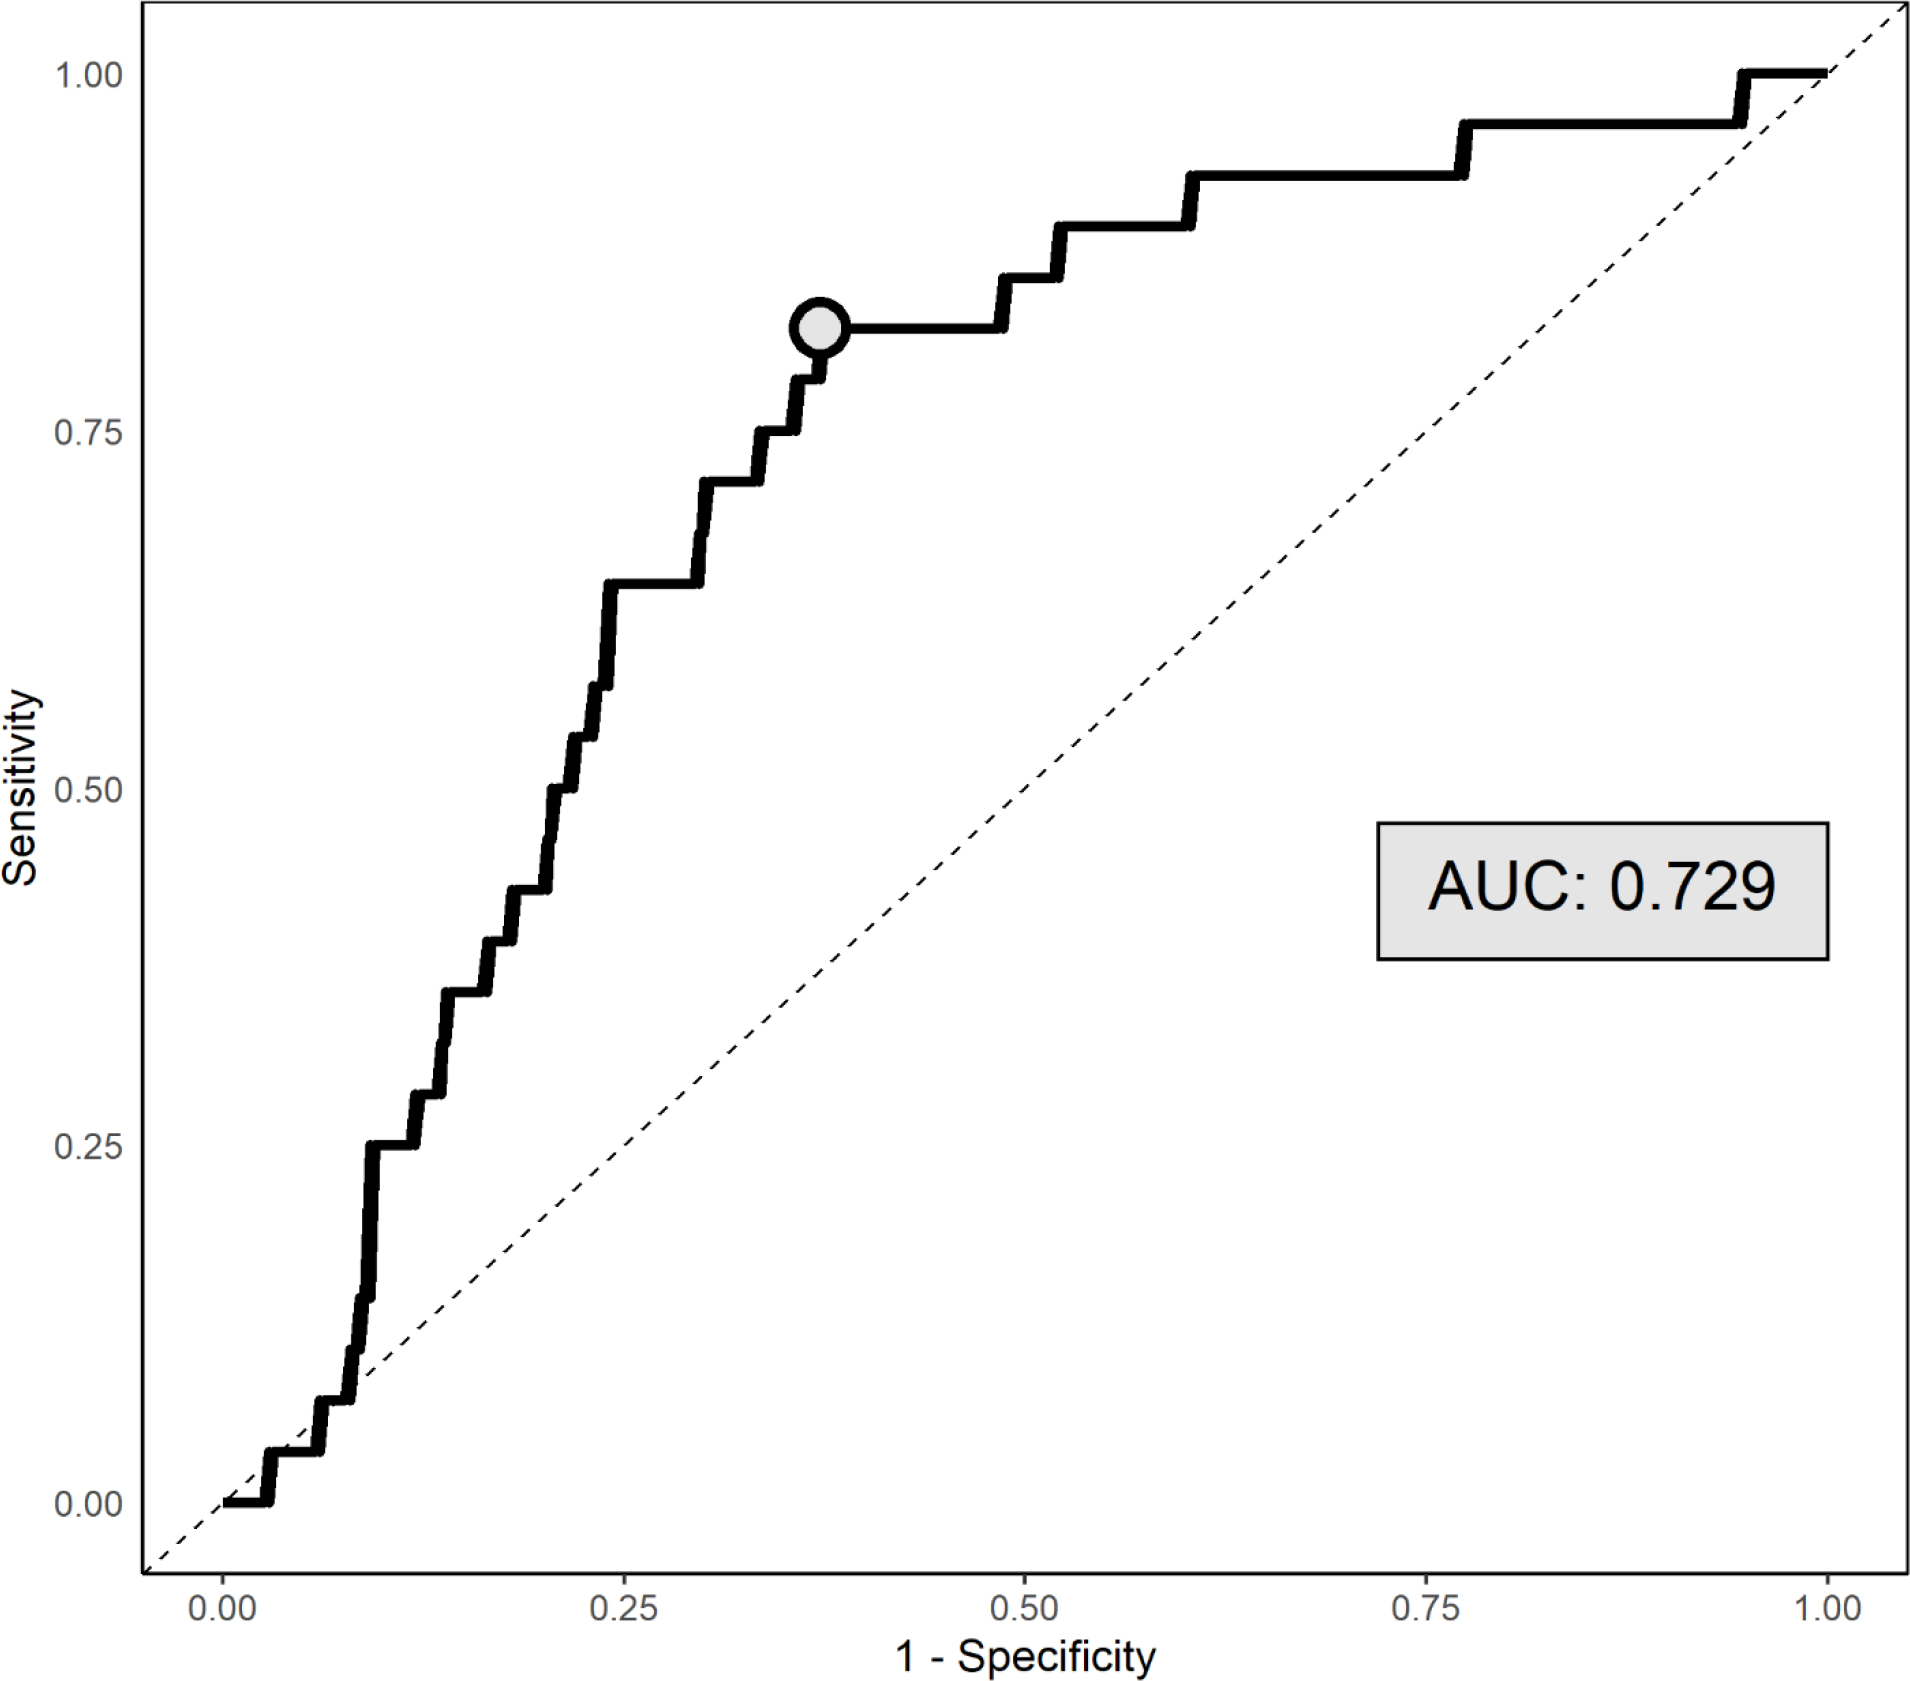
Receiver operative characteristic (ROC) curve for predicting Aβ positivity (k-means) by plasma Aβ42/Aβ40 ratios, with corresponding AUC value reported. The circle indicates the point at which sensitivity and specificity is maximized (i.e., the distance on the curve to the top left corner is minimized).
Finally, we explored the effect of setting sensitivity and specificity levels at 90%, depending on whether we intend to use plasma Aβ42/Aβ40 ratio to screen for persons who are likely to be brain Aβ-positive vs. screen out those who are Aβ-negative. Using a plasma Aβ42/Aβ40 ratio cutoff with a sensitivity of 90% (1 in 10 false negative) with the goal of capturing as many truly Aβ-positive participants as possible, the specificity is 39.7%, meaning that nearly 6 in 10 individuals who screen positive will be Aβ-negative. Using this cutoff there was a PPV of 11.6% and an NPV of 97.8% for predicting brain amyloid positivity, implying that only 1 out of every 50 negative test result will correspond to an amyloid positive individual. If we set the specificity at 90% (1 in 10 false positive) with the intent of excluding as many Aβ-negative individuals as possible, the sensitivity would be 25%, meaning that only a quarter of Aβ-positive individuals screened would be included. This cutoff had a PPV of 18.1% and an NPV of 93.1% for predicting brain amyloid positivity. Thus, it is of potentially greater value to use plasma Aβ42/Aβ40 ratio in screening for Aβ-positive individuals as compared to Aβ-negative individuals.
DISCUSSION
We found that in a community-based late middle age cohort that plasma Aβ42/Aβ40 ratio is weakly but significantly correlated with global brain amyloid SUVR, with the ability to predict amyloid positivity determined quantitatively with amyloid PET at an acceptable level (AUC within a 0.70–0.80 range) [26]. Moreover, though the plasma Aβ42/Aβ40 ratio generally had weak PPV due to the low prevalence of brain amyloid positivity, it had a high NPV and rarely classified amyloid positive cases as negative. Plasma Aβ42/Aβ40 ratio measured using Simoa may have limited use as a surrogate marker of brain amyloid levels in epidemiologic, prevention, or treatment studies given the weak correlation. Plasma Aβ42/Aβ40 ratio measured using Simoa seems to have limited accuracy for screening for Aβ-positive individuals in late middle-age, an important period of the lifespan for interventions targeting AD. Our finding showing that plasma Aβ42/Aβ40 ratio is lower among APOE-ε4 carriers as compared with non-carriers, in the same direction as for Aβ SUVR, suggests that plasma Aβ42/Aβ40 ratio may be used, albeit with limited accuracy, for the examination of the relation between risk factors and Aβ burden when brain imaging or lumbar puncture is not possible. Moreover, APOE-ε4 and plasma Aβ42/Aβ40 ratio had similar strength in identifying brain Aβ positivity, but a higher magnitude AUC in models considering plasma Aβ and APOE-ε4 together may suggest that plasma Aβ is able to capture information about brain Aβ positivity that was not observed through the association between APOE-ε4 and Aβ positivity.
The development of accurate blood-based biomarkers of AD has lagged behind brain imaging and CSF biomarkers, but recent advances enable the use of blood-based biomarkers in AD research. The blood-brain barrier is altered in aging and AD [27]. The increased permeability between the brain and the periphery makes it possible for blood-based biomarkers to be representative of pre-clinical changes in AD [28]. Extant proteomic methods to measure blood-based biomarkers for AD include mass spectrometry, immunocapture, and aptamer-based techniques. However, issues around lower limit of detection, depletion of lower molecular weight proteins, and antibody availability have limited the use of these methods in particular [29]. More recently, ultrasensitive immunoassays and mass spectrometry show greater promise [6]. The commercially available Simoa™ is a novel method to measure Aβ40 and Aβ42 in plasma [7], that is increasingly used in research. Whereas CSF and brain imaging biomarkers are relatively well established and standardized in AD research, research using blood-based biomarkers has advanced more recently.
Using Simoa™ technology in 248 participants aged 61 ± 9 years with subjective cognitive decline from the SCIENCe project and Amsterdam Dementia Cohort, plasma Aβ42/Aβ40 ratio and plasma Aβ42 identified abnormal CSF-amyloid status, suggesting that plasma Aβ42/ Aβ40 has the potential to be used as a screening measure to identify AD related neuropathological changes in cognitively normal individuals with subjective cognitive decline [19]. In 842 participants of the Swedish BioFINDER Study aged 72 ± 5.6 years study and a replication cohort of 237 participants aged 66 ± 10 years, plasma Aβ42 and Aβ40 ascertained with Elecsys immunoassays (Roche Diagnostics) predicted Aβ status, as defined from cerebrospinal fluid Aβ42/ Aβ40 ratio, with an area under the receiver operating curve (AUC) of 0.80, independent of age, APOE genotype, or cognitive status [30]. Plasma Aβ42/ Aβ40, measured with Simoa™, was also predictive of cerebral amyloidosis in a sample of 276 cognitively intact individuals aged approximately 77 years with subjective memory complaints from the INSIGHT-preAD study, a French academic university-based cohort that is part of the Alzheimer Precision Medicine Initiative Cohort Program, with an AUC of 0.77 [13]. Compared to these studies, our study examined the relation of plasma Aβ with in-vivo brain Aβ in a community-based cohort recruited irrespective of cognitive status, and found a modest correlation between plasma Aβ42/Aβ40 ratio and brain Aβ SUVR, and acceptable accuracy of plasma Aβ42/Aβ40 ratio in predicting amyloid positivity, with an AUC of 0.73, lower than in recent studies.
Our study has some limitations to consider. We could not compare the accuracy of the Simoa assay to other plasma biomarkers of amyloid positivity, including other plasma Aβ assays[30, 31] and plasma assays of phosphorylated forms of tau[32]. We cannot address the ability of plasma Aβ42/Aβ40 ratio in predicting brain amyloid changes given the cross-sectional nature of our study. Despite these limitations, our study also has strengths, including the use of state-of-the-art amyloid imaging to ascertain amyloid status quantitatively. This study also addresses the lack of biomarker studies in non-white individuals. Moreover, most our findings were similar to European studies mentioned above, suggesting that our findings are in fact generalizable.
The main implications of our study are that plasma Aβ42/Aβ40 ratio measured using Simoa has limited accuracy to screen for amyloid positivity and for studying risk factors of brain amyloid burden when n-vivo amyloid imaging is not feasible.
Supplementary Material
ACKNOWLEDGEMENTS
This work was funded by National Institutes of Health grants R01AG050440, RF1AG051556. Partial support was provided by grants K24AG045334, P30AG059303, and ULT1TR001873. H Zetterberg is a Wallenberg Scholar supported by grants from the Swedish Research Council (#2018–02532), the European Research Council (#681712), Swedish State Support for Clinical Research (#ALFGBG-720931), the Alzheimer Drug Discovery Foundation (ADDF), USA (#201809–2016862), and the UK Dementia Research Institute at UCL.
Footnotes
CONFLICTS OF INTEREST
JA Luchsinger receives a stipend from Wolters Kluwer, N.V. as Editor in Chief of the journal Alzheimer’s Disease and Associated Disorders, and has served as a paid consultant to vTv therapeutics, Inc. and Recruitment Partners. The other authors have no interests to declare.
REFERENCES
- [1].Jack CR Jr., Knopman DS, Jagust WJ, Petersen RC, Weiner MW, Aisen PS, Shaw LM, Vemuri P, Wiste HJ, Weigand SD, Lesnick TG, Pankratz VS, Donohue MC, Trojanowski JQ (2013) Tracking pathophysiological processes in Alzheimer’s disease: an updated hypothetical model of dynamic biomarkers. Lancet Neurol 12, 207–216. [DOI] [PMC free article] [PubMed] [Google Scholar]
- [2].Jack CR Jr., Knopman DS, Jagust WJ, Shaw LM, Aisen PS, Weiner MW, Petersen RC, Trojanowski JQ (2010) Hypothetical model of dynamic biomarkers of the Alzheimer’s pathological cascade. Lancet Neurol 9, 119–128. [DOI] [PMC free article] [PubMed] [Google Scholar]
- [3].Jack CR Jr., Bennett DA, Blennow K, Carrillo MC, Dunn B, Haeberlein SB, Holtzman DM, Jagust W, Jessen F, Karlawish J, Liu E, Molinuevo JL, Montine T, Phelps C, Rankin KP, Rowe CC, Scheltens P, Siemers E, Snyder HM, Sperling R, Contributors (2018) NIA-AA Research Framework: Toward a biological definition of Alzheimer’s disease. Alzheimer’s & dementia : the journal of the Alzheimer’s Association 14, 535–562. [DOI] [PMC free article] [PubMed] [Google Scholar]
- [4].Olsson B, Lautner R, Andreasson U, Öhrfelt A, Portelius E, Bjerke M, Hölttä M, Rosén C, Olsson C, Strobel G, Wu E, Dakin K, Petzold M, Blennow K, Zetterberg H (2016) CSF and blood biomarkers for the diagnosis of Alzheimer’s disease: a systematic review and meta-analysis. The Lancet Neurology 15, 673–684. [DOI] [PubMed] [Google Scholar]
- [5].Ossenkoppele R, Jansen WJ, Rabinovici GD, Knol DL, van der Flier WM, van Berckel BNM, Scheltens P, Visser PJ, Amyloid PETSG, Verfaillie SCJ, Zwan MD, Adriaanse SM, Lammertsma AA, Barkhof F, Jagust WJ, Miller BL, Rosen HJ, Landau SM, Villemagne VL, Rowe CC, Lee DY, Na DL, Seo SW, Sarazin M, Roe CM, Sabri O, Barthel H, Koglin N, Hodges J, Leyton CE, Vandenberghe R, van Laere K, Drzezga A, Forster S, Grimmer T, Sánchez-Juan P, Carril JM, Mok V, Camus V, Klunk WE, Cohen AD, Meyer PT, Hellwig S, Newberg A, Frederiksen KS, Fleisher AS, Mintun MA, Wolk DA, Nordberg A, Rinne JO, Chételat G, Lleo A, Blesa R, Fortea J, Madsen K, Rodrigue KM, Brooks DJ (2015) Prevalence of amyloid PET positivity in dementia syndromes: a meta-analysis. JAMA 313, 1939–1949. [DOI] [PMC free article] [PubMed] [Google Scholar]
- [6].Andreasson U, Blennow K, Zetterberg H (2016) Update on ultrasensitive technologies to facilitate research on blood biomarkers for central nervous system disorders. Alzheimer’s & Dementia : Diagnosis, Assessment & Disease Monitoring 3, 98–102. [DOI] [PMC free article] [PubMed] [Google Scholar]
- [7].Zetterberg H, Mörtberg E, Song L, Chang L, Provuncher GK, Patel PP, Ferrell E, Fournier DR, Kan CW, Campbell TG, Meyer R, Rivnak AJ, Pink BA, Minnehan KA, Piech T, Rissin DM, Duffy DC, Rubertsson S, Wilson DH, Blennow K (2011) Hypoxia Due to Cardiac Arrest Induces a Time-Dependent Increase in Serum Amyloid β Levels in Humans. PLoS ONE 6, e28263. [DOI] [PMC free article] [PubMed] [Google Scholar]
- [8].Palta P, Rippon B, Reitz C, He HA-O, Sherwood G, Ceballos F, Teresi J, Razlighi Q, Moreno H, Brickman AA-O, Luchsinger JA Apolipoprotein E genotype and in-vivo amyloid burden in middle-aged hispanics. LID - 10.1212/WNL.0000000000010707 [pii]. [DOI] [PMC free article] [PubMed] [Google Scholar]
- [9].Luchsinger JA, Palta P, Rippon B, Sherwood G, Soto L, Ceballos F, Laing K, Igwe K, He H, Razlighi Q, Teresi J, Moreno H, Brickman AM Pre-Diabetes, but not Type 2 Diabetes, Is Related to Brain Amyloid in Late Middle-Age. [DOI] [PMC free article] [PubMed]
- [10].Luchsinger JA, Cabral R, Eimicke JP, Manly JJ, Teresi J (2015) Glycemia, Diabetes Status, and Cognition in Hispanic Adults Aged 55–64 Years. Psychosom Med 77, 653–663. [DOI] [PMC free article] [PubMed] [Google Scholar]
- [11].Risacher SL, Fandos N, Romero J, Sherriff I, Pesini P, Saykin AJ, Apostolova LG (2019) Plasma amyloid beta levels are associated with cerebral amyloid and tau deposition. Alzheimers Dement (Amst) 11, 510–519. [DOI] [PMC free article] [PubMed] [Google Scholar]
- [12].Schindler SE, Bollinger JG, Ovod V, Mawuenyega KG, Li Y, Gordon BA, Holtzman DM, Morris JC, Benzinger TLS, Xiong C, Fagan AM, Bateman RJ (2019) High-precision plasma beta-amyloid 42/40 predicts current and future brain amyloidosis. Neurology 93, e1647–e1659. [DOI] [PMC free article] [PubMed] [Google Scholar]
- [13].Vergallo A, Megret L, Lista S, Cavedo E, Zetterberg H, Blennow K, Vanmechelen E, De Vos A, Habert MO, Potier MC, Dubois B, Neri C, Hampel H, group IN-ps, Alzheimer Precision Medicine I (2019) Plasma amyloid beta 40/42 ratio predicts cerebral amyloidosis in cognitively normal individuals at risk for Alzheimer’s disease. Alzheimers Dement 15, 764–775. [DOI] [PubMed] [Google Scholar]
- [14].Wilson DH, Rissin DM, Kan CW, Fournier DR, Piech T, Campbell TG, Meyer RE, Fishburn MW, Cabrera C, Patel PP, Frew E, Chen Y, Chang L, Ferrell EP, von Einem V, McGuigan W, Reinhardt M, Sayer H, Vielsack C, Duffy DC (2015) The Simoa HD-1 Analyzer: A Novel Fully Automated Digital Immunoassay Analyzer with Single-Molecule Sensitivity and Multiplexing. Journal of Laboratory Automation 21, 533–547. [DOI] [PubMed] [Google Scholar]
- [15].Zetterberg H, Wilson D, Andreasson U, Minthon L, Blennow K, Randall J, Hansson O (2013) Plasma tau levels in Alzheimer’s disease. Alzheimers Res Ther 5, 9. [DOI] [PMC free article] [PubMed] [Google Scholar]
- [16].Blennow K, Zetterberg H (2018) The Past and the Future of Alzheimer’s Disease Fluid Biomarkers. Journal of Alzheimer’s Disease 62, 1125–1140. [DOI] [PMC free article] [PubMed] [Google Scholar]
- [17].Janelidze S, Stomrud E, Palmqvist S, Zetterberg H, van Westen D, Jeromin A, Song L, Hanlon D, Tan Hehir CA, Baker D, Blennow K, Hansson O (2016) Plasma beta-amyloid in Alzheimer’s disease and vascular disease. Sci Rep 6, 26801. [DOI] [PMC free article] [PubMed] [Google Scholar]
- [18].Lue LF, Guerra A, Walker DG (2017) Amyloid Beta and Tau as Alzheimer’s Disease Blood Biomarkers: Promise From New Technologies. Neurol Ther 6, 25–36. [DOI] [PMC free article] [PubMed] [Google Scholar]
- [19].Verberk IMW, Slot RE, Verfaillie SCJ, Heijst H, Prins ND, van Berckel BNM, Scheltens P, Teunissen CE, van der Flier WM (2018) Plasma Amyloid as Prescreener for the Earliest Alzheimer Pathological Changes. Ann Neurol. [DOI] [PMC free article] [PubMed] [Google Scholar]
- [20].Tahmi M, Bou-Zeid W, Razlighi QR (2019) A fully automatic technique for precise localization and quantification of Amyloid-β PET scans. Journal of Nuclear Medicine. [DOI] [PMC free article] [PubMed] [Google Scholar]
- [21].Humes KR, Jones NA, Ramirez RR (2011) in 2010 Census Briefs, ed. Bureau UC US Department of Commerce, Washington, DC. [Google Scholar]
- [22].(2019) 2019 Alzheimer’s disease facts and figures. Alzheimer’s & Dementia 15, 321–387. [Google Scholar]
- [23].Jansen WJ, Ossenkoppele R, Knol DL, Tijms BM, Scheltens P, Verhey FRJ, Visser PJ, and the Amyloid Biomarker Study G (2015) Prevalence of Cerebral Amyloid Pathology in Persons Without Dementia: A Meta-analysisPrevalence of Cerebral Amyloid Pathology in Persons Without DementiaPrevalence of Cerebral Amyloid Pathology in Persons Without Dementia. JAMA 313, 1924–1938. [DOI] [PMC free article] [PubMed] [Google Scholar]
- [24].Hanley JA, McNeil BJ (1983) A method of comparing the areas under receiver operating characteristic curves derived from the same cases. Radiology 148, 839–843. [DOI] [PubMed] [Google Scholar]
- [25].DeLong ER, DeLong DM, Clarke-Pearson DL (1988) Comparing the areas under two or more correlated receiver operating characteristic curves: a nonparametric approach. Biometrics 44, 837–845. [PubMed] [Google Scholar]
- [26].Mandrekar JN (2010) Receiver operating characteristic curve in diagnostic test assessment. J Thorac Oncol 5, 1315–1316. [DOI] [PubMed] [Google Scholar]
- [27].Viggars AP, Wharton SB, Simpson JE, Matthews FE, Brayne C, Savva GM, Garwood C, Drew D, Shaw PJ, Ince PG (2011) Alterations in the blood brain barrier in ageing cerebral cortex in relationship to Alzheimer-type pathology: a study in the MRC-CFAS population neuropathology cohort. Neurosci Lett 505. [DOI] [PubMed] [Google Scholar]
- [28].Montagne A, Barnes SR, Sweeney MD, Halliday MR, Sagare AP, Zhao Z, Toga AW, Jacobs RE, Liu CY, Amezcua L, Harrington MG, Chui HC, Law M, Zlokovic BV (2015) Blood-Brain Barrier Breakdown in the Aging Human Hippocampus. Neuron 85, 296–302. [DOI] [PMC free article] [PubMed] [Google Scholar]
- [29].Baird AL, Westwood S, Lovestone S (2015) Blood-Based Proteomic Biomarkers of Alzheimer’s Disease Pathology. Frontiers in Neurology 6, 236. [DOI] [PMC free article] [PubMed] [Google Scholar]
- [30].Palmqvist S, Janelidze S, Stomrud E, Zetterberg H, Karl J, Zink K, Bittner T, Mattsson N, Eichenlaub U, Blennow K, Hansson O (2019) Performance of Fully Automated Plasma Assays as Screening Tests for Alzheimer Disease-Related beta-Amyloid Status. JAMA Neurol. [DOI] [PMC free article] [PubMed] [Google Scholar]
- [31].Janelidze S, Teunissen CE, Zetterberg H, Allué JA, Sarasa L, Eichenlaub U, Bittner T, Ovod V, Verberk IMW, Toba K, Nakamura A, Bateman RJ, Blennow K, Hansson O (2021) Head-to-Head Comparison of 8 Plasma Amyloid-β 42/40 Assays in Alzheimer Disease. JAMA Neurology. [DOI] [PMC free article] [PubMed] [Google Scholar]
- [32].Janelidze S, Mattsson N, Palmqvist S, Smith R, Beach TG, Serrano GE, Chai X, Proctor NK, Eichenlaub U, Zetterberg H, Blennow K, Reiman EM, Stomrud E, Dage JL, Hansson O (2020) Plasma P-tau181 in Alzheimer’s disease: relationship to other biomarkers, differential diagnosis, neuropathology and longitudinal progression to Alzheimer’s dementia. Nat Med 26, 379–386. [DOI] [PubMed] [Google Scholar]
Associated Data
This section collects any data citations, data availability statements, or supplementary materials included in this article.