

Abstract
Objective
Unscheduled low‐acuity care options are on the rise and are often expected to reduce emergency department (ED) visits. We opened an ED‐staffed walk‐in clinic (WIC) as an alternative care location for low‐acuity patients at a time when ED visits exceeded facility capacity and the impending flu season was anticipated to increase visits further, and we assessed whether low‐acuity ED patient visits decreased after opening the WIC.
Methods
In this retrospective cohort study, we compared patient and clinical visit characteristics of the ED and WIC patients and conducted interrupted time‐series analyses to quantify the impact of the WIC on low‐acuity ED patient visit volume and the trend.
Results
There were 27,211 low‐acuity ED visits (22.7% of total ED visits), and 7,058 patients seen in the WIC from February 26, 2018, to November 17, 2019. Low‐acuity patient visits in the ED reduced significantly immediately after the WIC opened (P = 0.01). In the subsequent months, however, patient volume trended back to pre‐WIC volumes such that there was no significant impact at 6, 9, or 12 months (P = 0.07). Had WIC patients been seen in the main ED, low‐acuity volume would have been 27% of the total volume rather than the 22.7% that was observed.
Conclusion
The WIC did not result in a sustained reduction in low‐acuity patients in the main ED. However, it enabled emergency staff to see low‐acuity patients in a lower resource setting during times when ED capacity was limited.
Keywords: care use, clinical operations, emergency department, emergency department census, emergency department overcrowding, emergency department patient volume, low‐acuity, unscheduled care, urgent care, walk‐in clinic
1. INTRODUCTION
1.1. Background
The emergency department (ED) visit growth rate in the United States is outpacing current population growth rates. 1 EDs are resource intensive, but they draw patients with low‐acuity care needs that could be addressed in less resource intensive locations. 2 , 3 , 4 Reasons for patients seeking low‐acuity care in EDs include the following: avoidance of appointment wait times, inability to gain access to non‐ED care alternatives, rapid diagnostic testing, and availability beyond business hours. 5 , 6 Because these use patterns are unsustainable, many countries are shifting care from higher acuity care locations (eg, ED) to lower acuity care locations (eg, walk‐in clinic [WIC] or urgent care [UC] settings). 7 , 8 , 9
2. IMPORTANCE
It is estimated that between 13.7% and 27.1% of all ED visits in the United States could be safely managed at alternative locations with a potential cost savings of $4.4 billion annually. 4 Clinic‐based unscheduled care locations have grown in popularity as a more convenient, cost‐effective, and accessible source of low‐acuity care. 10 WICs and UCs have existed in the United States since 1973 and have experienced significant growth since the mid‐2000s. Yet there are few studies exploring whether they can effectively divert low‐acuity patients away from EDs to increase capacity for higher acuity patient visits. 4 , 11 , 12
To address rising patient volume in the ED, our academic medical center opened a cobranded ambulatory clinic, staffed by emergency physicians, nurses, and medical technicians. The WIC was pursued during a time when low‐acuity patients were experiencing delays in care initiation, and the volume of low‐acuity visits was anticipated to rise with the impending flu season.
3. OBJECTIVES
In this investigation, we explore low‐acuity ED volumes before and after the launch of an unscheduled WIC care option. We defined a WIC as a stand‐alone establishment not requiring advanced appointments or registration and that is able to provide basic diagnostics (laboratory tests, imaging) and treatment for common episodic acute medical complaints. 3 Common complaints included minor colds, ear infections, muscle injuries, and genitourinary complaints. 11 Visits at WICs do not have the expectation of follow‐up, and patients may be cared for by medical doctors or advanced care practitioners, although the WIC at our institution was staffed by physicians only. 12 The services provided do not include advanced procedures, comprehensive chronic care management, or care coordination. WICs also generally provided a convenient experience for easy access with locations often established near retail sites, no required appointments, lower costs than ED visits, and after‐hour and weekend availability. 11 , 12
We hypothesized that a WIC would decrease low‐acuity main ED volume and explored the hypothesis with 5 years of patient data (3 years before the WIC opened and 2 years after). Our aims were to (1) describe low‐acuity patient volume seen by our ED team, (2) compare demographic and clinical characteristics of the patients in the ED and WIC, and (3) use an interrupted time‐series (ITS) model to statistically test for changes in low‐acuity patient volume in the ED before and after the WIC launch.
4. METHODS
4.1. Study design
We conducted a retrospective analysis of the WIC using descriptive statistics and an ITS study design. 13 , 14 The quasi‐experimental design of ITS enabled us to evaluate the WIC as a care delivery intervention with its launch as a potential “interruption” in the trend of low‐acuity main ED patient visits (defined as Emergency Severity Index [ESI] 4 or 5). We used electronic medical record data for WIC and low‐acuity ED patient visits during the time the WIC was in operation (February 26, 2018, to November 17, 2019). However, understanding the WIC's association with the volume and trend of low‐acuity visits in the main ED requires us to examine ED visit data from before the WIC opened. So, we also included data for low‐acuity main ED patients from the 3 years before the WIC's launch. Having data from this pre‐WIC launch period permitted us to observe seasonal changes occurring within emergency care that can alter the proportion of higher versus lower acuity patients from month to month. It also enabled us to control for variation by (1) estimating seasonal variation across years and (2) including these estimates as a variable in the ITS model. This increased our confidence that differences in the volume and trend for low‐acuity ED visits before and after the WIC launch are adjusted for seasonal variations. We received institutional review board approval before the initiation of this study.
The Bottom Line
In a retrospective study of emergency department (ED) use after the opening of a walk‐in clinic (WIC), the authors analyzed 27,211 low‐acuity ED visits during an ≈1.5‐year period and during a peak period of ED visits. Immediately after the opening of the WIC, low‐acuity visits were reduced significantly, allowing ED staff to see these patients in a lower resource use setting when ED capacity was limited. However, at 6, 9, and 12 months, the WIC did not result in a sustained reduction in the low‐acuity patients seen in the main ED.
5. SETTING
5.1. The Walk‐in Clinic
The WIC was a 7‐bed ambulatory care clinic cobranded with the health system that was located in a clinic building ≈0.8 miles away from the main ED. The WIC was run by the hospital's emergency services department. Emergency physician and nursing leadership were responsible for the WIC planning, implementation, and daily operations. Every other clinic in the hospital network was operated by the health system's ambulatory care department, so this was a unique arrangement that enabled the WIC to more closely replicate the ED's care flow. Staffing for each shift was consistent and included an emergency physician, registered ED nurse, registration clerk, scribe, and medical assistant. Hours of operation were from 3:30 pm to 11:30 pm Monday through Friday. These times were strategically chosen to coincide with the time of day when the ED had the highest volume of ED patients: 3:00 pm to midnight. The clinic hours also overlapped with other ambulatory clinics for ≈90 minutes, as those offices typically closed at 5:00 pm.
The strategic planning for the WIC began 2 years before its launch, initiated by surging ED volumes during the winter of 2016. The hospital system and ED had tried many overcrowding initiatives within the ED and hospital with variable levels of success, yet annual ED volumes rose in the already overcrowded ED space. An after‐hour WIC was proposed as an extramural intervention to attract patients with low‐acuity care needs to be seen by an emergency care team without an appointment in a lower resource environment outside of the main hospital facility.
The marketing campaign for the WIC was staged incrementally to avoid overwhelming the clinic with high volumes early in its operation. The first phase of the campaign, launched in March 2018, was a small‐scale promotion aimed to stay within a 15‐mile catchment area. These initial promotional efforts were directed to local primary care physicians, specialty clinics in the main hospital network, and clinical advice services/hotlines. The second phase was implemented in June 2018 and involved sending direct email messages to all members of the hospital network insurance group. This phase was the first direct communication with prospective patients and included additional efforts targeting patients with significant barriers to access care. The final phase, launched in October 2018, directly advertised the WIC on the hospital's main public website. This marketing objective focused on educating the public on which option to seek for care based on chief complaint and level of care required. The marketing campaign was in English only; however, all clinics had interpreter services available for patient evaluations.
As a result of concerns for violating the Emergency Medical Treatment & Labor Act, patients who self‐presented to the ED were not sent to the WIC even if they would have been an ideal WIC patient. 15 Through the 2020 COVID‐19 pandemic, we saw a decrease in low‐acuity patients. The WIC was closed during this time. This analysis was initiated in the fall of 2021 when total ED volume rebounded as did the return of patients seeking low‐acuity unscheduled care to help us determine whether to reopen the WIC.
5.2. The main ED
The main ED was an adult and pediatric patient care facility seeing ≈74,000 patients a year at the time of the WIC launch on February 26, 2018. It is colocated with our 613‐bed academic tertiary care hospital with percutaneous coronary intervention, stroke, level I adult and pediatric trauma capabilities, and nursing magnet status designation, with an adjacent pediatric hospital. On November 17, 2019, the ED was moved to a new hospital facility.
5.3. WIC operational process
Upon arrival at the WIC, patients checked in with a registration clerk, explained their chief complaint, and provided their insurance information. Because this was not an emergency care location, a medical screening exam was not required. However, for those with presentations inconsistent with low‐acuity care, a medical screening exam was completed by the nurse. After discussion with the physician, patients could be referred to the ED via ambulance or patient transport as needed. Patients were roomed according to order of arrival by medical assistants. Vital signs were then obtained, followed by a physician evaluation. Nursing was available to give medications and continue care based on the physician evaluation.
The x‐ray services were available in the building, and service hours were extended to support WIC patient care. Laboratory draws were done in the building during normal service hours or completed by the WIC registered nurse after hours. Medications could be given by mouth and intramuscularly. Intravenous access was possible but limited to administering fluids. Laboratory tests were not processed emergently as they are in the ED, but results were generally available before the end of the clinic day. Thus, urgent laboratory test results could be provided to a patient before the end of the clinic shift.
5.4. Data source
We obtained data from the electronic medical records of the ED and WIC, including patient demographic and clinical characteristics. We included all visits to the WIC and all low‐acuity visits to the ED, defined as ESI 4 or 5, from January 1, 2015, to November 17, 2019. This includes patients who left without being seen, without treatment complete, or against medical advice. The data were divided into a pre‐WIC period (January 1, 2015, to February 25, 2018) and a post‐WIC launch period (February 26, 2018, to November 17, 2019).
5.5. Statistical analysis
We calculated low‐acuity patient visit counts by month during the study period in the WIC and ED. Daily WIC visits for February 26 to 28, 2018, were included in the WIC count for March 2018 because these represented the first few days of the WIC and very few patients were seen. Each visit is treated as an independent encounter, as emergency and UC delivery occurs on an episodic basis with healthcare professionals who do not have a longitudinal relationship with each patient. There was no adjustment for multiple visits from individual patients in these analyses.
We used descriptive statistics to characterize the following 3 patient populations: those in the main ED during the pre‐WIC period, patients in the main ED in the post‐WIC launch period, and patients seen in the WIC. We present categorical variables using counts and percentages and continuous variables with means and standard deviations. Differences in characteristics between time periods and locations were assessed using standardized mean differences (SMDs). We interpret SMD values of 0.2, 0.5, and 0.8 as small, medium, and large differences between groups, respectively. 16 We did not conduct significance testing between the groups to avoid the challenges of multiple comparison testing.
We examined our low‐acuity patient data collapsed into months to observe our volume changes and trend. After accounting for seasonality, as described previously, we used an ITS model to statistically test changes in main ED low‐acuity patient volumes. Full details on our ITS methods are included in the Supporting Information.
In a post hoc analysis, we examined the proportion of patients arriving each hour to initiate a visit during the course of the day for both the WIC and main ED low‐acuity patients.
6. RESULTS
The main ED had 50,817 low‐acuity visits in the pre‐WIC period, which was 22.7% of 223,927 total ED visits during this time period. This period included 38 months and 4 peak volume seasons. There were 27,211 low‐acuity ED visits in the post‐WIC launch period, which was 22.7% of 119,872 total ED visits during 20 months and 1 peak volume season. In total, low‐acuity ED visits represented 22.7% of total ED visit volume across both periods. There were 7058 WIC patient visits. In plotting monthly volumes of low‐acuity patient visits in the ED and WIC (Figure 1), we found that the volume in the main ED was generally higher during the winter months (December to February) than the rest of the year, whereas the WIC patient volume did not exhibit a strong seasonal pattern.
FIGURE 1.
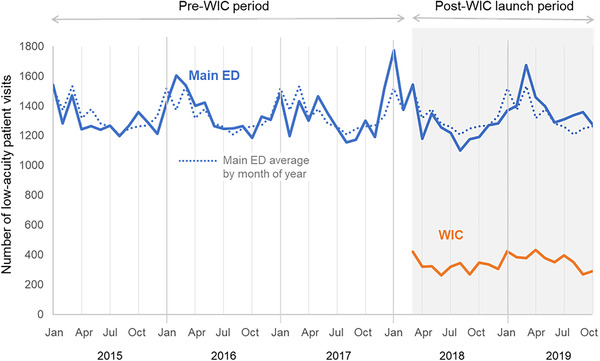
Low‐acuity patient visit volume by month and site: main ED pre‐WIC, main ED post‐WIC launch, and WIC. Monthly low‐acuity patient volume in the main ED and WIC from January 1, 2015, to November 17, 2019, aggregated by month. The solid line shows the actual number of patient visits. The dotted line shows each month's average volume in the main ED during the 5‐year period to illustrate the seasonal trends. ED, emergency department; WIC, walk‐in clinic.
Main ED low‐acuity patient demographics did not vary significantly between the pre‐ and post‐WIC launch periods as shown in Columns A and B of Table 1. In both groups, the mean age was ≈24 years, 49% were women, and approximately three‐quarters spoke English as a primary language. Patients who identified as Hispanic or Latino were 46% of the population, and about a quarter of all patients primarily spoke Spanish during both time periods. There were minimal differences in racial distribution, insurance coverage, or clinical presentation characteristics. Column D presents the SMDs comparing these 2 populations; all of the SMDs are <0.1, indicating very small differences between the ED patient groups. Similar chief complaints were seen at both locations, although there were some differences in the frequency of these complaints between the 2 groups (Table 1).
TABLE 1.
Demographic and clinical characteristics of the low‐acuity patient visits in the main ED before the WIC opened and main ED and WIC patients post‐WIC launch.
| Standardized mean differences | ||||||||
|---|---|---|---|---|---|---|---|---|
| Main ED pre‐WIC launch | Main ED post‐WIC launch | WIC | ||||||
| A versus B | B versus C | |||||||
| Column A | Column B | Column C | Column D | Column E | ||||
| Total visits | 50,817 | 27,211 | 7058 | |||||
| Average visits/month | 1337 | 1361 | 353 | |||||
| Demographic characteristics 1 | ||||||||
| Mean (SD) | Mean (SD) | Mean (SD) | ||||||
| Age, years | 23.8 (21.4) | 23.7 (21.6) | 38.7 (21.1) | 0.01 | 0.71 | |||
| n | % | n | % | n | % | |||
| Age category, years | 0.05 | 0.83 | ||||||
| 0–18 | 24,410 | 48% | 13,486 | 50% | 1013 | 14% | ||
| 19–30 | 10,005 | 20% | 5006 | 18% | 1866 | 26% | ||
| 31–45 | 7400 | 15% | 3886 | 14% | 1728 | 25% | ||
| 46–65 | 6487 | 13% | 3352 | 12% | 1493 | 21% | ||
| 66–80 | 1897 | 4% | 1121 | 4% | 700 | 10% | ||
| >80 | 618 | 1% | 360 | 1% | 258 | 4% | ||
| Female | 25,047 | 49% | 13,406 | 49% | 3996 | 57% | 0.00 | 0.15 |
| Hispanic/Latino | 23,495 | 46.3% | 12,400 | 45.6% | 771 | 11% | 0.01 | 0.89 |
| Language | 0.02 | 0.74 | ||||||
| English | 38,250 | 75% | 20,219 | 74% | 6776 | 96% | ||
| Spanish | 11,503 | 23% | 6413 | 24% | 82 | 1% | ||
| Mandarin, Cantonese, other | 1022 | 2% | 569 | 2% | 197 | 3% | ||
| Race | 0.09 | 0.20 | ||||||
| White | 25,253 | 50% | 12,704 | 47% | 3722 | 53% | ||
| Multiple | 14,690 | 29% | 8616 | 32% | 1689 | 24% | ||
| Asian | 6150 | 12% | 3422 | 13% | 1030 | 15% | ||
| Black | 2795 | 6% | 1450 | 5% | 395 | 6% | ||
| Pacific Islander, Native American, Hawaiian, Alaskan Native | 1364 | 3% | 692 | 3% | 120 | 2% | ||
| Unknown/refused | 565 | 1% | 327 | 1% | 102 | 1% | ||
| Insurance | 0.06 | 1.60 | ||||||
| Medicaid | 28,248 | 56% | 14,430 | 53% | 13 | 0.2% | ||
| Medicare | 3424 | 7% | 1769 | 7% | 952 | 14% | ||
| Private | 14,751 | 29% | 8576 | 32% | 5719 | 81% | ||
| Self‐pay | 2279 | 5% | 1316 | 5% | 264 | 4% | ||
| Other | 2115 | 4% | 1120 | 4% | 110 | 2% | ||
| Clinical characteristics | ||||||||
| Acuity | 0.02 | n/a | ||||||
| ESI 4 | 46,266 | 91% | 24,052 | 88% | n/a | |||
| ESI 5 | 4551 | 9% | 3159 | 12% | ||||
| Vital signs | ||||||||
| Heart rate < 60 or > 120 beats per minute | 10,451 | 21% | 5805 | 22% | 749 | 11% | 0.02 | 0.29 |
| Oxygen saturation <92% | 74 | 0.1% | 40 | 0.1% | 17 | 0.3% | 0.00 | 0.02 |
| Temperature >100.2°F | 3441 | 7% | 1837 | 7% | 184 | 3% | 0.00 | 0.20 |
| Systolic BP >160 (mmHg) | 1803 | 4% | 886 | 4% | 227 | 3% | 0.02 | 0.01 |
| Systolic BP <90 (mmHg) | 1341 | 3% | 752 | 3% | 52 | 1% | 0.01 | 0.16 |
| Respiratory rate >22 breaths per minute | 8783 | 18% | 5459 | 20% | 240 | 4% | 0.07 | 0.54 |
| Top 15 chief complaints | Fever | 8.9% | Fever | 10.1% | Cough | 7.9% | ||
| Cough | 5.6% | Rash | 5.0% | Sore throat | 5.3% | |||
| Rash | 4.8% | Cough | 4.9% | Rash | 5.1% | |||
| Ear pain | 4.6% | Ear pain | 4.3% | Cold symptoms | 4.2% | |||
| Back pain | 3.4% | Fall | 3.7% | Ear pain | 3.5% | |||
| Fall | 2.9% | Back pain | 3.4% | Fever | 3.2% | |||
| Knee pain | 2.3% | Knee pain | 2.3% | Urine frequency | 2.8% | |||
| Emesis | 2.3% | Emesis | 2.1% | Urine pain | 2.6% | |||
| Foot pain | 1.8% | Foot pain | 1.9% | Abdominal pain | 2.5% | |||
| Headache | 1.8% | Ankle pain | 1.9% | Eye problem | 2.2% | |||
| Arm pain | 1.7% | Eye pain | 1.8% | Back pain | 2.0% | |||
| Ankle pain | 1.7% | Arm pain | 1.7% | Headache | 1.6% | |||
| Finger laceration | 1.7% | Eye problem | 1.7% | Insect bite | 1.5% | |||
| Sore throat | 1.7% | Headache | 1.7% | Foot pain | 1.5% | |||
| Leg pain | 1.6% | Sore throat | 1.6% | Knee pain | 1.4% | |||
Note: Demographic and clinical characteristics of the visits in the following 3 populations: low‐acuity patients visiting the main ED before the WIC opened (column A), low‐acuity patients visiting the main ED after the WIC opened (column B), and WIC patients (column C). Demographic characteristics are not weighted or adjusted for multiple visits by the same individual. Standardized mean differences reflecting medium to large differences are bold.
Abbreviations: BP, blood pressure; ED, emergency department; ESI, Emergency Severity Index; n/a, not applicable; SD, standard deviation; WIC, walk‐in clinic.
In contrast, we observed differences in age, ethnicity, language, heart rate, and respiratory rate when examining the WIC and main ED low‐acuity patient's post‐WIC launch. The WIC population (Column C, Table 1) was on average moderately older, with a mean age of 38.7 years compared with 23.7 years (SMD = 0.71). The population was also slightly more female (57% in the WIC compared with 49%), but this difference was small by the SMD (0.15). The difference in ethnicity was large, with far fewer Hispanic/Latino patients (11% vs 45.6%; SMD = 0.89) and fewer Spanish speakers attending the WIC compared with the ED in the same period (1% vs 24%; SMD = 0.74). There was a somewhat greater proportion of White patients and a smaller proportion of those identifying with multiple races in the WIC compared with the ED (SMD = 0.20). Among low‐acuity patients in the ED, there was very little difference in the payer mix before and after the WIC opened. In fact, the percentage with private coverage rose slightly in the ED, from 29% to 32%. The large majority of the WIC population had private coverage (81%). The proportion of patients with unstable vital signs was generally lower in the WIC with notable differences in heart rate, temperature, and respiratory rate. Specifically, 11% of WIC patients had a heart rate >100 beats per minute versus 22% of low‐acuity patients in the main ED (SMD = 0.29). Rates of fever (temperature >100.2°F) were 3% versus 7% (SMD = 0.20), and respiratory rates >22 breaths per minute were 4% versus 20% (SMD = 0.54).
Figure 2 presents the results of the ITS analysis adjusted for seasonality. The y‐axis shows low‐acuity patient volume as the difference between the observed patient volume for each month and the mean volume for the appropriate calendar month. Model estimates suggest a slightly rising low‐acuity visit trend in the pre‐WIC period. Each month had 1.9 more visits on average than the previous (95% confidence interval [CI], −0.6 to +4.4), adjusted for seasonality. This is shown by the slightly upward slope of the orange line during the pre‐WIC period (Figure 2); however, this was not statistically significant (P = 0.15).
FIGURE 2.

Examining an interruption the main ED low‐acuity patient visit volume by month between the pre‐ versus post‐WIC launch periods. The y‐axis shows the difference in the actual versus adjusted monthly average for low‐acuity patient visit volume by month. The horizontal dotted line marks a difference = 0, or when the actual and adjusted monthly averages are the same. The blue line represents the patient visit difference. The orange line is the modeled volume trend over time. The left side of the figure (white background) presents the pre‐WIC period. The right side (gray background) presents the post‐WIC launch period. CI, confidence interval; WIC, walk‐in clinic.
In the transition from the pre‐WIC to post‐WIC launch period, the model revealed a statistically significant drop in low‐acuity ED patient volume (−129.8 patients; 95% CI, −225.3 to −34.4; P = 0.01). However, patient volume rose during the next 2 years at a rate of 8.9 (95% CI, 0.9 to +16.8) patients per month on average. Although this was a higher rate than before the WIC opened, the term was not significantly different from the pre‐WIC period in the model (P = 0.07). This can be seen in Figure 2, where at the close of the WIC in November 2019, the model estimates look similar to what we would expect if the WIC had not been launched and the pre‐WIC trend in low‐acuity main ED patient visit volume had continued (Figure 2).
6.1. LIMITATIONS
This is an observational study at 1 academic center that reports associations between the launch of the WIC and changes in main ED volume. Our approach to introducing the WIC differs in that it does not share a portal of entry with the main ED; in other WIC and UC models, patients seeking ED care are triaged to care in a separate care unit. We sought, rather, to influence patient self‐triage to the WIC over the ED via our marketing campaign. This variation in approach may have influenced the differences in demographic compositions between the main ED and WIC patients in the post‐WIC launch period.
This analysis did not evaluate patient satisfaction, cost, or health outcomes, as these measures were outside the scope of our capacity‐oriented focus. The primary driver for the initial opening of the WIC was capacity, particularly because of the pressures from increased seasonal ED volumes and flu‐related peaks in low‐acuity visits. This capacity focus was inherent in the analysis here, as there was interest in whether there was evidence that the WIC influenced low‐acuity patient volume in the main ED as the health system considered whether to reopen the WIC in 2022 after low‐acuity patient volume rebounded after a decline during the 2020 to 2021 COVID‐19 pandemic. 17
The WIC was staffed by emergency physicians, rather than internists, family practice practitioners, or advanced practice practitioners, so there may be a difference in the efficiency with which patients are seen with this staffing model.
Finally, this analysis used ESI score to identify the relevant patient population. ESI is a standard ED triage acuity score adopted nationwide; however, there is some debate on whether it can mis‐triage patients. 18 It is possible that using ESI as a surrogate marker for “low‐acuity” will lead to inaccuracies. However, in this analysis, ESI was used to not only identify low‐acuity patients in the ED but also to identify those presenting for WIC care who did not meet low‐acuity criteria. Because triaging staff in the WIC were the same pool of healthcare professionals performing similar triage screening in in the main ED, we expect the effect was balanced.
7. DISCUSSION
We did not find strong evidence that opening a WIC within close proximity (0.8 miles) of the main ED reduced its low‐acuity patient volume. Although there was a significant drop in low‐acuity ED visits with the launch of the WIC, the effect attenuated over time. In the peak low‐acuity volume season of the winter of 2017–2018, flu rates were markedly high, particularly in November 2017. At this time, the ED total volume far exceeded capacity. However, the logistical coordination of the WIC led to a launch in late February 2018, when flu rates were already trending down. In fact, the significant decline in low‐acuity ED patients that we observed in February 2018 (Figure 2) may be more related to sharp incidence decline during this flu season rather than an effect of the WIC opening. Figure 2 also shows that the ED experienced a spike in low‐acuity volume that was larger than that experienced in the past. Thus, outside the bounds of the general seasonal trend, had the WIC opened in early November 2017, it might have had more opportunity to influence ED low‐acuity visit volume.
We observed that low‐acuity patient volumes in the ED returned to pre‐WIC norms in November 2019 despite a steady volume of WIC patients. It may be that WIC visits were new patients presenting as a result of a supply‐induced demand, where patients will present with care needs that would not have generated an ED visit, thus using healthcare facilities because they are available. 19 This observation is based on Roemer's law, which refers to the positive correlation between the number of hospital beds available and their level of use. 20 Instead of shunting the flow of low‐acuity patients toward the WIC, the availability of the WIC may have created a new stream of patients seeking care from our ED team. This interpretation is supported by the significant demographic differences we observed between the WIC and low‐acuity ED patients, suggesting that the 2 facilities were drawing on different populations (Table 1). In a post hoc look at admissions by hour of day, we also observed that low‐acuity patient volume in the ED did not drop during the WIC opening hours of 3:00 pm to midnight; in fact, after the WIC opened, low‐acuity admissions by hour of day in the ED were unchanged (Figure 3).
FIGURE 3.

Distribution of patient arrivals by time of day: main ED low‐acuity and WIC. This figure shows the proportion of main ED low‐acuity and WIC patients arriving for care during the course of a day. ED, emergency department; WIC, walk‐in clinic.
Despite the potential variation in motivations for seeking WIC care, the presence of the WIC permitted the ED care team to see 7058 low‐acuity patients in a lower resource setting. Had these patients been seen in the ED, this would have increased the total low‐acuity visits from 27,211 to 34,269 and increased the proportion of low‐acuity visits from the 22% (27,211/119,872) experienced to 27% (34,269/[119,872 + 7058]).
Other research has suggested that the primary cause of ED overcrowding is attributed to limitations in inpatient capacity. This implies that siphoning off low‐acuity patients from an ED might not fully address ED volumes. 21 However, the strong representation of upper respiratory illnesses in the WIC population and the reflection of the challenging respiratory viral seasons of winter 2017–2018 make this a strong consideration for how the WIC may have affected main ED volumes at our institution. 22
Although low‐acuity patients in the pre‐WIC and post‐WIC launch periods were quite similar, the WIC population had some differences compared with the main ED. Specifically, WIC patients were older and included fewer Hispanics/Latinos and fewer non‐English‐speaking patients and were more likely to be privately insured. This may be because a major source of referrals to the WIC were often from nearby primary care clinics that did not have the space for same‐day visits. Patients who already have established primary care doctors are also less likely to be in underprivileged groups and are more likely to be insured. 23 We also found that the main ED low‐acuity patients included a higher frequency of tachycardia, fever, and tachypnea (Table 1). This may reflect patients with these signs of potential instability self‐triaging to the ED over clinic‐based care versus a strong arrival triage process at the WIC diverting patients with signs of potential instability to the main ED. Either way, this finding reflects appropriately balanced facility‐seeking patterns.
In summary, despite observing an initial drop in the volume of low‐acuity ED visits after the launch of the WIC, the effect was not sustained. However, the availability of the WIC added capacity for ED staff to provide unscheduled care in a lower resourced setting for 7058 patients. Making patients aware of low‐acuity care options where they can still be evaluated by emergency staff has the potential to establish a better match between low‐acuity unscheduled care needs and the resource intensity of the care environment to preserve the ED for higher acuity patients. Our findings suggest this potential may need to be further optimized.
AUTHOR CONTRIBUTIONS
Divya Kurian led the project and drafted the article with Shreya A. Shah and Sunny Patel. Daniel Ramberger, Ryan Ribeira, Ian Brown, Alexei Wagner, Laleh Gharahbhagian, and Sam Shen were members of the team that developed and launched the intervention and provided study design guidance. Vandana Sundaram designed the analysis with Maame Yaa Yiadom, Anna Graber‐Naidich, and Kate Miller. Vandana Sundaram, Kate Miller, and Anna Graber‐Naidich completed the data analysis. Daniel Ramberger, Saud Khan, Sunny Patel, Shashank Ravi, Ryan Ribeira, Ian Brown, Alexei Wagner, Laleh Gharahbhagian, Maame Yaa Yiadom, Sam Shen, and Kate Miller assisted with the interpretation of the results. Maame Yaa Yiadom provided scientific oversight for the study.
CONFLICT OF INTEREST STATEMENT
The authors declare no conflict of interest.
Supporting information
Supporting information
ACKNOWLEDGMENTS
We thank Kim Korwek for her helpful comments on the article and Melissa Pasao for her contributions in project management.
Biography
Divya Kurian, MD, is a clinical assistant professor of emergency medicine at Stanford University in Palo Alto, California.

Kurian D, Sundaram V, Naidich AG, et al. Changes in low‐acuity patient volume in an emergency department after launching a walk‐in clinic. JACEP Open. 2023;4:e13011. 10.1002/emp2.13011
Supervising Editor: Chadd Kraus, DO, DrPH.
Funding and support: By JACEP Open policy, all authors are required to disclose any and all commercial, financial, and other relationships in any way related to the subject of this article as per ICMJE conflict of interest guidelines (see www.icmje.org). The authors have stated that no such relationships exist.
REFERENCES
- 1. Naouri D, Ranchon G, Vuagnat A, et al. Factors associated with inappropriate use of emergency departments: findings from a cross‐sectional national study in France. BMJ Qual Saf. 2020;29(6):449‐464. doi: 10.1136/bmjqs-2019-009396 [DOI] [PMC free article] [PubMed] [Google Scholar]
- 2. Chen CE, Chen CT, Hu J, Mehrotra A. Walk‐in clinics versus physician offices and emergency rooms for urgent care and chronic disease management. Cochrane Database Syst Rev. 2017;2:CD011774. doi: 10.1002/14651858.CD011774.pub2 [DOI] [PMC free article] [PubMed] [Google Scholar]
- 3. Carlson LC, Raja AS, Dworkis DA, et al. Impact of urgent care openings on emergency department visits to two academic medical centers within an integrated health care system. Ann Emerg Med. 2020;75(3):382‐391. doi: 10.1016/j.annemergmed.2019.06.024 [DOI] [PubMed] [Google Scholar]
- 4. Hooker EA, Mallow PJ, Oglesby MM. Characteristics and trends of emergency department visits in the United States (2010‐2014). J Emerg Med. 2019;56(3):344‐351. doi: 10.1016/j.jemermed.2018.12.025 [DOI] [PubMed] [Google Scholar]
- 5. Szafran O, Bell NR. Use of walk‐in clinics by rural and urban patients. Can Fam Physician Med Fam Can. 2000;46:114‐119. [PMC free article] [PubMed] [Google Scholar]
- 6. Afilalo J, Marinovich A, Afilalo M, et al. Nonurgent emergency department patient characteristics and barriers to primary care. Acad Emerg Med Off J Soc Acad Emerg Med. 2004;11(12):1302‐1310. doi: 10.1197/j.aem.2004.08.032 [DOI] [PubMed] [Google Scholar]
- 7. Jones M. Walk‐in primary medical care centres: lessons from Canada. BMJ. 2000;321(7266):928‐931. [DOI] [PMC free article] [PubMed] [Google Scholar]
- 8. Mortensen K, Dean EB, French MT, Wang N, Chen J. Trends in health care utilization and expenditures in the United States across 5 decades: 1977–2017. Med Care. 2021;59(8):704‐710. doi: 10.1097/MLR.0000000000001557 [DOI] [PMC free article] [PubMed] [Google Scholar]
- 9. Walker NJ, Van Woerden HC, Kiparoglou V, Yang Y. Identifying seasonal and temporal trends in the pressures experienced by hospitals related to unscheduled care. BMC Health Services Research. 2016;16(1):1. [DOI] [PMC free article] [PubMed] [Google Scholar]
- 10. Sun BC, Hsia RY, Weiss RE, et al. Effect of emergency department crowding on outcomes of admitted patients. Ann Emerg Med. 2013;61(6):605‐611. doi: 10.1016/j.annemergmed.2012.10.026 e6 [DOI] [PMC free article] [PubMed] [Google Scholar]
- 11. Mehrotra A, Liu H, Adams JL, et al. Comparing costs and quality of care at retail clinics with that of other medical settings for 3 common illnesses. Ann Intern Med. 2009;151(5):321‐328. doi: 10.7326/0003-4819-151-5-200909010-00006 [DOI] [PMC free article] [PubMed] [Google Scholar]
- 12. Ahmed A, Fincham JE. Physician office vs retail clinic: patient preferences in care seeking for minor illnesses. Ann Fam Med. 2010;8(2):117‐123. doi: 10.1370/afm.1052 [DOI] [PMC free article] [PubMed] [Google Scholar]
- 13. Bernal JL, Cummins S, Gasparrini A. Interrupted time series regression for the evaluation of public health interventions: a tutorial. Int J Epidemiol. 2017;46(1):348‐355. doi: 10.1093/ije/dyw098 [DOI] [PMC free article] [PubMed] [Google Scholar]
- 14. Wagner AK, Soumerai SB, Zhang F, Ross‐Degnan D. Segmented regression analysis of interrupted time series studies in medication use research. J Clin Pharm Ther. 2002;27(4):299‐309. doi: 10.1046/j.1365-2710.2002.00430.x [DOI] [PubMed] [Google Scholar]
- 15. Zuabi N, Weiss LD, Langdorf MI. Emergency Medical Treatment and Labor Act (EMTALA) 2002-15: Review of Office of Inspector General Patient Dumping Settlements. Western Journal of Emergency Medicine. 2016;17(3):245. [DOI] [PMC free article] [PubMed] [Google Scholar]
- 16. Austin PC. Using the standardized difference to compare the prevalence of a binary variable between two groups in observational research. Commun Stat ‐ Simul Comput. 2009;38(6):1228‐1234. doi: 10.1080/03610910902859574. Published online April 9, 2009. [DOI] [Google Scholar]
- 17. Ravi S, Graber‐Naidich A, Sebok‐Syer SS, et al. Effectiveness, safety, and efficiency of a drive‐through care model as a response to the COVID‐19 testing demand in the United States. Journal of the American College of Emergency Physicians Open. 2022;3(6):e12867. [DOI] [PMC free article] [PubMed] [Google Scholar]
- 18. Hinson JS, Martinez DA, Schmitz PSK, et al. Accuracy of emergency department triage using the Emergency Severity Index and independent predictors of under‐triage and over‐triage in Brazil: a retrospective cohort analysis. Int J Emerg Med. 2018;11:3. doi: 10.1186/s12245-017-0161-8 [DOI] [PMC free article] [PubMed] [Google Scholar]
- 19. Taroni F. Roemer's effect reconsidered. J Health Serv Res Policy. 2001;6(1):56‐58. doi: 10.1258/1355819011927099 [DOI] [PubMed] [Google Scholar]
- 20. Delamater PL, Messina JP, Grady SC, WinklerPrins V, Shortridge AM. Do more hospital beds lead to higher hospitalization rates? a spatial examination of Roemer's Law. PLoS One. 2013;8(2):e54900‐e54900. doi: 10.1371/journal.pone.0054900 [DOI] [PMC free article] [PubMed] [Google Scholar]
- 21. Trzeciak S, Rivers EP. Emergency department overcrowding in the United States: an emerging threat to patient safety and public health. Emerg Med J. 2003;20(5):402‐405. doi: 10.1136/emj.20.5.402 PMID: 12954674; PMCID: PMC1726173 [DOI] [PMC free article] [PubMed] [Google Scholar]
- 22. Rolfes MA, Flannery B, Chung JR, et al. Effects of influenza vaccination in the United States during the 2017–2018 influenza season. Clinical Infectious Diseases. 2019;69(11):1845‐1853. doi: 10.1093/cid/ciz075 [DOI] [PMC free article] [PubMed] [Google Scholar]
- 23. Butler DC, Petterson S, Phillips RL, Bazemore AW. Measures of social deprivation that predict health care access and need within a rational area of primary care service delivery. Health Serv Res. 2013;48(2 Pt 1):539‐559. doi: 10.1111/j.1475-6773.2012.01449.x [DOI] [PMC free article] [PubMed] [Google Scholar]
Associated Data
This section collects any data citations, data availability statements, or supplementary materials included in this article.
Supplementary Materials
Supporting information