

Abstract
Background:
Community-based participatory research (CBPR) facilitates vulnerable communities and scientists collaborating to address pertinent health issues. For Latinx farmworkers, the employment of children and their resulting morbidity and mortality in the hazardous farm environment is a concern. Communicating child farmworker research results to farmworkers and service providers must take into account their language, literacy, and educational characteristics.
Objectives:
We describe the collaborative development and dissemination of research findings on child farmworkers by a CBPR partnership with the Latinx farmworker community.
Methods:
Key points for communication with infographics were abstracted from peer-reviewed research papers. An iterative process sought community partners’ input as the research partners developed the infographics.
Lessons Learned:
We developed infographics on heat-related illness, education, and musculoskeletal impacts of child labor, guided by published criteria for effective infographics. Efforts to disseminate finished infographics needed greater rigor.
Conclusions:
Infographics provide a means to communicate CBPR findings to community members.
INTRODUCTION
Community-based participatory research (CBPR) is designed to facilitate the collaboration between communities and researchers in addressing health issues pertinent to the communities.1,2 Once research designed by partnering communities and researchers has been conducted, communication of findings and proposed solutions to scientific, policy, and lay audiences is undertaken.3–6
Many communities in CBPR partnerships are vulnerable to health disparities. Low wage and dangerous jobs often predominate, and some members may not speak or read English and are undocumented. In addition, many community members may have low educational attainment and literacy, particularly for science and health information.7 All this can affect comprehension of scientific findings and requires a communication approach tailored to such community characteristics.
While communicating research findings to a scientific audience has the well-established format of scientific journal articles, communicating research results to other audiences is less well developed. The use of policy briefs is one strategy proposed for communication of CBPR research results to policy makers,8 condensing findings to a one- or two-page brief using text and simple graphs to convey research in support of policy change recommendations to legislators or others who typically prefer a short synopsis over a longer, more complex article.
Outside of CBPR, recent practice of health research communication to lay audiences has shown an uptick in the use of graphical formats. The Centers for Disease Control and Prevention, for example, now publishes simple graphical information online with many of its more traditional scientific articles in Morbidity and Mortality Weekly Report. Such articles contain, by and large, survey data with straightforward statistical findings. This is unlike much CBPR data that include both qualitative and quantitative results and where multiple analyses may contain complex findings. Thus, constructing such graphical communications from CBPR work presents different challenges.
The goal of this paper is to describe the collaborative development and dissemination of research findings to community members (including farmworkers and service providers) in a long-term program of CBPR research on the health of Latinx farmworkers. The particular tool chosen is the infographic. As the name suggests, infographics use graphical elements to convey information.9 The use of infographics is well-suited to CBPR because of the limited text, graphical representations of more complex information, and attention-catching color and design.
The Partnership
The program of CBPR research described here began in 1996, bringing together scientists, members of the farmworker community, and advocates and service providers for farmworkers to address issues of pesticide exposure. Since 1996, the research has expanded to include additional health concerns brought by the community (e.g., green tobacco sickness, childhood obesity, food security) with an emphasis on sharing results with farmworker families through culturally-appropriate approaches.6,10,11 Such dissemination is designed to help community members increase their knowledge of the health and social outcomes of farm work and to promote participation in advocacy and other efforts to ameliorate negative outcomes of farm work. In 2012, the collaborators focused research on the issue of hired child Latinx farmworkers. Press reports focused national attention on agricultural exceptionalism, the exemption of agriculture from many labor laws enacted to prevent injury and exploitation of workers.12 This includes hired child workers. Unlike those in other industries where children are employed, children as young as 10 years of age can be employed in agriculture. Other safeguards such as restricting hazardous work until age 18 are absent in agriculture, where children over 15 can work unlimited hours in any job regardless of hazards. The result is high rates of injury and mortality.13–16
In the initial collaboration, scientific researchers at Wake Forest School of Medicine and East Carolina University partnered with community-based organizations NC FIELD, Student Action with Farmworkers (SAF), and the North Carolina Justice Center to conduct a pilot study of hired Latinx child farmworker occupational health and safety.17–19
This pilot study led to the development of the Hired Child Farmworker Study, a 5-year mixed methods study, which is the basis for the current paper. All study procedures have been approved by the Wake Forest School of Medicine Institutional Review Board (Protocol 36403). The primary community partner in this larger study is SAF, a non-profit organization that specifically focuses on youth, most from farmworker families, in its education and advocacy work for farmworker justice. The Hired Child Farmworker Study includes a youth advisory board consisting of youth ages 13–18 who participate in SAF’s Levante Leadership Institute. They provide consultation on broad issues such as study recruitment, as well as detailed issues such as questionnaire wording. All youth receive annual stipends as a regular part of their Leadership Institute participation. Two Levante members or alumni are paid study investigators and receive a stipend from the grant. Details on the partnership with SAF are available elsewhere.20
The Hired Child Farmworker Study also includes a professional advisory committee consisting of representatives from agencies providing services to farmworkers. Members represent the Migrant Education Program (a federally-funded program supporting migrant children), NC Justice Center (a state-focused organization advocating for social justice), SAF (a non-profit advocating for social justice for farmworkers), NC Farmworkers Project (a non-profit providing services to farmworkers), NC FIELD (a non-profit focused on providing services to child farmworkers), Farm Labor Organizing Committee (a union of agricultural workers), Episcopal Farmworker Ministry, and NC Farmworker Health Program (a state agency administering farmworker health clinics). The committee meets two to four times a year to discuss topics related to project recruitment, retention, data collection, findings, and dissemination.
LESSONS LEARNED
Choosing to Disseminate Directly to Farmworkers and Service Providers Using Infographics
Like others conducting CBPR in the US with farmworkers, partnership members have learned that they face opposition from the larger economic and political interests of the agricultural sector when trying to disseminate health information that might be considered critical of agriculture. Companies that manufacture and sell pesticides, for example, actively work to undermine research findings around worker pesticide exposure and its health effects. Similarly, commodity groups and businesses dependent on growers sometimes work to discredit findings from research that show harm coming to farmworkers involved in production of their target crop.21,22 Having learned this, partnership members chose to bypass such organizations in disseminating research findings to the affected community. (See Figure 1 for the overall project dissemination plan.) In the past, the partnership has used cartoon videos and fotonovelas, but such products are expensive and time-consuming to produce. In a series of workshops with the youth advisory board, the partnership came to a consensus to develop infographics, recommended for limited resource settings,23 as a primary means of disseminating findings to farmworkers, their families, and service providers. The youth advisory board developed the original infographic,24 in meetings over the course of the academic year with partnership feedback. Its utility was a primary reason for developing additional infographics based on particular topical areas and for disseminating them more widely.
Figure 1.

Flow chart for designing communication of research results using policy briefs and infographics.
Infographics are described as visual storytelling.9 In medicine and public health, infographics are used to teach patients about concussion,25 antibiotic resistance,26,27 HIV treatment,28 and cancer risk with aging.29 Some have been evaluated for knowledge transfer in pre-post designs26,28 or in randomized trials against other communication techniques (e.g., videos, text)29,30 and found to be effective and appealing communication methods.
Lankow and colleagues9 recommend that a good infographic have three characteristics: utility—helping achieve a set of goals; soundness—containing information that is complete, trustworthy, and interesting; and beauty—visual appeal through illustration and data visualization. Others have elaborated on these characteristics and operationalized them in terms of design, organization, and color use for infographics.31,32 The partnership reviewed such principles and then employed them in this project.
Developing Research-Based Infographics
Partnership members learned that using a consistent method to produce similar infographics on different research topics is an efficient strategy. The method used for developing infographics includes considerable iterative review and consultation between the scientific researchers and community stakeholders (Figure 1). Topics for the infographics were chosen based on suggestions from the study partners at bimonthly team meetings of both scientific and community representatives. In choosing topics, the study partners took into account local and national concerns about farm labor in general and child farm labor, in particular. Because the infographics were all to be research-based, the list of the project’s peer-reviewed papers was a starting place. While some single papers (e.g., a mixed methods paper on heat-related illness33 and the impacts of farm work on child workers’ educational experience34) had sufficient material for an infographic, other groups of papers (e.g., those that included information on musculoskeletal injuries35–39) were combined to produce information for an infographic. Because the intention was to produce a set of infographics in a fairly short period of time to be disseminated together, the partners hired an intern skilled in the use of the Canva graphic design platform for eight weeks, and set the development of three infographics as a feasible goal. They chose three topics : (1) heat-related illness (HRI) (Figure 2), (2) educational experiences and challenges (Figure 3), and (3) injuries to muscles and joints (Figure 4).
Figure 2.

English language infographic, Hired Child Farmworkers: Heat-Related Illness (HRI).
Figure 3.
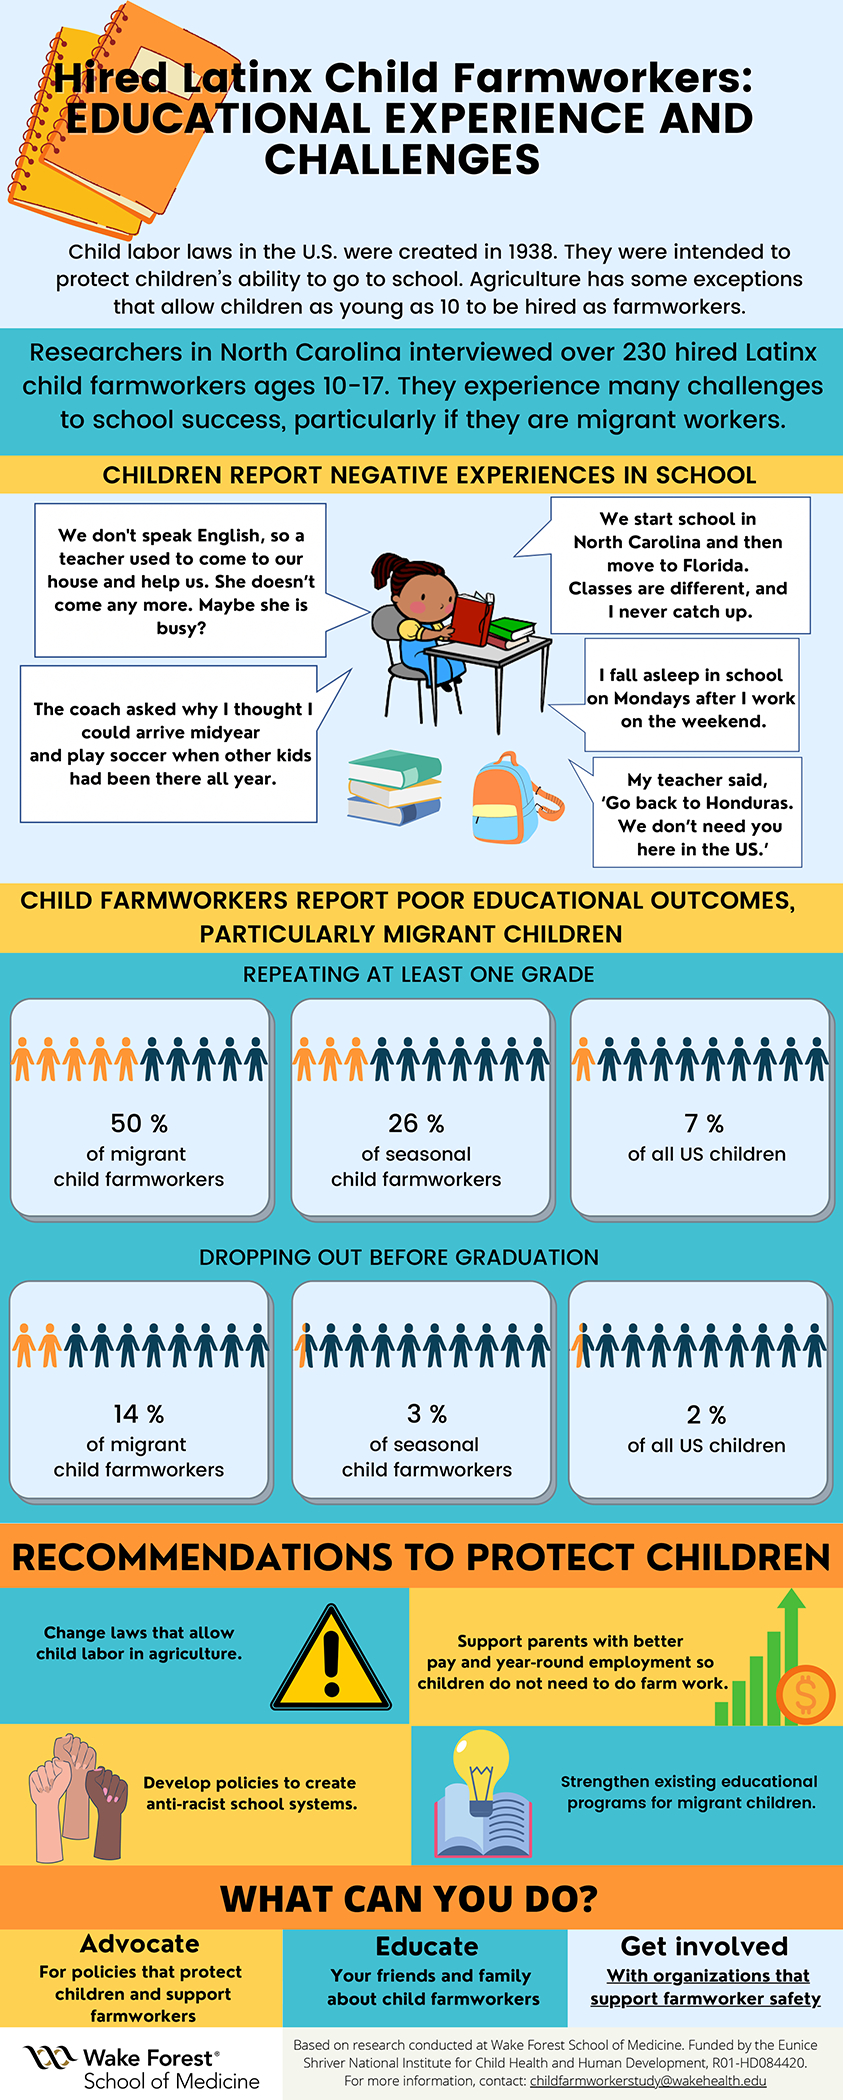
English language infographic, Hired Child Farmworkers: Educational Experiences and Challenges.
Figure 4.

English language infographic, Hired Child Farmworkers: Injuries to Muscles and Joints.
The partners developed the HRI infographic first, and its layout and development process formed a template for the other two infographics. This infographic was based on a mixed methods paper that detailed child farmworkers’ experiences of extreme heat, and symptoms they reported in surveys.33
The template, from top to bottom, includes a headline to alert the reader of the importance of the topic. It says HRI results from prolonged exposure to high temperatures and humidity, HRI is dangerous and can cause death, and children are at greater risk than adults. Immediately below is a statement to alert the reader that the infographic is research-based. It says that a recent study in North Carolina of over 230 hired child farmworkers ages 10–17 had found heat to be a primary danger in the fields.
A panel with children’s statements gathered in qualitative interviews about the experience of heat exposure follows. The original version only contained children’s statements. However, reviewing the interviews showed that statements were often made in the context of threats and pressure from supervisors to work harder. Cartoon word bubbles surrounding a child communicate the statements by child workers. Two bubbles at the top are of different color and come from apparently taller and unseen individuals; these contain threats reported by children as coming from supervisors. Child statements were pared down to essential words; editing decisions were made based on conveying the original meaning in a readable statement. For example, one child had described the heat in the fields: “You feel like a fish without no water.” During review, readers stumbled over this statement. A decision was made to remove the word “no” to make the statement grammatically correct, but still true to the child’s sentiment.
Below the qualitative findings is a panel with quantitative survey results designed to show that nearly half of children reported at least one HRI symptom while working in hot weather in the past year. The use of numbers was minimized by aligning the names of symptoms with horizontal bars in a pyramid containing the percent of children reporting the symptoms. This shows the reader that there is a progression from more to less common symptoms. Color gradation from yellow to red higher in the pyramid adds meaning to the graphic without using words.
The lowest sections of the infographic contain four recommendations to protect children. In drafting these, care was taken not to put the burden of protection on children themselves and to focus on policy: changing laws that allow child labor in agriculture, better support for parents so children do not need to work in the fields, establishing a national heat standard to protect workers, and training supervisors to recognize early warning signs of HRI. While these are aimed primarily at a variety of service providers to farmworkers, they also give farmworkers information to advocate for changes at work or in their communities. Below these recommendations, a call-to-action section asks, “What can you do?” and advises the reader to advocate, educate, and get involved. A link with “get involved” takes a reader to the website for the NC Farmworker Advocacy Network. Finally, the small type at the bottom contains the logo for the study’s host institution, acknowledgment of research funding, and an email the reader can use to obtain more information.
As this infographic was developed, the team sought input from a professional artist on appropriate colors. She suggested that using only warm tones (orange, yellow) might seem overly aggressive to readers and prevent them from continuing through the infographic. She identified some appropriate color palettes within the software package used. Therefore, complementary colors in blues and greys were added.
Once a complete draft of each infographic was formatted, it was shared with the partnership and with community members. Study team members provided email and oral comments. Virtual meetings were held with community members, including youth who designed the original infographic, to obtain feedback. Suggestions ranged from details of color and font to broader issues of comprehension. For the infographic focused on muscle and joint issues, community members misunderstood initial efforts to present somewhat complicated results; they also further stated that they wanted some numbers included so readers would have such a take-away. Therefore, the team developing the infographic changed an entire section to include prevalence of musculoskeletal pain symptoms.
The completed English version of each infographic was translated to Spanish by one native Spanish speaker familiar with the research. Then another Spanish speaker unfamiliar with the research reviewed the translation and suggested changes to clarify the findings. Because the Spanish translation had more words than the English original and took more space, additional editing of the English reduced the amount of text, which allowed the Spanish text to be reduced. (See the online Appendix for copies of the final Spanish and English versions.)
Key Considerations in Developing the Infographics
The partnership learned that Lankow and colleagues’9 three criteria for infographics (utility, soundness, and beauty) provided an effective guide for the development process. The primary consideration for the partnership was soundness, staying true to the published research findings. Beyond that, the infographic had to meet the stated community need and expectations for presentation (utility) by minimizing text and using primarily graphics to convey meaning. Each infographic started with qualitative findings to convey the children’s experiences and pique the reader’s interest, reinforcing the notion of infographics as visual storytelling. This was followed by quantitative results that used simple data visualization tools to illustrate findings. These included a modified bar chart to show HRI symptoms as a pyramid, a pie chart to compare prevalence of musculoskeletal symptoms, and pictograms to compare educational outcomes for child farmworkers with all children in the US. Finally, the partnership tested various color combinations to see which harmonized and highlighted findings.
Disseminating Infographics
Despite having developed a consistent process to disseminate the completed infographics through community partners who were service providers to farmworkers and national and international groups concerned with child labor, the partnership learned that it was difficult to get extensive objective data on how or in what ways the infographics were used after our dissemination. The partnership constructed a list of agencies concerned with the welfare of child farmworkers and organizations who typically advocate for farmworker rights or have direct contact with farmworkers and their families. Where known, specific individuals at these agencies and organizations were targeted. In an email with the English and Spanish versions of all three infographics attached, the partnership explained the source of the infographics and the intended audience. The recipients were asked to further distribute the infographics via their own social media channels, to post the infographics on their website, to distribute copies via email or hard copy to any known farm-working child or their parents, and to print and post the infographics in clinics or other venues where they might be seen by farmworkers.
Subjective information was obtained, however, by following-up with community partners two weeks after initial dissemination, revealing that the infographics had been posted on sites such as Facebook and sent out via email to listservs. For example, the Levante program distributed the infographics to parents of youth in the program. Several organizations included the infographics in electronic and print newsletters and posted them on websites. One noted that a recipient had found the child quotations “powerful and triggering”, but few others could provide specific feedback. One organization was scheduled to disseminate the HRI infographic in an upcoming panel with a heat stress coalition.
Beyond community partners, the infographics were disseminated electronically to national and international partners via the Child Labor Coalition (CLC) (stopchildlabor.org). The CLC is a group of about 400 governmental and non-governmental organization representatives who work to minimize child labor and protect the well-being of children in the US and abroad. The CLC distributed the infographics to coalition members via email, and also composed and posted tweets on Twitter, where they have 10,000 followers. The distribution produced several requests for the published papers on which the infographics were based, and reposts on other organizations’ websites.
The overall process for disseminating findings from the partnership’s CBPR work is presented in Figure 1. As indicated, two pathways have been used to present findings to non-scientific audiences. The first pathway, policy briefs, was used to reach policy makers. That process was iterative (see8 for more detailed steps in the process). Topics chosen had to be linked to a specific policy that could be changed to improve farmworker health. The second pathway, infographics, was used to reach a lay audience of farmworkers and a variety of service providers for farmworkers. For infographics, the partnership assumed less formal education and less familiarity with data presentation than was assumed for policy briefs.
CONCLUSIONS
Infographics represent a low cost approach for disseminating research results to the community members collaborating in CBPR studies. Unlike policy briefs, which require greater literacy and are limited to findings that can be tied to specific policies, infographics are designed to engage a lay audience of community members to increase their knowledge and raise their awareness of challenges to their health and safety or that of their clients.
CBPR studies often have findings complicated by the collection of multiple types of data (e.g., both qualitative and quantitative) that may require a more nuanced presentation than do results of a simple survey. The storytelling approach of infographics lends itself to presenting these results accurately and in a format that can engage community members.
The partnership described here has been dedicated to presenting findings to multiple audiences: scientific researchers, policy makers, and now, community members. The processes described here focus on the threats to health and safety of Latinx child farmworkers. They are transferable to other partnerships and other research topics. Future studies that can conduct a systematic evaluation of infographics will add to understanding of their role in disseminating study findings.
Supplementary Material
ACKNOWLEDGMENTS
The authors appreciate the support and participation of Student Action with Farmworkers’ Levante Leadership Institute co-investigators and members who serve as the youth advisory committee, and the members of the professional advisory committee. Authors also appreciate the many organizations that helped disseminate the infographics. Authors especially thank the children who participated in this study. This research was supported by the National Institutes of Health under grant number 5R01HD084420.
REFERENCES
- 1.Arcury TA, Quandt SA. Community-based participatory research (CBPR) and other community-engaged research with Latinx farmworker communities in the eastern United States. IN Arcury TA and Quandt SA, eds. Latinx Farmworker in the Eastern United State—Health, Safety, and Justice, Second Edition. Cham, Switzerland: Springer Nature Switzerland SG. 2020, pp. 197–226. [Google Scholar]
- 2.Israel BA, Parker EA, Rowe Z, Salvatore A, Minkler M, López J, Butz A, Mosley A, Coates L, Lambert G, Potito PA, Brenner B, Rivera M, Romero H, Thompson B, Coronado G, Halstead S. Community-based participatory research: lessons learned from the Centers for Children’s Environmental Health and Disease Prevention Research. Environ Health Perspect. 2005;113:1463–1471. [DOI] [PMC free article] [PubMed] [Google Scholar]
- 3.Brody JG, Dunagan SC, Morello-Frosch R, Brown P, Patton S, Rudel RA. Reporting individual results for biomonitoring and environmental exposures: lessons learned from environmental communication case studies. Environ Health. 2014;26;13:40. [DOI] [PMC free article] [PubMed] [Google Scholar]
- 4.Ohayon JL, Cousins E, Brown P, Morello-Frosch R, Brody JG. Researcher and institutional review board perspectives on the benefits and challenges of reporting back biomonitoring and environmental exposure results. Environ Res. 2017;153:140–149. [DOI] [PMC free article] [PubMed] [Google Scholar]
- 5.Perovich LJ, Ohayon JL, Cousins EM, Morello-Frosch R, Brown P, Adamkiewicz G, Brody JG. Reporting to parents on children’s exposures to asthma triggers in low-income and public housing, an interview-based case study of ethics, environmental literacy, individual action, and public health benefits. Environ Health. 2018;17(1):48. [DOI] [PMC free article] [PubMed] [Google Scholar]
- 6.Quandt SA, Doran AM, Rao P, Hoppin JA, Snively BM, Arcury TA. Reporting pesticide assessment results to farmworker families: Development, implementation and evaluation of a risk communication strategy. Environ Health Perspect. 2004;112:636–642. [DOI] [PMC free article] [PubMed] [Google Scholar]
- 7.Clinical and Translational Science Awards Consortium. (2011) Principles of Community Engagement (2nd ed.). Bethesda, MD; National Institute of Heath; Publication No. 11–7782. [Google Scholar]
- 8.Arcury TA, Wiggins MF, Brooke C, Jensen A, Summers P, Mora DC, Quandt SA. Using “policy briefs” to present scientific results of CBPR: Farmworkers in North Carolina. Prog Community Health Partnersh. 2017;11(2):137–147. [DOI] [PMC free article] [PubMed] [Google Scholar]
- 9.Lankow J, Ritchie J, Crooks R. Infographics. The power of visual storytelling. Hoboken, NJ: Wiley; 2012. [Google Scholar]
- 10.Quandt SA Grzywacz JG, Talton JW, Trejo G, Tapia J, D’Agostino RB Jr, Mirabelli MC, Arcury TA. Evaluating the effectiveness of a lay health promoter-led community-based participatory pesticide safety intervention with farmworker families. Health Promot Pract. 2013;14:425–432. [DOI] [PMC free article] [PubMed] [Google Scholar]
- 11.Quandt SA, Arcury TA. Developing occupational safety and health training programs for immigrant workers: Translating research to practice. IN: Leong FTL, Eggerth DE, Chang C-H, Flynn MA, Ford JK, Martinez RO, eds., Occupational health disparities: Improving the well-being of ethnic and racial minority workers. American Psychological Association. 2017, pp. 161–180. [Google Scholar]
- 12.Wiggins M Farm labor and the struggle for justice in the eastern United States. In: Arcury TA, Quandt SA, eds. Latino farmworkers in the eastern United States: Health, safety, and justice. New York, NY: Springer; 2009, pp. 201–206. [Google Scholar]
- 13.Goldcamp M, Hendricks KJ, Myers JR. Farm fatalities to youth 1995–2000: A comparison by age groups. J Safety Res. 2004;35:151–157. [DOI] [PubMed] [Google Scholar]
- 14.Hard DL, Myers JR. Fatal work-related injuries in the agriculture production sector among youth in the United States, 1992–2002. J Agromedicine. 2006;11:57–65. [DOI] [PubMed] [Google Scholar]
- 15.Zaloshnja E, Miller TR, Lawrence B. Incidence and cost of injury among youth in agricultural settings, United States, 2001–2006. Pediatrics. 2012;129:728–734. [DOI] [PubMed] [Google Scholar]
- 16.National Children’s Center for Rural and Agricultural Health and Safety. 2018. Fact Sheet, Childhood Agricultural Injuries in the U.S. Marshfield, WI. Available from: https://www.marshfieldresearch.org/Media/Default/NFMC/PDFs/2018%20Child%20Ag%20Injury%20Factsheetpdf.pdf.
- 17.Arcury TA, Rodriguez G, Kearney GD, Arcury JT, Quandt SA. Safety and injury characteristics of youth farmworkers in North Carolina: a pilot study. J Agromedicine. 2014;19(4):354–63. [DOI] [PubMed] [Google Scholar]
- 18.Arcury TA, Kearney GD, Rodriguez G, Arcury JT, Quandt SA. Work safety culture of youth farmworkers in North Carolina: a pilot study. Am J Public Health. 2015;105:344–50. [DOI] [PMC free article] [PubMed] [Google Scholar]
- 19.Kearney GD, Rodriguez G, Quandt SA, Arcury JT, Arcury TA. Work safety climate, safety behaviors, and occupational injuries of youth farmworkers in North Carolina. Am J Public Health. 2015;105:1336–1343. [DOI] [PMC free article] [PubMed] [Google Scholar]
- 20.Arnold TJ, Malki A, Leyva J, Ibarra J, Daniel SS, Ballard PJ, Sandberg JC, Quandt SA, Arcury TA. Engaging youth advocates in community-based participatory research on child farmworker health in North Carolina. Prog Community Health Partnersh. 2019;13:191–199. [DOI] [PMC free article] [PubMed] [Google Scholar]
- 21.Arcury TA. Anthropology in agricultural health and safety research and intervention. J Agromedicine. 2017;22:3–8. [DOI] [PubMed] [Google Scholar]
- 22.Arcury TA, Estrada JM, Quandt SA. Overcoming language and literacy barriers in safety and health training of agricultural workers. J Agromedicine. 2010. Jul;15(3):236–48. [DOI] [PMC free article] [PubMed] [Google Scholar]
- 23.Stonbraker S, Halpern M, Bakken S, Schnall R. Developing infographics to facilitate HIV-related patient-provider communication in a limited-resource setting. Appl Clin Inform. 2019;10:597–609. [DOI] [PMC free article] [PubMed] [Google Scholar]
- 24.Levante Leadership Institute. Got food? Thank a child. Durham, NC: Student Action with Farmworkers; 2020, infographic. Available at: https://saf-unite.org/resources_/child-labor-research-study/. [Google Scholar]
- 25.Provvidenza CF, Hartman LR, Carmichael J, Reed N. Does a picture speak louder than words? The role of infographics as a concussion education strategy. J Vis Commun Med. 2019;42:102–113. [DOI] [PubMed] [Google Scholar]
- 26.Van Hecke O, Lee J, Butler C, Moore M, Tonkin-Crine S. Using evidence-based infographics to increase parents’ understanding about antibiotic use and antibiotic resistance: a proof-of-concept study. JAC-Antimicrobial Resistance. 2020;2(4):dlaa102. [DOI] [PMC free article] [PubMed] [Google Scholar]
- 27.Arrighi E, Ruiz de Castilla EM, Peres F, Mejía R, Sørensen K, Gunther C, Lopez R, Myers L, Quijada JG, Vichnin M, Pleasant A. Scoping health literacy in Latin America. Glob Health Promot. 2021. Jun 25:17579759211016802. doi: 10.1177/17579759211016802. Epub ahead of print. [DOI] [PMC free article] [PubMed] [Google Scholar]
- 28.Stonbraker S, Liu J, Sanabria G, George M, Cunto-Amesty S, Alcántara C, Abraído-Lanza AF, Halpern M, Rowell-Cunsolo T, Bakken S, Schnall R. Clinician use of HIV-related infographics during clinic visits in the Dominican Republic is associated with lower viral load and other improvements in health outcomes. AIDS Behav. 2021. Jun 15. doi: 10.1007/s10461-021-03331-8. Epub ahead of print. [DOI] [PMC free article] [PubMed] [Google Scholar]
- 29.McCrorie AD, Donnelly C, McGlade KJ. Infographics: healthcare communication for the digital Age. Ulster Med J. 2016;85:71–75. [PMC free article] [PubMed] [Google Scholar]
- 30.Ebrahimabadi M, Rezaei K, Moini A, Fournier A, Abedi A. Infographics or video; which one is more effective in asthmatic patients’ health? a randomized clinical trial. J Asthma. 2019;56:1306–1313. [DOI] [PubMed] [Google Scholar]
- 31.Hernandez-Sanchez S, Moreno-Perez V, Garcia-Campos J, Marco-Lledó J, Navarrete-Muñoz EM, Lozano-Quijada C. Twelve tips to make successful medical infographics. Med Teach. 2020:1–19. [DOI] [PubMed] [Google Scholar]
- 32.Joshi M, Gupta L. Preparing infographics for post-publication promotion of research on social media. J Korean Med Sci. 2021;36(5):e41. [DOI] [PMC free article] [PubMed] [Google Scholar]
- 33.Arnold TJ, Arcury TA, Sandberg JC, Quandt SA, Talton JW, Mora DC, Kearney GD, Chen H, Wiggins MF, Daniel SS. Heat-related illness among Latinx child farmworkers in North Carolina: A mixed-methods study. New Solut. 2020;30:111–126. [DOI] [PMC free article] [PubMed] [Google Scholar]
- 34.Quandt SA, Arnold TJ, Mora DC, Arcury TA, Talton JW, Daniel SS. Hired Latinx child farmworkers in North Carolina: educational status and experience through a social justice lens. New Solut. 2021;30:282–293. [DOI] [PMC free article] [PubMed] [Google Scholar]
- 35.Quandt SA, Arnold TJ, Talton JW, Miles CM, Mora DC, Arcury TA, Daniel SS. Musculoskeletal injury symptoms among hired Latinx child farmworkers in North Carolina. Am J Ind Med. 2021;64(7):620–628. [DOI] [PMC free article] [PubMed] [Google Scholar]
- 36.Quandt SA, Arnold TJ, Arcury TA, Talton JW, Daniel SS. Self-reported physical demands associated with crops and job tasks among Latinx hired child farmworkers. J Occ Environ Health. Publish ahead of print, July 8, 2021. doi: 10.1097/JOM.0000000000002322 [DOI] [PMC free article] [PubMed] [Google Scholar]
- 37.Arcury TA, Arnold TJ, Sandberg JC, Quandt SA, Talton JW, Malki A, Kearney GD, Chen H, Wiggins MF, Daniel SS. Latinx child farmworkers in North Carolina: Study design and participant baseline characteristics. Am J Ind Med. 2019. Feb;62(2):156–167. [DOI] [PMC free article] [PubMed] [Google Scholar]
- 38.Arnold TJ, Arcury TA, Quandt SA, Mora DC, Daniel SS. Structural vulnerability and occupational injury among Latinx child farmworkers in North Carolina. New Solut. 2021;31:125–140. [DOI] [PMC free article] [PubMed] [Google Scholar]
- 39.Arcury TA, Arnold TJ, Quandt SA, Chen H, Kearney GD, Sandberg JC, Talton JW, Wiggins MF, Daniel SS. Health and occupational injury experienced by Latinx child farmworkers in North Carolina, USA. Int J Environ Res Public Health. 2019. Dec 30;17(1):248. [DOI] [PMC free article] [PubMed] [Google Scholar]
Associated Data
This section collects any data citations, data availability statements, or supplementary materials included in this article.