

Abstract
Objective:
To quantify the effect of datalogging on speech recognition scores and time-to-achievement for a ‘benchmark’ level of performance within the first year, and to provide a data-driven recommendation for minimum daily cochlear implant (CI) device usage to better guide patient counseling and future outcomes.
Study Design:
Retrospective cohort.
Setting:
Tertiary referral center.
Patients:
337 adult CI patients with datalogging and speech recognition outcome data who were implanted between August 2015 and August 2020.
Main Outcome Measures:
Processor datalogging, speech recognition scores, achievement of ‘benchmark speech recognition performance’ defined as 80% of the median score for speech recognition outcomes at our institution.
Results:
The 1-month datalogging measure correlated positively with word and sentences scores at one-, three-, six-, and twelve-months post-activation. Compared to age, sex, and preoperative performance, datalogging was the largest predictive factor of benchmark achievement on multivariate analysis. Each hour/day increase of device usage at 1-month resulted in a higher likelihood of achieving benchmark CNC and AzBio scores within the first year (OR 1.21, p <0.001) as well as earlier benchmark achievement. Receiver operator characteristic (ROC) curve analysis identified the optimal datalogging threshold at an average of 12 hours/day.
Conclusions:
Early CI device usage, as measured by 1-month datalogging, predicts benchmark speech recognition achievement in adults. Datalogging is an important predictor of CI performance within the first-year post-implantation. These data support recommended daily CI processor utilization of at least 12 hours/day to achieve optimal speech recognition performance for most patients.
Keywords: cochlear implant, datalogging, outcomes, daily usage, speech perception
INTRODUCTION
Cochlear implants (CI) offer a hearing rehabilitation option for patients who derive inadequate benefit from hearing aids and other assistive devices. Despite their overall effectiveness, there remains considerable variability in individual speech recognition outcomes. Many studies and meta-analyses have evaluated patient-related factors to predict speech recognition outcomes for patients with these devices.
Factors for post-lingually deafened adults including age at implantation, duration of hearing loss, gender, etiology, and pre-operative speech recognition scores, which each demonstrate statistically significant but low-to-negligible associations with ultimate CI performance (1,2). Other factors such as spiral ganglion cell count, top-down processing, and neural health are difficult if not impossible to alter prior to CI evaluation or implantation (3–5). Surgical variables such as electrode position, electrode type, and surgical technique are implicated in outcomes but are imperfectly modifiable and only accessible in the immediate perioperative period (6–13). Post-operative elements include utilization of residual low-frequency acoustic hearing, advanced device mapping/programming, and the utilization of aural rehabilitation (14,15). Despite a multitude of potential factors contributing to speech performance, our ability to affect or improve CI performance is limited by individual patient characteristics, the limited windows of intervention for certain variables, as well as the cost associated with therapies, imaging, and clinical encounters.
Recent improvements in CI processor features allow for the monitoring of average daily processor usage or “datalogging” within the programming software. Initially, clinicians utilized this feature to monitor wear time for pediatric patients, demonstrating that average daily processor usage had a significant association with auditory outcome measures in children (16–18). Alhabib et al. suggested that daily usage greater than 8.3 hours per day was associated with acceptable language development in this population (19). In the adult population, correlation coefficients of daily processor use with speech recognition are between 0.4–0.6 (15,20). A correlation of 0.6 is stronger than associations of other commonly referenced factors such as age at implantation (21,22), duration of deafness (21–24), electrode position (25–27), and is generally equivalent to correlations of spectral resolution (28–30) and spectrotemporal resolution (31,32). Recent research demonstrates that intervention to increase daily CI usage results in improved auditory perception and speech recognition scores for adult CI users even after years of device usage, suggesting a causal relationship between daily CI use and auditory outcomes (33).
Despite a relatively recent appreciation for daily device usage as a contributor to auditory perception and speech recognition scores in adults, a paucity of evidence exists regarding the impact of CI device datalogging on the ultimate success and speech outcomes in adults. Prior recommendations advising at least 10 hours of daily device usage are based on better-than-average speech recognition outcomes for adults above the 50th-percentile for datalogging. However, little is known regarding the importance of early (e.g., the first month immediately after activation) usage or any additional benefit to datalogging beyond 10 hours per day. We hypothesized that early datalogging would predict CI performance in adults and that additional benefits to processor daily usage extend beyond 10 hours per day. Herein, we aim 1) to quantify the effect of datalogging on speech recognition scores and time-to-achievement for a ‘benchmark’ level of performance within the first year, and 2) to provide a data-driven recommendation for minimum daily CI device usage to better guide patient counseling and future outcomes.
MATERIALS AND METHODS
After institutional review board approval, a retrospective review identified adult CI recipients implanted with their first device between August 2015 and August 2020 with datalogging information available at the 1-month post-activation visit. Patient demographics, datalogging, and speech recognition outcomes were collected at follow-up visits within the first-year post-activation (most commonly 1-, 3-, 6-, and 12-months). Datalogging was defined as the average hours of processor use per day regardless of listening condition; this choice was motivated by data suggesting a much lower correlation between speech recognition versus time in speech than speech recognition versus total datalogging (34). Exclusion criteria included those with prelingual deafness, prior ipsilateral or contralateral CI surgery, device failure during the study period, or absence of datalogging data (often due to lack of processor feature).
Adult patients underwent audiologic evaluation according to the Minimum Speech Test Battery (35). Speech recognition testing for Consonant-Nucleus-Consonant (CNC) words and AzBio sentences in quiet was completed in a sound booth with speech presentation level of 60 dB sound pressure level (SPL, A-weighted) (36,37). Stimuli were presented from a single loudspeaker at 0-degree azimuth (1 m). Testing was completed in the CI-alone condition with the contralateral ear plugged or masked as required based on the thresholds measured for the contralateral ear.
The calculation of time-to-benchmark for speech recognition scores in this cohort was based on a prior report suggesting patients achieved benchmark at or above 80% of the average speech recognition scores for patients undergoing CI (38). This time-to-benchmark metric was designed to create a binary classification system for CI achievement. During this retrospective chart review, we captured data for all post-lingually deafened adults undergoing implantation at our institution from 2015-2020 who also had speech recognition scores available at 12-months post-activation; the mean CNC and AzBio in quiet scores at 12 months were 50.3% and 64.7%, respectively (n=405). As a result, benchmark CNC and AzBio in quiet scores were calculated as a CNC score of 40% or greater and AzBio in quiet score of 52% or greater.
Analyses were performed using IBM SPSS Statistics version 28.0 (IBM Corp., Armonk, New York) and GraphPad Prism 9.2.0 (GraphPad Software, La Jolla, California). Nominal data were summarized using frequency distributions. Given the presence of some moderate outliers and skewness of the age, CNC, AzBio, datalogging, and time to benchmark data distributions, median, inter-quartile range, and range were used for summarizing distributions. Unadjusted (bivariate) and adjusted (multivariate) logistic regression models were used to test for associations of age, sex, preoperative CNC/AzBio scores, and post-activation CI achievement of benchmark scores within the first one year. Receiver operating characteristic (ROC) models were used to generate initial CI usage thresholds likely to be predictive of achieving those respective. CNC or AzBio benchmarks. Estimates of expected time to benchmark and differences between groups were generated using Kaplan-Meier analyses and log-rank Mantel-Cox tests. Patients who did not meet either benchmark within one year were censored from these analyses. P values <0.05 were considered statistically significant.
RESULTS
Demographics and Clinical Characteristics
Characteristics of the 337 patients with 1-month datalogging data and at least one post-activation CNC or AzBio score are summarized in Table 1. Median age was 68.7 years and 53% were male. The median pre-operative CNC word score was 8% (IQR 0% to 22%) and the median AzBio in quiet sentence score was 10% (IQR 0% to 34%). Median 1-month CI use for all patients was 10.7 hours per day, with a range of 0.2 to 17.3 hours/day.
Table 1.
Patient Characteristics and Demographics
| Characteristic | Incidence/Median (n=337) | Range |
|---|---|---|
| Gender | ||
| Female | 157 (47%) | |
| Male | 180 (53%) | |
| Laterality | ||
| Left | 146 (43%) | |
| Right | 191 (57%) | |
| Age | 68.7 | (IQR 56-78, range 17.5-96.7) |
| Pre-operative CNC word score | 8.0 | (IQR 0-22, range 0-71) |
| Pre-operative AzBio in Quiet sentence (n=292) | 10.0 | (IQR 0-34, range 0-80) |
| 1-month CI use (hours per day) | 10.7 | (IQR 8.0-12.6, range 0.2-17.3) |
| Months to CNC Benchmark* (n = 238, 70.6%) | 2.1 | (IQR 1.0-3.7, range 1-12) |
| Months to AzBio Benchmark* (n = 209, 71.6%) | 3.4 | (IQR 3.0-5.3, range 1-12) |
CNC indicates Consonant-Nucleus-Consonant word score; IQR, interquartile range.
Early Datalogging Correlates with Datalogging and Speech Outcomes Within the First Year
One-month datalogging values correlated to datalogging values at 3-months (rs=0.7646, p <0.0001), 6-months (rs=0.6996, p <0.0001), and 12-months (rs=0.5300, p <0.0001) (Figure 1). One-month datalogging values significantly correlated to speech outcomes at the 1-month, 3-month, 6-month, and 12-month follow-up visits (Figure 2).
Figure 1.

Datalogging at 1 month plotted against datalogging measured at subsequent follow-up visits. The bold line marks equivalence. The 3-month (rs=0.7646, p <0.0001), 6-month (rs=0.6996, p <0.0001), and 12-month (rs=0.5300, p <0.0001) points are shown.
Figure 2.

Daily usage at 1 month is positively correlated with A) 1-month, B) 3-month, C) 6-month, and D) 12-month consonant-nucleus-consonant (CNC) word scores as well as E) 1-month, F) 3-month, G) 6-month, and H) 12-month AzBio Quiet sentence scores. Spearman correlation coefficients, p values, and number of data points (n) are given.
Achievement of Benchmark Scores and Associated Factors
Within 1 year of activation, 70.6% (238 of 337) of patients met the 40% CNC performance benchmark and 71.6% (209 of 292) of patients met the 52% AzBio in quiet performance benchmark. Factors associated with benchmark attainment are included in Table 2. Summaries of the unadjusted univariate logistic regression analyses, as well as multivariate models that included age, sex, pre-operative score, and 1-month datalogging are also shown in Table 2. Higher pre-operative word recognition scores increased the likelihood of achieving the respective benchmarks in both the univariate and multivariate analyses. Relative to younger patients, older patients were less likely to meet the AzBio in quiet benchmark but not the CNC benchmark within the first year. Based on the calculated odds ratios, every hourly increase in datalogging increased the likelihood of meeting benchmark by approximately 1.2-fold (p < .001). Patients who met the CNC benchmark within the first year utilized their CI a median of 11.3 hours per day (IQR = 9.1-12.9) compared to a median 9.1 hours (IQR = 5.2 - 11.3) for those who did not meet that benchmark. Use patterns were similar for the AzBio benchmark (median = 11.3 vs. 9.5 hours/day). Within the first year 88 patients did not meet either benchmark, 30 met the CNC but not the AzBio benchmark, and 10 met the AzBio but not the CNC benchmark.
Table 2.
Associations with Benchmark Achievement
| Unadjusted |
Adjusted |
|||||
|---|---|---|---|---|---|---|
| OR | P value | OR (95% CI) | P value | |||
| CNC (N=337) | Age (years) | 0.99 | .584 | 0.99 (0.97, 1.01) | .480 | |
| Male gender | 1.49 | .100 | 1.16 (0.69, 1.93) | .566 | ||
| Word Score (Pre-operative) | 1.03 | .001 | 1.03 (1.01, 1.06) | .001 | ||
| Datalogging (1-month) | 1.20 | < .001 | 1.21 (1.12, 1.31) | < .001 | ||
|
| ||||||
| AzBio in Quiet (N=292) | Age (years) | 0.97 | .003 | 0.97 (0.95, 0.99) | .002 | |
| Male gender | 0.93 | .779 | 0.77 (0.43, 1.35) | .354 | ||
| Sentence Score (Pre-operative) | 1.02 | .007 | 1.02 (1.01, 1.04) | .006 | ||
| Datalogging (1-month) | 1.19 | < .001 | 1.21 (1.11, 1.31) | < .001 | ||
CI indicates confidence interval; CNC, Consonant-Nucleus-Consonant word score; OR, odds ratio.
Building Statistical Models for Daily Device Usage Recommendations
ROC curve analysis was performed to build classification models for both CNC [area under the curve (AUC) = 0.67, 95% C.I.: 0.60 0.73, p < .001] and AzBio in quiet (AUC: 0.67, 95% C.I.: 0.60, 0.74, p < .001) benchmarks (Figure 3). Consistent with the logistic regression analyses, increased datalogging within the first month of usage was associated with an increased likelihood of meeting both the CNC and the AzBio benchmarks. Utilizing our group’s prior published work, we chose an initial cut-off of ≥10 hours per day as a starting point for analysis (20). Evaluation of the sensitivity-specificity curves suggested usage of ≥10 hours provided an initial indicator of increased likelihood of achieving the CNC or the AzBio benchmark within 1 year of CI activation. Subsequent multivariate Cox regression models indicated a significantly shorter time to achieving benchmark for those patients who used the CI ≥10 hours/day within the first month after activation (p < .001). Further analysis of the ROC curves was performed utilizing the Positive Likelihood Ratio (LR+), defined as Sensitivity / (1 – Specificity) (39). In this clinical situation, LR+ is the probability that a patient would attain benchmark speech recognition scores within the first year. As a result, our strategy to determine an ideal datalogging threshold was to identify the point along the curve that resulted in the highest LR+ at the lowest relative hour/day datalogging. Via this approach, we identified the optimal datalogging thresholds at 11.5 hours/day for CNC words and 12.5 hours/day for AzBio sentences in quiet.
Figure 3.
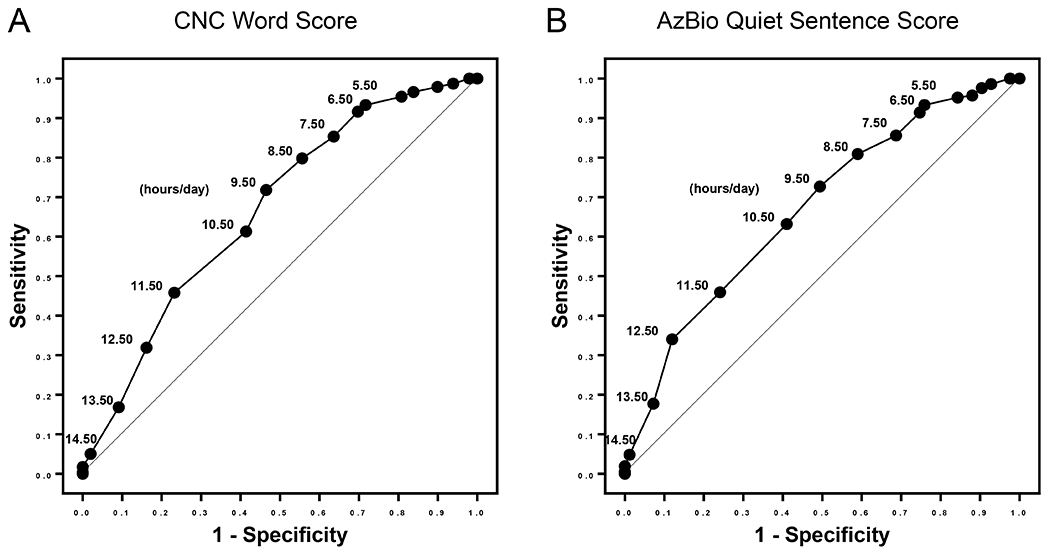
Receiver operating characteristic (ROC) curve analysis was performed to build classification models for both A) Benchmark achievement of CNC word score [area under the curve (AUC) = 0.67, 95% C.I.: 0.60 0.73, p < .001] and B) Benchmark achievement of AzBio Quiet sentence score (AUC: 0.67, 95% C.I.: 0.60, 0.74, p < .001). Sensitivity is shown on the y-axis, 1-specificity on the x-axis, and hour per day thresholds are marked on the corresponding points on the curve.
Based on prior recommendations and the interpretation of the ROC curves, time-to-event curves for CNC benchmark attainment were designed based on the 10 hours/day threshold (Figure 4A) and the 12 hours/day threshold (Figure 4B). The time-to-event curves were significantly different for both thresholds based on log-rank (Mantel-Cox) tests (p < 0.0001). Hazard Ratios (HR) were 1.883 (95% C.I. = 1.472, 2.408) for the 10 hours/day threshold and 3.189 (95% C.I. = 2.307, 4.409) for the 12 hours/day threshold. Ultimately, 84% (96/114) of patients with 1-month datalogging ≥12 hours/day met benchmark within the first year as compared to 80% (166/207) with 1-month datalogging ≥10 hours/day.
Figure 4.

Time-to-event curves for CNC benchmark attainment were designed based on the A) 10 hours/day threshold and the B) 12 hours/day threshold. The time-to-event curves were significantly different for both thresholds based on log-rank (Mantel-Cox) tests (p < 0.0001). Hazard Ratios (HR) were 1.883 (95% C.I. = 1.472, 2.408) for the 10 hours/day threshold and 3.189 (95% C.I. = 2.307, 4.409) for the 12 hours/day threshold.
Based on datalogging, the median time to CNC benchmark was: <10 hours/day: median time = 6.6 months (95% C.I. = 3.0, 10.1), 10-11.9 hours/day: median time = 3.1 months (95% C.I. = 2.6, 3.7), ≥12 hours/day: median time = 2.3 months (95% C.I. = 0.9, 3.6). Compared to the group with datalogging 10-11.9 hours/day, those patients utilizing their devices ≥12 hours/day had a significantly shorter median time to benchmark (unadjusted: p = .034, adjusted for age, sex, pre-operative CNC: p < .001).
With regards to AzBio sentences in quiet, the median time to benchmark score was calculated for <10 hours/day: median time = 6.8 months (95% C.I. = 3.9, 9.6), 10-11.9 hours/day: median time = 3.5 months (95% C.I. = 2.9, 4.1), ≥12 hours/day: median time = 3.6 months (95% C.I. = 3.3, 3.9). Compared to the group with datalogging 10-11.9 hours/day, those patients utilizing their devices ≥12 hours/day had a significantly shorter median time to benchmark for AzBio sentences in quiet as compared when adjusted for age, sex, and pre-operative AzBio quiet score (p = 0.012) but not for the unadjusted calculation (p = 0.141).
DISCUSSION
Recent investigations have focused on characterizing the role of discrete patient factors, device properties, and surgical techniques as they relate to speech recognition outcomes for patients with CIs. Unfortunately, many of the patient-related factors such as age, duration of deafness, and neural health are not readily amendable at time of CI evaluation. Similarly, considerations such as electrode type, scalar location, and preservation of residual cochlear function are difficult to modify after CI surgery. Post-implantation interventions are limited but include CI mapping, consistent daily processor use, fitting of electroacoustic stimulation , and aural rehabilitation.
While obtaining adequate CI experience through consistent wear time may seem intuitive, a paucity of data prevents strong, evidence-based recommendations for the optimal level of daily processor wear time for adult CI recipients. Clinicians often recommend that patients wear their CI processors during “all waking hours,” but a data-driven numerical recommendation may enable more tangible wear time goals—similar to using a fitness tracker to motivate specific step goals or exercise minutes per day. Prior work from our group has suggested that greater than 10 hours of CI use per day was associated with better than average speech recognition outcomes; we sought to further interrogate this relationship through early processor utilization data and speech recognition outcomes to form a more robust clinical recommendation.
Unsurprisingly, 1-month datalogging correlated with datalogging recorded at the 3-, 6-, and 12-month clinic visits. We theorize that daily use habits are established early and persist through at least the first year. Higher early datalogging correlated with greater speech recognition performance at each timepoint, with the correlation coefficients and slopes for the best-fit lines at each time of assessment not significantly different. Together, these data suggest that early device datalogging predicts both for future processor utilization and speech recognition outcomes.
To formulate a daily processor usage recommendation, establishment of a binary classification system through benchmark achievement is necessary to perform ROC curve analysis. This strategy places less importance on raw performance and more emphasis on benchmark attainment to ascertain, ‘Did the patient attain reasonable speech recognition success with their CI within the first year?’
We initially chose a recommendation of at least 10 hours/day CI device usage based solely on prior work suggesting that patients above this threshold perform better than average (20). However, to answer ‘What specific hours/day device usage do we recommend for patients to get the best speech recognition outcomes after CI surgery?’ we must combine the more statistical model afforded by ROC curve analysis with appropriate clinical assumptions. For the average patient, we assume that daily CI processor utilization is not incredibly difficult, burdensome, or expensive to influence for a reasonable portion of the 24-hour period (e.g., 12 hours/day versus 10 hours/day). ROC curve analysis demonstrates the highest LR+ for meeting benchmark score with the lowest hours/day usage at approximately 11.5 hours/day for CNC and 12.5 hours/day for AzBio in quiet, or about 12 hours/day overall. This practical utilization of the ROC curve, combined with our raw speech recognition data, suggests a relative optimization for benchmark achievement of speech recognition metrics for patients with >12 hours/day datalogging at the 1-month time point.
In 2017, Busch et al. analyzed datalogging for 1,501 adult and pediatric CI recipients at multiple timepoints after implantation and found daily average wear time to be 10.7 hours, with a 95% confidence interval of 4.3 to 15.2 hours/day (40). This mean processor utilization and variability in wear time is remarkably similar to our cohort’s 1-month data. Recently, a questionnaire was designed and validated for the assessment of factors affecting daily CI usage (41). Clinicians may consider using this questionnaire at the 1-month post-activation appointment to explore potential barriers to CI use. Further inquiries regarding the large variability in wear time as well as the factors affecting early CI usage are indicated.
A separate consideration is the possibility of a ‘learning phase’ for post-lingually deafened adults suggested to primarily occur within the first 6 months post-implantation, after which CI recipients may enter a plateau period of relative stability in speech recognition scores.(42) This is in contrast to research demonstrating that patients utilizing their device less than 10 hours/day had significantly improved speech recognition scores after just 4 weeks of increased datalogging, even years post-implantation.(33) Despite our evolving understanding of the temporal requirements for neuroplasticity and CI adaptation after implantation, the early post-operative period is a great opportunity for clinician intervention and counseling regarding daily device usage. Further research is necessary to elucidate the presence of any critical period for daily CI device usage as well as the relationship between datalogging and speech recognition outcomes, especially for patients lacking full-time usage who wish to improve their performance.
This study was limited by its retrospective nature. We did not separate patients based on duration of deafness, etiology, or other factors that could potentially influence their ultimate speech recognition outcomes. We acknowledge certain assumptions related to our statistical methods, although we have also included their rationale. While unfamiliar, the notion of a time-to-benchmark datapoint for CI recipients is not novel and allows ROC analysis. Further research is needed to investigate the effects of datalogging on raw speech recognition scores and performance. Given that the work herein captured daily device use without consideration of the user’s listening environment, further investigation is warranted with regards to the specific environments of CI utilization.
CONCLUSION
Herein, multivariate logistic regression analyses demonstrate a strong association between early CI processor usage datalogging and the likelihood for attainment of benchmark scores for CNC and AzBio in quiet speech recognition tests within the first-year post-implantation. Patients with higher 1-month datalogging also reach these benchmarks earlier in the post-implantation period. ROC curve analysis suggests the highest likelihood ratio for benchmark score attainment is above 12 hours/day. Patient counseling to increase CI processor datalogging may be an accessible, low-cost, and low-burden intervention for improving outcomes. In the absence of other factors that might limit a patient’s ability to wear their device, we recommend daily CI processor utilization of at least 12 hours/day (an increase beyond the previously published recommendation of 10 hours/day). Further work is necessary to examine the raw scores, long-term speech outcomes, time to performance plateau, and other factors affecting variability in patient datalogging.
Footnotes
INSITUTIONAL REVIEW BOARD:
Vanderbilt University Medical Center IRB# 211355
CONFLICT(S) OF INTEREST TO DECLARE:
RHG is a consultant for Advanced Bionics, Akouos, and Cochlear Americas, clinical advisory board member for Frequency Therapeutics, and on the Board of Directors for the American Auditory Society. DSH is a consultant for Advanced Bionics Corp., Cochlear Corp., MED-EL GmbH, Stryker, Synthes, Grace Medical, and Oticon. JTH is a consultant for Advanced Bionics and Cochlear Americas.
REFERENCES
- 1.Goudey B, Plant K, Kiral I, Jimeno-Yepes A, Swan A, Gambhir M, et al. A MultiCenter Analysis of Factors Associated with Hearing Outcome for 2,735 Adults with Cochlear Implants. Trends Hear 2021. Dec;25:23312165211037524. [DOI] [PMC free article] [PubMed] [Google Scholar]
- 2.Zhao EE, Dornhoffer JR, Loftus C, Nguyen SA, Meyer TA, Dubno JR, et al. Association of Patient-Related Factors With Adult Cochlear Implant Speech Recognition Outcomes: A Meta-analysis. JAMA Otolaryngology–Head & Neck Surgery. 2020. Jul 1;146(7):613–20. [DOI] [PMC free article] [PubMed] [Google Scholar]
- 3.Cheng YS, Svirsky MA. Meta-Analysis—Correlation between Spiral Ganglion Cell Counts and Speech Perception with a Cochlear Implant. Audiol Res. 2021. May 26;11(2):220–6. [DOI] [PMC free article] [PubMed] [Google Scholar]
- 4.Moberly AC. A surgeon-scientist’s perspective and review of cognitive-linguistic contributions to adult cochlear implant outcomes. Laryngoscope Investig Otolaryngol. 2020. Nov 6;5(6):1176–83. [DOI] [PMC free article] [PubMed] [Google Scholar]
- 5.Kramer S, Vasil KJ, Adunka OF, Pisoni DB, Moberly AC. Cognitive Functions in Adult Cochlear Implant Users, Cochlear Implant Candidates, and Normal-Hearing Listeners. Laryngoscope investigative otolaryngology. 2018. Aug;3(4):304–10. [DOI] [PMC free article] [PubMed] [Google Scholar]
- 6.Finley CC, Holden TA, Holden LK, Whiting BR, Chole RA, Neely GJ, et al. Role of electrode placement as a contributor to variability in cochlear implant outcomes. Otol Neurotol. 2008. Oct;29(7):920–8. [DOI] [PMC free article] [PubMed] [Google Scholar]
- 7.Holden LK, Finley CC, Firszt JB, Holden TA, Brenner C, Potts LG, et al. Factors affecting open-set word recognition in adults with cochlear implants. Ear Hear. 2013. Jun;34(3):342–60. [DOI] [PMC free article] [PubMed] [Google Scholar]
- 8.Wanna GB, Noble JH, Carlson ML, Gifford RH, Dietrich MS, Haynes DS, et al. Impact of electrode design and surgical approach on scalar location and cochlear implant outcomes. Laryngoscope. 2014. Nov;124 Suppl 6:S1–7. [DOI] [PMC free article] [PubMed] [Google Scholar]
- 9.O’Connell BP, Hunter JB, Wanna GB. The importance of electrode location in cochlear implantation. Laryngoscope Investig Otolaryngol. 2016. Dec;1(6):169–74. [DOI] [PMC free article] [PubMed] [Google Scholar]
- 10.Wanna GB, Noble JH, Gifford RH, Dietrich MS, Sweeney AD, Zhang D, et al. Impact of Intrascalar Electrode Location, Electrode Type, and Angular Insertion Depth on Residual Hearing in Cochlear Implant Patients: Preliminary Results. Otol Neurotol. 2015. Sep;36(8):1343–8. [DOI] [PMC free article] [PubMed] [Google Scholar]
- 11.O’Connell BP, Cakir A, Hunter JB, Francis DO, Noble JH, Labadie RF, et al. Electrode Location and Angular Insertion Depth Are Predictors of Audiologic Outcomes in Cochlear Implantation. Otol Neurotol. 2016. Sep;37(8):1016–23. [DOI] [PMC free article] [PubMed] [Google Scholar]
- 12.Holder JT, Yawn RJ, Nassiri AM, Dwyer RT, Rivas A, Labadie RF, et al. Matched Cohort Comparison Indicates Superiority of Precurved Electrode Arrays. Otol Neurotol. 2019. Oct;40(9):1160–6. [DOI] [PMC free article] [PubMed] [Google Scholar]
- 13.Sharma RK, Smetak MR, Patro A, Lindquist NR, Perkins EL, Holder JT, et al. Speech Recognition Performance Differences Between Precurved and Straight Electrode Arrays From a Single Manufacturer. Otol Neurotol. 2022. Oct 6; [DOI] [PubMed] [Google Scholar]
- 14.Dornhoffer JR, Reddy P, Ma C, Schvartz-Leyzac KC, Dubno JR, McRackan TR. Use of Auditory Training and Its Influence on Early Cochlear Implant Outcomes in Adults. Otology & Neurotology. 2022. Feb;43(2):e165. [DOI] [PMC free article] [PubMed] [Google Scholar]
- 15.Chow K, Kaul VF, Levine-Madoff J, Wanna GB, Cosetti MK. Does Auditory Environment Predict Speech Perception Outcomes in Elderly Cochlear Implant Patients? Audiol Neurootol. 2021;26(5):378–86. [DOI] [PubMed] [Google Scholar]
- 16.Easwar V, Sanfilippo J, Papsin B, Gordon K. Impact of Consistency in Daily Device Use on Speech Perception Abilities in Children with Cochlear Implants: Datalogging Evidence. J Am Acad Audiol. 2018. Oct;29(9):835–46. [DOI] [PubMed] [Google Scholar]
- 17.Guerzoni L, Cuda D. Speech processor data logging helps in predicting early linguistic outcomes in implanted children. International Journal of Pediatric Otorhinolaryngology. 2017. Oct 1;101:81–6. [DOI] [PubMed] [Google Scholar]
- 18.Busch T, Vermeulen A, Langereis M, Vanpoucke F, van Wieringen A. Cochlear Implant Data Logs Predict Children’s Receptive Vocabulary. Ear Hear. 2020;41(4):733–46. [DOI] [PubMed] [Google Scholar]
- 19.Alhabib SF, Abdelsamad Y, Badghaish RS, Alzhrani F, Hagr A, Almuhawas F. Cochlear implant: More hearing better speech performance. International Journal of Pediatric Otorhinolaryngology. 2021. Nov 1;150:110896. [DOI] [PubMed] [Google Scholar]
- 20.Holder JT, Dwyer NC, Gifford RH. Duration of Processor Use Per Day Is Significantly Correlated With Speech Recognition Abilities in Adults With Cochlear Implants. Otol Neurotol. 2020. Feb;41(2):e227–31. [DOI] [PMC free article] [PubMed] [Google Scholar]
- 21.Blamey P, Arndt P, Brimacombe J, Staller S, Bergeron F, Facer G, et al. Factors affecting auditory performance of postlinguistically deaf adults using cochlear implants. Audiology and Neuro-Otology. 1996; [DOI] [PubMed] [Google Scholar]
- 22.Leung J, Wang NY, Yeagle JD, Chinnici J, Bowditch S, Francis HW, et al. Predictive models for cochlear implantation in elderly candidates. Archives of Otolaryngology - Head and Neck Surgery. 2005; [DOI] [PubMed] [Google Scholar]
- 23.Green KMJ, Bhatt YM, Mawman DJ, O’Driscoll MP, Saeed SR, Ramsden RT, et al. Predictors of audiological outcome following cochlear implantation in adults. Cochlear Implants International. 2007; [DOI] [PubMed] [Google Scholar]
- 24.Friedland DR, Venick HS, Niparko JK. Choice of ear for cochlear implantation: The effect of history and residual hearing on predicted postoperative performance. Otology and Neurotology. 2003; [DOI] [PubMed] [Google Scholar]
- 25.Holden LK, Finley CC, Firszt JB, Holden TA, Brenner C, Potts LG, et al. Factors affecting open-set word recognition in adults with cochlear implants. Ear Hear. 2013;34(3):342–60. [DOI] [PMC free article] [PubMed] [Google Scholar]
- 26.Chakravorti S, Noble JH, Gifford RH, Dawant BM, O’Connell BP, Wang J, et al. Further Evidence of the Relationship Between Cochlear Implant Electrode Positioning and Hearing Outcomes. Otology & Neurotology. 2019; [DOI] [PMC free article] [PubMed] [Google Scholar]
- 27.Wanna GB, Noble JH, Gifford RH, Dietrich MS, Sweeney AD, Zhang D, et al. Impact of Intrascalar Electrode Location, Electrode Type, and Angular Insertion Depth on Residual Hearing in Cochlear Implant Patients: Preliminary Results. Otology and Neurotology. 2015;36(8):1343–8. [DOI] [PMC free article] [PubMed] [Google Scholar]
- 28.Henry BA, Turner CW, Behrens A. Spectral peak resolution and speech recognition in quiet: Normal hearing, hearing impaired, and cochlear implant listeners. The Journal of the Acoustical Society of America. 2005;118(2):1111–21. [DOI] [PubMed] [Google Scholar]
- 29.Won JH, Drennan WR, Rubinstein JT. Spectral-ripple resolution correlates with speech reception in noise in cochlear implant users. JARO - Journal of the Association for Research in Otolaryngology. 2007;8(3):384–92. [DOI] [PMC free article] [PubMed] [Google Scholar]
- 30.Gifford RH, Noble JH, Camarata SM, Sunderhaus LW, Dwyer RT, Dawant BM, et al. The relationship between spectral modulation detection and speech recognition: adult versus pediatric cochlear implant recipients. Trends in Hearing. 2018;22:1–14. [DOI] [PMC free article] [PubMed] [Google Scholar]
- 31.Lawler M, Yu J, Aronoff JM. Comparison of the spectral-temporally modulated ripple test with the Arizona biomedical institute sentence test in cochlear implant users. Ear and Hearing. 2017; [DOI] [PMC free article] [PubMed] [Google Scholar]
- 32.Tamati TN, Ray C, Vasil KJ, Pisoni DB, Moberly AC. High- and Low-Performing Adult Cochlear Implant Users on High-Variability Sentence Recognition: Differences in Auditory Spectral Resolution and Neurocognitive Functioning. Journal of the American Academy of Audiology. 2019; [DOI] [PMC free article] [PubMed] [Google Scholar]
- 33.Holder JT, Gifford RH. Effect of Increased Daily Cochlear Implant Use on Auditory Perception in Adults. J Speech Lang Hear Res. 2021. Oct 4;64(10):4044–55. [DOI] [PMC free article] [PubMed] [Google Scholar]
- 34.Schvartz-Leyzac KC, Conrad CA, Zwolan TA. Datalogging Statistics and Speech Recognition During the First Year of Use in Adult Cochlear Implant Recipients. Otol Neurotol. 2019. Aug;40(7):e686–93. [DOI] [PubMed] [Google Scholar]
- 35.Luxford WM. Minimum Speech Test Battery for Postlingually Deafened Adult Cochlear Implant Patients. Otolaryngol Head Neck Surg. 2001. Feb 1;124(2):125–6. [DOI] [PubMed] [Google Scholar]
- 36.Spahr AJ, Dorman MF, Litvak LM, Van Wie S, Gifford RH, Loizou PC, et al. Development and validation of the AzBio sentence lists. Ear Hear. 2012. Feb;33(1):112–7. [DOI] [PMC free article] [PubMed] [Google Scholar]
- 37.Peterson GE, Lehiste I. Revised CNC lists for auditory tests. J Speech Hear Disord. 1962. Feb;27:62–70. [DOI] [PubMed] [Google Scholar]
- 38.Nassiri AM, Wallerius KP, Lohse CM, Marinelli JP, Saoji AA, Driscoll CLW, et al. Speech Perception Performance Growth and Benchmark Score Achievement After Cochlear Implantation for Single-Sided Deafness. Otology & Neurotology. 2022. Jan;43(1):e64. [DOI] [PubMed] [Google Scholar]
- 39.Florkowski CM. Sensitivity, Specificity, Receiver-Operating Characteristic (ROC) Curves and Likelihood Ratios: Communicating the Performance of Diagnostic Tests. Clin Biochem Rev. 2008. Aug;29(Suppl 1):S83–7. [PMC free article] [PubMed] [Google Scholar]
- 40.Busch T, Vanpoucke F, van Wieringen A. Auditory Environment Across the Life Span of Cochlear Implant Users: Insights From Data Logging. J Speech Lang Hear Res. 2017. May 24;60(5):1362–77. [DOI] [PubMed] [Google Scholar]
- 41.Holder JT, Mayberry LS, Gifford R. The Cochlear Implant Use Questionnaire: Assessing Habits and Barriers to Use. Otol Neurotol. 2022. Jan 1;43(1):e23–9. [DOI] [PMC free article] [PubMed] [Google Scholar]
- 42.Lenarz M, Sönmez H, Joseph G, Büchner A, Lenarz T. Long-Term Performance of Cochlear Implants in Postlingually Deafened Adults. Otolaryngol Head Neck Surg. 2012. Jul 1;147(1):112–8. [DOI] [PubMed] [Google Scholar]