

Abstract
This study aimed to investigate the psychometric properties of the Pediatric Symptom Checklist-17 (PSC-17) in a sample of children orphaned or made vulnerable (OVC) by HIV in Zambia. Caregivers of 1,076 OVC (55.1% boys; Mage = 12.91 years) completed the PSC-17. Competing models, including confirmatory factor analysis (CFA), hierarchical CFA, bifactor CFA, exploratory structural equation modeling (ESEM), and bifactor ESEM, were tested to evaluate the optimal factor structure of the PSC-17. Results showed that the bifactor ESEM provided the best approximation of the PSC-17 data with a well-defined general psychosocial problems factor explaining 72% of the reliable variance in the total score and an internalizing factor containing 63% of reliable variance unique from the general factor. The observed overall psychosocial problems score was associated with lower academic achievement and working memory (with small effect sizes), supporting the discriminant validity of score interpretation. Results of multiple indicators multiple causes (MIMIC) analyses revealed that all items functioned equivalently across child gender and age.
Keywords: HIV/AIDS, sub-Saharan Africa, bifactor ESEM, PSC-17, DIF
HIV orphans and vulnerable children (OVC), including children who have lost at least one parent to HIV or lived in families affected by HIV, have poorer emotional, behavioral, and social adjustments compared to children from HIV-free families (Chi & Li, 2013). A recent systematic review showed that the prevalence rate of emotional or behavioral difficulties could be as high as 50% for adolescents living with HIV in sub-Saharan Africa (SSA; Dessauvagie et al., 2020). For OVC, elevated mental health problems are associated with increased progression to HIV, non-adherence to HIV care, and increased sexual risk-taking, among other detrimental consequences (Mutumba et al., 2015). Given the enduring effects of mental disorders across the life course (WHO, 2014), early identification of OVC at risk of mental health problems can inform decision-making in terms of further testing and intervention. This is particularly pertinent to OVC in SSA countries such as Zambia where limited capacities for mental health care caused by poverty, social exclusion, and HIV-related stigma contribute to the alarming prevalence of mental health problems among OVC.
The Pediatric Symptom Checklist (PSC) is one of the most frequently recommended screening measures for child psychosocial problems in primary care settings (Murphy et al., 2016). The original version of the PSC constitutes 35 items to identify children whose overall psychosocial functioning is significantly impaired (Gardner et al., 1999). In order to assess distinct domains of psychosocial problems, Gardner et al. (1999) subsequently conducted factor analysis on the original PSC and selected items with the most salient loadings for three factors based on the analysis, to produce the PSC-17: internalizing (5 items), externalizing (7 items) and attention (5 items) problems. Since then, a growing body of research using confirmatory factor analysis (CFA) has supported the three-factor structure of the PSC-17, where each indicator loaded on one latent factor that it is proposed to assess, in primary care settings (Blucker et al., 2014; Murphy et al., 2016; Stoppelbein et al., 2012) and in the preschool setting (DiStefano et al., 2017).
Yet, there is evidence that assuming each indicator to underlie only one latent factor may be a too simple representation of the complex internal structure of the PSC-17 (Kostanecka et al., 2008). Kostanecka et al. (2008) found that although the five items pertinent to internalizing problems exclusively loaded on the internalizing factor, only four of seven externalizing items exclusively loaded on the externalizing factor, and only two of five attention items exclusively loaded on the attention factor. These cross-loadings reflect the fallible nature of indicators (Morin et al., 2016). Because the PSC-17 items tap into conceptually related domains of psychosocial problems, it is unrealistic to assume that one symptomatic manifestation is caused by only one construct, which is the basis for the highly restrictive independent clusters model (ICM-CFA). Exploratory structural equation modeling (ESEM; Asparouhov & Muthén, 2009), an integration of ICM-CFA, exploratory factor analysis (EFA), and structural equation modeling (SEM), thus, is a viable alternative to the ICM-CFA, and might be better suited to capture the complex multidimensional structure underlying the PSC-17 by allowing cross-loadings to be freely estimated, which seems important for modeling the internal structure of the PSC-17.
The inconsistent findings on the internal structure of the PSC-17 call for additional research. In addition, at least three issues regarding the psychometric properties of the PSC-17 remain unclear. The first, and of particular relevance to clinical settings, is to evaluate the extent to which total and subscale scores reflect their proposed constructs. Clinicians and researchers are instructed to compute subscale scores by summing items for the three distinct domains, and to compute a total score by summing all subscales’ scores (Gardner et al., 1999), indicating the presence of a general psychosocial problems factor as well as three group factors. Yet, little is known about whether subscale scores can provide reliable information about specific domains unique from the general construct. A bifactor model, a general factor underlying all items and coexisting with group factors defined by the variances of items that are not explained by the general factor, can provide psychometrically informative statistics for interpreting dimensions (Reise et al., 2013).
Second, previous studies examining the factor structure of the PSC-17 have been predominantly based on samples from the USA, which restricts the generalizability of the findings to populations in low-income countries such as Zambia. The sociocultural differences between Western and non-Western societies may have significant impact on the salience and frequency of different of symptomatic manifestation of psychosocial difficulties. In Zambia, mental illness is perceived as behaving in a way that is not socially appropriate (e.g., talking nonsense, exhibiting violent behavior), which is believed to be danger to oneself and surroundings and to disrupt social harmony of the family and community (Mayeya et al., 2004). Additionally, Zambians hold a variety of cultural beliefs with regard to the causes of mental illness, including spirit possession, social punishment, and witchcraft (Mayeya et al., 2004). These cultural beliefs may play a role in recognizing and identifying psychosocial difficulties in Zambia. Thus, investigating the factor structure of a standardized instrument developed with Western samples in a new setting (e.g., Zambia) is warranted. A better understanding of the factor structure underlying the PSC-17 in a new setting may inform the scoring of the total scale and subscales, but interpreting these scores largely relies on their associations with external constructs theoretically and empirically pertinent to psychosocial problems. Existing research has shown that HIV/AIDS-orphanhood or caregiver HIV/AIDS-sickness has been related to elevated internalizing problems, which in turn has increased the risk of school non-enrollment and school non-attendance (Orkin et al., 2014). To this end, a valid assessment of psychosocial problems for OVC may be related to student attributes for learning such as academic achievement and cognitive ability.
Third, less is known about whether items of the PSC-17 function equivalently across child gender and age, also known as measurement invariance (MI). MI is the basis for meaningfully comparing mean differences across grouping variables. Violation of MI indicates the presence of differential item functioning (DIF). Several studies have examined the associations of mental health problems with OVC gender and age in SSA. These efforts, however, have yielded inconsistent results, with some studies (Ashaba et al., 2018; Atwine et al., 2005; Gentz et al., 2017) reporting that neither child gender nor child age were associated with internalizing (e.g., anxiety and depression) or externalizing symptoms (e.g., disruptive behavior and conduct problems), and others finding evidence for such associations (Betancourt et al., 2014; Cluver et al., 2007; Kim et al., 2015; Skeen et al., 2016). It is difficult to know whether the group mean differences are attributable to items that are biased against a particular group or a “true” score underlying the hypothesized construct unless MI is systematically examined across comparison groups.
In summary, ensuring that the PSC-17 is psychometrically appraised is important for assessing psychosocial problems among Zambian OVC. Hence, this study aimed to investigate the factor structure of the PSC-17 when used with Zambian OVC. Specifically, the theoretically espoused three-factor representation of the PSC-17 (three-factor ICM-CFA model) was tested against several plausible alternative representations: the one-factor CFA, hierarchical CFA, bifactor CFA, ESEM, and bifactor ESEM. Moreover, we provided evidence of validity regarding the associations of the observed PSC-17 scores with academic achievement and cognitive ability. Building upon the optimal factor structure, we explored possible uniform DIF of the PSC-17 as a function of child gender and age through a multiple indicators multiple causes (MIMIC) approach.
Method
Sample
The data come from an ongoing longitudinal study focusing on the cognitive, psychological, and academic development of OVC in rural Zambia. A representative sample of households within a 20 kilometers radius of a rural hospital in Southern Province, Zambia was selected for screening. Trained field personnel approached the villages that agreed to participate in the study and screened all households (n = 4,702) to identify OVC using an adaptation of the Multiple Indicators Cluster Survey, 3rd version (UNICEF, 2007). Households were invited to participate in the study if any child between the ages of 6 and 18 years old met at least one of the criteria: (a) HIV positive status; (b) having at least one HIV positive parent; (c) having at least one parent who died of HIV/AIDS; or (d) having a primary caregiver diagnosed with HIV. We identified 662 eligible OVC households, 607 of which were enrolled in the study. A total of 1,194 OVC Zambian children were recruited. Caregivers (n = 531, 70.2% female) of 1,076 children completed the PSC-17. Boys were overrepresented (55.1%). Child age ranged between 6.41 and 21.56 (Mage = 12.91 years, SD = 3.19). In this sample, 81 children were HIV positive; 579 mothers and 540 fathers were HIV positive; and 195 of the children were HIV orphans. This project was approved by the Internal Review Board of the University of Houston, Macha Institution Review Boards, and the Faculty of Health Sciences Research Ethics Committee of the University of Pretoria. Informed consent and assent were obtained for each child.
Assessments
The PSC-17 was administered to children’s caregivers (who had variable reading skills) by trained study personnel, who read each item to the adult, along with the possible responses. Adults’ responses were recorded in a tablet device. Items were rated on a 3-point Likert scale ranging from 0 (never) to 2 (often). The PSC-17 was subjected to a thorough forward and backward translation.
We used the Zambian Achievement Test (ZAT) to assess academic achievement (see Stemler et al., 2009 for test development and psychometric characteristics). Four subtests—mathematics (Cronbach’s α = 0.95), reading recognition (Cronbach’s α = 0.75), reading comprehension (Cronbach’s α = 0.75), and word reading/pseudoword decoding (Cronbach’s α = 0.76)—were used. A Letter-Digit Span (LD-Span) assessment was adapted from the Wechsler Intelligence Scale for Children, Fourth Edition (WISC-IV; Wechsler, 2003) to assess working memory. Because the four LD-Span subtest scores (Letters Forward, Letters Backward, Numbers Forward, Numbers Backward) shared a substantial amount of variance (r = 0.46 to 0.87), we summed the four subtest scores to derive a composite LD-Span score (Cronbach’s α = 0.85).
Covariates included child gender, age, grade level, and socioeconomic status (SES). The SES index was calculated as a fraction of twelve weighted indicators (e.g., vehicle, more than 50 cattle, etc.). The indicators were weighted according to rankings collected from a sample of people living in the Macha area. This index generates sample means consistent with the gross domestic product (GDP) per capita estimates of the relative wealth of SSA countries, thus appears to provide an accurate representation of the SES of the study participants (Fortson, 2008).
Statistical Analyses
There were no missing data for the PSC-17. Several competing models of the factor structure of the PSC-17 were tested with Mplus (Version 8.6; Muthén & Muthén, 1998–2017). We used the weighted least square mean and variance estimator (ESTIMATOR = WLSMV in Mplus) to generate accurate inference with ordered categorical indicators (Rhemtulla et al., 2012). We used TYPE= COMPLEX in Mplus to adjust the clustering effect, as many caregivers provided PSC-17 ratings for more than one child. Structural representations of tested models are presented in Figure 1. Model A was a one-factor CFA model in which all indicators loaded on one latent factor. Model B was a correlated three-factor CFA solution in which each indicator only loaded on the factor that it was proposed to measure (Murphy et al., 2016). Model C was a second-order model proposed by DiStefano et al. (2017), in which each indicator was specified as loading on its first-order factor except for “Daydreams too much” and “Does not listen to rules,” both of which loaded on two first-order factors, and each first-order factor was specified as loading on a higher order factor. Model D was a bifactor CFA which included one general factor and three group factors. Model E was an ESEM model with target rotation in which indicators could load on non-target factors (i.e., cross-loadings), and all non-target loadings were specified to be close to 0 (~0 in Mplus). Model F was a bifactor ESEM model using orthogonal target rotation whereby all indicators loaded on a general psychosocial problems factor and three group factors were defined using the same indicator-factor associations as Model E. All latent factors were not correlated for the bifactor models (Models D and F).
Figure 1.
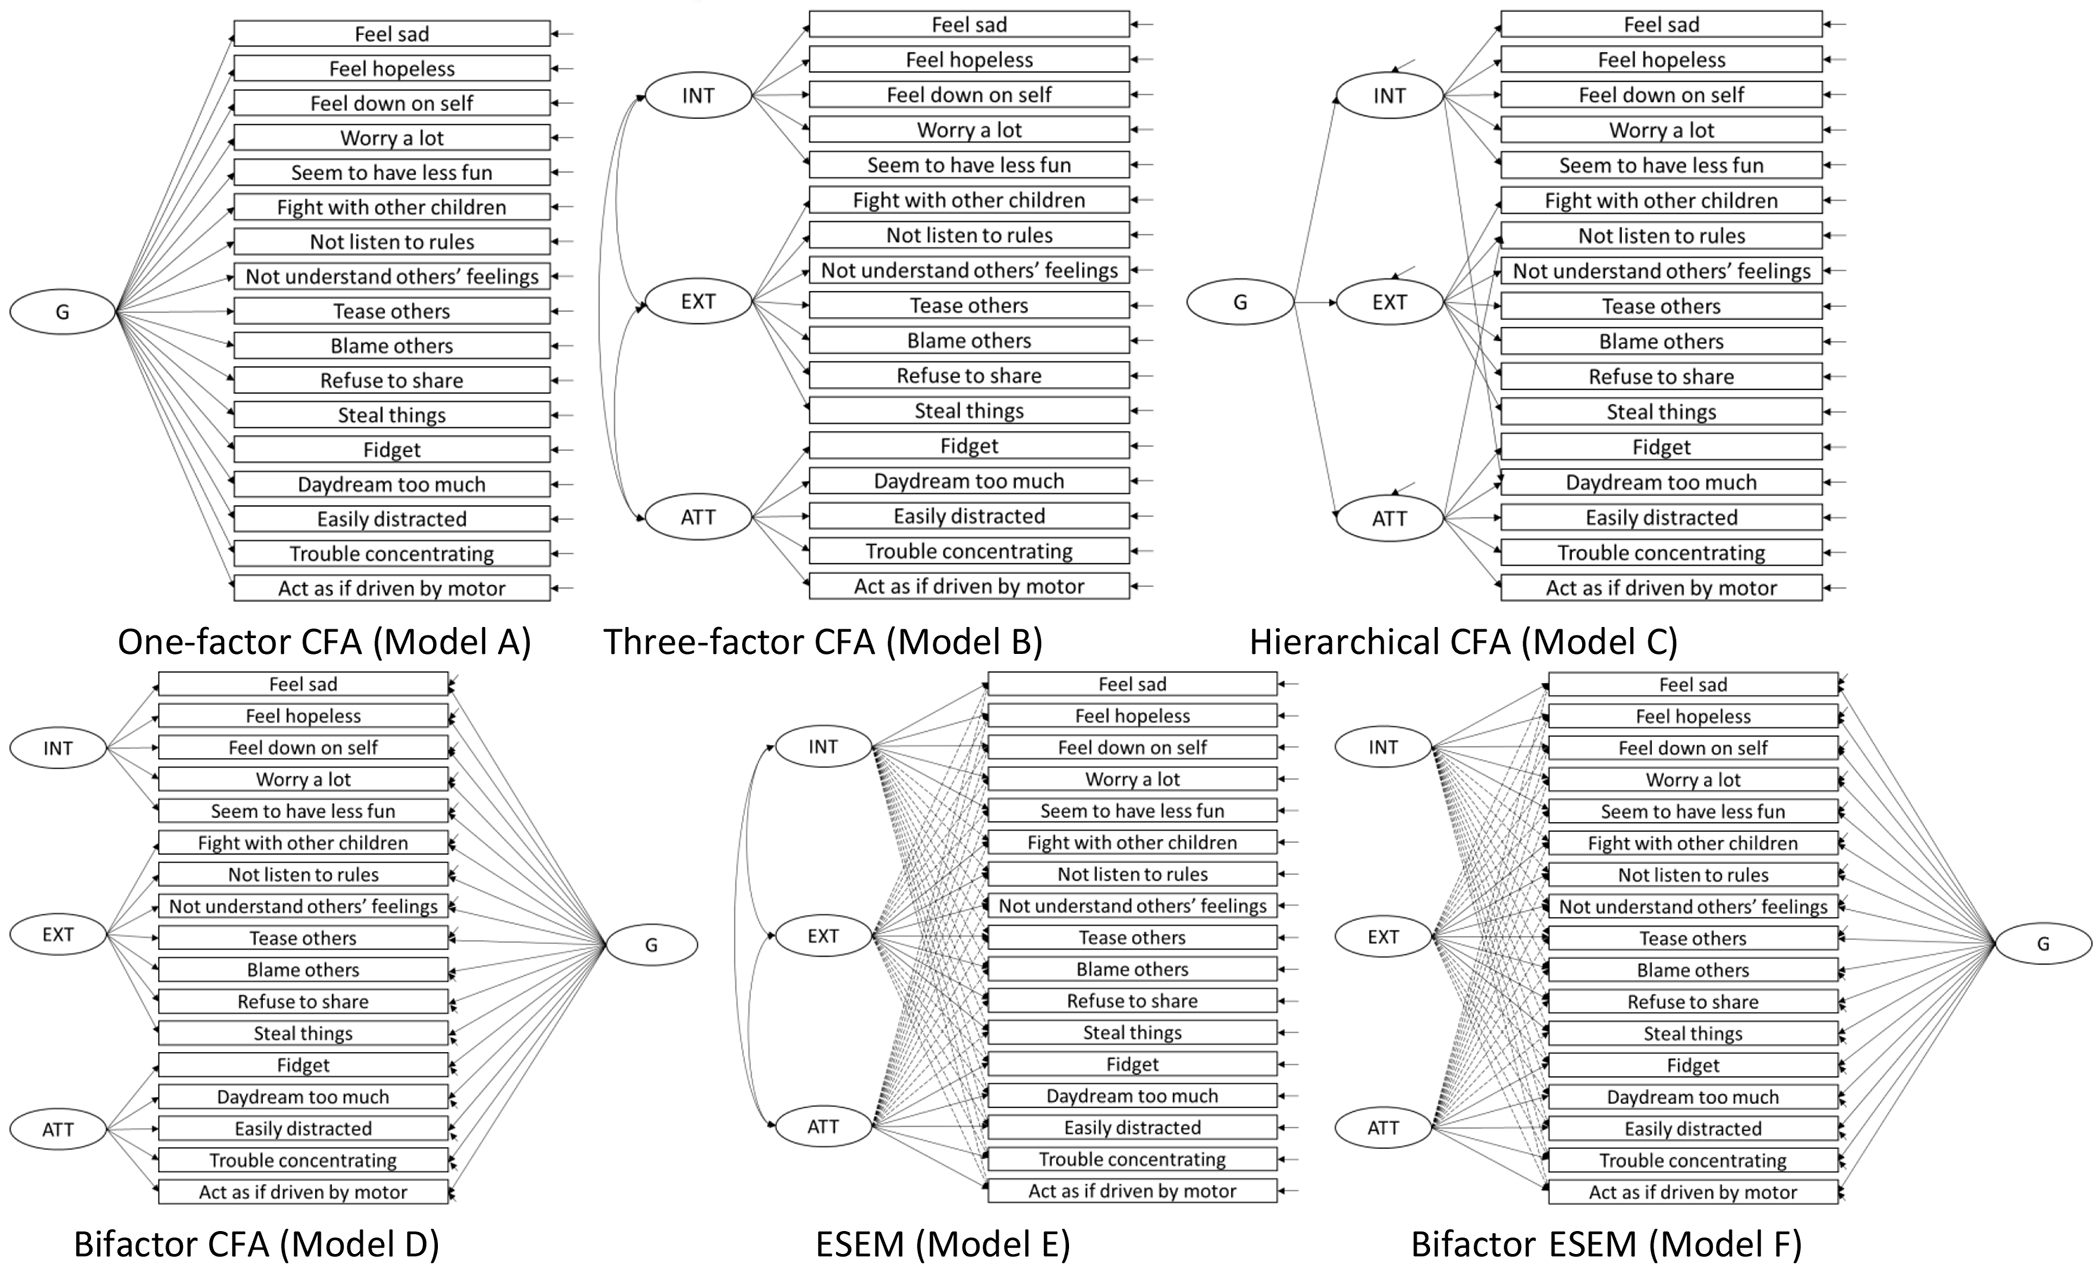
Semantic Graphical Representation of the Competing Factor Structure Models
Note. G = the general factor; INT = internalizing; EXT = externalizing; ATT = attention. Solid arrows represent target loadings; dashed arrows represent non-target loadings (cross-loadings).
Model fit was evaluated based on the χ2 test (insignificant result indicating perfect fit), CFI, TLI, and RMSEA. Values greater than 0.90 and 0.95 for both the CFI and TLI, respectively, are considered to reflect acceptable and excellent fit to the data, whereas values for RMSEA less than 0.05 and 0.08 indicate excellent fit and acceptable fit to the data, respectively (Hu & Bentler, 1999; Marsh et al., 2005). Nested model comparisons were based on the χ2 difference test (Δ χ2) using the DIFFTEST function in Mplus; a significant difference test favored the less restricted model. Given that the Δ χ2 test is sensitive to sample size, it has been recommended to complement this information with changes in CFIs and RMSEAs (Chen, 2007; Cheung & Rensvold, 2002). Specifically, there would be evidence supporting the less restricted model when: (1) the increase of relative model fit (e.g., CFI) is greater than 0.01; and (2) the decrease of relative model fit (e.g., RMSEA) is greater than 0.015.
As recommended by Rodriguez et al. (2016), we also reported model-based omega coefficients of composite reliability (McDonald, 1999)—omega (), omega hierarchical () and omega hierarchical subscale ()—to assist in interpreting total and subscale scores derived from the bifactor models. Omega reflects the percentage of variance in the observed total score due to all sources of common variance. Omega hierarchical represents the percentage of total score variance explained by the general factor. Omega hierarchical subscale represents the percentage of subscale score variance accounted for by the group factor controlling for the general factor. Despite being subjective, Reise et al. (2013) suggested that and need to be greater than 0.50 at least, and values closer to 0.75 are preferred, in order to make justifiable interpretations based on the total and subscale scores.
Semi-partial correlations were conducted to evaluate the relationships of the observed PSC-17 scores with mathematics, reading recognition, reading comprehension, word reading/ pseudoword decoding, and LD-span scores. Standard linear regressions with child gender, age, grade level, and SES as independent variables were conducted separately for each external variable, after which we extracted residuals from the fitted regression models. The bivariate Pearson product-moment correlations between the residuals and observed PSC-17 scores denoted the discriminant correlations.
After establishing the factor structure, we used the MIMIC approach to explore possible uniform DIF and mean differences by child gender and age. Three nested MIMIC models were compared (Morin et al., 2016): (1) a null effect model where the paths from the covariates (child gender and age) to the latent factors and indicators were fixed to zero (Model G); (2) a saturated model where paths from the covariates to the indicators were freely estimated, but the paths to the latent factors were fixed to zero (Model H); and (3) an invariant model where paths from the covariates to the latent factors were freely estimated, but the paths to the indicators were fixed to zero (Model I). The comparison of the null model and invariant model tested whether the covariates had effects on the latent factors. If the saturated model fits better than the invariant model, there is evidence of uniform DIF. In this case, a partially invariant model would be pursued in which the invariant constraint for some indicators would be relaxed based on modification indices.
Results
Factor Structure
Table 1 presents the goodness of fit of all tested models. One-factor (Model A) and three-factor (Model B) CFA models did not present fit indices exceeding the recommended values for CFI and TLI (< 0.90). The non-positive definite covariance matrices for the hierarchical CFA (Model C) and the bifactor CFA (Model D) indicate that the two models are somewhat misspecified to the data, so the results are not reliable. The ESEM model (Model E) with three a priori latent factors provided an excellent degree of fit to the data and an apparently better approximation of the data than the three-factor CFA based on the substantial improvement of fit, Δχ2(28) = 208.115, p < 0.001, ΔRMSEA = −0.026, ΔCFI = 0.085. The correlations between the three factors ranged from 0.63 to 0.89 for the three-factor CFA, and from 0.14 to 0.47 for the ESEM model, highlighting the importance of modeling cross-loadings and providing additional evidence in favor of the ESEM model. The bifactor ESEM (Model F) provided a slightly better approximation of the data as compared to the ESEM model, Δχ2(14) = 36.787, p < 0.001, albeit ΔRMSEA = −0.006 and ΔCFI = 0.008.
Table 1.
Summary of Goodness-of-Fit Statistics for All Latent Measurement Models
| Model | Descriptions | df | RMSEA | CFI | TLI | |
|---|---|---|---|---|---|---|
| A | One-factor CFA | 460.999*** | 119 | 0.052 | 0.874 | 0.856 |
| B | Three-factor CFA | 383.686*** | 116 | 0.046 | 0.901 | 0.884 |
| C | Hierarchical CFA | Non-positive definite covariance matrices | ||||
| D | Bifactor CFA | Non-positive definite covariance matrices | ||||
| E | Three-factor ESEM | 126.678** | 88 | 0.020 | 0.986 | 0.978 |
| F | Bifactor ESEM | 89.492 | 74 | 0.014 | 0.994 | 0.990 |
| G | MIMIC (null) | 440.295*** | 108 | 0.053 | 0.879 | 0.810 |
| H | MIMIC (saturated) | 88.488 | 74 | 0.013 | 0.995 | 0.988 |
| I | MIMIC (fully invariant) | 137.630** | 100 | 0.019 | 0.986 | 0.977 |
Note. = chi square; df = degrees of freedom; RMSEA = root mean square error of approximation; CFI = comparative fit index; TLI = Tucker–Lewis index.
p < .01,
p < .001.
Table 2 presents the standardized factor loadings for the ESEM (Model E) and the bifactor ESEM (Model F). For the ESEM model, the target factor loadings were substantial (|λ| = 0.24 to 1.01, Mλ = 0.53); meanwhile, the cross-loadings were also noticeable (|| = 0.02 to 0.55, Mλ = 0.22), providing additional support for the ESEM model over the three-factor CFA solution. The noticeable cross-loadings were also indicative of the presence of a general latent factor. After accounting for the general factor, the cross-loadings for the bifactor ESEM (|| = 0.00 to 0.38, Mλ = 0.12) reduced substantially relative to the ESEM model. In the bifactor ESEM, the general factor was well-defined, as it exhibited mean target loadings of 0.55 and all target loadings were greater than 0.30, except for “Seems to be having less fun,” which was insignificant on the general factor (λ = 0.06, p = 0.325). Most items (13 out of 17 items) exhibited higher loadings on the general factor than on the group factors. Beyond the general factor, only the internalizing factor was well-defined with moderate-to-strong target loadings (|| = 0.19 to 0.74, Mλ = 0.51) and relatively low non-target loadings (|| = 0.00 to 0.34, Mλ = 0.11). The externalizing and attention factors were not well-defined. Only three out of seven target factor loadings on the externalizing factor were significant (|| = 0.01 to 0.88, Mλ = 0.22). Despite their significance, the target loadings on the attention factor were small (|| = 0.10 to 0.39, Mλ = 0.26), indicating the presence of only little residual specificity after accounting for the general factor.
Table 2.
Standardized Factor Loadings for the ESEM and Bifactor ESEM Models
| ESEM (Model E) | Bifactor ESEM (Model F) | ||||||
|---|---|---|---|---|---|---|---|
|
| |||||||
| INT | EXT | ATT | G | INT | EXT | ATT | |
| Feels sad, unhappy. | 0.67*** | −0.04 | 0.27*** | 0.43 *** | 0.61*** | −0.04 | −0.02 |
| Feels hopeless. | 0.24*** | 0.28*** | 0.31*** | 0.64 *** | 0.19* | 0.00 | −0.34*** |
| Is down on him or herself. | 0.47*** | 0.31*** | 0.13 | 0.50 *** | 0.40*** | 0.21*** | 0.12 |
| Worries a lot. | 0.81*** | −0.02 | 0.11 | 0.32 *** | 0.74*** | 0.10 | 0.16* |
| Seems to be having less fun. | 0.65*** | −0.15* | −0.02 | 0.06 | 0.61*** | 0.05 | 0.03 |
| Fights with others. | −0.33*** | 0.45*** | 0.40*** | 0.60 *** | −0.38*** | 0.03 | 0.19** |
| Does not listen to rules. | 0.10 | 0.33*** | 0.53*** | 0.76 *** | 0.03 | −0.04 | 0.13* |
| Does not understand other people’s feelings. | −0.04 | 0.48*** | 0.10 | 0.49 *** | −0.08 | 0.20** | −0.13 |
| Tease others. | 0.19** | 1.01*** | −0.55*** | 0.41 *** | 0.14** | 0.88*** | −0.02 |
| Blames others for his or her troubles. | 0.23*** | 0.59*** | −0.05 | 0.51 *** | 0.17** | 0.39*** | 0.03 |
| Takes things that do not belong to him or her. | −0.05 | 0.39*** | 0.45*** | 0.70 *** | −0.11 | −0.01 | 0.02 |
| Refuses to share. | −0.22** | 0.41*** | 0.40*** | 0.64 *** | −0.28*** | −0.02 | −0.09 |
| Fidgety, unable to sit still. | −0.10 | 0.53*** | 0.31*** | 0.65 *** | −0.16* | 0.16* | 0.20* |
| Acts as if driven by a motor. | 0.39*** | 0.12 | 0.58*** | 0.70 *** | 0.31*** | −0.08 | 0.33*** |
| Daydreams too much. | 0.19* | 0.23** | 0.57*** | 0.70 *** | 0.10 | −0.02 | 0.39*** |
| Distracted easily. | 0.13* | 0.08 | 0.54*** | 0.56 *** | 0.07 | −0.14** | 0.28*** |
| Has trouble concentrating. | 0.25*** | 0.20*** | 0.50*** | 0.71 *** | 0.19*** | −0.11* | −0.10 |
Note. INT = internalizing; EXT = externalizing; ATT = attention; G = the general factor. Target loadings are highlighted in bold. Cross-loadings greater than 0.30 were italicized.
p < .05
p < .01
p < .001
The for the total score was 0.94. The model-based was 0.68, indicating that 72% (0.68/0.94) of the reliable variance in the total score is attributed to the general factor. This suggests that the general factor has a dominating effect in explaining true score variation. The was 0.78, 0.80, and 0.80 for internalizing, externalizing, and attention factors, respectively. The was 0.49, 0.10, and 0.09 for internalizing, externalizing, and attention factors, respectively. These ωHSs indicate that the internalizing factor contains reliable variance (0.49/0.78 = 63%) unique from the general factor, whereas the externalizing (0.10/0.80 = 13%) and attention (0.09/0.80 = 11%) factors only accounted for a small amount of variance unique from the general factor. Results of model fit indices, factor loadings, and model-based omega suggest that the bifactor ESEM represents the optimal structural representation of the PSC-17 for Zambian OVC.
Discriminant Validity
Despite the empirical support of the internalizing group factor, it can only be estimated from the bifactor ESEM model, which limits it utility in low-resource settings such as Zambia. Because the general factor accounted for most of the reliable variance (72%), the overall psychosocial problems score was useful in practice. To this end, we concentrated on the associations between the observed total score and external variables. Results of semi-partial correlations showed that the observed psychosocial problems score (excluding “Seems to be having less fun” as it did not load on the general factor) was significantly correlated with mathematics (r = −0.12, p < 0.01), reading recognition (r = −0.12, p < 0.01), reading comprehension (r = −0.08, p = 0.03), word reading/pseudoword decoding (r = −0.12, p < 0.01), and working memory (r = −0.10, p < 0.01). The small effect sizes of these correlations support the discriminant validity of score interpretations (Cohen, 1992).
MIMIC Models
Model fit indices for the MIMIC models are presented in Table 1. The null model (Model G) did not provide an acceptable fit to the data (CFI and TLI < 0.90), suggesting that some effects of child gender and age are expected. The fully invariant model (Model I) presented substantial improvement of the fit relative to the null model according to Δχ2(8) = 151.546, p < 0.001, ΔRMSEA = –0.034, ΔCFI = 0.107. This suggests that the covariates do exert effects on the latent means. The fully invariant model fitted the data as well as the saturated model (Model H) according to ΔRMSEA = 0.006, ΔCFI = −0.009, despite Δχ2(26) = 50.109, p < 0.001. This suggests that the effects of the covariates on the thresholds of all items are fully explained in terms of their effect on the latent factors. In other words, all indicators functioned equivalently across child gender and age over and above latent factors. Partially standardized path coefficients were reported given the meaningful metric of the two covariates. The mean of the general factor was 0.21 (p = 0.005) standard deviation lower for girls as compared to boys holding child age constant. A one-year increase in age was related to 0.12 (p < 0.001) standard deviation decrease of the general factor controlling for gender. A one-year increase in age was related to 0.09 (p < 0.001), 0.08 (p = 0.007), and 0.19 (p < 0.001) standardized deviation increases in internalizing, externalizing, and attention factors, respectively, controlling for child gender. Child gender was not related to the three group factors controlling for child age. It should be noted that the path coefficients related to externalizing and attention problems should be interpreted with caution because they were not well-defined.
Discussion
To identify the optimal internal structure underlying the PSC-17 in Zambian OVC, several alternative models were applied and contrasted. We found that the correlated three-factor CFA model which was proposed based on US samples (Blucker et al., 2014; DiStefano et al., 2017; Murphy et al., 2016; Stoppelbein et al., 2012) did not provide an adequate approximation of the PSC-17 for Zambian OVC. The discrepancy underscores the importance of cultural and developmental contexts on the manifestation and recognition of psychosocial problems across cultures (Sweetland et al., 2014). Thus, systematically evaluating the internal structure of a standardized instrument is warranted before adapting it to new settings (American Educational Research Association et al., 2014).
We found that the bifactor ESEM provided the best structural representation of the PSC-17 for Zambian OVC. The bifactor ESEM highlights the importance of accounting for two distinct sources of construct-relevant psychometric multidimensionality that may be pertinent to the PSC-17 data: fallible indicators due to conceptually related constructs and hierarchically superior constructs (Morin et al., 2016). The presence of a general psychosocial problems factor echoes a previous proposition regarding the overarching psychosocial issue underlying the PSC-17 (Gardner et al., 1999). Substantively, the well-defined general psychosocial problems factor indicates high levels of comorbidities for Zambian OVC, who commonly experience a variety of devastating stressors such as poverty and stigma (Cluver et al., 2013). In practice, the total score of the PSC-17 can be calculated (after excluding “Seems to be having less fun”) and used for research and clinical purposes. We demonstrated that the observed psychosocial problems score was related to lower academic achievement and working memory, adding further validity support for using the total score in research and practice. After accounting for the general factor, only the internalizing factor retained meaningful residual specificity, suggesting the coexistence of the general factor and the internalizing factor. Variations among items associated with externalizing and attention factors were overwhelmingly attributable to the general factor, suggesting that the externalizing and attention factors should be interpreted with caution. Researchers need to rely on bifactor models to capture the unique variance of the internalizing factor.
Results of the MIMIC analyses revealed that the PSC-17 items functioned in a similar way across OVC gender and age, suggesting that these items have the same meaning for OVC regardless of their gender and age, and more importantly, that group differences represent genuine differences in the underlying trait rather than artifacts of item bias. Gentz et al. (2017) found that neither child gender nor age were associated with overall mental health problems assessed with the Strengths and Difficulties Questionnaire (SDQ; Goodman, 1997) in a sample of adolescents living with HIV in Namibia. However, results of the current study showed that female gender and age were protective factors of overall psychosocial problems for OVC in Zambia. Additionally, our results revealed that child internalizing problems increased with age, which is consistent with Cluver et al. (2007), who found that child age was positively correlated with anxiety and depression among OVC in South Africa. However, Skeen et al. (2016) found an inverse association of child age and internalizing problems among children affected by HIV in South Africa and Malawi. These discrepant findings are not easy to explain because of various confounders including different instruments (SDQ versus PSC-17), participants’ country of residence (Namibia versus Zambia) and population characteristics (adolescents living with HIV versus OVC). Additionally, latent group mean differences were compared using the MIMIC method in the present study, whereas previous studies examined group differences using manifest scores. It is unclear whether the comparison of observed scores reflects the actual mean differences or is a function of measurement bias.
We must acknowledge that this study did have some limitations. First, the sample only comprised OVC in Zambia; cross-validation studies in different OVC samples in Zambia and across different SSA countries would extend the generalizability of the findings of the current study. Second, additional convergent evidence would have helped to strengthen the validity of the scale score interpretation. Culturally appropriate and locally validated instruments could be used as the golden standard. Third, despite the care spent in the translation-backtranslation of the scale and discussion with data collectors on the meanings of the items of the PSC, it is still possible that caregivers in the village varied in their interpretation of the items. This variability needs to be studied and, perhaps, even considered in the analyses.
In conclusion, this study demonstrates that the PSC-17 may be a viable measure for assessing psychosocial problems for OVC in Zambia. Given its relatively short administration time and low cost, the PSC-17 could serve as a useful tool for screening psychosocial problems for OVC in low resource settings. Computing a total score for the PSC-17 (after excluding “Seems to be having less fun”) could potentially provide mental health specialists with reliable information about the psychosocial problems of OVC in Zambia.
Open Science.
We report how we determined our sample size, all data inclusion/exclusion criteria, whether inclusion/exclusion criteria were established prior to data analysis, all measures in the study, and all analyses including all tested models. If we use inferential tests, we report effect sizes. Exact p values and 95% confidence intervals can be found in the supplemental material (Li et al., 2021).
Open Data:
The information needed to reproduce all of the reported results are openly accessible (Li et al., 2021).
Open Materials:
We confirm that there is sufficient information for an independent researcher to reproduce all of the reported methodology (Li et al., 2021).
Preregistration of Studies and Analysis Plans:
This study and the analysis plans were not preregistered.
Funding
The preparation of this manuscript was supported by funding from the National Institutes of Health (R01 HD085836; PI: Elena L. Grigorenko).
Footnotes
We have no known conflict of interest to disclose.
References
- American Educational Research Association, American Psychological Association, & National Council on Measurement in Education. (2014). Standards for educational and psychological testing. American Educational Research Association. [Google Scholar]
- Ashaba S, Cooper-Vince C, Maling S, Rukundo GZ, Akena D, & Tsai AC (2018). Internalized HIV stigma, bullying, major depressive disorder, and high-risk suicidality among HIV-positive adolescents in rural Uganda. Global Mental Health, 5(e22). 10.1017/gmh.2018.15 [DOI] [PMC free article] [PubMed] [Google Scholar]
- Asparouhov T, & Muthén B (2009). Exploratory structural equation modeling. Structural Equation Modeling: A Multidisciplinary Journal, 16(3), 397–438. 10.1080/10705510903008204 [DOI] [Google Scholar]
- Atwine B, Cantor-Graae E, & Bajunirwe F (2005). Psychological distress among AIDS orphans in rural Uganda. Social Science and Medicine, 61(3), 555–564. 10.1016/j.socscimed.2004.12.018 [DOI] [PubMed] [Google Scholar]
- Betancourt T, Scorza P, Kanyanganzi F, Smith Fawzi MC, Sezibera V, Cyamatare F, Beardslee W, Stulac S, Bizimana JI, Stevenson A, & Kayiteshonga Y (2014). HIV and child mental health: A case-control study in Rwanda. Pediatrics, 134(2), e464–e472. 10.1542/peds.2013-2734 [DOI] [PMC free article] [PubMed] [Google Scholar]
- Blucker RT, Jackson D, Gillaspy JA, Hale J, Wolraich M, & Gillaspy SR (2014). Pediatric behavioral health screening in primary care: A preliminary analysis of the Pediatric Symptom Checklist-17 with functional impairment items. Clinical Pediatrics, 53(5), 449–455. 10.1177/0009922814527498 [DOI] [PubMed] [Google Scholar]
- Chen FF (2007). Sensitivity of goodness of fit indexes to lack of measurement invariance. Structural Equation Modeling: A Multidisciplinary Journal, 14(3), 464–504. 10.3102/10769986022003265 [DOI] [Google Scholar]
- Cheung GW, & Rensvold RB (2002). Evaluating goodness-of-fit indexes for testing measurement invariance. Structural Equation Modeling, 9(2), 233–255. 10.1207/S15328007SEM0902_5 [DOI] [Google Scholar]
- Chi P, & Li X (2013). Impact of parental HIV/AIDS on children's psychological well-being: A systematic review of global literature. AIDS and Behavior, 17(7), 2554–2574. 10.1007/s10461-012-0290-2 [DOI] [PMC free article] [PubMed] [Google Scholar]
- Cluver L, Gardner F, & Operario D (2007). Psychological distress amongst AIDS-orphaned children in urban South Africa. Journal of Child Psychology and Psychiatry and Allied Disciplines, 48(8), 755–763. 10.1111/j.1469-7610.2007.01757.x [DOI] [PubMed] [Google Scholar]
- Cluver L, Orkin M, Boyes ME, Sherr L, Makasi D, & Nikelo J (2013). Pathways from parental AIDS to child psychological, educational and sexual risk: Developing an empirically-based interactive theoretical model. Social Science and Medicine, 87, 185–193. 10.1016/j.socscimed.2013.03.028 [DOI] [PubMed] [Google Scholar]
- Cohen J (1992). A power primer. Psychological Bulletin, 112(1), 155–159. 10.1037/0033-2909.112.1.155 [DOI] [PubMed] [Google Scholar]
- Dessauvagie AS, Jorns-Presentati A, Napp AK, Stein DJ, Jonker D, Breet E, Charles W, Swart RL, Lahti M, Suliman S, Jansen R, van den Heuvel LL, Seedat S, & Groen G (2020). The prevalence of mental health problems in sub-Saharan adolescents living with HIV: A systematic review. Global Mental Health, 7(e29). 10.1017/gmh.2020.18 [DOI] [PMC free article] [PubMed] [Google Scholar]
- DiStefano C, Liu J, & Burgess Y (2017). Investigating the structure of the pediatric symptoms checklist in the preschool setting. Journal of Psychoeducational Assessment, 35(5), 494–505. 10.1177/0734282916647648 [DOI] [Google Scholar]
- Fortson JG (2008). The gradient in sub-Saharan Africa: socioeconomic status and HIV/AIDS. Demography, 45(2), 303–322. 10.1353/dem.0.0006 [DOI] [PMC free article] [PubMed] [Google Scholar]
- Gardner W, Murphy M, Childs G, Kelleher K, Pagano M, Jellinek M, Mclnerny T, Wasserman R, Nutting P, & Chiappetta L (1999). The PSC-17: A brief pediatric symptom checklist with psychosocial problem subscales. A report from PROS and ASPN. Ambulatory Child Health, 5, 225–236. 10.1542/peds.2016-0038 [DOI] [Google Scholar]
- Gentz SG, Calonge Romano I, Martinez-Arias R, & Ruiz-Casares M (2017). Predictors of mental health problems in adolescents living with HIV in Namibia. Child and Adolescent Mental Health, 22(4), 179–185. 10.1111/camh.12247 [DOI] [PubMed] [Google Scholar]
- Goodman R (1997). The Strengths and Difficulties Questionnaire: A research note. Child Psychology & Psychiatry & Allied Disciplines, 38(5), 581–586. 10.1111/j.1469-7610.1997.tb01545.x [DOI] [PubMed] [Google Scholar]
- Hu LT, & Bentler PM (1999). Cutoff criteria for fit indexes in covariance structure analysis: Conventional criteria versus new alternatives. Structural Equation Modeling: A Multidisciplinary Journal, 6(1), 1–55. 10.1080/10705519909540118 [DOI] [Google Scholar]
- Kim MH, Mazenga AC, Yu X, Devandra A, Nguyen C, Ahmed S, Kazembe PN, & Sharp C (2015). Factors associated with depression among adolescents living with HIV in Malawi. BMC Psychiatry, 15(264). 10.1186/s12888-015-0649-9 [DOI] [PMC free article] [PubMed] [Google Scholar]
- Kostanecka A, Power T, Clarke A, Watkins M, Hausman CL, & Blum NJ (2008). Behavioral health screening in urban primary care settings: Construct validity of the PSC-17. Journal of Developmental and Behavioral Pediatrics, 29(2), 124–128. 10.1097/DBP.0b013e31816a0d9e [DOI] [PubMed] [Google Scholar]
- Li N, Tan M, Thuma PE, & Grigorenko EL (2021). Supplementary materials for “Pediatric Symptom Checklist-17: Factor structure and uniform differential item functioning across gender and age in HIV orphans and vulnerable children in Zambia”. 10.17605/OSF.IO/N5YAB [DOI] [PMC free article] [PubMed]
- Marsh HW, Hau K-T, & Grayson D (2005). Goodness of fit evaluation in structural equation modelling. In Maydeu-Olivares A & McArdle JJ (Eds.), Contemporary psychometrics: A festschrift for Roderick P. McDonald (pp. 275–340). Erlbaum. [Google Scholar]
- Mayeya J, Chazulwa R, Mayeya PN, Mbewe E, Magolo LM, Kasisi F, & Bowa AC (2004). Zambia mental health country profile. International Review of Psychiatry, 16(1–2), 63–72. 10.1080/09540260310001635113 [DOI] [PubMed] [Google Scholar]
- McDonald RP (1999). Test theory: A unified treatment. Lawrence Erlbaum. [Google Scholar]
- Morin AJS, Arens AK, & Marsh HW (2016). A bifactor exploratory structural equation modeling framework for the identification of distinct sources of construct-relevant psychometric multidimensionality. Structural Equation Modeling: A Multidisciplinary Journal, 23(1), 116–139. 10.1080/10705511.2014.961800 [DOI] [Google Scholar]
- Murphy JM, Bergmann P, Chiang C, Sturner R, Howard B, Abel MR, & Jellinek M (2016). The PSC-17: Subscale scores, reliability, and factor structure in a new national sample. Pediatrics, 138(3), 1–8. 10.1542/peds.2016-0038 [DOI] [PMC free article] [PubMed] [Google Scholar]
- Muthén LK, & Muthén BO (1998–2017). Mplus User’s Guide (8th ed.). Muthén & Muthén. [Google Scholar]
- Mutumba M, Resnicow K, Bauermeister JA, Harper GW, Musiime V, Snow RC, & Lepkowski JM (2015). Development of a psychosocial distress measure for Ugandan adolescents living with HIV. AIDS and Behavior, 19(2), 380–392. 10.1007/s10461-014-0973-y [DOI] [PubMed] [Google Scholar]
- Orkin M, Boyes ME, Cluver LD, & Zhang Y (2014). Pathways to poor educational outcomes for HIV/AIDS-affected youth in South Africa. AIDS Care, 26(3), 343–350. 10.1080/09540121.2013.824533 [DOI] [PubMed] [Google Scholar]
- Reise SP, Bonifay WE, & Haviland MG (2013). Scoring and modeling psychological measures in the presence of multidimensionality. Journal of Personality Assessment, 95(2), 129–140. 10.1080/00223891.2012.725437 [DOI] [PubMed] [Google Scholar]
- Rhemtulla M, Brosseau-Liard PÉ, & Savalei V (2012). When can categorical variables be treated as continuous? A comparison of robust continuous and categorical SEM estimation methods under suboptimal conditions. Psychological Methods, 17(3), 354–373. 10.1037/a0029315 [DOI] [PubMed] [Google Scholar]
- Rodriguez A, Reise SP, & Haviland MG (2016). Applying bifactor statistical indices in the evaluation of psychological measures. Journal of Personality Assessment, 98(3), 223–237. 10.1080/00223891.2015.1089249 [DOI] [PubMed] [Google Scholar]
- Skeen S, Macedo A, Tomlinson M, Hensels IS, & Sherr L (2016). Exposure to violence and psychological well-being over time in children affected by HIV/AIDS in South Africa and Malawi. AIDS Care, 28(sup1), 16–25. 10.1080/09540121.2016.1146219 [DOI] [PMC free article] [PubMed] [Google Scholar]
- Stemler SE, Chamvu F, Chart H, Jarvin L, Jere J, Hart L, Kaani B, Kalima K, Kwiatkowski J, Mambwe A, Kasonde-N'Gandu S, Newman T, Serpell R, Sparrow S, Sternberg R, & Grigorenko EL (2009). Assessing competencies in reading and mathematics in Zambian children. In Grigorenko EL (Ed.), Multicultural psychoeducational assessment (pp. 157–186). Springer Publishing Company. [Google Scholar]
- Stoppelbein L, Greening L, Moll G, Jordan S, & Suozzi A (2012). Factor analyses of the Pediatric Symptom Checklist-17 with African-American and Caucasian pediatric populations. Journal of Pediatric Psychology, 37(3), 348–357. 10.1093/jpepsy/jsr103 [DOI] [PubMed] [Google Scholar]
- Sweetland AC, Belkin GS, & Verdeli H (2014). Measuring depression and anxiety in sub-Saharan Africa. Depression and Anxiety, 31(3), 223–232. 10.1002/da.22142 [DOI] [PMC free article] [PubMed] [Google Scholar]
- UNICEF. (2007). The Gambia multiple indicator cluster survey 2005/2006 report: Monitoring the situation of children and women. Gambia Bureau of Statistics. [Google Scholar]
- Wechsler D (2003). WISC-IV: Administration and scoring manual. Psychological Corporation. [Google Scholar]
- WHO. (2014). Social determinants of mental health. World Health Organization. [Google Scholar]