

Summary
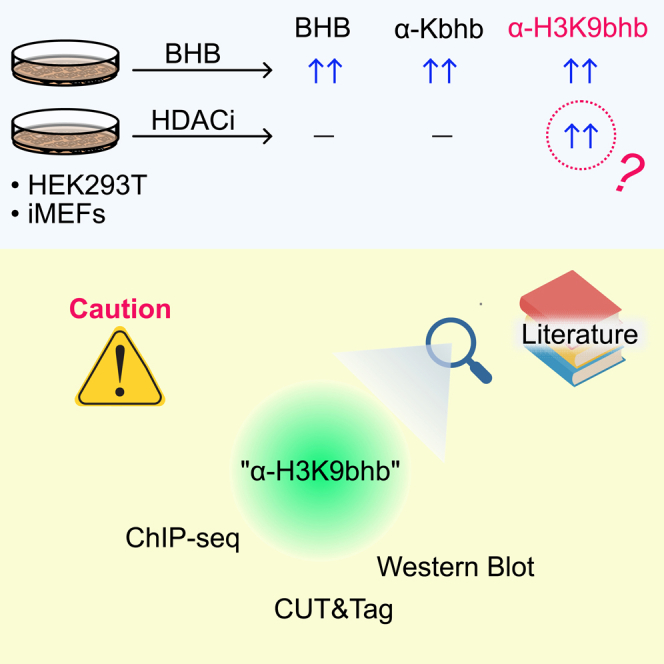
Ketone bodies are short-chain fatty acids produced in the liver during periods of limited glucose availability that provide an alternative energy source for the brain, heart, and skeletal muscle. Beyond this metabolic role, β-hydroxybutyrate (BHB), is gaining recognition as a signaling molecule. Lysine β-hydroxybutyrylation (Kbhb) is a newly discovered post-translational modification in which BHB is covalently attached to lysine ε-amino groups. This protein adduct is metabolically sensitive, dependent on BHB concentration, and found on proteins in multiple intracellular compartments. Therefore, Kbhb is hypothesized to be an important component of ketone body-regulated physiology. Kbhb on histones is proposed to be an epigenetic regulator, which links metabolic alterations to gene expression. However, we found that the widely used antibody against β-hydroxybutyrylated lysine 9 on histone H3 (H3K9bhb) also recognizes other modification(s) that likely include acetylation. Therefore, caution must be used when interpreting gene regulation data acquired with the H3K9bhb antibody.
Subject areas: Biological sciences, Biochemistry, Molecular biology, Cell biology
Graphical abstract
Highlights
-
•
Unexpected induction of H3K9bhb antibody signal in cells treated with HDAC inhibitors
-
•
Immunoprecipitation mass spectrometry provided no evidence of BHB on H3K9
-
•
Caution must be used when interpreting data obtained with the H3K9bhb antibody
Biological sciences; Biochemistry; Molecular biology; Cell biology.
Introduction
Post-translational modifications (PTMs) are important regulators of cell biology through their ability to modify protein function, structure, and location. Importantly, many PTMs are directly regulated by metabolism. For example, histone acetylation is achieved by transfer of an acetyl group from acetyl-CoA,1,2,3,4 a central metabolic intermediate required for both ATP production and energy storage pathways. Through this mechanism, nutrient availability and cellular energy status can control gene expression.5,6
While acetylation is a highly prevalent histone PTM, many other short-chain fatty acids can also form covalent adducts with lysine, including lactylation,7 butyrylation,8 crotonylation,9 and propionylation.8 Recently, the ketone body β-hydroxybutyrate (BHB) was reported as a novel PTM on lysine residues, β-hydroxybutyrylation, an adduct referred to as Kbhb.10 BHB is the most abundant circulating ketone body, with baseline concentrations ∼0.1–0.2mM in rodents and humans. BHB is produced by hepatocytes as an alternative energy source for the brain, heart, and skeletal muscle and is induced during periods of starvation or very-low-carbohydrate consumption, during which BHB levels increase >10-fold.11,12 This classical function of BHB underscores its essential physiological importance. In mammalian cell culture and mouse models, Kbhb abundance correlates with increasing concentrations of BHB.10,13 Therefore, there is great interest in understanding the significance of Kbhb and how this metabolically sensitive PTM might mediate metabolic adaptations to negative energy balance.
Like many PTMs, Kbhb was originally discovered on histones.10 Many of the histone Kbhb sites are the same residues that can also be acetylated. Among the most studied Kbhb residues is histone 3 lysine 9 (H3K9) based on its association with active gene expression when it is acetylated (H3K9ac) at promoter regions.14 To date, several studies have used H3K9bhb chromatin immunoprecipitation (ChIP) assays to identify BHB-regulated genes in the context of BHB-treatment, starvation, or ketogenic diet.10,15,16,17,18,19,20
Here we report our examination of the H3K9bhb antibody specificity. In the course of our studies, we observed unexpected induction of H3K9bhb antibody signal in cells not exposed to BHB. These data suggested that the H3K9bhb antibody used in prior publications might not be specific to its intended target. Using mass spectrometry, we confirmed that H3K9bhb is enriched only in cells treated with BHB, and that Western blot (WB) signal intensity does not reflect H3K9bhb abundance. Therefore, caution must be used when interpreting data obtained with the H3K9bhb antibody.
Results
Unexpected pattern of H3K9bhb expression
To test the specificity of Kbhb antibodies, we treated HEK293T cells and immortalized murine embryonic fibroblasts (iMEFs) with BHB, the structurally similar butyrate (Figure 1A), or the histone deacetylase inhibitor Trichostatin A (TSA) (Figure 1B). As expected, WB analysis with a pan-Kbhb antibody showed many β-hydroxybutyrylated proteins of a wide range of molecular weights in BHB-treated cells, but not with butyrate or TSA treatment. We observed a similar pattern with a site-specific Kbhb antibody that recognizes H4K8bhb. Surprisingly, both monoclonal and polyclonal antibodies that detect H3K9bhb did not follow this pattern. BHB treatment increased the H3K9bhb signals, as expected. However, the H3K9bhb signal in cells treated with butyrate or TSA was comparable to or exceeded that of BHB-treated cells. These results were evident regardless of BHB concentration (Figure S1). After carefully reexamining the literature, we found this unexpected result was also previously observed,21,22,23 although it was not investigated further. Untargeted metabolomics confirmed that butyrate treatment does not increase intracellular BHB levels (Figure 1C). Collectively, these data suggested the H3K9bhb antibody might also recognize other histone modifications.
Figure 1.

Irregular band patterns of H3K9bhb antibodies
(A) Structures of BHB and structurally similar butyrate.
(B) Western blots of HEK293T cells and iMEFs treated with either BHB, butyrate, or TSA for 24 h. Butyrate and TSA are known deacetylation inhibitors. Ponceau S staining was used to confirm the equivalent loading of proteins. mono: monoclonal, poly: polyclonal. Data are representative of at least 3 independent experiments.
(C) Upper: schematic of experimental workflow. HEK293T cells were treated with 5 mM BHB or 5 mM butyrate. At 24 h after the treatment, cellular metabolites were extracted and subjected to untargeted metabolomics by LC-MS/MS. unTx indicates untreated HEK293T cells. Lower: relative intensities of BHB in the metabolome of each treatment condition. N = 5-6 technical replicates per treatment condition. Data are represented as mean ± SD and analyzed by 1-way ANOVA (p < 0.0001).
Assessment of H3K9 modifications by mass spectrometry
Next, we directly tested the possibility that the H3K9bhb antibody might recognize alternative histone modifications. We treated HEK293T cells with BHB or butyrate and used the H3K9bhb antibody for immunoprecipitation (IP) (Figure 2A). WB analysis and Ponceau staining confirmed the successful enrichment of H3K9bhb after IP in the BHB-treated sample (Figure 2B, lanes 4 vs. 7). Mass spectrometry analysis confirmed the presence of H3 peptides that harbor BHB adducts on lysine 9 (Figures 2C and S2). As expected, Kbhb-containing H3 peptides were enriched in the BHB-treated sample, accounting for 27/183, or 13.99% (Table S1). In contrast, we only identified 2/113, or 1.74%, Kbhb-containing peptides in the butyrate-treated sample. A similar trend was also observed for the H3K9-containing peptide K9STGGKAPR: 3/14, or 21.43% contained H3K9bhb in the BHB-treated sample, but 0/24 contained H3K9bhb in the butyrate-treated sample. Given that butyrate inhibits protein deacetylation,24 we queried the mass spectrometry data for acetylated peptides and found a strong enrichment of H3K9ac-containing peptides in the butyrate-treated sample as compared to the BHB-treated sample (Figure 2D, Table S1). We expanded our analysis and also found other prevalent PTMs in our H3K9bhb pulldown samples, including butyrylation, mono-, di-, and tri-methylation, or propionylation (which includes both endogenous PTM and chemical derivatization as indicated in Figure 2A). While these data do not conclusively pinpoint which modifications are recognized by the H3K9bhb antibody, this mismatch between H3K9bhb abundance in Figure 1B and the lack of H3K9bhb-containing peptides in Figure 2D indicate the antibody is not specific to H3K9bhb.
Figure 2.

Absence of H3K9bhb in butyrate-treated HEK293T cells
(A) Schematic of experimental workflow. HEK293T cells were treated with 5 mM BHB or 5 mM butyrate for 24 h. Cell lysates were subjected to immunoprecipitation with α-H3K9bhb antibody or control normal rabbit IgG. The immunoprecipitants were used for Western blot analysis and SDS-PAGE, followed by Coomassie brilliant blue (CBB) staining and LC-MS/MS analysis.
(B) Western blot of input and H3K9bhb IP fractions of HEK293T treated with BHB or butyrate for 24 h. Ponceau S staining was used to confirm the equivalent loading of proteins and H3 enrichment.
(C) Representative tandem mass (MS/MS) spectra of the K9-BHB-ylated and K14-acetylated “PICnKSTGGKAPRR” peptides from BHB-treated samples. The detected y ions and b ions are highlighted in pink.
(D) Left: a strategy of the downstream analysis. Numbers in parentheses refer to the number of detected peptides in BHB or butyrate-treated samples. Right: detected peptide numbers for each modification at the K9 position in the indicated peptides. ND: not determined.
Discussion
Histone modification antibodies are notorious for specificity problems due to structural similarities and possible binding site access limitations due to neighboring site modifications.25,26,27 We observed unexpected signals with anti-H3K9bhb antibody when cells were treated with HDAC inhibitors (Figure 1B). One possible explanation was that endogenous H3K9bhb accumulates since HDAC inhibitors might prevent de-β-hydroxybutyrylation. However, our mass spectrometry analysis demonstrates conclusively that the only commercially available H3K9bhb antibody recognizes additional modifications, likely including acetylation, that undermine the reliability of this reagent for ChIP experiments to assess H3K9bhb-regulated gene expression. The antibody vendor PTM Biolab provides convincing results of dot-blots with peptides that contain single modifications of different residues, including an H3K9ac peptide (https://ptmbio.com/). It is possible that the unexpected nonspecific signals we observe by WB are due to different combinations of multiple modifications in cells and/or the stoichiometry of H3K9bhb might be lower than those other modifications. Consistent with this, we recover fewer H3K9bhb-containing peptides than expected with our pulldown strategy (Figure 2). We speculate this could be an indication of low prevalence of H3K9bhb in cells, even after treatment with high concentrations of BHB. We hope that by publicly reporting our data, new reagents can be developed with improved specificity so future studies can reexamine the possible importance of H3K9bhb. In addition, prior datasets using H3K9bhb (summarized in Table 1) should be interpreted with caution and the possible detection of H3K9ac or other PTMs should be considered.
Table 1.
Summary of previous studies that used H3K9bhb antibody
| Study | Cells/Tissues Analyzed | H3K9bhb Application |
|---|---|---|
| Xie et al., 201610 | mouse liver, HEK293 | ChIP-seq, WB |
| Chen et al., 201728 | mouse hypothalamus, primary neurons | WB |
| Nishitani et al., 201815 | 3T3-L1 | ChIP-qPCR |
| Chriett et al., 201921 | HEK293, L6 myotubes, HMEC-1 | WB |
| Zhang et al., 202018 | mouse CD8+ T cells | WB, ChIP-qPCR |
| Zhang et al., 201929 | HEK293T | Dot blot, WB |
| Huang et al., 2021 | HCT116, MEF, HeLa | WB |
| Terranova et al., 202117 | mouse small intestine crypt cells | ChIP-seq, WB |
| Zhang et al., 202130 | hepatocellular carcinoma | WB |
| Sangalli et al., 202223 | dairy cow cells/tissues | WB |
| Zheng et al., 202219 | mouse pancreas, Bx-PC3 cells | ChIP-Seq, CUT&Tag, WB |
| Cornuti et al., 202320 | occipital cortex | ChIP-seq, WB |
| Tang et al., 202316 | mouse CD8+ T cells | WB, ChIP-qPCR |
This table contains the prior publications that used the PTM Biolabs H3K9bhb antibodies, what sample type was analyzed, and what readouts were used. WB, western blot.
Limitations of study
Although we observed the enrichement of H3K9ac containing peptides in the butyrate-treated H3K9bhb IP (Figure 2), we did not determine what the anti-H3K9bhb antibody actually recognizes. Although it would not change the conclusion of our study, a peptide array could be used to identify the modifications recognized by the H3K9bhb antibody, which might be helpful for interpreting prior studies that used this reagent.
STAR★Methods
Key resources table
| REAGENT or RESOURCE | SOURCE | IDENTIFIER |
|---|---|---|
| Antibodies | ||
| anti-Kbhb | PTM Biolabs | Cat# PTM-1201RM |
| anti-H3K9bhb (mono) | PTM Biolabs | Cat# PTM-1250 |
| anti-H3K9bhb (poly) | PTM Biolabs | Cat# PTM-1250RM |
| anti-H4K8bhb | PTM Biolabs | Cat# PTM-1253RM |
| anti-Kac | Cell Signaling Technology | Cat# 9814S; RRID: AB_10544700 |
| Normal rabbit IgG | Cell Signaling Technology | Cat# 2749 |
| Goat anti-Rabbit IgG HRP | Thermo Scientific | Cat# 31460 |
| Rabbit TrueBlot®: Anti-Rabbit IgG HRP | ROCKLAND | Cat# 18-8816-31 |
| Chemicals, peptides, and recombinant proteins | ||
| DL-β-Hydroxybutyric acid sodium salt (BHB) | Sigma-Aldrich | H6501 |
| Sodium butyrate | Sigma-Aldrich | B5887 |
| Trichostatin A (TSA) | Sigma-Aldrich | T8552 |
| RIPA buffer | Thermo Scientific | 89901 |
| Protease inhibitor cocktail | Thermo Scientific | A32965 |
| Dynabeads™ M-280 Sheep Anti-Rabbit IgG | Invitrogen | 11203D |
| DMEM (Dulbecco’s Modified Eagle’s Medium) | Gibco | 10569044 |
| DPBS (Dulbecco’s Phosphate Buffered Saline) | Gibco | 14190250 |
| Antibiotic-Antimycotic (100X) | Gibco | 15240062 |
| Sequencing Grade Modified Trypsin | Promega | V5110 |
| Critical commercial assays | ||
| DC Protein Assay | BioRad | 5000116 |
| Experimental models: Cell lines | ||
| HEK293T | N/A | N/A |
| iMEFs | ATCC | CRL-1503 |
| Software and algorithms | ||
| Prism (v9.5.1.) | Graphpad | https://www.graphpad.com/ |
| ProteinProspector (v 6.4.0) | Guan et al., 201134 | https://sargent.ucsf.edu/prospector/mshome.htm |
| Raw data | This paper | https://doi.org/10.17632/ttbt8hfhw5.1 |
Resource availability
Lead contact
Further information and any requests for resources and reagents should be directed to and will be fulfilled by the lead contact, Emily L. Goldberg (Emily.Goldberg[at]ucsf.edu).
Material availability
This study did not generate new unique reagents.
Experimental model and study participant details
Cell culture
HEK293T cells and iMEFs were cultured in DMEM (Gibco) supplemented with 10% fetal bovine serum and 1x antibiotic-antimycotic (Gibco) in a 37°C incubator with 5% CO2. Cells were treated with BHB, butyrate, and TSA at the indicated concentrations in each figure for 24 h.
Method details
Western blot analysis
Cells were harvested after trypsinization and quenching with medium, washed once with PBS, and lysed with RIPA buffer (Thermo Scientific) supplemented with protease and phosphatase inhibitors (Thermo Scientific). The cell lysates were sonicated using a Branson Sonifier 450 until the viscosity of lysates disappears and centrifuged at 14,000 rpm (17,968 xg) for 5 min. The supernatants were subjected to the DC Protein Assay Kit (BioRad Laboratories). SDS-PAGE samples were prepared by mixing the supernatants and 4x Laemmli buffer/10% beta-mercaptoethanol (BioRad Laboratories) and followed by boiling at 95°C for 5 min. Equivalent amounts of protein were resolved by SDS-PAGE and then transferred to a nitrocellulose membrane using the Trans-Blot Turbo Transfer system (BioRad Laboratories). Membranes were stained with Ponceaus S, blocked with 5% milk/TBS-T (Tris-Buffered Saline/0.1% Tween 20) for 30–60 min, and incubated with primary antibodies, followed by secondary HRP-conjugated antibodies. Blots were developed using a chemiluminescent substrate (SuperSignal West Pico PLUS or SuperSignal West Femto Maximum Sensitivity Substrate; Thermo Scientific) and imaged with an Azure 300 (azure biosystems).
Sample preparation for untargeted metabolomic analysis
Cells were seeded at the dense of 6.0x10ˆ5 cells/well of a 6-well dish. Six wells were used per condition. After one day of culture, BHB or butyrate at 5 mM was directly added to the culture medium. At 24 h after treatment, cells were washed with 0.9% NaCl at room temperature, harvested by scraping, centrifuged at 1,500 rpm to remove the supernatant, and stored as a pellet at −80°C until further processing. Cell pellets were resuspended with 225 μL of ice-cold methanol and mixed with 750 μL of ice-cold methyl butyl ether. After vortexing for 10 s and shaking for 6 min at 4°C, 188 μL of distilled water was added to the samples. Samples were additionally vortexed for 20 s and centrifuged for 2 min at 14,000xg. The bottom phase was transferred to a new tube, dried, subjected to lipid cleanup, resuspended with 20 μL 3:2 v/v acetonitrile:water, and used for LC-MS/MS.
LC-MS/MS using the HILIC (hydrophilic interaction liquid chromatography) method
We performed untargeted metabolomics using the HILIC method to detect polar metabolites including BHB as described previously.31 Samples were injected onto a Waters Acquity UPLC BEH Amide column (150 mm length × 2.1 mm id; 1.7 μm particle size) with an additional Waters Acquity VanGuard BEH Amide pre-column (5 mm × 2.1 mm id; 1.7 μm particle size) maintained at 45°C coupled to an Thermo Vanquish UPLC. The mobile phases were prepared with 10 mM ammonium formate and 0.125% formic acid in either 100% LC-MS grade water for mobile phase (A) or 95:5 v/v acetonitrile:water for mobile phase (B). Gradient elution was performed from 100% (B) at 0–2 min to 70% (B) at 7.7 min, 40% (B) at 9.5 min, 30% (B) at 10.25 min, 100% (B) at 12.75 min, isocratic until 16.75 min with a column flow of 0.4 mL/min. Spectra were collected using a Thermo Q Exactive HF Hybrid Quadrupole-Orbitrap mass spectrometer in both positive and negative mode ionization (separate injections). Full MS-ddMS2 data were collected, an inclusion list was used to prioritize MS2 selection of metabolites from the in-house ‘local’ library, when additional scan bandwidth was available MS2 was collected in a data-dependent manner. Mass range was 60–900 mz, resolution was 60k (MS1) and 15k (MS2), centroid data were collected, loop count was 4, isolation window was 1.2 Da.
Immunoprecipitation
Cells were treated with BHB or butyrate at 5 mM. After 24 h of treatment, approximately 5.0x10ˆ7 cells per sample were harvested after trypsinization and quenching with medium, washed once with PBS, and lysed with PBS-T (PBS/1% Triton X-100) supplemented with protease and phosphatase inhibitors (Thermo Scientific). After incubating for 10 min on ice, the cell lysates were centrifuged at 10,000 rpm (9,168 xg) for 5 min to remove supernatant (rough cytoplasmic fraction). The cell pellet was washed once with 1 mL PBS-T, snap-frozen by liquid nitrogen, and stored at −80°C until further processing. The frozen pellet was resuspended in 500 μL SDS-lysis buffer (50 mM Tris-HCl at pH 7.5, 1% SDS) per 5.0×10ˆ7 cells. The lysates were sonicated using a Branson Sonifier 450 and were subjected to the DC Protein Assay Kit (BioRad Laboratories). 7 mg/mL lysates were made by adding SDS-Lysis buffer and beta-mercaptoethanol at a final concentration of 0.5%, and were boiled at 95°C for 5 min to denature proteins. The denatured proteins were diluted 1:10 with NP-40 lysis buffer (50 mM Tris-HCl at pH 7.5, 150 mM NaCl, 1 mM EDTA, 10% glycerol, 1% Nonidet P-40) to reduce SDS concentration. The approximately 0.7 mg/mL lysates (5 mL per sample) were incubated with antibody-conjugated anti-Rabbit IgG Dynabeads (Invitrogen, 11203D) overnight at 4°C. The resins were then washed five times with the NP-40 lysis buffer and eluted by incubating them in 0.2% SDS-elution buffer (50 mM Tris-HCl at pH 7.5, 0.2% SDS) at 60°C for 20 min. Elutions were mixed with 4× Laemmli buffer/10% beta-mercaptoethanol (BioRad Laboratories) and boiled at 95°C for 5 min. The 1/10 amount of samples was used for WB analysis and the remainder was used for mass spectrometry analysis.
Histone Hybrid propionylation-phenyl isocyanate derivatization, in gel digestion and mass spectrometry analysis
Immunoprecipitated samples were loaded on SDS-PAGE and stained with Coomassie Brilliant Blue (CBB; GelCode Blue Stain; Thermo Scientific). A band corresponding to histone H3 was excised using a sharp and clean blade. H3 bands were excised, cut in 1mm3 pieces, and transferred to low protein binding 0.6 mL tubes. Proteins were digested in-gel with trypsin as described previously32 and H3 in gel was subjected to a hybrid propionylation-phenyl isocyanate derivatization, adapting the method described by Maile33 with the necessary modifications to processing in gel samples, as indicated next. Gel pieces were washed for 5 min with 100 μL 50% acetonitrile (MeCN) in 100 mM triethylammonium bicarbonate (TEAB) pH 8.5, with shaking. The supernatant was removed, and samples rehydrated by adding 100 μL 100 mM TEAB pH 8.5 and shaking for 5 min. The supernatant was removed. The washes with 50% MeCN in 100 mM TEAB and then 100 mM TEAB were repeated 3 more times, until the Coomassie staining was removed. Then we added to the gel pieces 80 μL 100 mM TEAB pH 8.5, to reach a total volume including gel around 100 μL; then added 10 μL of propionic anhydride 1/100 in water, vortexing and incubating the samples for 5 min at room temperature. After that, we removed the supernatant, and repeated 2 more times the incubation with propionic anhydride, adding each time 80 μL 100 mM TEAB pH 8.5 plus 10 μL of propionic anhydride 1/100 in water. After removing the supernatant, we added 90 μL 100 mM TEAB pH 8.5 plus 10 μL of 80 mM hydroxylamine to quench excess reagent and incubated for 20 min at room temperature with shaking. After that, we removed the supernatant and washed for 5min with 100 μL 50% MeCN in 100 mM TEAB, then 3 times with 100 μL 70% MeCN in 100 mM TEAB and evaporated the gel pieces to total dryness in speed vac. Dry gel pieces were added 8 μl of a Trypsin solution (Promega) 10 ng/μl in 100 mM TEAB. After incubating at room temperature for 10 min to allow complete absorption of the solution in the acrylamide pieces, we added 40 μL 100 mM TEAB and incubated with shaking at 37C, overnight. After that, we added 15 μL of a 1% v/v solution of phenyl isocyanate (PIC) in acetonitrile (Prepared fresh) to each sample, and incubated for 60 min at 37°C. The reaction with PIC was repeated again. Then, the gel pieces were sonicated in bath for 5 min, and the supernatant recovered in a new set of 0.6 mL low protein binding vials. The gel pieces were extracted twice with 40 μL 50% MeCN 5% formic acid, for 30 min with shaking, and the supernatant recovered to the tubes used previously to transfer the aqueous supernatants. These extracts were evaporated in a speed vac, resuspended in 20 μL of 0.1% formic and peptides extracted with with C18 ziptips (Millipore). Eluted peptide mixtures were evaporated and resuspended in 0.1% formic acid and run onto a 2 μm 75 μm × 50 cm PepMap RSLC C18 EasySpray column (Thermo Scientific) using 3-h MeCN gradients (2–30% in 0.1% formic acid), coupled to an Orbitrap Exploris (Themo Scientific) for analysis in positive ion mode. MS spectra were acquired between 365 and 1400 m/z with a resolution of 120000. For each MS spectrum, multiply charged ions over the selected threshold (2E4) were selected for MSMS in cycles of 3 s with an isolation window of 1.6 m/z. Precursor ions were fragmented by HCD. Acquisition method specified an inclusion list for the m/z of ions corresponding to H3 K9-R17 peptides with either BHB or butyrate, plus propionyl, mono, di and trimethyl, acetyl, butyryl or BHB. A dynamic exclusion window was applied which prevented the same m/z from being selected for 30s after its acquisition.
For peptide and protein identification, peak lists were generated using PAVA in-house software.34 All generated peak lists were searched against the human subset of the SwissProt database (SwissProt.2019.07.31), using Protein Prospector35 with the following parameters: Enzyme specificity was set as Arg-C, and up to 2 missed cleavages per peptide were allowed. N-acetylation of the N-terminus of the protein, loss of protein N-terminal methionine, pyroglutamate formation from of peptide N-terminal glutamines, oxidation of methionine, PIC derivatization of N termini (C7 N1 O1 H5), methylation and dimethylation of arginine, phosphorylation of serine, threonine or tyrosine, propionylation, acetylation, methylation, dimethylation, trimethylation, ubiquitination, butyrylation and β-hydroxybutyrylation (+86.0368) of lysine, were allowed as variable modifications, and up to 6 modifications per peptide were allowed. Mass tolerance was 5 ppm in MS and 30 ppm in MS/MS. The false positive rate was estimated by searching the data using a concatenated database which contains the original SwissProt database, as well as a version of each original entry where the sequence has been randomized. A 1% FDR was permitted at the protein and peptide level. As a downstream analysis, peptides corresponding to histone H3.1 were extracted and counted. Subquently, H3K9-containing peptides were extracted and counted. Each modification on the lysine 9 positions was manually counted. All the peptides information was given in Table S1.
Statistical analysis
Data were analyzed for statistical differences and graphed in GraphPad Prism. All experimental and statistical analysis details are contained within respective figure legends.
Acknowledgments
We thank members of the Goldberg lab for comments and intellectual discussion. We also thank Hiten Madhani (UCSF) for intellectual discussion and manuscript feedback, Anna Molofsky’s lab (UCSF) for sharing HEK293T cells, and Yoshihiro Ishikawa (UCSF) for sharing iMEFs. We also thank Catharine Bosio, Benjamin Schwarz, and Eric Bohrnsen (NIAID/NIH Rocky Mountain Labs) for feedback and independent metabolomics validation. This work was funded by NIH/NIA (R00AG058801 to E.L.G., a pilot and feasibility award from the UCSF Liver Center P30DK026743 to E.L.G.), the Chan Zuckerberg Biohub, the Sandler Program for Breakthrough Biomedical Research, which is partially funded by the Sandler Foundation, JSPS Overseas Research Japanese Postdoctoral Fellowship (to T.T.), and the Dr. Miriam and Sheldon G. Adelson Medical Research Foundation (AMRF, to Dr. A. L. Burlingame, Director of the Mass Spectrometry Resource Center at UCSF).
Author contributions
E.L.G. and T.T. conceptualized project, designed experiments, and prepared the manuscript. T.T. performed experiments and analyzed data. J.A.O.P. performed mass spectrometry sample prep, acquisition, and data analysis, and this was overseen by A.L.B. C.L. performed experiments. B.D.F. performed untargeted metabolomics sample prep, acquisition, and analysis. B.S. and E.B. performed metabolomics sample acquisition and data analysis, and this was overseen by C.B. All authors read, commented on, and approved the manuscript.
Declaration of interests
The authors declare no competing interests.
Published: June 29, 2023
Footnotes
Supplemental information can be found online at https://doi.org/10.1016/j.isci.2023.107235.
Supplemental information
Data and code availability
-
•
The raw data used to generate the figures in this manuscript is available from the the Mendelay data repository at Mendeley Data: https://doi.org/10.17632/ttbt8hfhw5.1.
-
•
No code was used or developed for this study.
-
•
All other items for this study are contained within the published manuscript and supplemental files.
References
- 1.Phillips D.M. The presence of acetyl groups of histones. Biochem. J. 1963;87:258–263. doi: 10.1042/bj0870258. [DOI] [PMC free article] [PubMed] [Google Scholar]
- 2.Bloch K., Borek E. Biological acetylation of natural amino acids. J. Biol. Chem. 1946;164:483. [PubMed] [Google Scholar]
- 3.Lipmann F., Kaplan N.O. Report on a coenzyme for acetylation. Fed. Proc. 1946;5:145. [PubMed] [Google Scholar]
- 4.Brownell J.E., Zhou J., Ranalli T., Kobayashi R., Edmondson D.G., Roth S.Y., Allis C.D. Tetrahymena histone acetyltransferase A: a homolog to yeast Gcn5p linking histone acetylation to gene activation. Cell. 1996;84:843–851. doi: 10.1016/s0092-8674(00)81063-6. [DOI] [PubMed] [Google Scholar]
- 5.Li X., Egervari G., Wang Y., Berger S.L., Lu Z. Regulation of chromatin and gene expression by metabolic enzymes and metabolites. Nat. Rev. Mol. Cell Biol. 2018;19:563–578. doi: 10.1038/s41580-018-0029-7. [DOI] [PMC free article] [PubMed] [Google Scholar]
- 6.Sabari B.R., Zhang D., Allis C.D., Zhao Y. Metabolic regulation of gene expression through histone acylations. Nat. Rev. Mol. Cell Biol. 2017;18:90–101. doi: 10.1038/nrm.2016.140. [DOI] [PMC free article] [PubMed] [Google Scholar]
- 7.Zhang D., Tang Z., Huang H., Zhou G., Cui C., Weng Y., Liu W., Kim S., Lee S., Perez-Neut M., et al. Metabolic regulation of gene expression by histone lactylation. Nature. 2019;574:575–580. doi: 10.1038/s41586-019-1678-1. [DOI] [PMC free article] [PubMed] [Google Scholar]
- 8.Chen Y., Sprung R., Tang Y., Ball H., Sangras B., Kim S.C., Falck J.R., Peng J., Gu W., Zhao Y. Lysine propionylation and butyrylation are novel post-translational modifications in histones. Mol. Cell. Proteomics. 2007;6:812–819. doi: 10.1074/mcp.M700021-MCP200. [DOI] [PMC free article] [PubMed] [Google Scholar]
- 9.Tan M., Luo H., Lee S., Jin F., Yang J.S., Montellier E., Buchou T., Cheng Z., Rousseaux S., Rajagopal N., et al. Identification of 67 histone marks and histone lysine crotonylation as a new type of histone modification. Cell. 2011;146:1016–1028. doi: 10.1016/j.cell.2011.08.008. [DOI] [PMC free article] [PubMed] [Google Scholar]
- 10.Xie Z., Zhang D., Chung D., Tang Z., Huang H., Dai L., Qi S., Li J., Colak G., Chen Y., et al. Metabolic Regulation of Gene Expression by Histone Lysine beta-Hydroxybutyrylation. Mol. Cell. 2016;62:194–206. doi: 10.1016/j.molcel.2016.03.036. [DOI] [PMC free article] [PubMed] [Google Scholar]
- 11.Cahill G.F., Jr. Fuel metabolism in starvation. Annu. Rev. Nutr. 2006;26:1–22. doi: 10.1146/annurev.nutr.26.061505.111258. [DOI] [PubMed] [Google Scholar]
- 12.Puchalska P., Crawford P.A. Metabolic and Signaling Roles of Ketone Bodies in Health and Disease. Annu. Rev. Nutr. 2021;41:49–77. doi: 10.1146/annurev-nutr-111120-111518. [DOI] [PMC free article] [PubMed] [Google Scholar]
- 13.Koronowski K.B., Greco C.M., Huang H., Kim J.K., Fribourgh J.L., Crosby P., Mathur L., Ren X., Partch C.L., Jang C., et al. Ketogenesis impact on liver metabolism revealed by proteomics of lysine beta-hydroxybutyrylation. Cell Rep. 2021;36:109487. doi: 10.1016/j.celrep.2021.109487. [DOI] [PMC free article] [PubMed] [Google Scholar]
- 14.Wang Z., Zang C., Rosenfeld J.A., Schones D.E., Barski A., Cuddapah S., Cui K., Roh T.Y., Peng W., Zhang M.Q., Zhao K. Combinatorial patterns of histone acetylations and methylations in the human genome. Nat. Genet. 2008;40:897–903. doi: 10.1038/ng.154. [DOI] [PMC free article] [PubMed] [Google Scholar]
- 15.Nishitani S., Fukuhara A., Shin J., Okuno Y., Otsuki M., Shimomura I. Metabolomic and microarray analyses of adipose tissue of dapagliflozin-treated mice, and effects of 3-hydroxybutyrate on induction of adiponectin in adipocytes. Sci. Rep. 2018;8:8805. doi: 10.1038/s41598-018-27181-y. [DOI] [PMC free article] [PubMed] [Google Scholar]
- 16.Tang K., Zhang H., Deng J., Wang D., Liu S., Lu S., Cui Q., Chen C., Liu J., Yang Z., et al. Ammonia detoxification promotes CD8(+) T cell memory development by urea and citrulline cycles. Nat. Immunol. 2023;24:162–173. doi: 10.1038/s41590-022-01365-1. [DOI] [PubMed] [Google Scholar]
- 17.Terranova C.J., Stemler K.M., Barrodia P., Jeter-Jones S.L., Ge Z., de la Cruz Bonilla M., Raman A., Cheng C.W., Allton K.L., Arslan E., et al. Reprogramming of H3K9bhb at regulatory elements is a key feature of fasting in the small intestine. Cell Rep. 2021;37:110044. doi: 10.1016/j.celrep.2021.110044. [DOI] [PMC free article] [PubMed] [Google Scholar]
- 18.Zhang H., Tang K., Ma J., Zhou L., Liu J., Zeng L., Zhu L., Xu P., Chen J., Wei K., et al. Ketogenesis-generated beta-hydroxybutyrate is an epigenetic regulator of CD8(+) T-cell memory development. Nat. Cell Biol. 2020;22:18–25. doi: 10.1038/s41556-019-0440-0. [DOI] [PubMed] [Google Scholar]
- 19.Zheng Y., Sun W., Shan C., Li B., Liu J., Xing H., Xu Q., Cui B., Zhu W., Chen J., et al. beta-hydroxybutyrate inhibits ferroptosis-mediated pancreatic damage in acute liver failure through the increase of H3K9bhb. Cell Rep. 2022;41:111847. doi: 10.1016/j.celrep.2022.111847. [DOI] [PubMed] [Google Scholar]
- 20.Cornuti S., Chen S., Lupori L., Finamore F., Carli F., Samad M., Fenizia S., Caldarelli M., Damiani F., Raimondi F., et al. Brain histone beta-hydroxybutyrylation couples metabolism with gene expression. Cell. Mol. Life Sci. 2023;80:28. doi: 10.1007/s00018-022-04673-9. [DOI] [PMC free article] [PubMed] [Google Scholar]
- 21.Chriett S., Dąbek A., Wojtala M., Vidal H., Balcerczyk A., Pirola L. Prominent action of butyrate over beta-hydroxybutyrate as histone deacetylase inhibitor, transcriptional modulator and anti-inflammatory molecule. Sci. Rep. 2019;9:742. doi: 10.1038/s41598-018-36941-9. [DOI] [PMC free article] [PubMed] [Google Scholar]
- 22.Huang H., Zhang D., Weng Y., Delaney K., Tang Z., Yan C., Qi S., Peng C., Cole P.A., Roeder R.G., Zhao Y. The regulatory enzymes and protein substrates for the lysine beta-hydroxybutyrylation pathway. Sci. Adv. 2021;7:eabe2771. doi: 10.1126/sciadv.abe2771. [DOI] [PMC free article] [PubMed] [Google Scholar]
- 23.Sangalli J.R., Nociti R.P., Del Collado M., Sampaio R.V., da Silveira J.C., Perecin F., Smith L.C., Ross P.J., Meirelles F.V. Characterization of histone lysine beta-hydroxybutyrylation in bovine tissues, cells, and cumulus-oocyte complexes. Mol. Reprod. Dev. 2022;89:375–398. doi: 10.1002/mrd.23630. [DOI] [PubMed] [Google Scholar]
- 24.Candido E.P., Reeves R., Davie J.R. Sodium butyrate inhibits histone deacetylation in cultured cells. Cell. 1978;14:105–113. doi: 10.1016/0092-8674(78)90305-7. [DOI] [PubMed] [Google Scholar]
- 25.Rothbart S.B., Dickson B.M., Raab J.R., Grzybowski A.T., Krajewski K., Guo A.H., Shanle E.K., Josefowicz S.Z., Fuchs S.M., Allis C.D., et al. An interactive database for the assessment of histone antibody specificity. Mol. Cell. 2015;59:502–511. doi: 10.1016/j.molcel.2015.06.022. [DOI] [PMC free article] [PubMed] [Google Scholar]
- 26.Fuchs S.M., Strahl B.D. Antibody recognition of histone post-translational modifications: emerging issues and future prospects. Epigenomics. 2011;3:247–249. doi: 10.2217/epi.11.23. [DOI] [PubMed] [Google Scholar]
- 27.Egelhofer T.A., Minoda A., Klugman S., Lee K., Kolasinska-Zwierz P., Alekseyenko A.A., Cheung M.S., Day D.S., Gadel S., Gorchakov A.A., et al. An assessment of histone-modification antibody quality. Nat. Struct. Mol. Biol. 2011;18:91–93. doi: 10.1038/nsmb.1972. [DOI] [PMC free article] [PubMed] [Google Scholar]
- 28.Chen L., Miao Z., Xu X. beta-hydroxybutyrate alleviates depressive behaviors in mice possibly by increasing the histone3-lysine9-beta-hydroxybutyrylation. Biochem. Biophys. Res. Commun. 2017;490:117–122. doi: 10.1016/j.bbrc.2017.05.184. [DOI] [PubMed] [Google Scholar]
- 29.Zhang X., Cao R., Niu J., Yang S., Ma H., Zhao S., Li H. Molecular basis for hierarchical histone de-beta-hydroxybutyrylation by SIRT3. Cell Discov. 2019;5:35. doi: 10.1038/s41421-019-0103-0. [DOI] [PMC free article] [PubMed] [Google Scholar]
- 30.Zhang H., Chang Z., Qin L.N., Liang B., Han J.X., Qiao K.L., Yang C., Liu Y.R., Zhou H.G., Sun T. MTA2 triggered R-loop trans-regulates BDH1-mediated beta-hydroxybutyrylation and potentiates propagation of hepatocellular carcinoma stem cells. Signal Transduct. Targeted Ther. 2021;6:135. doi: 10.1038/s41392-021-00464-z. [DOI] [PMC free article] [PubMed] [Google Scholar]
- 31.Sarkar A., Jin Y., DeFelice B.C., Logan C.Y., Yang Y., Anbarchian T., Wu P., Morri M., Neff N.F., Nguyen H., et al. Intermittent fasting induces rapid hepatocyte proliferation to restore the hepatostat in the mouse liver. Elife. 2023;12:e82311. doi: 10.7554/eLife.82311. [DOI] [PMC free article] [PubMed] [Google Scholar]
- 32.Rosenfeld J., Capdevielle J., Guillemot J.C., Ferrara P. In-gel digestion of proteins for internal sequence analysis after one- or two-dimensional gel electrophoresis. Anal. Biochem. 1992;203:173–179. doi: 10.1016/0003-2697(92)90061-b. [DOI] [PubMed] [Google Scholar]
- 33.Maile T.M., Izrael-Tomasevic A., Cheung T., Guler G.D., Tindell C., Masselot A., Liang J., Zhao F., Trojer P., Classon M., Arnott D. Mass spectrometric quantification of histone post-translational modifications by a hybrid chemical labeling method. Mol. Cell. Proteomics. 2015;14:1148–1158. doi: 10.1074/mcp.O114.046573. [DOI] [PMC free article] [PubMed] [Google Scholar]
- 34.Guan S., Price J.C., Prusiner S.B., Ghaemmaghami S., Burlingame A.L. A data processing pipeline for mammalian proteome dynamics studies using stable isotope metabolic labeling. Mol. Cell. Proteomics. 2011;10 doi: 10.1074/mcp.M111.010728. M111.010728. [DOI] [PMC free article] [PubMed] [Google Scholar]
- 35.Clauser K.R., Baker P., Burlingame A.L. Role of accurate mass measurement (+/- 10 ppm) in protein identification strategies employing MS or MS/MS and database searching. Anal. Chem. 1999;71:2871–2882. doi: 10.1021/ac9810516. [DOI] [PubMed] [Google Scholar]
Associated Data
This section collects any data citations, data availability statements, or supplementary materials included in this article.
Supplementary Materials
Data Availability Statement
-
•
The raw data used to generate the figures in this manuscript is available from the the Mendelay data repository at Mendeley Data: https://doi.org/10.17632/ttbt8hfhw5.1.
-
•
No code was used or developed for this study.
-
•
All other items for this study are contained within the published manuscript and supplemental files.