

Summary
Opioid receptors, including the kappa opioid receptor (KOR), exert control over thermoregulation and feeding behavior. Notably, activation of KOR stimulates food intake, leading to postulation that KOR signaling plays a central role in managing energy intake. KOR has also been proposed as a target for treating obesity. Herein, we report studies examining how roles for KOR signaling in regulating thermogenesis, feeding, and energy balance may be interrelated using pharmacological interventions, genetic tools, quantitative thermal imaging, and metabolic profiling. Our findings demonstrate that activation of KOR in the central nervous system causes increased energy expenditure via brown adipose tissue activation. Importantly, pharmacologic, or genetic inhibition of brown adipose tissue thermogenesis prevented the elevated food intake triggered by KOR activation. Furthermore, our data reveal that KOR-mediated thermogenesis elevation is reversibly disrupted by chronic high-fat diet, implicating KOR signaling as a potential mediator in high-fat diet-induced weight gain.
Subject areas: Neuroscience, Endocrinology, Cell biology
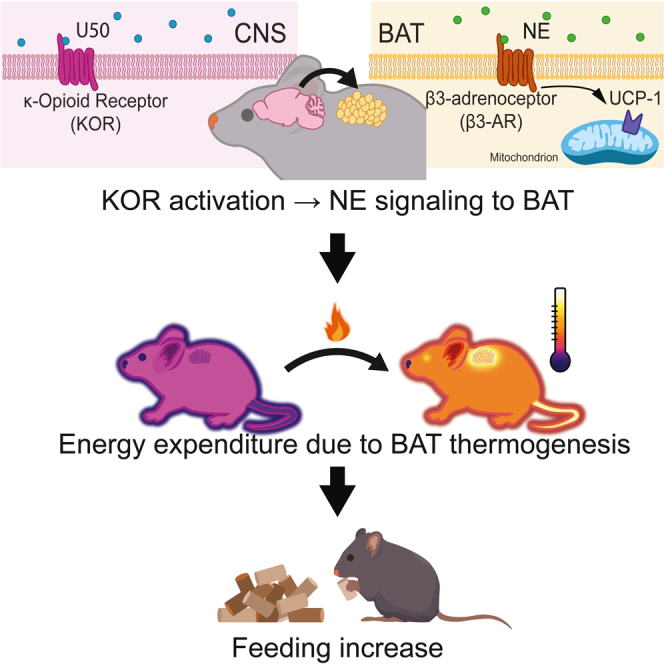
Graphical abstract
Highlights
-
•
Activation of kappa opioid receptors (KOR) in the CNS increases thermogenesis
-
•
KOR mediate activation of BAT requires Ucp1 and beta-3 adrenergic receptors
-
•
KOR induced increased feeding requires increased BAT thermogenesis
-
•
Chronic high-fat diet reversibly disrupts KOR-induced thermogenesis
Neuroscience; Endocrinology; Cell biology
Introduction
Energy balance—maintaining energy intake to meet expenditures—is critical to survival and health. For endotherms, such as humans and mice, maintenance of body temperature can represent a substantial energy demand.1,2,3 Brown adipose tissue (BAT) is important for thermal homeostasis in mice, as it generates heat through uncoupled respiration.4 BAT is present in adult humans and is increasingly understood as important in promoting health.5,6,7 Uncoupled protein 1 (Ucp1), encoded by the gene Ucp1, is a mitochondrial protein responsible for BAT thermogenesis.8 Neural networks in the central nervous system (CNS) that regulate sympathetic nervous system activity are key modulators of BAT thermogenesis, since they coordinate the release of norepinephrine onto BAT and lead to increased thermogenesis.9 Neural circuits integrate energy consumption and regulate feeding behavior. For example, neurons in the arcuate nucleus that promote feeding are activated in response to cold-induced energy demand to increase food intake, linking energy expended to maintain body temperature to energy intake.10,11
Opioid systems modulate body temperature and stimulate feeding behaviors, supporting roles for these signaling pathways as key regulators of energy balance.12,13,14,15,16,17,18 Like other canonical opioid receptors, the kappa opioid receptor (KOR) is a seven transmembrane domain G protein-coupled receptor that modulates metabolism and thermal regulation.19,20,21,22,23,24 KOR also mediates responses to caloric challenge; specifically, targeted genetic deletion of KOR mitigates diet-induced obesity and KOR antagonism in the setting of caloric restriction promotes weight loss.22,25 Conversely, activation of the kappa opioid system increases food intake.17 The compound U50, 488H (U50), a selective kappa opioid agonist, causes hyperthermia and increases oxygen consumption, suggesting that the kappa opioid system plays a role in energy expenditure as well as intake.17,26,27,28 Recent studies in rats suggest that KOR signaling is altered by diet-induced obesity leading to inhibition of BAT activation.29 Here, we examined how roles for KOR signaling in regulating thermogenesis, feeding, and energy balance may be interrelated.
In this study, we used quantitative thermal imaging, indirect calorimetry, and home cage feeding devices (FED3) to monitor food intake and investigate the roles of KOR activation in regulating thermogenesis, energy use, and feeding. We also examined the impact of diet-induced obesity on the thermogenic effects of KOR activation. We found that KOR activation in the CNS induces hyperthermia by increasing BAT thermogenesis through activation of beta-3 adrenergic receptors (β3-AR) and increased energy expenditure. Surprisingly, blocking BAT activation with a β3-AR antagonist or targeted disruption of Ucp1 prevented an increase in feeding following U50 administration. We also observed that chronic high-fat diet (HFD) blocked U50-mediated thermogenesis, suggesting that HFD attenuates this mechanism for expending energy. U50-mediated thermogenesis rapidly recovered when HFD was removed. These results advance our understanding of thermal regulation, opioid-induced feeding, and targeting of the kappa opioid system for therapeutic purposes.
Results
Activation of kappa opioid receptors in the CNS drives acute brown adipose tissue thermogenesis
KOR activation has complex effects on body temperature.30,31,32 To examine the potential mechanisms by which KOR activation alters body temperatures, we combined quantitative thermal imaging with pharmacological manipulation of the kappa opioid system. We tested the effects of systemic administration, intraperitoneal (i.p.) injection, of the KOR agonist U50 on temperatures of intrascapular BAT, eye surface (proxy for core temperature), and tail temperature in a cohort of C57BL/6BJ mice (n = 10; 6 males and 4 females) (Wild Type, Figures 1A–1D). Each animal was tested in all conditions. At the 0-min time point, we injected mice i.p. with vehicle (saline) or the non-selective opioid receptor antagonist naltrexone (NTX) (10 mg/kg); 30 min after pretreatment, we injected them with U50 (5 mg/kg) or with saline. We recorded quantitative thermal videos of each animal (see still image examples in Figure 1A), and imaging analysis revealed that U50 caused a significant (p < 0.001, paired t test) increase in BAT temperatures compared to saline controls (Figure 1B). This temperature increase began 10 min after injection (t = 40 min) and persisted until the 90-min time point. Compared to saline, NTX alone did not induce significant changes, but it blocked the U50 effect on BAT temperature with significant (p < 0.001 paired t test) difference in mean BAT temperatures between the NTX + U50 condition and the saline + U50 condition from 40 to 90 min (p < 0.001, paired t-test); mean BAT temperatures in NTX + U50 were not significantly different from saline control (Figure 1B). Compared to saline control, following U50 administration there was a significant increase in eye temperature, a validated proxy for core body temperature, from 50 to 90 min (p < 0.005, paired t-test) (Figure 1C).33 Pretreatment with NTX blocked the increase in eye temperature; mean eye temperatures following NTX pretreatment were significantly (p < 0.001, paired t-test) lower from 50 to 90 min compared to saline pretreatment (Figure 1B). The amplitude of U50-induced changes in eye temperature was similar to previously published results obtained using rectal temperatures; additionally, we obtained comparable values and consistent time-course trends using implanted temperature transponders (Figure 1 and S1).27 Tail vasodilation can protect against hyperthermia by promoting heat loss and is correlated with a rise in tail temperature.34,35 U50 caused a significant (p < 0.005, paired t-test) increase in mean tail temperatures at 40 to 90 min compared to saline alone, whereas NTX alone did not have significant effect on tail temperatures compared to saline (Figure 1D). Tail temperatures at 40 to 90 min were significantly higher in NTX + U50-treated mice compared to their saline-treated counterparts (p < 0.0001, paired t-test) (Figure 1D). In aggregate, thermal imaging demonstrated an increase in BAT, body, and tail temperature after administration of U50, and these effects were prevented by pretreatment with NTX.
Figure 1.

KOR activation evokes BAT thermogenesis, hyperthermia, and tail vasodilation
(A) Quantitative thermal images of BAT, eye, and tail at 0, 50, 70, and 90 min after i.p. administration of 5 mg/kg U50, 488H (U50) in wild-type mice.
(B–D) Quantified data for eye, BAT, and tail temperatures after pretreatment with saline or 10 mg/kg naltrexone hydrochloride i.p., then 30 min later 5 mg/kg U50 (n = 10).
(E) Thermal images of eye, BAT, and tail at 0, 50, 70, and 90 min in Oprk1−/− animals after administration of 5 mg/kg U50 i.p.
(F–H) Quantified thermal imaging of eye, BAT, and tail in Oprk1−/− animals. All data are presented as mean ± SEM (n = 5).
To test if the observed effects of U50 were mediated specifically through KOR, we carried out experiments using mice (Oprk1−/−) harboring a targeted disruption of Oprk1, the gene encoding KOR (Figures 1E–1H). We injected Oprk1−/− mice (n = 5; 3 males and 2 females) with U50 or saline and obtained quantitative thermal imaging videos (see image examples in Figure 1E). Analysis revealed no significant effects of U50 injection on BAT, eye, or tail temperature compared to injection of saline (Figures 1F–1H). There were no significant differences in temperatures obtained from implanted transponders (Figure 1 and S1A). These results demonstrate U50 effects on body temperatures are mediated specifically through KOR.
We examined the effects of multiple doses of U50 on body temperatures (Figures 1 and S1B–S1D). We injected wild-type mice (n = 7; 4 males and 3 females) with i.p. saline or with 2, 5, or 10 mg/kg of U50 in a pseudorandomized order with at least 24 h between doses. We obtained quantitative thermal imaging of mice for each injection, and video analysis showed that all U50 doses tested increased BAT, eye, and tail temperatures (Figures 1 and S1B). The 5 mg/kg dose evoked the largest increase in BAT temperature, and mean BAT temperatures at 35 to 65 min were significantly (p < 0.05, paired t-test) different from the 2 mg/kg dose, but not the 10 mg/kg dose (Figures 1 and S1B). The 10 mg/kg dose produced the largest increase in mean eye temperatures, with a more rapid rise than seen following the 5 mg/kg dose. Compared to the 5 mg/kg dose, the 10 mg/kg dose resulted in significantly higher mean temperatures at the 45-min mark (p = 0.007). The effect of 10 mg/kg dose was also longer lasting than 2 mg/kg dose (Figures 1 and S1C). Similar trends were observed for tail temperatures, although the elevated temperatures evoked by the 10 mg/kg dose were longer lasting than those following 2 or 5 mg/kg U50 (Figures 1 and S1D).
KOR activation in the central nervous system drives increased BAT thermogenesis
KOR is expressed in the CNS and peripheral tissues, thus we examined whether KOR activation in the central or peripheral nervous system underlies the effects of U50 on body temperatures.36 In this set of experiments, we administered (i) peripherally restricted opioid receptor antagonist naloxone methiodide (NLXM), (ii) intracerebroventricularly (i.c.v) administered selective KOR receptor antagonist norbinaltorphimine (norBNI) to block KOR in the CNS, or (iii) saline followed by systemic administration of U50 (Figure 2).37,38,39 We obtained thermal imaging from mice (n = 7; 4 males and 3 females) and all mice were examined in each condition. Analysis revealed that treatment with NLXM had a minimal effect on U50-induced changes in BAT, eye, and tail temperatures following injection of U50. In contrast, pretreatment with i.c.v. norBNI blocked elevation of BAT, eye, and tail temperatures following systemic administration of U50 (Figures 2D and 2E). Additional analysis showed that pretreatment with NLXM resulted in significantly (p < 0.05, paired t-test) lower mean BAT temperatures only at 85 to 100 min time points compared to saline. Administration of norBNI i.c.v. blocked the elevation in mean BAT temperatures with significantly (p < 0.005, paired t-test) lower values at 35 to 120 min time points. Pretreatment with NLXM blunted the increase in eye temperature slightly, with significant (p < 0.05, paired t-test) differences in mean values noted only at later time points of 70, 75, 85, and 90 min when compared to U50 (Figure 2E). Changes in tail temperature were also blocked by norBNI with significantly (p < 0.05, paired t-test) lower mean values from 35- through 100-min time points compared to saline pretreatment; in contrast, NLXM pretreatment did not significantly alter tail temperatures, except at the 80-min time point (p = 0.025). Taken together, these data indicate that KOR activation in the CNS, and not in the periphery, underlines activation of BAT and resultant hyperthermia.
Figure 2.

KOR activation in the CNS evokes increased BAT thermogenesis and tail vasodilation
(A) Illustration of the testing paradigm using intracerebroventricular injection of saline (black) or 1 nmol of norBNI (red). 10 mg/kg naloxone methiodide (blue) were given i.p. 5 mg/kg U50 was injected i.p. 30 min after pretreatment.
(B) Histological section showing guide cannula placement to align inner cannula into the lateral ventricle.
(C) Example quantitative thermal image after administration of 5 mg/kg U50.
(D–F) Quantified thermal imaging of BAT, eye, and tail temperatures following injection of saline, 1 nmol of norBNI i.v.c., or 10 mg/kg naloxone methiodide i.p., followed by 5 mg/kg U50 i.p. 30 min later. Data are presented as mean ± SEM (n = 7).
KOR activation induces a hypermetabolic state
To examine if the KOR-evoked increase in thermogenesis is accompanied by changes in metabolism, we used indirect calorimetry to quantify changes in metabolic activity. To minimize possible confounds due to suppression of locomotor activity, we performed experiments at 10 a.m., a period in the early portion of the light phase when mice show increased sleep and decreased locomotion.40 We injected mice (n = 13; 8 males and 5 females) i.p. with U50 (5 mg/kg) or saline at 10 a.m. following 3 days of habituation to home changes in a metabolic screening platform. Mice received control or U50 injections 48 h apart. Half of the mice received U50 first. Analysis of data from indirect calorimetry revealed an increase in energy use following U50 administration but not saline (Figure 3A) that had a similar duration as the elevation observed in BAT temperatures (Figure 1). Energy use returned to baseline following a similar time course as normalization of BAT temperatures, approximately 90 min (Figures 1 and S1B). Mean energy use was significantly (p < 0.005, paired t-test) elevated from 10:30 through 11:00. Data on gas exchange was collected on each animal for 1 min every 10 min as cages were sampled in series. Total physical activity, measured by infrared beam breaks in X, Y, and Z axes, showed a brief elevation around the injections but otherwise remained near the baseline level during the 2 h window following injection (Figure 3B). We also examined the respiratory exchange ratio (RER) (ratio of O2 consumed to CO2 produced), which is indicative of the relative use of lipid vs. carbohydrate energy sources.41 Values closer to 0.7 reflect preferential use of fat and values closer to 1 indicate greater use of carbohydrates.42 After saline injections, mice show normal circadian oscillation in RER.43 In contrast, RER declined slightly following U50 injection (Figure 3C), consistent with lipolysis and beta-oxidation due to elevated BAT.44 Surprisingly, mean RER values rapidly rebounded above baseline, indicating a shift to carbohydrate use. This shift in RER corresponds with the waning U50 effects on BAT thermogenesis and energy expenditure. An increase in food intake after U50 administration might explain the rise in RER. Indeed, there was an increase in food intake, reflected in cumulative food consumption following injection of U50 (Figure 3D). These data indicated that KOR activation acutely increases energy expenditure accompanied by rapid changes in RER. The increased energy expenditure is temporally concurrent with elevation in BAT temperatures and increased thermogenesis likely accounts for the elevation in energy use.
Figure 3.

Activation of KOR leads to a hypermetabolic state
Metabolic phenotyping data including gas exchange, activity, and food intake were acquired. Saline (black) or 5 mg/kg U50 (red) i.p. was administered at 10:00 a.m. on separate days.
(A) Calculated energy expenditure from 08:00 through 21:00 for wild-type mice given saline or U50 at 10:00 showing a spike in energy use approximately 90 min after U50 but not saline.
(B) Activity measured by infrared beam breaks for the same period was not increased following U50 compared to saline.
(C) Over the same time frame, RER showed normal circadian oscillation with slight downward trend immediately following U50 administration with delayed rapid rise.
(D) Cumulative food intake based on decreasing weight of food in the home cage shows increased feeding following U50 compared to saline. Data are presented as mean ± SEM (n = 13).
To examine if increased physical activity could account for the increase in energy we examined energy expenditure and physical activity during the 30 min of peak energy expenditure following U50 treatment and found that energy expenditure, but not total physical activity was significantly higher following U50 injection compared to saline (Figures S2A and S2B). We also noted that the amplitude of the increased energy expenditure following U50 was similar to the increase associated with the transition to the dark phase with greater physical activity at 1900. Analysis of data from saline injected days revealed both energy expenditure and physical activity increase at 1900 compared to 1300 (Figures S2A and S2B). We selected 1300 on saline injection days as a comparator time point because this time point was temporally sufficiently removed from the injections and levels for energy expenditure and activity were similar to time just prior to injections at 1000. Further analyses using linear regression revealed that the increased energy expenditure due to U50 was poorly correlated (R2 = 0.17) with changes in activity and that time-of-day dependent change in energy expenditure was correlated with increased physical activity (R2 = 0.42) (Figures S2C–S2F). Consistent with prior studies showing U50 suppressed locomotor behavior, we did not find an increase in physical activity following U50 and increased energy expenditure was not explained by physical activity.34,45
β3 adrenoreceptor activation is required for KOR mediated elevation in BAT thermogenesis
Activation of β3-AR on adipocytes is a key pathway for promoting BAT thermogenesis.42,46 To examine if the KOR induced increase in BAT thermogenesis was dependent on β3-AR receptor activation, we co-administered a selective β3-AR antagonist, SR59230A (10 mg/kg i.p.), with U50, and saline with U50 to mice (n = 8; 5 males and 3 females) and obtained quantitative thermal imaging (Figure 4).47,48,49 We again observed an increase in BAT, eye, and tail temperatures following U50 treatment (Figures 4B and 4C). Co-administration of SR59230A with U50 blocked the increase in mean BAT (Figure 4A) with significantly (p < 0.05, paired t-test) lower mean BAT temperatures at times 10 to 80 min in comparison to U50 alone. Minor but significant (p < 0.01, paired t-test) elevations in mean BAT temperatures were evident after co-administration of SR59230A and U50 when compared to saline alone at the 55, 60, 95, and 100-min time points (Figure 4A). Elevation of eye temperature was prevented by co-administration of SR59230A, and the mean eye temperatures were not significantly different when compared to saline alone (Figure 4B). The change in tail temperatures persisted when SR59230A and U50 were co-administered (Figure 4C). We also observed significant (p < 0.05, paired t-test) differences in mean tail temperature at 5 to 120 min when SR59230A was given alone, compared with saline (Figures 4 and S1C). In contrast, SR59230A alone has negligible effects on eye and BAT temperatures (Figures 4, S1A, and S1B). Together, these data indicate that KOR mediated activation of BAT relies on β3-AR receptor activation.
Figure 4.

Antagonism of beta-3 adrenergic receptors or genetic disruption of Ucp1 blocks KOR activation evoked BAT thermogenesis
(A–C) Analysis of quantitative thermal imaging for (A) BAT, (B) eye, and (C) tail temperatures of wild-type mice (n = 8) administered saline (black), saline with U50 5 mg/kg (red), and U50 with SR59230A 10 mg/kg (blue). Co-administration of β3-AR antagonist SR59230A with U50 dampened the increase of BAT and eye temperatures but not of tail temperatures.
(D–F) Analysis of quantitative thermal imaging for (A) BAT, (B) eye, and (C) tail temperatures of Ucp1−/− mice (n = 8) administered saline (black) and saline with U50 5 mg/kg (red). Loss of Ucp1 expression greatly attenuated increases in temperatures following U50 administration. All data are presented as mean ± SEM.
Ucp1 is required for KOR mediated elevation of BAT thermogenesis
We carried out thermal imaging experiments in mice (Ucp1−/−) harboring targeted genetic disruption of Ucp1 (Figures 4D–4F). Ucp1 is required for BAT thermogenesis.8 Ucp1−/− mice (n = 8) were injected with saline and U50. In Ucp1−/− mice, small rises in BAT, eye, and tail temperatures were evident after U50 compared to saline. These data indicate the thermogenic effect of U50 is mediated through BAT and that Ucp1 is required. These results align with data obtained using SR59230A to block β3-AR to indicate KOR activation leads to increased norepinephrine release on BAT to initiate thermogenesis through Ucp1 on mitochondria.
Increased feeding following KOR activation is driven by thermogenesis
To examine directly if the increased food intake after KOR activation is driven by the energetic demand of thermogenesis, we used FED3 systems (Figure 5A) to monitor feeding behavior with high temporal resolution and quantitative precision.50 We examined wild type and Ucp1−/− mice. Wild-type mice (n = 15; 9 males and 6 females) were injected with either U50 (5 mg/kg) or saline at 10 a.m. Equal portions of animals received saline or U50 first. Compared to saline, more pellets were taken following U50 injection, indicating increased feeding (Figures 5B and 5C). We observed a delay between U50 administration and the increase in feeding. This delay temporally corresponded to the time period when BAT temperatures (Figure 1B) and energy expenditure (Figure 3A) were elevated. Following a transient rise after U50-treatment mice removed chow pellets at a similar rate as mice did after saline injection. The increase in feeding following U50 administration resulted in significantly (p = 0.0017, paired t-test) increased pellet consumption over the course of 24 h compared with saline control. This was driven by the acute increase in feeding (Figure 5C). To examine if increased BAT thermogenesis is necessary for the increased intake in food, we co-administered U50 with SR59230A to block β3-AR-induced BAT thermogenesis (Figure 4A). Blocking β3-AR prevented BAT activation and abrogated the increase in feeding induced by U50; the mean pellet counts were nearly identical to amounts observed after saline administration (Figure 4E). SR59230A alone (n = 7) did not significantly alter feeding compared to saline (Figure S3E). These data indicate that β3-AR activation is required to drive the increased feeding evoked by KOR activation. To test directly if thermogenesis is required for the increase in feeding, we carried out similar studies in Ucp1−/− mice (n = 9; 5 males and 4 females), that mount a minimal thermogenic response to U50 injection (Figure 4A). In Ucp1−/− mice, injection of U50 did not produce an increase in feeding (Figure 5D) compared to saline treatment. Taken together, these results show that KOR activation induced feeding in mice fed ad lib is dependent on BAT thermogenesis due to activation of β3-AR.
Figure 5.

Antagonism of beta-3 adrenergic receptors or genetic disruption of Ucp1 blocks increased feeding due to KOR activation
(A) Schematic of experiential paradigm using FED3 devices to measure effects of Saline, U50, or U50 with SR59230A on food intake in wild type and Ucp1−/− mice. Sequence of saline or U50 injections was split among cohort.
(B) Cumulative food eaten in a 24 h window when wild-type mice received saline (black), U50 (red), or U50 with SR59230A (blue) injections at 10:00 a.m. Data are presented as mean ± SEM (n = 15).
(C) Focused view on the 6 h surrounding drug injection with the approximate time span the mice show elevated BAT temperatures in thermal imaging experiments denoted in orange highlighting the sequence of events with BAT activation preceding the increased feeding.
(D) Cumulative food eaten in a 24 h window when Ucp1−/− mice were injected with saline (black) and U50 (red) showing no significant change in feeding in Ucp1−/− mice due to U50.
Chronic high-fat diet reversibly disrupts KOR-regulated BAT thermogenesis
Obesity alters regulation of neurotransmission in the CNS.51 Additionally, rats fed a HFD have dysregulated KOR signaling, which impairs BAT activation by cold.29 We investigated if activation of BAT via kappa opioid signaling is altered in obese mice chronically fed HFD for 20 weeks (n = 8) or 32 weeks (n = 8). We administered U50 to C57BL/6J mice (n = 8, males) maintained on HFD for 32 weeks (9 months old) or 20 weeks (6 months old) starting at six weeks of age. HFD fed mice had a significantly higher mean weight than lean control mice (n = 8) (9 months old) (Figure 6E). Consistent with our previous experiment (Figure 1), U50 administration to lean (chow fed) mice and mice fed HFD for 20 weeks led to elevation of BAT, tail, and eye temperatures (Figures 6A–6C). In contrast, following U50 administration mean BAT temperatures in mice fed HFD for 30 weeks were significantly (p < 0.05, unpaired t-test) lower from 15 to 75 min (Figure 6A) compared to lean, and from 10 to 90 min compared to mice fed HFD for 20 weeks. Mean eye temperatures were significantly (p < 0.05) lower from 5 to 120 min (Figure 6B) in mice fed HFD for 30 weeks compared to lean mice. The eye temperatures in mice fed HFD for 20 weeks was intermediate to both other groups, perhaps reflecting a larger body mass to heat. There was no significant difference between mean tail temperatures of lean and HFD fed mice, but the time course of recovery to baseline differed (Figure 6C).
Figure 6.

High fat diet-induced obesity reversibly disrupts KOR-induced BAT thermogenesis
(A–C) Temperatures recorded with quantitative thermal imaging for BAT, eye, and tail of age-matched lean (black) (9 months old) (n = 8) and HFD fed for 32 weeks (orange) (n = 8) male mice or mice fed HFD for 20 weeks (brown) (6 months old) (n = 8) that received i.p. saline or 5 mg/kg U50. The U50-induced rises in (A) BAT and (B) eye temperatures were not evident in obese fed HFD for 32 weeks mice. However (C), elevations of tail temperatures remained similar in lean and obese mice. Data are presented as mean ± SEM (n = 8 lean and obese).
(D) Schematic of experimental paradigm for transitioning of diet-induced obese mice fed HFD for 32 weeks mice to regular chow and testing the responses to administration of 5 mg/kg U50 (n = 8).
(E) Weights of lean controls, mice fed HFD for 20 and 32 weeks at time of testing. Weights of mice after one and two weeks of normal chow.
(F) Quantified thermal imaging of BAT in diet induced mice while fed HFD and after switching to regular chow for one or two weeks. Mice received 5 mg/kg U50 i.p. (n = 8). (Data are presented as mean ± SEM, ∗∗∗∗p < 0.0001, ∗∗∗p < 0.0002, ∗p = 0.01).
We next tested if the disruption of KOR-induced thermogenesis in mice fed HFD for 32 weeks would recover when HFD was removed. Obese HFD fed mice were returned to a normal chow diet. One week after switching diets, their weight decreased significantly (mean weight difference, 4.2 ± 0.5 g, p < 0.0001, paired t-test) (Figure 6E). At this point, we treated them with a U50 (5 mg/kg i.p.) injection. Analysis of thermal imaging revealed that the mean temperatures of BAT were significantly (p < 0.01, paired t-test) different than results obtained maintained on HFD (Figure 6F). Analysis revealed that the mean temperatures of BAT were significantly (p < 0.05, paired t-test) higher than results obtained when fed HFD. We maintained mice on chow diet for an additional week. At the end of this second week, their weight was modestly but significantly reduced compared to one week on chow (mean weight loss, 1.3 ± 0.4 g, p = 0.01, paired t-test) (Figure 6E). There were no significant differences in BAT thermogenesis after U50 following two weeks on chow compared to one week. These data suggest that chronic HFD induced obesity suppresses KOR activation evoked thermogenesis in a reversible manner.
Discussion
We found KOR activation in the CNS evokes BAT thermogenesis leading to hyperthermia and elevated energy expenditure (Figures 1, 2, and 3). Also, we found KOR activation of BAT thermogenesis was blunted by chronic HFD but improved with removal of HFD. Results showing centrally administered (norBNI) but not peripherally restricted (NLMX) opioid receptor antagonists block the U50 evoked thermogenesis and demonstrate that activation of the kappa opioid system within the CNS promotes BAT thermogenesis. The small effects of NLXM on U50-induced changes in body temperatures (Figure 2) may be due to delayed entrance of the drug or metabolites into the CNS, as has been reported for methylnaltrexone.38 Because NLMX is an antagonist of multiple opioid receptor types, we cannot exclude a partial dependence on peripheral opioid receptors in mediating effects. The increase in thermogenesis due to KOR activation was dependent on β3-AR (Figure 4), indicating KOR activation leads to release of norepinephrine on BAT. Increased thermogenesis likely accounts for the increased energy expenditure following U50 (Figure 3) because the increased energy expenditure followed a similar temporal course as the elevation in BAT temperature. Further, we found no increase in physical activity after U50 (Figure S2) to explain elevation of energy expenditure. U50 administration also increased feeding, but blocking elevation of BAT thermogenesis prevented the increase in feeding (Figure 5). Our interpretation of these findings is that increased feeding following U50 is driven secondarily by increased energy expended through thermogenesis. These findings indicate that increased energy use is potentially integrated on a timescale of minutes to promote enhanced energy intake. By extension, these findings suggest that promoting weight loss by increasing BAT activity could be confounded by increased hunger and feeding drive.52,53 The apparent indirect effect of KOR activation on feeding is in contrast to results showing mu opiate receptors enhance feeding by acting on neuronal projections from the dorsal raphe in the nucleus accumbens.15 Our studies here do not address how KOR signaling can alter consumption of palatable foods or feeding in calorically deprived states.54,55,56
KOR activation led to rapid increases of tail temperatures, potentially representing compensatory response to promote heat loss. Alternatively, KOR activation lowers blood pressure, and the changes in tail temperature may reflect an alteration of the sympathetic nervous system regulation of blood pressure.57,58 These competing effects (thermogenesis vs. heat loss) may account for the paradoxical decrease in body temperature observed in prior studies when high doses of KOR agonist were administered.27,59,60,61,62 Our data in KOR−/− mice demonstrate that both elevated BAT activity and tail temperatures are mediated specifically through KOR (Figures 1E–1H). Data from Ucp1−/− mice show minimal changes of tail temperatures following U50 injection (Figure 4F). Ucp1−/− mice have intact KOR signaling, but impaired thermogenic activity. Thus, the lack of increase in tail temperatures in Ucp1−/− mice indicates tail vasodilation after U50 is secondary to the thermogenic effects. The rise in tail temperature is seen when β3-AR antagonist is given alone (Figure S3C) likely represents known off target block of alpha-1 adrenergic receptors, which drive vasoconstriction.63
In sum, we report KOR activation in the CNS leads to an increase in BAT thermogenesis and, in the ad-lib fed state, KOR-induced feeding is dependent on elevating BAT thermogenesis. These findings add to evidence that the kappa opioid system can regulate metabolism and energy balance.
Limitations of the study
Several questions raised remain unanswered by the results from this study. The target(s) neural circuits altered by KOR activity to drive thermogenesis remain to be identified. One possible site is the lateral hypothalamus (LH). LH has been implicated in thermal regulation, and blockade of KOR in LH can prevent increased feeding.64,65 Another possibility is the preoptic area of the hypothalamus. KOR signaling in the POA is important for regulating BAT activation and is perturbed in diet-induced obese rats.29 However, activating KOR by dialyzing dynorphin into the POA mildly lowers body temperature and may not be responsible for the net effects.66 KOR signaling may have differential effects on body temperature and energy use dependent on brain site and context. Context-dependent changes in circuit function might explain why we report a hyperthermic effect of KOR activation in ad libitum-fed mice, while others found that KOR antagonism prevented hypothermia in the context of caloric restriction.67 A second question that remains open is whether chronic HFD directly disrupts kappa opioid system function or causes dysfunction of BAT thermogenesis.68 Delineating the potential causal role for KOR signaling in disruption of BAT activation is challenging because HFD can alter both KOR signaling and thermogenesis, thereby limiting our ability to separate the two effects without greater understanding of the underlying mechanisms and neural circuits.29 In the studies here, we show that blockade of β3-AR or disruption of UPC1 prevents increased BAT temperatures, but we do not examine cellular mechanisms occurring in BAT due to HFD or KOR activation. We also do not examine potential changes in white adipose tissue in response to activation of KOR.
STAR★Methods
Key resources table
| REAGENT or RESOURCE | SOURCE | IDENTIFIER |
|---|---|---|
| Chemicals, peptides, and recombinant proteins | ||
| Naloxone methiodide (NLXM) | Sigma-Aldrich | Cat# N129 |
| Naltrexone hydrochloride | Sigma-Aldrich | Cat# N3136 |
| Norbinaltorphimine (norBNI) | Sigma-Aldrich | Cat# N1771 |
| SR59230A hydrochloride | hydrochloride | Cat# 1511 |
| U50,488H (U50) | Sigma-Aldrich | Cat# U111 |
| Experimental models: Organisms/strains | ||
| Mouse: C57BL/6BJ | The Jackson Laboratory | RRID:IMSR_JAX:000664 |
| Mouse: C57BL/6J DIO | The Jackson Laboratory | RRID:IMSR_JAX:380050 |
| Mouse: Oprk1tm1.1(cre)Sros/J | Gift from Sarah Ross, Pitt | RRID:IMSR_JAX:035045 |
| Mouse: B6.129S2-Oprk1tm1Kff/J | Gift from Sarah Ross, Pitt | RRID:IMSR_JAX:007558 |
| Mouse: B6.129-Ucp1tm1Kz/J | Gift from Jonathan Brestoff, WashU | RRID:IMSR_JAX:003124 |
| Software and algorithms | ||
| ResearchIR | Teledyne FLIR Systems Inc | N/A |
| FLIR E53 thermal imaging cameras | Teledyne FLIR Systems Inc | Cat# FLIR E53 24° |
| Leica Application Suite Advanced Fluorescence | Leica Microsystems | N/A |
| Wireless IPTT-300 temperature transponders | Bio Medic Data Systems | N/A |
| Phenomaster system | LabMaster System; TSE Systems | N/A |
| FED3 device | Open Ephys | N/A |
| GraphPad Prism | GraphPad Software | Version 9.3.1 |
| Other | ||
| High fat diet (HFD) (60 kcal% fat) | Research Diets, Inc | Cat# D12492 |
| Guide Cannula | P1 Technologies | N/A |
Resource availability
Lead contact
Further information and requests for resources should be directed to the lead contact Aaron Norris (Norrisa@wustl.edu).
Materials availability
This study did not generate new unique reagents.
Experimental model and study participant details
Mice
All procedures were approved by the Animal Care and Use Committee of Washington University and adhered to NIH guidelines. All animals were maintained, handled, and processed in accordance with the policies of the Institutional Animal Care and Use Committee (IACUC) at Washington University. Mice were bred at Washington University or obtained from the Jackson Laboratory (Bar Harbor, ME). Male and female C57BL/6BJ or Oprk1−/− mice (20–35 g) older than eight weeks of age were used for experiments. Animals were group-housed at a maximum of five per cage, had ad libitum access to food and water, and were maintained on a 12:12 h light:dark cycle (lights on at 6:00 a.m.). Oprk1−/− mice harboring the coding sequence for Cre recombinase in the coding region of in exon 2 in Oprk1, thereby expression of functional KOR, were a gift from Dr. Sara Ross (University of Pittsburgh).69 Ucp1−/− mice were a gift from Dr. Jonathan Brestoff’s lab.
For food intake experiments, male diet-induced obese (50–55 g) or control (30–35 g) C57BL/6J mice were acquired from the Jackson Laboratory at 22 weeks of age. Obese animals were maintained on HFD chow D12492 (60 kcal% fat) (Research Diets, Inc; New Brunswick, NJ), and their age-matched controls were maintained on standard mouse chow. These mice represented mice maintained on HFD for 32 weeks. Mice maintained on HFD for 20 weeks were likewise obtained from Jackson Laboratory prior to testing and maintained on HFD until testing. Female diet-induced obese mice were not available from the Jackson Laboratory.
Method details
Surgeries
Wireless IPTT-300 temperature transponders (Bio Medic Data Systems; Seaford, DE) and cannula for intraventricular drug administration were implanted in mice anesthetized with 2% isoflurane and maintained in oxygen. The transponder was inserted subdermally rostral to the right hindleg.34 For implantation of guide cannulas, animals were anesthetized on a stereotaxic frame (adapted from DeVos and Miller 201370), and under sterile conditions a small incision was performed to expose the skull. Next, a 5-mm bit was used to drill a hole into the skull where a single guide cannula (P1 Technologies; Roanoke, VA) was placed in the lateral ventricle at stereotaxic coordinates M/L 0.8, A/P −0.22, D/V −1.7. Then, a head cap was built around the guide cannula for keeping it in place, using dental cement. Subsequently, a cannula dummy was screwed onto the guide cannula for protection of obstruction and 5 mg/kg carprofen was administered i.p. post-operatively. Mice were given a minimum of 7 days to recover from the procedure before starting experiments.
Pharmacology
U50,488H (U50) (Sigma U111; MilliporeSigma, Saint Louis, MO), naltrexone hydrochloride (NTX) (Sigma N3136), norbinaltorphimine (norBNI) (Sigma N1771), naloxone methiodide (NLXM) (Sigma N129), and SR59230A0A hydrochloride (Bio-Techne 1511; Minneapolis, MN) were dissolved in 0.9% saline. Prior thermal imaging experiments, animals were habituated in a clear behavior chamber on a platform.34 After habituation, animals were injected intraperitoneally (i.p.) with vehicle or antagonist, and 30 min later, vehicle or U50 (2, 5, or 10 mg/kg) was injected i.p. For experiments using intracerebroventricular administration of compounds, animals were similarly habituated. The cannula dummy was unscrewed from the guide cannula and the internal injector cannula was placed inside the guide cannula and screwed on securely. Over the course of 5 min, 5 μL of vehicle or 1 nmol norBNI were infused into the ventricle; after 30 min, 5 mg/kg U50 were administered i.p. NLXM was selected as a peripheral restricted antagonists due to reports that in mice methylnaltrexone is rapidly metabolized to naloxone and crosses the blood brain barrier.71
Quantitative thermal imaging and body temperature measurements
To measure body temperatures, we used FLIR E53 thermal imaging cameras and IPTT-300 temperature transponders. Quantitative thermal image videos were recorded and subsequently analyzed. Briefly, at 5-min intervals, regions of interest containing BAT, eye, or a point at approximately 1 cm from the base of the tail were identified in the highest temperature. For wireless temperature transponders, a DAS-8027 reader (Bio Medic Data Systems Seaford, DE) was held in close proximity under the behavioral arena and temperature from the implanted transponder was recorded.
Metabolic phenotyping
Metabolic phenotyping including indirect calorimetry, activity monitoring, and food consumption was carried out using a Phenomaster system (LabMaster System; TSE Systems, Bad Homburg, Germany).72 Briefly, animals were singly housed in metabolic cages in the Phenomaster with ad libitum access to food and water. Food intake was measured by subtracting the weight of uneaten food from the initial food weight. Gases were sampled from each cage for 1 min every 10 min with a flow rate of 27 L/h. Metabolic rate was measured using oxygen consumption (mL/h) and carbon dioxide production (mL/h) which was calculated via comparison of the air from the reference cage that had no animal in it. The RER was calculated by dividing CO2 production (VCO2) by O2 consumption (VO2). Energy expenditure was converted from the metabolic rate using constants CVO2 = 3.941 and CVCO2 = 1.106 and the equation EE = (CVO2 ∗ VO2 + CVCO2 ∗ VCO2)/1000.73 Physical activity was obtained by quantification of beam breaks. Activity was sampled at 100 Hz and reported in 10-min summed bins which were consolidated to 30-min bins. z axis as well X and Y axes movements were captured and quantified. Physical activity is reported as total beam breaks for all three axes by the animals in the cage. Animals were habituated for 3 days to Phenomaster housing; on day 4 and day 5, at 10:00 a.m., animals were injected with either saline or 5 mg/kg U50 and the metabolic rate was acquired.
Quantification of feeding using FED3 devices in the home cage
We used FED3 devices to monitor feeding of singly housed mice.50 The FED3 devices were programmed to dispense one 20-mg standard chow pellet at a time, and automatically replaced the pellet after it was taken. Timestamps for each dispensed pellet were recorded. FED3 offered greater precision than the metabolic phenotyping home cages. The FED3 was the only source of food in the cage. Mice were given 3 days to habituate to FED3 feeding prior to experiments. Stable feeding was required before experiments. Mice and functioning of the FEDs were checked daily.
Quantification and statistical analysis
Statistical analysis was carried out using Prism software (GraphPad; San Diego, CA). For comparisons between two sets of time-course data, different Student’s t tests were used. For experiments where the same mice were tested in multiple conditions a paired test was applied, and when different mice were compared an unpaired test was used. For time-course thermal data p values were not corrected for multiple comparisons across time. For comparisons of three or more groups, a one-way ANOVA was used. A repeated measures ANOVA was used for experiments where the same subject was used across multiple conditions. All data are reported as mean ± SEM.
Acknowledgments
This work was supported by the NIH through 5K08MH119538 to AJN. The work was also supported by P30 DK020579 to the Diabetes Research Core at Washington University. We thank Dr. Jonathan Brestoff lab and Roquibat Giwa for providing the Ucp1−/− mice. Graphical abstract illustration by Jessica Tung and Catie Newsom-Stuart in association with InPrint at Washington University in St. Louis.
Author contributions
A.L.C.: project development, experimental design, animal care, project conception and development, data collection, data archiving, data analysis, manuscript writing. K.K.W.: data collection, data archiving, data analysis. A.V.K.: project conception and development, project development, experimental design. A.J.N.: project development, experimental design, project conception and development, data collection, data archiving, data analysis, manuscript writing, funding acquisition, and supervision.
Declaration of interests
The authors declare no competing interests.
Inclusion and diversity
We worked to ensure sex balance in the selection of non-human subjects. One or more of the authors of this paper self-identifies as an underrepresented ethnic minority in their field of research or within their geographical location.
Published: June 28, 2023
Footnotes
Supplemental information can be found online at https://doi.org/10.1016/j.isci.2023.107241.
Supplemental information
Data and code availability
-
•
All data reported in this paper will be shared by the lead contact upon request.
-
•
This paper does not report original code.
-
•
Any additional information required to reanalyze the data reported in this paper is available from the lead contact upon request.
References
- 1.Acosta F.M., Martinez-Tellez B., Sanchez-Delgado G., Alcantara J.M., Acosta-Manzano P., Morales-Artacho A.J., Ruiz J.R. Physiological responses to acute cold exposure in young lean men. PLoS One. 2018;13:e0196543. doi: 10.1371/journal.pone.0196543. [DOI] [PMC free article] [PubMed] [Google Scholar]
- 2.Vallerand A.L., Jacobs I. Rates of energy substrates utilization during human cold exposure. Eur. J. Appl. Physiol. Occup. Physiol. 1989;58:873–878. doi: 10.1007/bf02332221. [DOI] [PubMed] [Google Scholar]
- 3.Abreu-Vieira G., Xiao C., Gavrilova O., Reitman M.L. Integration of body temperature into the analysis of energy expenditure in the mouse. Mol. Metabol. 2015;4:461–470. doi: 10.1016/j.molmet.2015.03.001. [DOI] [PMC free article] [PubMed] [Google Scholar]
- 4.Chouchani E.T., Kazak L., Spiegelman B.M. New advances in adaptive thermogenesis: UCP1 and beyond. Cell Metabol. 2019;29:27–37. doi: 10.1016/j.cmet.2018.11.002. [DOI] [PubMed] [Google Scholar]
- 5.Virtanen K.A., Lidell M.E., Orava J., Heglind M., Westergren R., Niemi T., Taittonen M., Laine J., Savisto N.-J., Enerbäck S. Functional brown adipose tissue in healthy adults. N. Engl. J. Med. 2009;360:1518–1525. doi: 10.1056/NEJMoa0808949. [DOI] [PubMed] [Google Scholar]
- 6.Hamann A., Flier J.S., Lowell B.B. Decreased brown fat markedly enhances susceptibility to diet-induced obesity, diabetes, and hyperlipidemia. Endocrinology. 1996;137:21–29. doi: 10.1210/endo.137.1.8536614. [DOI] [PubMed] [Google Scholar]
- 7.Cypess A.M., Lehman S., Williams G., Tal I., Rodman D., Goldfine A.B., Kuo F.C., Palmer E.L., Tseng Y.-H., Doria A., et al. Identification and importance of brown adipose tissue in adult humans. N. Engl. J. Med. 2009;360:1509–1517. doi: 10.1056/NEJMoa0810780. [DOI] [PMC free article] [PubMed] [Google Scholar]
- 8.Matthias A., Ohlson K.B., Fredriksson J.M., Jacobsson A., Nedergaard J., Cannon B. Thermogenic responses in brown fat cells are fully UCP1-dependent: UCP2 or UCP3 do not substitute for UCP1 in adrenergically or fatty acid-induced thermogenesis. J. Biol. Chem. 2000;275:25073–25081. doi: 10.1074/jbc.M000547200. [DOI] [PubMed] [Google Scholar]
- 9.Morrison S.F., Madden C.J. Central nervous system regulation of brown adipose tissue. Compr. Physiol. 2014;4:1677–1713. doi: 10.1002/cphy.c140013. [DOI] [PMC free article] [PubMed] [Google Scholar]
- 10.Deem J.D., Faber C.L., Pedersen C., Phan B.A., Larsen S.A., Ogimoto K., Nelson J.T., Damian V., Tran M.A., Palmiter R.D., et al. Cold-induced hyperphagia requires AgRP neuron activation in mice. Elife. 2020;9:e58764. doi: 10.7554/eLife.58764. [DOI] [PMC free article] [PubMed] [Google Scholar]
- 11.Ravussin Y., Xiao C., Gavrilova O., Reitman M.L. Effect of intermittent cold exposure on brown fat activation, obesity, and energy homeostasis in mice. PLoS One. 2014;9:e85876. doi: 10.1371/journal.pone.0085876. [DOI] [PMC free article] [PubMed] [Google Scholar]
- 12.Chen X., McClatchy D.B., Geller E.B., Tallarida R.J., Adler M.W. The dynamic relationship between mu and kappa opioid receptors in body temperature regulation. Life Sci. 2005;78:329–333. doi: 10.1016/j.lfs.2005.04.084. [DOI] [PubMed] [Google Scholar]
- 13.Ikeda T., Kurz A., Sessler D.I., Go J., Kurz M., Belani K., Larson M., Bjorksten A.R., Dechert M., Christensen R. The effect of opioids on thermoregulatory responses in humans and the special antishivering action of meperidine. Ann. N. Y. Acad. Sci. 1997;813:792–798. doi: 10.1111/j.1749-6632.1997.tb51783.x. [DOI] [PubMed] [Google Scholar]
- 14.Spencer R.L., Hruby V.J., Burks T.F. Alteration of thermoregulatory set point with opioid agonists. J. Pharmacol. Exp. Therapeut. 1990;252:696–705. [PubMed] [Google Scholar]
- 15.Castro D.C., Oswell C.S., Zhang E.T., Pedersen C.E., Piantadosi S.C., Rossi M.A., Hunker A.C., Guglin A., Morón J.A., Zweifel L.S., et al. An endogenous opioid circuit determines state-dependent reward consumption. Nature. 2021;598:646–651. doi: 10.1038/s41586-021-04013-0. [DOI] [PMC free article] [PubMed] [Google Scholar]
- 16.Castro D.C., Berridge K.C. Opioid hedonic hotspot in nucleus accumbens shell: mu, delta, and kappa maps for enhancement of sweetness “liking” and “wanting”. J. Neurosci. 2014;34:4239–4250. doi: 10.1523/JNEUROSCI.4458-13.2014. [DOI] [PMC free article] [PubMed] [Google Scholar]
- 17.Morley J.E., Levine A.S. Involvement of dynorphin and the kappa opioid receptor in feeding. Peptides. 1983;4:797–800. doi: 10.1016/0196-9781(83)90069-4. [DOI] [PubMed] [Google Scholar]
- 18.Czyzyk T.A., Nogueiras R., Lockwood J.F., McKinzie J.H., Coskun T., Pintar J.E., Hammond C., Tschöp M.H., Statnick M.A. κ-Opioid receptors control the metabolic response to a high-energy diet in mice. FASEB J. 2010;24:1151–1159. doi: 10.1096/fj.09-143610. [DOI] [PMC free article] [PubMed] [Google Scholar]
- 19.Bruchas M.R., Chavkin C. Kinase cascades and ligand-directed signaling at the kappa opioid receptor. Psychopharmacology (Berl) 2010;210:137–147. doi: 10.1007/s00213-010-1806-y. [DOI] [PMC free article] [PubMed] [Google Scholar]
- 20.Seoane-Collazo P., Liñares-Pose L., Rial-Pensado E., Romero-Picó A., Moreno-Navarrete J.M., Martínez-Sánchez N., Garrido-Gil P., Iglesias-Rey R., Morgan D.A., Tomasini N.J.N.c. Central nicotine induces browning through hypothalamic κ opioid receptor. Nat. Commun. 2019;10:1–12. doi: 10.1038/s41467-019-12004-z. [DOI] [PMC free article] [PubMed] [Google Scholar]
- 21.Imbernon M., Sanchez-Rebordelo E., Romero-Picó A., Kalló I., Chee M.J., Porteiro B., Al-Massadi O., Contreras C., Fernø J., Senra A., et al. Hypothalamic kappa opioid receptor mediates both diet-induced and melanin concentrating hormone–induced liver damage through inflammation and endoplasmic reticulum stress. Hepatology. 2016;64:1086–1104. doi: 10.1002/hep.28716. [DOI] [PMC free article] [PubMed] [Google Scholar]
- 22.Cintron-Colon R., Johnson C.W., Montenegro-Burke J.R., Guijas C., Faulhaber L., Sanchez-Alavez M., Aguirre C.A., Shankar K., Singh M., Galmozzi A., et al. Activation of kappa opioid receptor regulates the hypothermic response to calorie restriction and limits body weight loss. Curr. Biol. 2019;29:4291–4299.e4. doi: 10.1016/j.cub.2019.10.027. [DOI] [PMC free article] [PubMed] [Google Scholar]
- 23.Adler M.W., Geller E.B., Rosow C.E., Cochin J., toxicology The opioid system and temperature regulation. Annu. Rev. Pharmacol. Toxicol. 1988;28:429–449. doi: 10.1146/annurev.pa.28.040188.002241. [DOI] [PubMed] [Google Scholar]
- 24.Handler C.M., Geller E.B., Adler M.W., Behavior Effect of μ-κ-and δ-selective opioid agonists on thermoregulation in the rat. Pharmacol. Biochem. Behav. 1992;43:1209–1216. doi: 10.1016/0091-3057(92)90504-9. [DOI] [PubMed] [Google Scholar]
- 25.Czyzyk T.A., Nogueiras R., Lockwood J.F., McKinzie J.H., Coskun T., Pintar J.E., Hammond C., Tschöp M.H., Statnick M.A. kappa-Opioid receptors control the metabolic response to a high-energy diet in mice. FASEB J. 2010;24:1151–1159. doi: 10.1096/fj.09-143610. [DOI] [PMC free article] [PubMed] [Google Scholar]
- 26.Mandenoff A., Seyrig J.A., Betoulle D., Brigant L., Melchior J.C., Apfelbaum M., Behavior A kappa opiate agonist, U50, 488H, enhances energy expenditure in rats. Pharmacol. Biochem. Behav. 1991;39:215–217. doi: 10.1016/0091-3057(91)90425-2. [DOI] [PubMed] [Google Scholar]
- 27.Baker A.K., Meert T.F. Functional effects of systemically administered agonists and antagonists of mu, delta, and kappa opioid receptor subtypes on body temperature in mice. J. Pharmacol. Exp. Therapeut. 2002;302:1253–1264. doi: 10.1124/jpet.102.037655. [DOI] [PubMed] [Google Scholar]
- 28.Mandenoff A., Seyrig J.A., Betoulle D., Brigant L., Melchior J.C., Apfelbaum M. A kappa opiate agonist, U50,488H, enhances energy expenditure in rats. Pharmacol. Biochem. Behav. 1991;39:215–217. doi: 10.1016/0091-3057(91)90425-2. [DOI] [PubMed] [Google Scholar]
- 29.Conceição E.P.S., Reynolds C.A., Morrison S.F., Madden C.J. Activation of transient receptor potential Vanilloid 1 channels in the nucleus of the solitary tract and activation of dynorphin input to the median preoptic nucleus contribute to impaired BAT thermogenesis in diet-induced obesity. eNeuro. 2021;8 doi: 10.1523/ENEURO.0048-21.2021. [DOI] [PMC free article] [PubMed] [Google Scholar]
- 30.Handler C.M., Piliero T.C., Geller E.B., Adler M.W., Therapeutics E. Effect of ambient temperature on the ability of mu-kappa-and delta-selective opioid agonists to modulate thermoregulatory mechanisms in the rat. J. Pharmacol. Exp. Therapeut. 1994;268:847–855. [PubMed] [Google Scholar]
- 31.Spencer R.L., Hruby V.J., Burks T.F., Therapeutics E. Body temperature response profiles for selective mu, delta and kappa opioid agonists in restrained and unrestrained rats. J. Pharmacol. Exp. Therapeut. 1988;246:92–101. [PubMed] [Google Scholar]
- 32.Chen X., McClatchy D.B., Geller E.B., Tallarida R.J., Adler M.W. The dynamic relationship between mu and kappa opioid receptors in body temperature regulation. Life Sci. 2005;78:329–333. doi: 10.1016/j.lfs.2005.04.084. [DOI] [PubMed] [Google Scholar]
- 33.Vogel B., Wagner H., Gmoser J., Wörner A., Löschberger A., Peters L., Frey A., Hofmann U., Frantz S. Touch-free measurement of body temperature using close-up thermography of the ocular surface. MethodsX. 2016;3:407–416. doi: 10.1016/j.mex.2016.05.002. [DOI] [PMC free article] [PubMed] [Google Scholar]
- 34.Norris A.J., Shaker J.R., Cone A.L., Ndiokho I.B., Bruchas M.R. Parabrachial opioidergic projections to preoptic hypothalamus mediate behavioral and physiological thermal defenses. Elife. 2021;10:e60779. doi: 10.7554/eLife.60779. [DOI] [PMC free article] [PubMed] [Google Scholar]
- 35.Tan C.L., Knight Z.A. Regulation of body temperature by the nervous system. Neuron. 2018;98:31–48. doi: 10.1016/j.neuron.2018.02.022. [DOI] [PMC free article] [PubMed] [Google Scholar]
- 36.Vanderah T.W. Delta and kappa opioid receptors as suitable drug targets for pain. Clin. J. Pain. 2010;26(Suppl 10):S10–S15. doi: 10.1097/AJP.0b013e3181c49e3a. [DOI] [PubMed] [Google Scholar]
- 37.Katafuchi T., Hattori Y., Nagatomo I., Koizumi K. Kappa-opioid antagonist strongly attenuates drinking of genetically polydipsic mice. Brain Res. 1991;546:1–7. doi: 10.1016/0006-8993(91)91152-q. [DOI] [PubMed] [Google Scholar]
- 38.Walentiny D.M., Komla E., Moisa L.T., Mustafa M.A., Poklis J.L., Akbarali H.I., Beardsley P.M. Methylnaltrexone crosses the blood-brain barrier and attenuates centrally-mediated behavioral effects of morphine and oxycodone in mice. Neuropharmacology. 2021;185:108437. doi: 10.1016/j.neuropharm.2020.108437. [DOI] [PMC free article] [PubMed] [Google Scholar]
- 39.Patkar K.A., Wu J., Ganno M.L., Singh H.D., Ross N.C., Rasakham K., Toll L., McLaughlin J.P. Physical presence of nor-binaltorphimine in mouse brain over 21 days after a single administration corresponds to its long-lasting antagonistic effect on kappa-opioid receptors. J. Pharmacol. Exp. Therapeut. 2013;346:545–554. doi: 10.1124/jpet.113.206086. [DOI] [PubMed] [Google Scholar]
- 40.Wang C., Guerriero L.E., Huffman D.M., Ajwad A.A., Brooks T.C., Sunderam S., Seifert A.W., O'Hara B.F. A comparative study of sleep and diurnal patterns in house mouse (Mus musculus) and Spiny mouse (Acomys cahirinus) Sci. Rep. 2020;10:10944. doi: 10.1038/s41598-020-67859-w. [DOI] [PMC free article] [PubMed] [Google Scholar]
- 41.Ferrannini E. The theoretical bases of indirect calorimetry: a review. Metabolism. 1988;37:287–301. doi: 10.1016/0026-0495(88)90110-2. [DOI] [PubMed] [Google Scholar]
- 42.Virtue S., Vidal-Puig A. Assessment of brown adipose tissue function. Front. Physiol. 2013;4:128. doi: 10.3389/fphys.2013.00128. [DOI] [PMC free article] [PubMed] [Google Scholar]
- 43.Yamazaki T., Ikaga R., Li D., Nakae S., Tanaka S. A novel method for measuring diet-induced thermogenesis in mice. MethodsX. 2019;6:1950–1956. doi: 10.1016/j.mex.2019.08.016. [DOI] [PMC free article] [PubMed] [Google Scholar]
- 44.Townsend K.L., Tseng Y.H. Brown fat fuel utilization and thermogenesis. Trends Endocrinol. Metabol. 2014;25:168–177. doi: 10.1016/j.tem.2013.12.004. [DOI] [PMC free article] [PubMed] [Google Scholar]
- 45.Paris J.J., Reilley K.J., McLaughlin J.P. Kappa opioid receptor-mediated disruption of novel object recognition: relevance for psychostimulant treatment. J. Addiction Res. Ther. 2011;S4:007. doi: 10.4172/2155-6105.S4-007. [DOI] [PMC free article] [PubMed] [Google Scholar]
- 46.Inokuma K.i., Ogura-Okamatsu Y., Toda C., Kimura K., Yamashita H., Saito M. Uncoupling protein 1 is necessary for norepinephrine-induced glucose utilization in brown adipose tissue. Diabetes. 2005;54:1385–1391. doi: 10.2337/diabetes.54.5.1385. [DOI] [PubMed] [Google Scholar]
- 47.Manara L., Badone D., Baroni M., Boccardi G., Cecchi R., Croci T., Giudice A., Guzzi U., Landi M., Le Fur G. Functional identification of rat atypical beta-adrenoceptors by the first beta 3-selective antagonists, aryloxypropanolaminotetralins. Br. J. Pharmacol. 1996;117:435–442. doi: 10.1111/j.1476-5381.1996.tb15209.x. [DOI] [PMC free article] [PubMed] [Google Scholar]
- 48.Nisoli E., Tonello C., Landi M., Carruba M.O. Functional studies of the first selective beta 3-adrenergic receptor antagonist SR 59230A in rat brown adipocytes. Mol. Pharmacol. 1996;49:7–14. [PubMed] [Google Scholar]
- 49.Candelore M.R., Deng L., Tota L., Guan X.M., Amend A., Liu Y., Newbold R., Cascieri M.A., Weber A.E. Potent and selective human beta(3)-adrenergic receptor antagonists. J. Pharmacol. Exp. Therapeut. 1999;290:649–655. [PubMed] [Google Scholar]
- 50.Matikainen-Ankney B.A., Earnest T., Ali M., Casey E., Wang J.G., Sutton A.K., Legaria A.A., Barclay K.M., Murdaugh L.B., Norris M.R., et al. An open-source device for measuring food intake and operant behavior in rodent home-cages. Elife. 2021;10:e66173. doi: 10.7554/eLife.66173. [DOI] [PMC free article] [PubMed] [Google Scholar]
- 51.Caron A., Jane Michael N. New horizons: is obesity a disorder of neurotransmission? J. Clin. Endocrinol. Metab. 2021;106:e4872–e4886. doi: 10.1210/clinem/dgab421. [DOI] [PubMed] [Google Scholar]
- 52.Balazova L., Wolfrum C., Balaz M., Metabolism Weight loss and adipose tissue browning in humans: the chicken or the egg? Trends Endocrinol. Metabol. 2018;29:450–452. doi: 10.1016/j.tem.2018.03.004. [DOI] [PubMed] [Google Scholar]
- 53.Christoffersen B.Ø., Sanchez-Delgado G., John L.M., Ryan D.H., Raun K., Ravussin E. Beyond appetite regulation: Targeting energy expenditure, fat oxidation, and lean mass preservation for sustainable weight loss. Obesity (Silver Spring) 2022;30:841–857. doi: 10.1002/oby.23374. [DOI] [PMC free article] [PubMed] [Google Scholar]
- 54.Mattar P., Uribe-Cerda S., Pezoa C., Guarnieri T., Kotz C.M., Teske J.A., Morselli E., Perez-Leighton C. Brain site-specific regulation of hedonic intake by orexin and DYN peptides: role of the PVN and obesity. Nutr. Neurosci. 2022;25:1105–1114. doi: 10.1080/1028415X.2020.1840049. [DOI] [PubMed] [Google Scholar]
- 55.Bodnar R.J., Glass M.J., Ragnauth A., Cooper M.L. General, mu and kappa opioid antagonists in the nucleus accumbens alter food intake under deprivation, glucoprivic and palatable conditions. Brain Res. 1995;700:205–212. doi: 10.1016/0006-8993(95)00957-r. [DOI] [PubMed] [Google Scholar]
- 56.Sipols A.J., Bayer J., Bennett R., Figlewicz D.P. Intraventricular insulin decreases kappa opioid-mediated sucrose intake in rats. Peptides. 2002;23:2181–2187. doi: 10.1016/S0196-9781(02)00246-2. [DOI] [PubMed] [Google Scholar]
- 57.Rao S.P., Conley A., Dunbar J.C. Cardiovascular responses to central administration of mu and kappa opioid receptor agonist and antagonist in normal rats. Peptides. 2003;24:745–754. doi: 10.1016/s0196-9781(03)00122-0. [DOI] [PubMed] [Google Scholar]
- 58.Hall E.D., Wolf D.L., McCall R.B. Cardiovascular depressant effects of the kappa opioid receptor agonists U50488H and spiradoline mesylate. Circ. Shock. 1988;26:409–417. [PubMed] [Google Scholar]
- 59.Brust T.F., Morgenweck J., Kim S.A., Rose J.H., Locke J.L., Schmid C.L., Zhou L., Stahl E.L., Cameron M.D., Scarry S.M., et al. Biased agonists of the kappa opioid receptor suppress pain and itch without causing sedation or dysphoria. Sci. Signal. 2016;9:ra117. doi: 10.1126/scisignal.aai8441. [DOI] [PMC free article] [PubMed] [Google Scholar]
- 60.McLaughlin J.P., Land B.B., Li S., Pintar J.E., Chavkin C. Prior activation of kappa opioid receptors by U50,488 mimics repeated forced swim stress to potentiate cocaine place preference conditioning. Neuropsychopharmacology. 2006;31:787–794. doi: 10.1038/sj.npp.1300860. [DOI] [PMC free article] [PubMed] [Google Scholar]
- 61.Resendez S.L., Kuhnmuench M., Krzywosinski T., Aragona B.J. kappa-Opioid receptors within the nucleus accumbens shell mediate pair bond maintenance. J. Neurosci. 2012;32:6771–6784. doi: 10.1523/JNEUROSCI.5779-11.2012. [DOI] [PMC free article] [PubMed] [Google Scholar]
- 62.Wang Y., Chen Y., Xu W., Lee D.Y.W., Ma Z., Rawls S.M., Cowan A., Liu-Chen L.Y. 2-Methoxymethyl-salvinorin B is a potent kappa opioid receptor agonist with longer lasting action in vivo than salvinorin A. J. Pharmacol. Exp. Therapeut. 2008;324:1073–1083. doi: 10.1124/jpet.107.132142. [DOI] [PMC free article] [PubMed] [Google Scholar]
- 63.Bexis S., Docherty J.R. Role of alpha 1- and beta 3-adrenoceptors in the modulation by SR59230A of the effects of MDMA on body temperature in the mouse. Br. J. Pharmacol. 2009;158:259–266. doi: 10.1111/j.1476-5381.2009.00186.x. [DOI] [PMC free article] [PubMed] [Google Scholar]
- 64.Ikeda H., Ardianto C., Yonemochi N., Yang L., Ohashi T., Ikegami M., Nagase H., Kamei J. Inhibition of opioid systems in the hypothalamus as well as the mesolimbic area suppresses feeding behavior of mice. Neuroscience. 2015;311:9–21. doi: 10.1016/j.neuroscience.2015.10.002. [DOI] [PubMed] [Google Scholar]
- 65.Satinoff E., Shan S.Y., Psychology P. Loss of behavioral thermoregulation after lateral hypothalamic lesions in rats. J. Comp. Physiol. Psychol. 1971;77:302–312. doi: 10.1037/h0031652. [DOI] [PubMed] [Google Scholar]
- 66.Xin L., Geller E.B., Adler M.W., Therapeutics E. Body temperature and analgesic effects of selective muand kappa opioid receptor agonists microdialyzed into rat. Brain. 1997;281:499–507. [PubMed] [Google Scholar]
- 67.Cintron-Colon R., Johnson C.W., Montenegro-Burke J.R., Guijas C., Faulhaber L., Sanchez-Alavez M., Aguirre C.A., Shankar K., Singh M., Galmozzi A., et al. Activation of kappa opioid receptor regulates the hypothermic response to calorie restriction and limits body weight loss. Curr. Biol. 2019;29:4291–4299.e4. doi: 10.1016/j.cub.2019.10.027. [DOI] [PMC free article] [PubMed] [Google Scholar]
- 68.Alcalá M., Calderon-Dominguez M., Serra D., Herrero L., Viana M. Mechanisms of impaired brown adipose tissue recruitment in obesity. Front. Physiol. 2019;10:94. doi: 10.3389/fphys.2019.00094. [DOI] [PMC free article] [PubMed] [Google Scholar]
- 69.Cai X., Huang H., Kuzirian M.S., Snyder L.M., Matsushita M., Lee M.C., Ferguson C., Homanics G.E., Barth A.L., Ross S.E. Generation of a KOR-Cre knockin mouse strain to study cells involved in kappa opioid signaling. Genesis. 2016;54:29–37. doi: 10.1002/dvg.22910. [DOI] [PMC free article] [PubMed] [Google Scholar]
- 70.DeVos S.L., Miller T.M.J.J. Direct intraventricular delivery of drugs to the rodent central nervous system. J. Vis. Exp. 2013:e50326. doi: 10.3791/50326. [DOI] [PMC free article] [PubMed] [Google Scholar]
- 71.Walentiny D.M., Komla E., Moisa L.T., Mustafa M.A., Poklis J.L., Akbarali H.I., Beardsley P.M. Methylnaltrexone crosses the blood-brain barrier and attenuates centrally-mediated behavioral effects of morphine and oxycodone in mice. Neuropharmacology. 2021;185:108437. doi: 10.1016/j.neuropharm.2020.108437. [DOI] [PMC free article] [PubMed] [Google Scholar]
- 72.Speakman J.R. Measuring energy metabolism in the mouse–theoretical, practical, and analytical considerations. Front. Physiol. 2013;4:34. doi: 10.3389/fphys.2013.00034. [DOI] [PMC free article] [PubMed] [Google Scholar]
- 73.Arch J.R.S., Hislop D., Wang S.J.Y., Speakman J.R. Some mathematical and technical issues in the measurement and interpretation of open-circuit indirect calorimetry in small animals. Int. J. Obes. 2006;30:1322–1331. doi: 10.1038/sj.ijo.0803280. [DOI] [PubMed] [Google Scholar]
Associated Data
This section collects any data citations, data availability statements, or supplementary materials included in this article.
Supplementary Materials
Data Availability Statement
-
•
All data reported in this paper will be shared by the lead contact upon request.
-
•
This paper does not report original code.
-
•
Any additional information required to reanalyze the data reported in this paper is available from the lead contact upon request.