

Abstract
We reported previously that β-site amyloid precursor protein cleaving enzyme (BACE1) is strongly expressed in the normal retina and that BACE1−/− mice develop pathological phenotypes associated with age-related macular degeneration (AMD). BACE1 expression is increased within the neural retina and retinal pigment epithelium (RPE) in AMD donor eyes suggesting that increased BACE1 is compensatory. We observed that AAV-mediated BACE1 overexpression in the RPE was maintained up to 6 months after AAV1-BACE1 administration. No significant changes in normal mouse visual function or retinal morphology were observed with low-dose vector while the high-dose vector demonstrated some early pathology which regressed with time. No increase in β-amyloid was observed. BACE1 overexpression in the RPE of the superoxide dismutase 2 knockdown (SOD2 KD) mouse, which exhibits an AMD-like phenotype, prevented loss of retinal function and retinal pathology, and this was sustained out to 6 months. Furthermore, BACE1 overexpression was able to inhibit oxidative stress, microglial changes, and loss of RPE tight junction integrity (all features of AMD) in SOD2 KD mice. In conclusion, BACE1 plays a key role in retina/RPE homeostasis, and BACE1 overexpression offers a novel therapeutic target in the treatment of AMD.
Keywords: β-secretase 1, BACE 1, retinal degeneration, age-related macular degeneration, gene therapy, retinal pigment epithelium
Graphical abstract
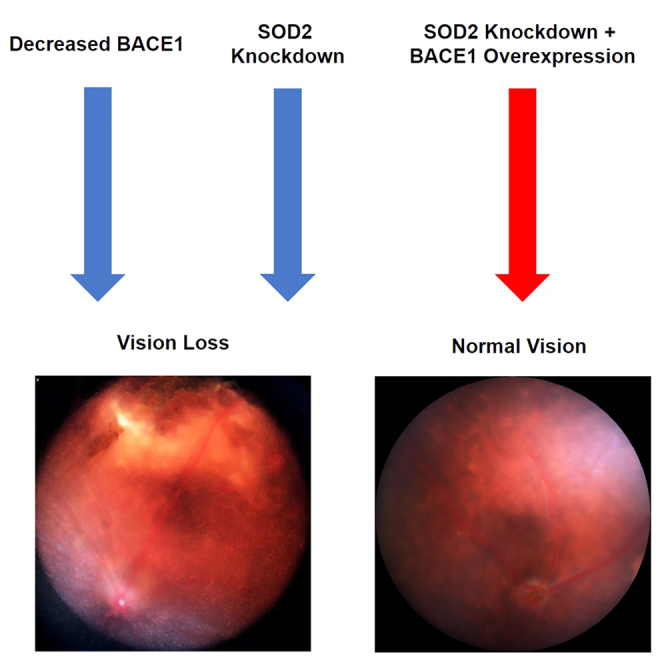
Boulton and colleagues report that BACE1 overexpression in the retinal pigment epithelium (RPE) of superoxide dismutase 2 knockdown mice, prevented loss of retinal function and retinal pathology and was able to inhibit oxidative stress, microglial changes, and loss of RPE tight junction integrity (all features of age-related macular degeneration).
Introduction
β-Site amyloid precursor protein cleaving enzyme (BACE) exists as two enzymes, BACE1 and BACE 2, which have approximately 68% homology.1,2,3 BACE is best recognized for first proteolytic cleavage of amyloid precursor protein (APP) to generate Aβ, which accumulates in the amyloid plaques associated with Alzheimer’s disease. BACE1 is considered the primary BACE involved in APP cleavage given the significantly lower APP cleaving activity reported for BACE2. The last decade has seen an expanding number of substrates reported for BACE1 (e.g., neuregulin, interleukin-1 receptor 2, insulin receptor [IR], VEGFR1, and ion channels) that can influence cell signaling and ion transport.4,5,6 We and others have reported that both BACE1 and BACE2 are strongly expressed in the retina,4,7,8,9,10 and it has been proposed that BACE may contribute to the accumulation of Aβ and amyloid deposits observed in the aging retina.9,11,12,13
We have reported previously that BACE1−/− mice develop significant retinal pathology including retinal thinning, apoptosis, reduced retinal vascular density, and an increase in the age pigment, lipofuscin.4 Many of these pathological phenotypes are observed in age-related macular degeneration (AMD).14,15 Moreover, intravitreal administration of BACE1 inhibitor or BACE1 small interfering RNA increased choroidal neovascularization (a key feature of wet AMD) in mice and was associated with lysosomal perturbations in cultured cells.4 By contrast, BACE2 knockout did not result in significant retinal pathology, and the double BACE1/BACE2 knockout did not demonstrate any increase in retinal pathology in the mouse above that observed in BACE1 knockout alone.4 More recently we have reported a strong association between BACE1 and mitochondria.16 Inhibition of BACE1 reduced mitochondrial membrane potential, increased mitochondrial fragmentation, and increased cleaved caspase-3 expression in retinal pigment epithelium (RPE) cells under oxidative stress. BACE1 inhibition also resulted in significantly lower levels of mitochondrial fusion proteins OPA1 and MFN1, suggesting a higher rate of mitochondrial fission while increasing the levels of mitophagy proteins Parkin and PINK1 and autophagosome numbers,16 suggesting that BACE1 can augment cellular defenses against oxidative damage by protecting mitochondrial dynamics. These findings are supported by other studies showing that BACE1 expression is elevated following oxidative stress in retinal cells.10,17
Based on our observations that (1) BACE1 is strongly expressed in the retina, (2) retinal pathology is observed with BACE1 KD/inhibition, and (3) as shown in this study, BACE expression is increased in the AMD retina, we hypothesized that upregulation of BACE1 in the retina may be a compensatory mechanism to prevent retinal degeneration such as seen in AMD. Using a mouse model with an AMD-like phenotype, we demonstrate that overexpression of BACE1 in the RPE significantly ameliorates retinal degeneration and AMD-associated phenotypic changes.
Results
BACE1 expression was increased in AMD eyes
As we have reported previously4 that BACE1 was expressed in normal human retinas (Figure 1A). BACE1 immunostaining was observed throughout the neural retina and RPE in non-AMD eyes and this was absent in the negative control (Figure 1A). By contrast, an increase in BACE1 immunostaining was observed in AMD eyes within both the neural retina and RPE compared with non-AMD age-matched control retinas and this was greatest in the retinal ganglion cell (RGC) layer, outer nuclear layer (ONL), and RPE (Figure 1A). Semi-quantitative analysis demonstrated that BACE1 was significantly increased (p < 0.05) in the ganglion cell layer, the outer plexiform layer (OPL), the ONL, the photoreceptor inner segment (IS) layer, photoreceptor outer segments (OSs), and the RPE layer of AMD eyes compared with age-matched controls (Figure 1B).
Figure 1.

BACE1 immunostaining showed upregulation of BACE1 intensity in retinal tissue from AMD donor eyes
Retinal sections from AMD and age-matched, non-AMD human donor eyes were immunostained with anti-BACE1 followed by conjugated Alexa Fluor 594 secondary antibody. BACE1 staining is red, and nuclei are stained blue with DAPI. Representative images are shown (A). BACE1 immunostaining was graded qualitatively in each retinal layer as: 5, strong bright intense, 4, bright uniformly intense; 3, patchy and moderate intense; 2, uniform and weak; 1, patchy and very weak; and 0, none. Mean fluorescence intensity in each retinal layer and fluorescence intensity was determined for AMD vs. non-AMD retinas. Statistical analysis demonstrated that BACE1 significantly increased in the ganglion cell layer, the outer plexiform layer (OPL), the outer nuclear layer (ONL), the photoreceptor inner segment (IS) layer, and the retinal pigmented epithelium (RPE) layer with p < 0.05 or p < 0.01, mean ± SEM, n = 5, from each study group (B).
BACE1 expression in the mouse retina following AAV delivery
The recombinant AAV1 cassette (Figure S1) containing the BACE1 gene with an enhanced-GFP tag demonstrated robust overexpression of BACE1 gene and protein in the RPE as confirmed by both quantitative reverse-transcription PCR (qRT-PCR) and immunohistochemistry (Figure 2). qRT-PCR analysis of BACE1 expression demonstrated low but significant expression of BACE1 in RPE/choroid preparations from untreated mice as we have reported previously (Figure 2A).4 Significant overexpression of BACE1 mRNA in RPE/choroid was observed 2 weeks after AAV-BACE1 subretinal infection in 7-week-old, female C57BL6/J mice. Expression of BACE1 was significantly increased (p < 0.05) by greater than 2.5-fold in eyes receiving low-dose AAV-BACE1 vector vs. AAV-GFP or untreated control animals (Figure 2A). A greater than 5-fold increase in BACE1 mRNA in RPE/choroid was observed in eyes received high-dose AAV-BACE1 vector compared with AAV-GFP or untreated control animals (Figure 2A). Control vector containing GFP alone did not increase BACE1 expression over baseline in control eyes at low vector dose but there was a significant increase in BACE1 mRNA expression over baseline for animals receiving the higher dose of the GFP vector, but this was significantly less than BACE1 expression using the high-dose BACE1 vector (Figure 2A).
Figure 2.

BACE1 expression in the mouse retina following AAV delivery
qRT-PCR demonstrated increased BACE1 mRNA expression in the RPE/choroid layer 2 weeks following sub-retinal injection of AAV-BACE1, mean ± SEM (A). BACE1 in untreated eyes showed faint fluorescence and this was increased in eyes 1 month following SOD2 KD (B). A robust overexpression of eGFP (green) was observed in flat-mount RPE layers as early as 2 weeks following sub-retinal injection of AAV-BACE1 and was persistently expressed out to 6 months post viral delivery (C) and the level of BACE1 expression was maintained following SOD2 knockdown (D). We used an anti-BACE1 antibody to detect the co-localization for BACE1 (red) and eGFP (green): merged images demonstrated that BACE1 colocalized with eGFP (orange/brown) (E). BACE 1 expression was greater in eyes receiving high-dose virus compared with low-dose virus (C, D and E). Negative control with omission of primary antibody (F). n = 5 for each study group.
Immunohistochemistry in control mice demonstrated low-level endogenous BACE1 expression in the RPE of untreated mice and this was increased slightly 1 month after superoxide dismutase 2 knockdown (SOD2 KD) in mice (Figure 2B). Following AAV1-mediated delivery of the BACE1 vector immunohistochemistry demonstrated robust overexpression of BACE 1 in RPE flat mounts as early as 2 weeks and continually sustained up to 6 months following AAV-BACE1 vector sub-retinal injection in both normal and SOD2 KD mice (Figures 2C and 2D). Figure 2E demonstrates co-expression between both BACE1 immunostaining and enhanced GFP (eGFP) in the RPE layer where 60%–70% of the RPE cells were positive for BACE1 expression. Overall BACE1 expression was always greatest in the animals receiving the highest concentration of vector.
BACE1 overexpression reduces disease progression in the SOD2 KD mouse
Optical coherence tomography (OCT) images did not demonstrate any overt structural changes due to increased expression of BACE1 at the low dose in untreated normal mice at either 1 or 6 months following AAV-BACE1 infection (Figure S2) and this was further confirmed by no difference in retinal thickness at either 1 month (Figure 3A) or 6 months (Figure 3B). However, focal areas of disruption in the RPE layer and photoreceptors were observed 1 month following overexpression of high-dose BACE1 (Figure S2, arrows), with significant thinning of the retina, p < 0.01 (Figure 3A). This loss of retinal thickness was not observed at 6 months after BACE1 overexpression (Figure 3B), and retinal morphology appeared like that of untreated controls (Figure S2). As described previously,18 no structural changes were observed in animals receiving the AAV1-inactive ribozyme control vector (Figure S3) while SOD2 KD (RzSOD2) animals demonstrated major pathological changes including thinning of the neural retina and loss of RPE cells which became progressively more severe with increasing time (6 months) following SOD2 KD (Figures 3C and S3). Quantitatively, this was associated with a significant reduction in retinal thickness (Figures 3A and 3B).
Figure 3.

Optical coherence tomography and fundus angiography
Quantitation and representative optical coherence tomography images demonstrate that increased expression of BACE1 at the low or high dose 6 months following subretinal injection maintains normal retina structure in contrast to SOD2 KD eyes alone, which suffered severe abnormalities and thinning in the retina - mean ± SEM (A–C). Quantification demonstrated this protective effect was significant in eyes receiving the low dose at 1 month following AAV-BACE1 delivery (A) while some pathological changes in the retinal and RPE layer were observed with high-dose BACE1 (A). By the 6-month time point, no retinal pathology was apparent at which time the protective effects were significant both for low and high dose of AAV-BACE1 delivery (B). Fundus angiography demonstrated improved retinal morphology and less fluorescence leakage in SOD knockout eyes after receiving AAV-BACE1 injection (D). n = 5 for each study group.
Overexpression of BACE1 at the low dose prevented the progression of pathology in the SOD2 KD mice at 1 month and continued to confer protection at 6 months following BACE1 overexpression. OCT images of the retina appeared normal and retinal thickness was not significantly different from controls at 6 months (Figures 3A–3C). In animals receiving low-dose BACE1, some improvement was shown at 1 month (p < 0.05) following BACE overexpression; however, this was not as great as that seen at 6 months (p < 0.01). Overexpression of BACE1 at the high dose similarly prevented the progression of pathology in the SOD2 KD mice at 6 months (p < 0.01) following BACE1 overexpression. OCT images of the retina appeared normal and retinal thickness was not significantly different from control (Figures 3A–3C). However, in contrast to the low BACE1 dose there was no significant improvement at 1 month following high-dose BACE1 overexpression with RPE loss evident (Figure 3, arrows) while retinal thickness remained normal.
Fundus angiography identified major fluorescein leakage in SOD2 KD eyes, diffusing throughout the fundus, compared with untreated controls which had no fluorescence leakage indicating an intact blood retinal barrier (Figure 3D). Six months after BACE1 overexpression, at both the low and high dose, a dramatic reduction in fluorescein leakage in SOD2 KD eyes was observed compared with control SOD2 KD eyes (Figure 3D).
BACE1 overexpression prevents loss of visual function in the SOD2 KD mouse
Electroretinograph (ERG) images were obtained from mice 1 and 6 months after AAV1-BACE1 injection. SOD2 KD mice demonstrated a significant reduction in scotopic a and b waves and photopic b wave at 1 and 6 months compared with untreated controls (Figure 4). Neither the control AAV vector lacking the BACE1 gene nor normal mice receiving the low-dose BACE1 vector demonstrated any significant loss of ERG function at either 1 or 6 months (Figures 4A and 4B). However, high-dose BACE1 vector caused a significant loss in a and b waves in normal animals at 1 month but this was only significant for the scotopic a wave at 6 months (Figures 4A and 4B). In all cases, the decrease in ERG observed with high-dose BACE1 was always significantly less than that observed for SOD2 KD alone (Figures 4A and 4B). Both low- and high-dose BACE1 significantly improved a and b waves at 1 and 6 months in SOD2 KD animals (p < 0.05) (Figures 4A and 4B). This was partial at 1 month, but at 6 months the ERG waves of SOD2 KD mice receiving low-dose BACE1 vector were not significantly different to that for untreated control mice. While this was also true for the scotopic and photopic b waves in SOD2 KD animals receiving the high-dose BACE1 the scotopic a wave never fully recovered to reach normal levels (Figures 4B and 4C).
Figure 4.

Visual function recovery in SOD2 KD mice treated with AAV-BACE1
Scotopic and photopic ERG was performed at 1 and 6 months following subretinal injection of AAV-BACE1. The peak changes in ERG a and b waves from 1 month (A) and 6 months (B) were quantified and demonstrated a significantly reduced response in SOD2 KD animals but were near normal in SOD2 KD animals receiving AAV-BACE1 (B) (p < 0.05, mean ± SEM, n = 5). Representative scotopic ERG waves (C). Optokinetic response was assessed at 6 months following AAV-BACE1 delivery and confirmed recovery of visual function in SOD KD animals in the low-dose group (p < 0.05, mean ± SEM, n = 5) but not in the high-dose BACE1 group of mice (D).
Optokinetic analysis demonstrated a significant reduction in spatial frequency in SOD2 KD mice. However, spatial frequency was restored to levels, as seen in untreated animals, in SOD2 KD mice at 6 months following low-dose BACE1 (Figure 4D). By contrast, there was no significant improvement in optokinetic response in SOD2 KD mice that received high-dose BACE1.
BACE1 overexpression reduces retinal pathology in the SOD2 KD mouse
Routine histology did not demonstrate any change in neural retina and RPE morphology in control animals receiving the AAV vector minus the BACE gene or the low-dose BACE1 AAV vector at 6 months (Figures 5A and 5B). However, high-dose BACE1-treated mice demonstrated a normal neural retina, but some depigmentation of the RPE was observed (Figure 5B). In agreement with previous reports,18,19 SOD2 KD mice demonstrated progressive retinal thinning together with photoreceptor loss and RPE atrophy (Figures 5C and 5D). By contrast, the neural retina and RPE appeared near normal in SOD2 KD animals 6 months following either low- or high-dose BACE1 overexpression (Figures 5C and 5D). Although morphologic improvement was observed at 3 months following BACE1 overexpression in SOD KD mice, this was not to the extent seen at the 6 month time point (Figure S4).
Figure 5.

AAV-BACE1 reduces retinal pathology in the SOD2 KD mouse
Representative H&E-stained sections from mice sacrificed 6 months after AAV-BACE1 injection. Low-dose BACE1-treated mice did not demonstrated any overt pathological changes in the retina compared with untreated control animals (A) while high-dose BACE1-treated mice caused some RPE cell depigmentation. Higher magnification of the RPE/choroid further confirmed this observation (B). SOD2 KD animals demonstrated thinning of retina and RPE cell loss (C). Both low- and high-dose BACE1 provided protection and reduced retinal thinning and loss of RPE compared with untreated SOD KD animals (C). High-magnification images demonstrated severe loss of RPE in SOD2 KD animals but the RPE layer remained near normal following overexpression of BACE1 (D). n = 5 for each study group.
BACE1 overexpression improves RPE junctional integrity and reduces microglial and oxidative stress responses in SOD2 KD mice
To assess the ability of BACE1 overexpression to maintain RPE integrity, we immunostained RPE flat mounts for the tight junction protein ZO-1 (Figure 6A). RPE flat mounts from mice receiving the inactive SOD2 ribozyme, AAV vector minus the BACE gene, or the low-dose BACE1 AAV vector at 6 months demonstrated an intact hexanocuboidal epithelial monolayer with typical continuous ZO-1 staining at the lateral membranes (Figure 6A). High-dose BACE 1 overexpression showed some loss of ZO-1 staining in the RPE of untreated control animals, but this was mild compared with the dramatically disorganized RPE cell layer with discontinuous and diffuse ZO-1 staining seen in SOD2 KD mice (Figure 6A). Both low- and high-dose BACE1 overexpression resulted in retention of the RPE architecture and near normal continuous staining for ZO-1 at the lateral membrane compared with SOD2 KD mice (Figure 6A).
Figure 6.

AAV-BACE1 improved RPE junctional integrity and reduced microglial changes in SOD2 KD mice
RPE flat mounts were prepared 6 months after AAV1-BACE1 and stained with an anti-ZO-1 antibody as a marker of tight junctions. Immunostaining (red) was evenly distributed at the lateral borders of RPE cells in normal eyes but was diffuse and highly disorganized in SOD KD eyes (A). RPE flat-mounts demonstrated that the severe loss of ZO-1 in SOD2 KD eyes was prevented by BACE1 overexpression (A). Furthermore, anti-IBa1 immunostaining (red) in RPE flat-mounts (B) demonstrated an dramatic increase in fluorescence intensity of Iba1+ microglia 6 months after SOD2 KD that exhibited morphological characteristics of ramified and activated microglia which, following AAV-BACE1, demonstrated reduced fluorescence intensity for IBa1 microglial staining together with a lesser dendritic morphology in SOD KD animals compared with untreated SOD2 KD animals that was significant at p < 0.05, mean ± SEM, n = 5 (C).
As we have reported previously,18 a significant increase in immunostaining for Iba1+ microglia 6 months after SOD2 KD that exhibited morphological characteristics of ramified and activated microglia was observed in RPE flat mounts (Figure 6B). We measured Iba1 red fluorescence intensity in RPE flat mounts as a measure of microglial cell density changes. Analysis demonstrated a significant increase in Iba1+ cells in SOD2 KD animals compared with control (p < 0.01) and Iba1+ cell fluorescence intensity was significantly reduced in SOD2 KD mice 6 months after either low- or high-dose BACE1 overexpression compared with untreated SOD2 KD animals (p < 0.05) (Figure 6C). There was no significant change in microglial immunostaining in either untreated mice or mice receiving the AAV-BACE1 vector alone. (Figures 6B and 6C).
An increase in oxidative stress has been reported in both AMD and in the SOD2 KD model.18,20,21 Immunostaining of SOD2 KD mouse retinas demonstrated a dramatic increase in the lipid peroxidation product 4-hydroxynonenal (4-HNE) (Figure 7). 4-HNE was located throughout the retina, in the RGC layer, inner nuclear layer, ONL, and RPE layer. Overexpression of either low- or high-dose BACE1 over 6 months demonstrated a greater than 50% reduction in 4HNE staining intensity in SOD2 KD mice (p < 0.05) (Figure 7). Interestingly, high-dose BACE1 alone resulted in a small, but significant, increase in 4HNE in normal mice.
Figure 7.

AAV1-BACE1 inhibited oxidative stress in SOD2 KD mice
Immunostaining for the oxidative stress marker 4-hydroxynonenal (4-HNE) in SOD2 KD mice at 6 months following AAV-BACE1 injection showed a dramatic increase in 4-HNE staining (red) in the neural retina and RPE compared with normal untreated eyes. Staining was primarily located to the RGC layer, inner and outer nuclear layer, and RPE. Retina vasculature was stained with agglutinin in green. By contrast, overexpression of BACE1 at either the low or high doses significantly reduced 4-HNE levels (p < 0.01, mean ± SEM, n = 5).
BACE1 overexpression and amyloid deposition in the retina
Given that AMD has been associated with amyloid accumulation in the retina9,13 and that BACE1 plays a key role in the cleavage of APP to generate amyloid,1,2 we next assessed whether BACE overexpression altered β-amyloid deposition in the retina. Immunostaining using a specific antibody against β-amyloid in mouse retina was performed in AAV-BACE1-injected mice at 1, 3, and 6 months after viral delivery and in the brain of the J20 mouse, which is a transgenic Alzheimer animal model as a positive control. Strong β-amyloid immunofluorescence staining was detected in brain tissue of the J20 mouse. However, no β-amyloid was detected in mouse retinas at any of the three time points post injection of either high- or low-dose of AAV-BACE1 or when combined with AAV-RzSOD2. Representative mouse retinal images are shown for mice 6 months after vector treatment (Figure S5).
Discussion
This study demonstrates for the first time that BACE1 overexpression results in preserved visual function and normal retinal morphology in the SOD2 KD mouse model which exhibits an AMD-like phenotype. We also demonstrate increased expression of BACE1 in donor retinas with AMD compared with age-matched controls which we predict is a compensatory mechanism to either slow or prevent the progression of AMD. Hallmarks of AMD are oxidative stress and an inflammatory response, both of which were significantly abrogated following BACE1 overexpression. Importantly, both low- and high-dose BACE1 vector titer was equally effective in preventing long-term visual loss and retinal degeneration in this model. Furthermore, both vector concentrations had minimal long-term effect on visual function or retinal morphology 6 months after injection in normal mice although some visual and morphological changes were observed with high-dose vector, but these resolved with time.
Given that BACE1 is the first step in the cleavage of APP to form amyloid, a major concern was that BACE1 overexpression would lead to the accumulation of amyloid that has been reported to have retinal toxicity.7,9,11 However, we found no evidence of β-amyloid accumulation in the retina following overexpression of either the low- or high-dose vector up to 6 months after infection in both normal and SOD2 KD mice. Interestingly, no amyloid accumulation was observed in the SOD2 KD alone mice even though amyloid accumulation has been associated with AMD pathology9 and studies report a potential association between Alzheimer’s disease and AMD11; however, further confirmation is needed in these areas plus in this study we only overexpressed BACE1 in one retinal cell type. Since our studies were undertaken in young mice, β-amyloid accumulation may occur following BACE1 overexpression in old mice.
In this study, we only overexpressed BACE1 in the retinal pigment epithelium as this is the cell type considered to play a leading role in the onset and development of AMD pathology.14,15 Furthermore, we have only assessed the beneficial impact of BACE1 overexpression at an early stage of retinal pathology in our SOD2 KD mouse model. Our previous cell therapy studies in this model demonstrated that disease progression could be fully reversed in early pathology but not in the later stages of disease when extensive retinal degeneration was apparent.18 Indeed, it is well recognized that pharmacological and gene therapy interventions offer only limited benefits in late-stage disease, with significant degeneration and cell loss in both clinical and animal studies. Thus, our studies support the paradigm that it is best to treat in early disease when prevention of pathology is more attainable.
The mechanism by which BACE1 overexpression in the RPE prevents retinal degeneration and visual loss is unclear and could involve multiple pathways since, in addition to the cleavage of APP, BACE1 has been associated with a number of proteins/pathways that include Jagged1 and 2, neuregulin, interleukin-1 receptor 2, IR, α2,6-sialyl transferase, VEGFR1, ion channels, and basal secretion,4,6,22,23 plus we and others have shown a link between BACE1 and oxidative stress, mitochondrial homeostasis, mitophagy, lysosomal integrity, and inflammation.4,6,16,22,24 We clearly demonstrate in this study that BACE1 overexpression is associated with the reduction of oxidative damage and inflammatory markers in the retina.
Within the last decade there has been a realization that BACE1 plays a major role in cellular physiology and pathology outside of Alzheimer’s disease given that it is expressed in multiple tissues besides the brain. Recent studies show that BACE1 is linked to cancer development and progression,22 diabetes through regulation of insulin pathways,6 immune function,6 cochlear development,25 peripheral nerve regeneration,26 cerebral small vessel injury,27 and retinal pathology.4 Furthermore, it is likely that BACE1 effects are cell-type specific and act through different pathways within these cells. Elevated BACE1 impairs cerebral small vessels but not large brain arteries via tight junctions (occludin cleavage) and eNOS and that suppression of BACE1 reduces tight junction loss and endothelial dysfunction,27 while deletion of BACE1 causes upregulation of eNOS.28 BACE1 overexpression in the SOD2 KD mice demonstrated a dramatic improvement of tight junctional integrity compared with untreated SOD2 KD animals. We cannot conclude whether BACE1 overexpression in the retinal vascular endothelium would lead to leakage as our overexpression studies were confined to the RPE plus we have reported previously that pharmacological inhibition of BACE1 increases neovascularization in a laser-induced choroidal neovascularization model.4 BACE1 may also have contributed to amelioration of retinal degeneration via its ability to modulate IR signaling6 since IRs are strongly expressed in the neural retina and RPE.29,30,31
In conclusion, while evidence is increasing that BACE1 plays an important role in retinal homeostasis and degeneration, the mechanisms remain to be fully elucidated and are likely to be cell-type- and disease specific. However, this study highlights the potential for BACE1 as a target in therapeutic management of retinal diseases.
Methods
Materials
AAV1 vector containing Homo sapiens BACE1 gene (NCBI reference sequence: NM_012104.4, https://www.ncbi.nlm.nih.gov/nuccore/NM_012104) with an eGFP tag driven by a small CBA promoter (Figure S1) and a control vector without the BACE1 gene but containing eGFP were designed and purchased from the University of Florida Viral Vector Core. This core also provided the AAV1-Rz432-SOD2 and AAV1-inactive ribozyme as control.18,19
Paraformaldehyde was obtained from Sigma-Aldrich, St. Louis, MO. AK-Fluorescence, 10%, was purchased from Akorn (Ann Arbor, MI). Antigen retrieval solution, Rodent Decloaker, 10X, was purchased from Biocare Medical (Concord, CA). A rabbit antibody produced against the N terminus (46–62) of BACE 1 (cat. no. B0681) was purchased from Millipore-Sigma (Burlington, MA). Rabbit anti-BACE1 antibody was purchased from Thermo Fisher Scientific (Waltham, MA; cat. no. MA1-177). A polyclonal antibody 4-HNE (cat. no. STA-035) was purchased from Cell Biolabs (San Diego, CA). Rabbit anti-Iba1 (cat. no. 019-19741) was obtained from Wako Chemicals USA (Richmond, VA). Mouse anti-ZO-1 antibody (cat. no. 33-9100) and anti-amyloid antibody (cat. no. 512700) were purchased from Life Technologies (Carlsbad, CA), and the Alexa Fluor 594 or 647 tagged secondary antibody (goat anti-rabbit) (cat. no. A-11012, A-32733) was from Invitrogen (Carlsbad, CA). All sections were mounted with Vectashield medium (cat. no. H-1000-10) from Vector Laboratories (Burlingame, CA).
BACE1 immunostaining in human donor eyes
Human donor eyes from AMD patients (n = 5), aged from 68 to 92 years and age-matched non-diseased controls (n = 5) were obtained from the National Disease Research Interchange (PA, USA). Donor details including retina/RPE pathology are provided in Table 1.
Table 1.
Details of donor eyes used in this study
| Non-AMD |
AMD |
||||
|---|---|---|---|---|---|
| Age (years) | Sex | Pathology | Age (years) | Sex | Pathology |
| 79 | M | none | 79 | F | drusen, RPE drop-out, photoreceptor loss, retina/RPE thinning |
| 74 | F | none | 68 | M | small drusen, RPE thinning |
| 92 | F | none | 79 | F | large drusen, RPE thinning, RPE loss |
| 79 | F | none | 84 | F | drusen, RPE thinning, RPE loss |
| 78 | M | none | 90 | M | drusen, RPE loss |
| Mean age = 80.4 years | mean age = 80.0 years | ||||
The eyes were processed for standard paraffin sections as we have described previously.21 Transverse sections were cut from the central retina within 2 mm of the macula for all eyes to allow comparison. For BACE1 immunohistochemistry, the sections were deparaffinized and processed for antigen-epitope retrieval, incubated in a steamer at 120°C for 30 min in the antigen retrieval solution, rodent deblocker (Biocare Medical). The sections were permeabilized with 0.1% Triton X-100 for 10 min, then blocked with 5% normal goat serum plus 1% BSA for 1 h in room temperature and incubated with rabbit anti-BACE1 (Thermo Fisher Scientific; cat. no. MA1-177, 1:100) overnight at 4°C. The sections were then incubated with Alexa Fluor 594 goat anti-mouse IgG (1:500, Invitrogen) for 1 h at room temperature. After extensive washing with PBS, sections were mounted with VectaShield DAPI (Vector Laboratories) for nuclear staining. Negative control samples were processed with the omission of the primary antibody. The sections were examined using an Axiovert 135 fluorescence microscope (Carl Zeiss, Thornwood, NY).
Grading of immunostaining intensity and statistical analysis
The grading of the fluorescence intensity of BACE1 immunostaining in human retinas was performed in a masked fashion using a modification of our previously described grading system.32 Omission of BACE1 antibody acted as the background control. The fluorescent intensity was assessed for the ganglion cell layer, Müller cells, the inner plexiform layer, the inner nuclear layer, the OPL, the ONL, the photoreceptor ISs, the photoreceptor OSs, and the retinal pigmented epithelium. The intensity of staining was graded qualitatively as: 5, strong bright intense; 4, bright uniformly intense; 3, patchy and moderate intense; 2, uniform and weak; 1, patchy and very weak; and 0, none. Results are expressed as mean ± SEM. Statistical analysis for AMD eyes verses non-diseased controls from each retina segment layer was compared with a Student t test to determine the significance of the data and plotted using Prism 5 v.8.01 (GraphPad Software, La Jolla, CA) with p < 0.05 considered statistically significant.
Animals
All animal studies were conducted under approved protocols by the Institutional Animal Care and Use Committees at Indiana University (protocol no. 10625 MD/R) and University of Alabama at Birmingham (protocol no. 20826), and in accordance with guidelines set forth by the National Institutes of Health and the Statement for the Use of Animals in Ophthalmic and Visual Research of the Association for Research in Vision and Ophthalmology. Six-week-old adult female C57BL/6J mice were purchased from Jackson Laboratories (Bar Harbor, ME). For ocular injections, ERG, and OCT, mice were anesthetized by ketamine (72 mg/kg)/xylazine (4 mg/kg) intraperitoneal injection with topical anesthesia using proparacaine hydrochloride. Mice were euthanized by isoflurane or CO2 inhalation followed by cervical dislocation.
Subretinal AAV injections
C57BL/6J mice at 8 weeks old received a subretinal injection of 0.5 μL of 2.5 × 10¹⁰ vg/μL of either SOD2-specific hammerhead ribozyme, Rz432, driven by RPE-specific VMD2 promoter (AAV1-Rz-SOD2) or rAAV-inactive ribozyme (AAV1-Rz-inactive) into their right eyes as described previously.18,19 Intraocular AAV1 gene transfer specifically infects the RPE and not the other retinal cell types.33,34 The left eyes acted as untreated controls. Two weeks following SOD2 KD (representing an early disease phenotype18) the right eyes received 0.5 μL of either 2 × 10⁹ vg/μL (low concentration) or 4 × 10¹⁰ vg/μL virus (high concentration). The control vector was without the BACE1 gene but containing the GFP gene. Animals were monitored throughout and sacrificed at 2 weeks, 1 month, 3 months, and 6 months following injection of the BACE1 vector. We used 10 mice per time point per experimental group.
OCT
Eyes were dilated with 1% atropine followed by 2.5% phenylephrine hydrochloride (Alcon, Fort Worth, TX) and then anesthetized by ketamine (72 mg/kg)/xylazine (4 mg/kg). One drop of 2.5% hydroxypropyl methylcellulose (Gonak) (Akorn, Lake Forest, IL) was applied to each eye before examination. OCT was performed using a Bioptigen OCT system (Envisu R-class, Leica Microsystems. Buffalo Grove, IL). Three lateral images (nasal, central, and temporal) were collected, starting 0.2 mm above the meridian crossing through the center of the optic nerve (ON), at the ON meridian, and 0.2 mm below the ON meridian. A corresponding box centered on the ON with eight measurement points separated by 0.2 mm from each other was created. Corresponding neural retinal thickness from the vitreous face of the ganglion cell layer to the apical face of the RPE was determined for different treatments and compared with untreated eyes at the same location (0.2 mm temporal to the ON).
Fundus imaging and fluorescein angiography
For fundus imaging and fluorescein angiography, we used the Micron III fundus imaging system (Phoenix Research Labs, Pleasanton, CA). Fundus images were taken using Streampix software. Fluorescein angiography was performed by intraperitoneal injection of sodium fluorescein (100 μL of 10% fluorescein; Akorn, Ann Arbor, MI) and images were recorded 1 min after injection and continued at increasing intervals for 15 min. Changes in retinal integrity and vascular leakage were evaluated by comparing the sequential photographs taken over time.
ERG
Visual function tests were performed using ERG responses at 1, 3, and 6 months following injection of AAV-BACE1. For ERGs, mice were dark-adapted overnight and full-field ERGs were recorded with a visual electrodiagnostic system (UTAS-E 2000; LKC Technologies, Gaithersburg, MD) using gold wire loop electrodes placed on each cornea and a reference electrode placed subcutaneously between the eyes as described previously.18 Scotopic rod recordings were performed with stimuli presented at intensities of 0.025, 0.25, and 2.5 log cd-s/m2 at 10, 20, and 30 s intervals, respectively. Ten responses were recorded and averaged at each light intensity. Photopic cone recordings were performed after mice were light adapted to a white background light of 100 cd-s/m2 for 5 min. Recordings were performed with four increasing flash intensities from 0, 5, 10, and 25 log cd-s/m2 in the presence of a constant 100 mcd-s/m2 rod suppressing background light. Fifty responses were recorded and averaged at each intensity. The a waves were measured from the baseline to the peak in the cornea-negative direction, and b waves were measured from the cornea-negative peak to the major cornea-positive peak. ERG data are presented as comparisons between treatment conditions for the mean of the maxima for a and b wave responses.
Optokinetic response
To evaluate the optokinetic response, we used a computer-based visual acuity response test (OptoMotry 1.7.7; Cerebral Mechanics, Lethbridge, AB, Canada) as described previously.18 In brief, mice were tested for visual acuity by observing optokinetic responses to rotating sinusoidal gratings. A mouse was placed on the platform and allowed to settle for 2 min. The virtual drum was rotated for 1 min, and the mouse was observed for a head-tracking response. Initially, the 100% contrast pattern had a spatial frequency of 0.200 cycles/degree for both directions of rotation. The OptoMotry program changed spatial frequency based on the observer’s responses and tracked the responses according to direction of pattern rotation to assess the two eyes independently.
qRT-PCR
The mouse eyes were enucleated, and connective tissue, cornea, lens, and neural retina were removed. The remaining RPE layer plus the choroid were kept at −80°C until RNA extraction. For RNA extraction, TRIzol (Invitrogen) was added to the frozen tissue, which was quickly sonicated. Isolated RNA was quantified, and reverse transcribed to cDNA (25 ng) using the iSCript kit (no. 1708891; Bio-Rad, Hercules, CA). qRT-PCR assays were performed in 10 μL reactions of Bio-Rad SsoFast Avanced Universal Probes Supermix kits (no. 1725284; Bio-Rad). Validated SYBR Green primers from Bio-Rad were used: PrimePCR SYBR Green Assay for BACE1: unique assay ID: qHsaCID0012647/025636; for β-actin: unique assay ID: qMmuCED0027505/10025637; for RPE65: unique assay ID: qMmuCID0005722/11025637. ARPE19 cell RNA was used as positive control and water was used as negative control. Samples were run in triplicates on a Bio-Rad CFX96 Touch Real-Time PCR Detection System (1855195; Bio-Rad) and the comparative CT (2–ΔΔCT) method was used for statistical analyses.
Preparation of neural retina and RPE flat mounts
Animals were sacrificed at 2 weeks, 1 month, 3 months, and 6 months after BACE1 vector injection. Eyes were enucleated and fixed overnight at 4°C in freshly prepared 4% paraformaldehyde. After three washes in PBS, the fat and muscle were dissected away and then lens, vitreous, and cornea were carefully removed. Four shallow incisions were then made in the eyeball, allowing for separation of the retina from the RPE/choroid with minimal cross-contamination. The RPE/choroid and neural retina were then treated as described below, after which they were mounted flat with anti-fade medium and examined by epifluorescence or confocal microscopy.
Histopathology
At 1, 3, and 6 months following BACE1 overexpression, mice were sacrificed, and the eyes were enucleated and fixed in freshly prepared 4% paraformaldehyde. After three washes in PBS, eyes were sent to the University of Alabama Birmingham Histology Core for routine paraffin wax processing and sectioning. Four-micron transverse sections of the retina were stained with hematoxylin and eosin and examined by light microscopy. All representative images were obtained approximately 200 μM from the ON.
Immunohistochemical analyses
Retina and RPE/choroid flat mounts were washed and then incubated with blocking serum solution (Dako, Glostrup, Denmark). For immunostaining, anti-BACE 1 antibody produced in rabbit, diluted 1:200 in PBS with 1% BSA plus 5% NGS, anti-4-HNE polyclonal antibody, diluted 1:400 in PBS with 1% BSA plus 5% NGS, and the anti-IBa1 antibody, diluted 1:400 in PBS with 1% BSA plus 5% NGS, were added to the flat mounts and incubated overnight at 4°C. After washing the tissues, the following day the secondary antibody, Alexa Fluor-labeled (594 nm)-red goat anti-rabbit IgG (Molecular Probes, Eugene, OR) was used at a dilution of 1:600 in PBS with 1% Tween 20 and incubated at room temperature for 1 h. Samples were washed, and anti-fade reagent with DAPI (Prolong Gold antifade reagent with DAPI, Molecular Probes) was added. Images were captured within 24 h by using an Olympus Fluroview unit and an Olympus BX50 confocal microscope (Olympus, Melville, NY).
For immunohistochemistry of wax-embedded sections, the sections were deparaffinized and processed for antigen-epitope retrieval. Samples were incubated in a steamer (Histofine, Nichirei Biosciences, Carlsbad, CA) at 120°C for 30 min in antigen retrieval solution, rodent deblocker (Biocare Medical, LLC, Pacheco, CA) for antigen retrieval and then allowed to cool. The sections were permeabilized with 0.1% Triton X-100 for 10 min, then blocked with 5% normal goat serum plus 1% BSA for 1 h in room temperature and incubated with rabbit anti-Iba1 (1:400 in blocking solution) overnight at 4°C. The sections were then incubated with Alexa Fluor 594 goat anti-mouse IgG (1:600 in blocking solution) (Invitrogen) for 1 h at room temperature. Amyloid staining was performed at 1, 3, and 6 months post AAV1-BACE1 treatment, together with a positive control (brain samples from J20 transgenic mice, a gift from Dr. Roberson’s lab, Department of Neurology, UAB). Anti-β-amyloid antibody was used at 1:200 in 2.5% TBST with secondary GAR-Alexa Fluor 647 at 1:500 dilution. After extensive washing with PBS, cells were mounted with VectaShield DAPI (Vector Laboratories) for nuclear staining. Negative control samples were processed with the omission of the primary antibody. The sections were examined using an Axiovert 135 fluorescence microscope (Carl Zeiss) with identical settings for intensity, gain, etc. Quantification of immunofluorescence staining for the measurement of anti-4-HNE was performed by a masked observer in paraffin-embedded tissue sections with 10 representative images from each sample at 20× magnification then imported into ImageJ (developed by Wayne Rasband, National Institutes of Health, Bethesda, MD; available at http://rsb.info.nih.gov/nih-image).
Statistical analysis
All experiments were repeated at least three times. Results are expressed as mean ± SEM. ANOVA with Bonferroni post hoc correction or a Student’s t test were carried out, as appropriate, to determine significance of data. Statistical analysis was performed using Prism 5 v.5.01 (GraphPad Software, La Jolla, CA) with p < 0.05 considered statistically significant.
Data availability
All raw data supporting the findings are available from the corresponding authors upon reasonable request.
Acknowledgments
Brain samples from J20 transgenic mice were a generous gift from Dr. Roberson, Department of Neurology, University of Alabama at Birmingham; University of Florida, Gene Therapy Core; University of Alabama at Birmingham, Histology Core. Work from M.B.G. and M.E.B. was funded from NEI R01EY012601, R01EY028858, R01EY028037, R01EY025383, and R01EY032753. Support was also from NIH Core Grant for Vision Research, P30 EY003039 and Research to Prevent Blindness Unrestricted Grant.
Author contributions
X.Q., C.F., S.M., H.G., and J.Q. performed the experiments. S.L.B. generated the viral vectors. X.Q., C.F., and J.Q. analyzed the data. X.Q., M.B.G., and M.E.B. discussed the data. M.B.G. and M.E.B. conceived, designed, and supervised the research. X.Q., M.B.G., and M.E.B. wrote the manuscript.
Declaration of interests
The authors declare that they have no competing interests.
Footnotes
Supplemental information can be found online at https://doi.org/10.1016/j.ymthe.2023.03.029.
Supplemental information
References
- 1.De Strooper B., Vassar R., Golde T. The secretases: enzymes with therapeutic potential in Alzheimer disease. Nat. Rev. Neurol. 2010;6:99–107. doi: 10.1038/nrneurol.2009.218. [DOI] [PMC free article] [PubMed] [Google Scholar]
- 2.Vassar R., Kovacs D.M., Yan R., Wong P.C. The beta-secretase enzyme BACE in health and Alzheimer's disease: regulation, cell biology, function, and therapeutic potential. J. Neurosci. 2009;29:12787–12794. doi: 10.1523/JNEUROSCI.3657-09.2009. [DOI] [PMC free article] [PubMed] [Google Scholar]
- 3.Wang Z., Xu Q., Cai F., Liu X., Wu Y., Song W. BACE2, a conditional beta-secretase, contributes to Alzheimer's disease pathogenesis. JCI Insight. 2019;4:e123431. doi: 10.1172/jci.insight.123431. [DOI] [PMC free article] [PubMed] [Google Scholar]
- 4.Cai J., Qi X., Kociok N., Skosyrski S., Emilio A., Ruan Q., Han S., Liu L., Chen Z., Bowes Rickman C., et al. β-Secretase (BACE1) inhibition causes retinal pathology by vascular dysregulation and accumulation of age pigment. EMBO Mol. Med. 2012;4:980–991. doi: 10.1002/emmm.201101084. [DOI] [PMC free article] [PubMed] [Google Scholar]
- 5.Qian Q., Mitter S.K., Pay S.L., Qi X., Rickman C.B., Grant M.B., Boulton M.E. A non-canonical role for beta-secretase in the retina. Adv. Exp. Med. Biol. 2016;854:333–339. doi: 10.1007/978-3-319-17121-0_44. [DOI] [PubMed] [Google Scholar]
- 6.Taylor H.A., Przemylska L., Clavane E.M., Meakin P.J. BACE1: more than just a beta-secretase. Obes. Rev. 2022;23:e13430. doi: 10.1111/obr.13430. [DOI] [PMC free article] [PubMed] [Google Scholar]
- 7.Hart N.J., Koronyo Y., Black K.L., Koronyo-Hamaoui M. Ocular indicators of Alzheimer's: exploring disease in the retina. Acta Neuropathol. 2016;132:767–787. doi: 10.1007/s00401-016-1613-6. [DOI] [PMC free article] [PubMed] [Google Scholar]
- 8.Huang J.F., Shang L., Liu P., Zhang M.Q., Chen S., Chen D., Fan C.L., Wang H., Xiong K. Timosaponin-BII inhibits the up-regulation of BACE1 induced by ferric chloride in rat retina. BMC Complement Altern. Med. 2012;12:189. doi: 10.1186/1472-6882-12-189. [DOI] [PMC free article] [PubMed] [Google Scholar]
- 9.Wang M., Su S., Jiang S., Sun X., Wang J. Role of amyloid beta-peptide in the pathogenesis of age-related macular degeneration. BMJ Open Ophthalmol. 2021;6:e000774. doi: 10.1136/bmjophth-2021-000774. [DOI] [PMC free article] [PubMed] [Google Scholar]
- 10.Xiong K., Cai H., Luo X.G., Struble R.G., Clough R.W., Yan X.X. Mitochondrial respiratory inhibition and oxidative stress elevate beta-secretase (BACE1) proteins and activity in vivo in the rat retina. Exp. Brain Res. 2007;181:435–446. doi: 10.1007/s00221-007-0943-y. [DOI] [PubMed] [Google Scholar]
- 11.Ashok A., Singh N., Chaudhary S., Bellamkonda V., Kritikos A.E., Wise A.S., Rana N., McDonald D., Ayyagari R. Retinal degeneration and alzheimer's disease: an evolving link. Int. J. Mol. Sci. 2020;21:7290. doi: 10.3390/ijms21197290. [DOI] [PMC free article] [PubMed] [Google Scholar]
- 12.Li L., Luo J., Chen D., Tong J.B., Zeng L.P., Cao Y.Q., Xiang J., Luo X.G., Shi J.M., Wang H., Huang J.F. BACE1 in the retina: a sensitive biomarker for monitoring early pathological changes in Alzheimer's disease. Neural Regen. Res. 2016;11:447–453. doi: 10.4103/1673-5374.179057. [DOI] [PMC free article] [PubMed] [Google Scholar]
- 13.Ratnayaka J.A., Serpell L.C., Lotery A.J. Dementia of the eye: the role of amyloid beta in retinal degeneration. Eye (Lond) 2015;29:1013–1026. doi: 10.1038/eye.2015.100. [DOI] [PMC free article] [PubMed] [Google Scholar]
- 14.de Jong P.T. Age-related macular degeneration. N. Engl. J. Med. 2006;355:1474–1485. doi: 10.1056/NEJMra062326. [DOI] [PubMed] [Google Scholar]
- 15.Fleckenstein M., Keenan T.D.L., Guymer R.H., Chakravarthy U., Schmitz-Valckenberg S., Klaver C.C., Wong W.T., Chew E.Y. Age-related macular degeneration. Nat. Rev. Dis. Primers. 2021;7:31. doi: 10.1038/s41572-021-00265-2. [DOI] [PubMed] [Google Scholar]
- 16.Francelin C., Mitter S.K., Qian Q., Barodia S.K., Ip C., Qi X., Gu H., Quigley J., Goldberg M.S., Grant M.B., Boulton M.E. BACE1 inhibition increases susceptibility to oxidative stress by promoting mitochondrial damage. Antioxidants (Basel) 2021;10:1539. doi: 10.3390/antiox10101539. [DOI] [PMC free article] [PubMed] [Google Scholar]
- 17.Huang P., Sun J., Wang F., Luo X., Zhu H., Gu Q., Sun X., Liu T., Sun X. DNMT1 and Sp1 competitively regulate the expression of BACE1 in A2E-mediated photo-oxidative damage in RPE cells. Neurochem. Int. 2018;121:59–68. doi: 10.1016/j.neuint.2018.09.001. [DOI] [PubMed] [Google Scholar]
- 18.Qi X., Pay S.L., Yan Y., Thomas J., Jr., Lewin A.S., Chang L.J., Grant M.B., Boulton M.E. Systemic injection of RPE65-programmed bone marrow-derived cells prevents progression of chronic retinal degeneration. Mol. Ther. 2017;25:917–927. doi: 10.1016/j.ymthe.2017.01.015. [DOI] [PMC free article] [PubMed] [Google Scholar]
- 19.Justilien V., Pang J.J., Renganathan K., Zhan X., Crabb J.W., Kim S.R., Sparrow J.R., Hauswirth W.W., Lewin A.S. SOD2 knockdown mouse model of early AMD. Invest Ophthalmol. Vis. Sci. 2007;48:4407–4420. doi: 10.1167/iovs.07-0432. [DOI] [PMC free article] [PubMed] [Google Scholar]
- 20.Datta S., Cano M., Ebrahimi K., Wang L., Handa J.T. The impact of oxidative stress and inflammation on RPE degeneration in non-neovascular AMD. Prog. Retin. Eye Res. 2017;60:201–218. doi: 10.1016/j.preteyeres.2017.03.002. [DOI] [PMC free article] [PubMed] [Google Scholar]
- 21.Mitter S.K., Song C., Qi X., Mao H., Rao H., Akin D., Lewin A., Grant M., Dunn W., Jr., Ding J., et al. Dysregulated autophagy in the RPE is associated with increased susceptibility to oxidative stress and AMD. Autophagy. 2014;10:1989–2005. doi: 10.4161/auto.36184. [DOI] [PMC free article] [PubMed] [Google Scholar]
- 22.Farris F., Matafora V., Bachi A. The emerging role of beta-secretases in cancer. J. Exp. Clin. Cancer Res. 2021;40:147. doi: 10.1186/s13046-021-01953-3. [DOI] [PMC free article] [PubMed] [Google Scholar]
- 23.Lee H.W., Seo H.S., Ha I., Chung S.H. Overexpression of BACE1 stimulates spontaneous basal secretion in PC12 cells. Neurosci. Lett. 2007;421:178–183. doi: 10.1016/j.neulet.2007.01.082. [DOI] [PubMed] [Google Scholar]
- 24.Stertz L., Contreras-Shannon V., Monroy-Jaramillo N., Sun J., Walss-Bass C. BACE1-Deficient mice exhibit alterations in immune system pathways. Mol. Neurobiol. 2018;55:709–717. doi: 10.1007/s12035-016-0341-1. [DOI] [PubMed] [Google Scholar]
- 25.Dierich M., Hartmann S., Dietrich N., Moeser P., Brede F., Johnson Chacko L., Tziridis K., Schilling A., Krauss P., Hessler S., et al. β-Secretase BACE1 is required for normal cochlear function. J. Neurosci. 2019;39:9013–9027. doi: 10.1523/JNEUROSCI.0028-19.2019. [DOI] [PMC free article] [PubMed] [Google Scholar]
- 26.Tallon C., Rockenstein E., Masliah E., Farah M.H. Increased BACE1 activity inhibits peripheral nerve regeneration after injury. Neurobiol. Dis. 2017;106:147–157. doi: 10.1016/j.nbd.2017.07.003. [DOI] [PubMed] [Google Scholar]
- 27.Zhou H., Gao F., Yang X., Lin T., Li Z., Wang Q., Yao Y., Li L., Ding X., Shi K., et al. Endothelial BACE1 impairs cerebral small vessels via tight junctions and eNOS. Circ. Res. 2022;130:1321–1341. doi: 10.1161/CIRCRESAHA.121.320183. [DOI] [PubMed] [Google Scholar]
- 28.He T., d'Uscio L.V., Sun R., Santhanam A.V.R., Katusic Z.S. Inactivation of BACE1 increases expression of endothelial nitric oxide synthase in cerebrovascular endothelium. J. Cereb. Blood Flow Metab. 2022;42:1920–1932. doi: 10.1177/0271678X221105683. [DOI] [PMC free article] [PubMed] [Google Scholar]
- 29.Naeser P. Insulin receptors in human ocular tissues. Immunohistochemical demonstration in normal and diabetic eyes. Ups J. Med. Sci. 1997;102:35–40. doi: 10.3109/03009739709178930. [DOI] [PubMed] [Google Scholar]
- 30.Rains J.L., Jain S.K. Oxidative stress, insulin signaling, and diabetes. Free Radic. Biol. Med. 2011;50:567–575. doi: 10.1016/j.freeradbiomed.2010.12.006. [DOI] [PMC free article] [PubMed] [Google Scholar]
- 31.Reiter C.E., Gardner T.W. Functions of insulin and insulin receptor signaling in retina: possible implications for diabetic retinopathy. Prog. Retin. Eye Res. 2003;22:545–562. doi: 10.1016/s1350-9462(03)00035-1. [DOI] [PubMed] [Google Scholar]
- 32.Qi X., Mitter S.K., Yan Y., Busik J.V., Grant M.B., Boulton M.E. Diurnal rhythmicity of autophagy is impaired in the diabetic retina. Cells. 2020 doi: 10.3390/cells9040905. [DOI] [PMC free article] [PubMed] [Google Scholar]
- 33.Lebherz C., Maguire A., Tang W., Bennett J., Wilson J.M. Novel AAV serotypes for improved ocular gene transfer. J. Gene Med. 2008;10:375–382. doi: 10.1002/jgm.1126. [DOI] [PMC free article] [PubMed] [Google Scholar]
- 34.Pang J.J., Lauramore A., Deng W.T., Li Q., Doyle T.J., Chiodo V., Li J., Hauswirth W.W. Comparative analysis of in vivo and in vitro AAV vector transduction in the neonatal mouse retina: effects of serotype and site of administration. Vis. Res. 2008;48:377–385. doi: 10.1016/j.visres.2007.08.009. [DOI] [PubMed] [Google Scholar]
Associated Data
This section collects any data citations, data availability statements, or supplementary materials included in this article.
Supplementary Materials
Data Availability Statement
All raw data supporting the findings are available from the corresponding authors upon reasonable request.