

Abstract
X-linked dystonia-parkinsonism (XDP) is a neurodegenerative disease caused by a retrotransposon insertion in intron 32 of the TAF1 gene. This insertion causes mis-splicing of intron 32 (TAF1-32i) and reduced TAF1 levels. TAF1-32i transcript is unique to XDP patient cells and can be detected in their extracellular vesicles (EVs). We engrafted patient and control iPSC-derived neural progenitor cells (hNPCs) into the striatum of mice. To track TAF1-32i transcript spread by EVs, we transduced the brain-implanted hNPCs with a lentiviral construct called ENoMi, which consists of a re-engineered tetraspanin scaffold tagged with bioluminescent and fluorescent reporter proteins under an EF-1α promoter. Alongside this improved detection in ENoMi-hNPCs-derived EVs, their surface allows specific immunocapture purification, thereby facilitating TAF1-32i analysis. Using this ENoMi-labeling method, TAF1-32i was demonstrated in EVs released from XDP hNPCs implanted in mouse brains. Post-implantation of ENoMi-XDP hNPCs, TAF1-32i transcript was retrieved in EVs isolated from mouse brain and blood, and levels increased over time in plasma. We compared and combined our EV isolation technique to analyze XDP-derived TAF1-32i with other techniques, including size exclusion chromatography and Exodisc. Overall, our study demonstrates the successful engraftment of XDP patient-derived hNPCs in mice as a tool for monitoring disease markers with EVs.
Keywords: Extracellular vesicles, xenograft model, X-linked dystonia-parkinsonism, TAF1-32i, human iPSC-derived neural progenitor cells, brain, biomarkers, neurologic disease
Graphical abstract
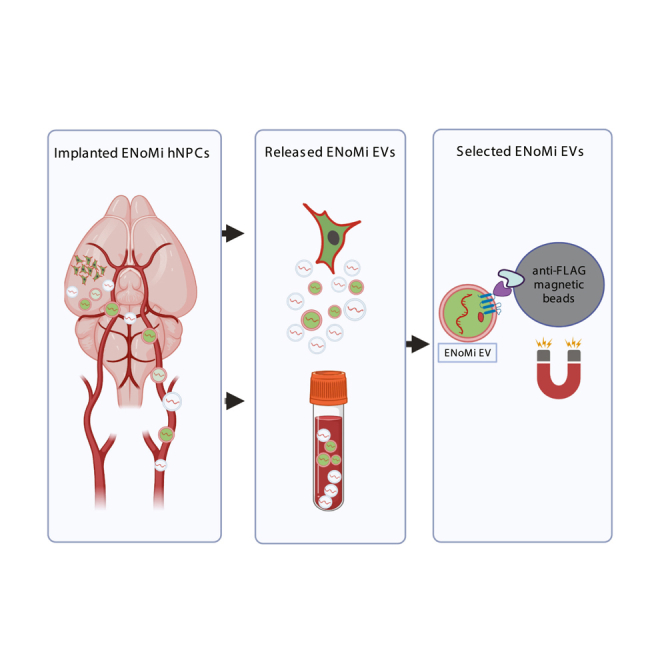
Breyne and colleagues engrafted XDP patient and control iPSC-derived neural progenitors into the striatum of nude mice. TAF1-32i transcripts within released extracellular vesicles were monitored in the brain and biofluids. A reporter on the surface of implanted cell-derived EVs allowed their separation from endogenous EVs and monitoring TAF1-32i transcript signature.
Introduction
Neurological diseases can be chronic in nature and difficult to monitor. Therefore, biomarkers that track subtle changes in disease progression or recovery in response to therapeutic intervention are highly warranted. Mouse models for neurological disorders have been reported, but many lack the developmental background and functional aspects of human brains.1,2,3 Furthermore, biomarker tracking in mice is restricted, in part, due to the small volumes of blood, urine, and cerebral spinal fluid that can be harvested. A breakthrough in the biomarker field has been the utilization of extracellular vesicles (EVs) released into biofluids from diseased tissue, including neurologic diseases.4 One major bottleneck for their use in genetic brain disorders, however, is the abundance of EVs secreted from healthy cells into non-cranial biofluids.
Many attempts have been undertaken to select disease-specific EVs from biofluids, including the antibody capture of EVs expressing markers characteristic of the diseased cell/tissue, e.g., epidermal growth factor receptor for glioblastoma tumors.5 In most of these models, prior knowledge about the disease status is needed. Our group generated an alternative transgenic method to capture EVs derived from a brain region.6 Here, we explored whether this selective capture method of EVs can elucidate cargo that is informative for disease status.
We applied this strategy to model aspects of a central nervous system (CNS) disease, X-linked dystonia-parkinsonism (XDP). XDP is caused by degenerative changes that occur, over time, in the striatum of males7 due to the insertion of a retrotransposon in intron 32 of the TAF1 (TATA-Box Binding Associated Factor 1) gene on the X chromosome.8,9 This insertion causes mis-splicing of intron 32, with the most common RNA splice variant termed TAF1-32i8, which can be detected in EVs derived from the blood of patients using highly sensitive RT-PCR methods.10 Given the difference in the mouse and human gene structure of TAF1, there is, as yet, no genomically accurate transgenic mouse model of XDP. As an alternative, xenograft models have been widely used in tumor studies and for personalized cancer medicine11,12,13; however, when it comes to neurological diseases, this is a relatively new approach.14,15 We implanted XDP patient and healthy control induced pluripotent stem cell (iPSC)-derived neural progenitor cells (hNPCs) transduced with a membrane reporter protein 6 into the striatum of nude mice. These implants enabled monitoring of TAF1-32i transcript in EVs from the brain and in plasma post-implantation. The XDP and control hNPCs were stably transduced with a lentivirus vector encoding a multi-faceted reporter, NoMi,6 under the control of the EF1-α promoter,16 termed ENoMi. The ENoMi construct expresses a surface FLAG-tag for antibody capture, a luciferase marker to monitor implants in vivo by bioluminescence imaging, and two fluorescent markers to identify the cytoplasm and inner membranes of transplanted hNPCs.6
We found that hNPCs derived from XDP patient induced pluripotent stem cells (iPSCs) reported on the status of TAF1 mis-splicing in implanted tissue, as detected in extracellular RNA (exRNA) carried by EVs released in the brain, as well as into blood. Overall, immune capture of EVs in the brain and blood facilitated the tracking of this disease-affiliated marker expressed by implanted X-linked dystonia-parkinsonism (XDP) cells and opens the possibility of future combinatorial molecular diagnostics using brain-derived EVs.
Results
Determining the status of transduced hNPCs 21 days after engraftment in the brains of mice
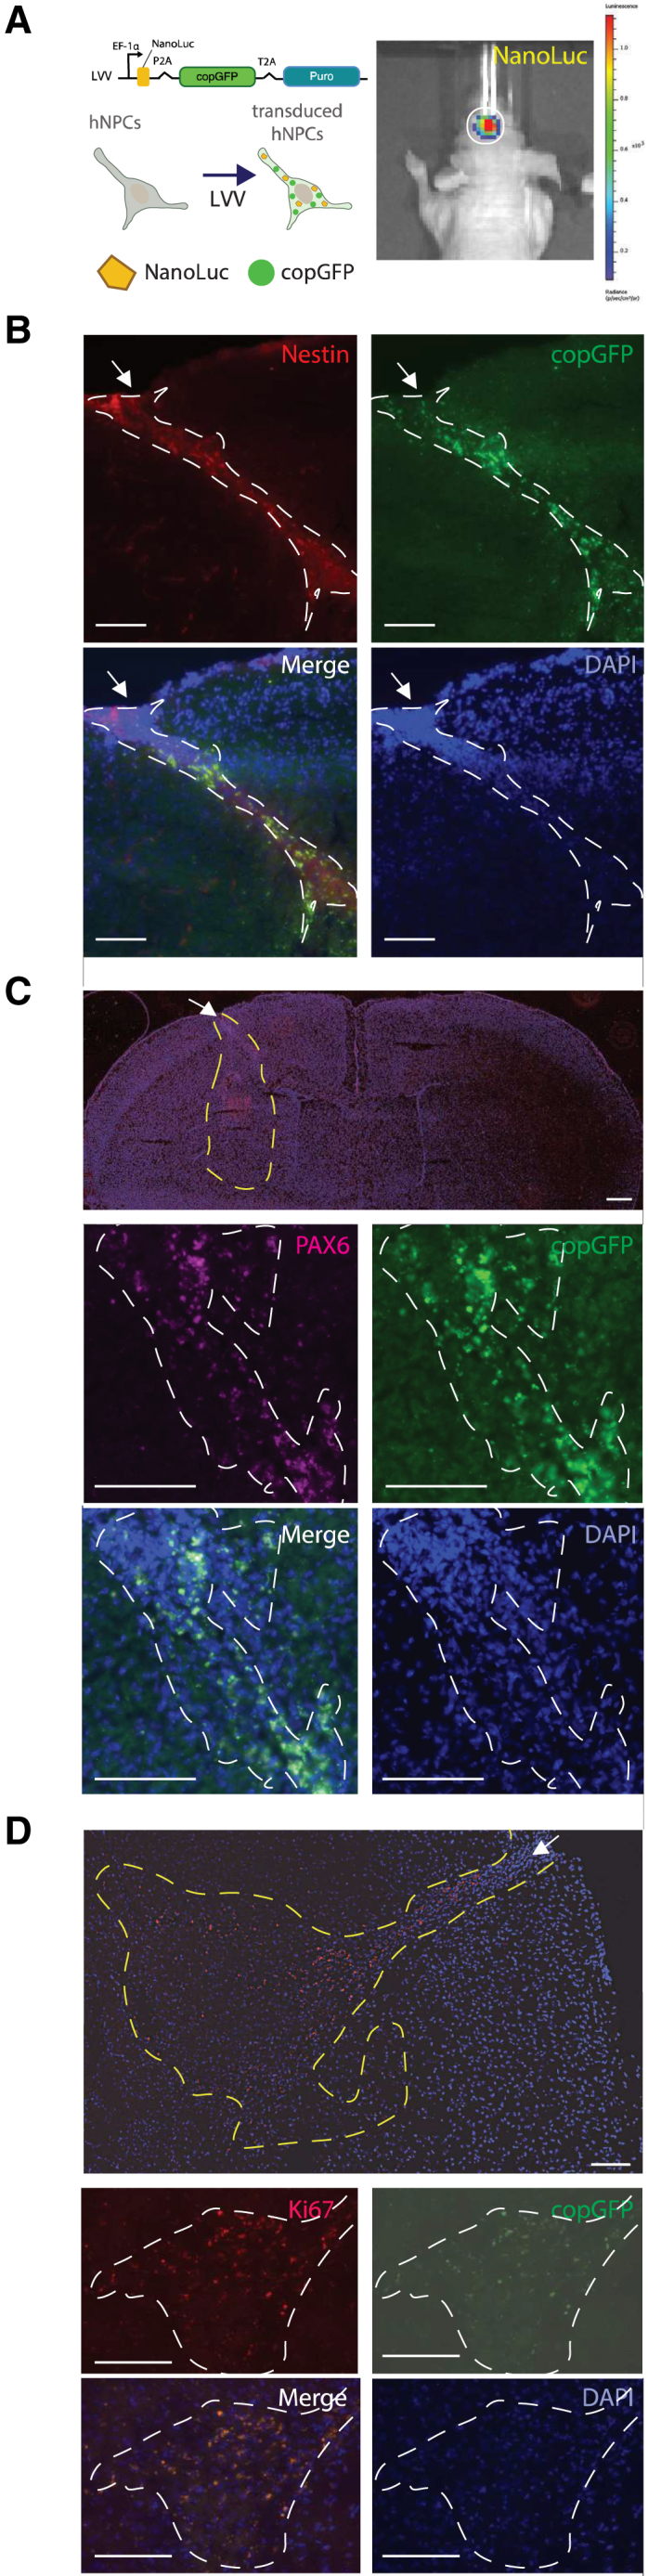
iPSC-derived human neural progenitor cells (hNPCs) were transduced using a lentiviral vector (LVV) to constitutively express a reporter construct (Addgene #73022) that encodes NanoLuciferase (NanoLuc) and copGFP for detection purposes. Stably transduced hNPCs (XDP and Control) were stereotaxically implanted in the striatum of nude mice. Three weeks post-implantation, mice were screened for transgene expression with IVIS after intraperitoneal (i.p.) administration of fluorofurimazine (FFz) to detect NanoLuc bioluminescence (Figure 1A). The mice were killed, and their brains were collected, sectioned for immunohistochemistry, and analyzed for EV content. We distinguished implanted cells from endogenous mouse brain cells by expression of copGFP, detectable by fluorescent microscopy without the need for antibody staining (Figures 1B–1D). Human-specific antibodies against markers of hNPCs, such as nestin17 and PAX6,18 indicated that the implanted cells retained their progenitor status 21 days after implantation into the brain (Figures 1B and 1C). The Ki6719 marker demonstrated that the implanted hNPCs continued to proliferate in the brain (Figure 1D). All three stains (nestin, PAX6, and Ki67) colocalized with the copGFP signal, justifying the latter as a traceable marker for implanted hNPCs in the mouse brain.
Figure 1.
Mouse brain-implanted with human neural progenitor cells retain proliferation and stemness status
(A) Cartoon of lentiviral vector (Addgene #73022) to constitutively express copGFP and NanoLuciferase (NanoLuc) in iPSC-derived hNPCs (left). In vivo bioluminescence imaging in the brains of mice emitted by implanted hNPCs expressing copGFP and NanoLuciferase (NanoLuc). Image acquired with IVIS Living Image software (right). (B–D) Immunohistochemistry on brain sections from hNPC (delineated with dotted line) implanted mice evaluated with (B) stemness marker nestin (red) as well as copGFP (green), DAPI (blue), and merged image. (C) Stemness marker Pax6 (purple), copGFP (green), DAPI (blue), and merged image. (D) Proliferation marker Ki67 (red), copGFP (green), DAPI (blue), and merged image. Analysis was performed 21 days after injecting both patient and healthy control hNPCs into mouse brains. In all panels, an arrow indicates the injection site and scale bars of 100 μm are indicated. Immunofluorescence was imaged with a Keyence BZ-X810 fluorescent microscope. (n = 4 per staining group with representative images shown: B and C from XDP and D from CON).
Detection of XDP-associated TAF1-32i biomarker derived from mouse brains implanted with patient-derived hNPCs
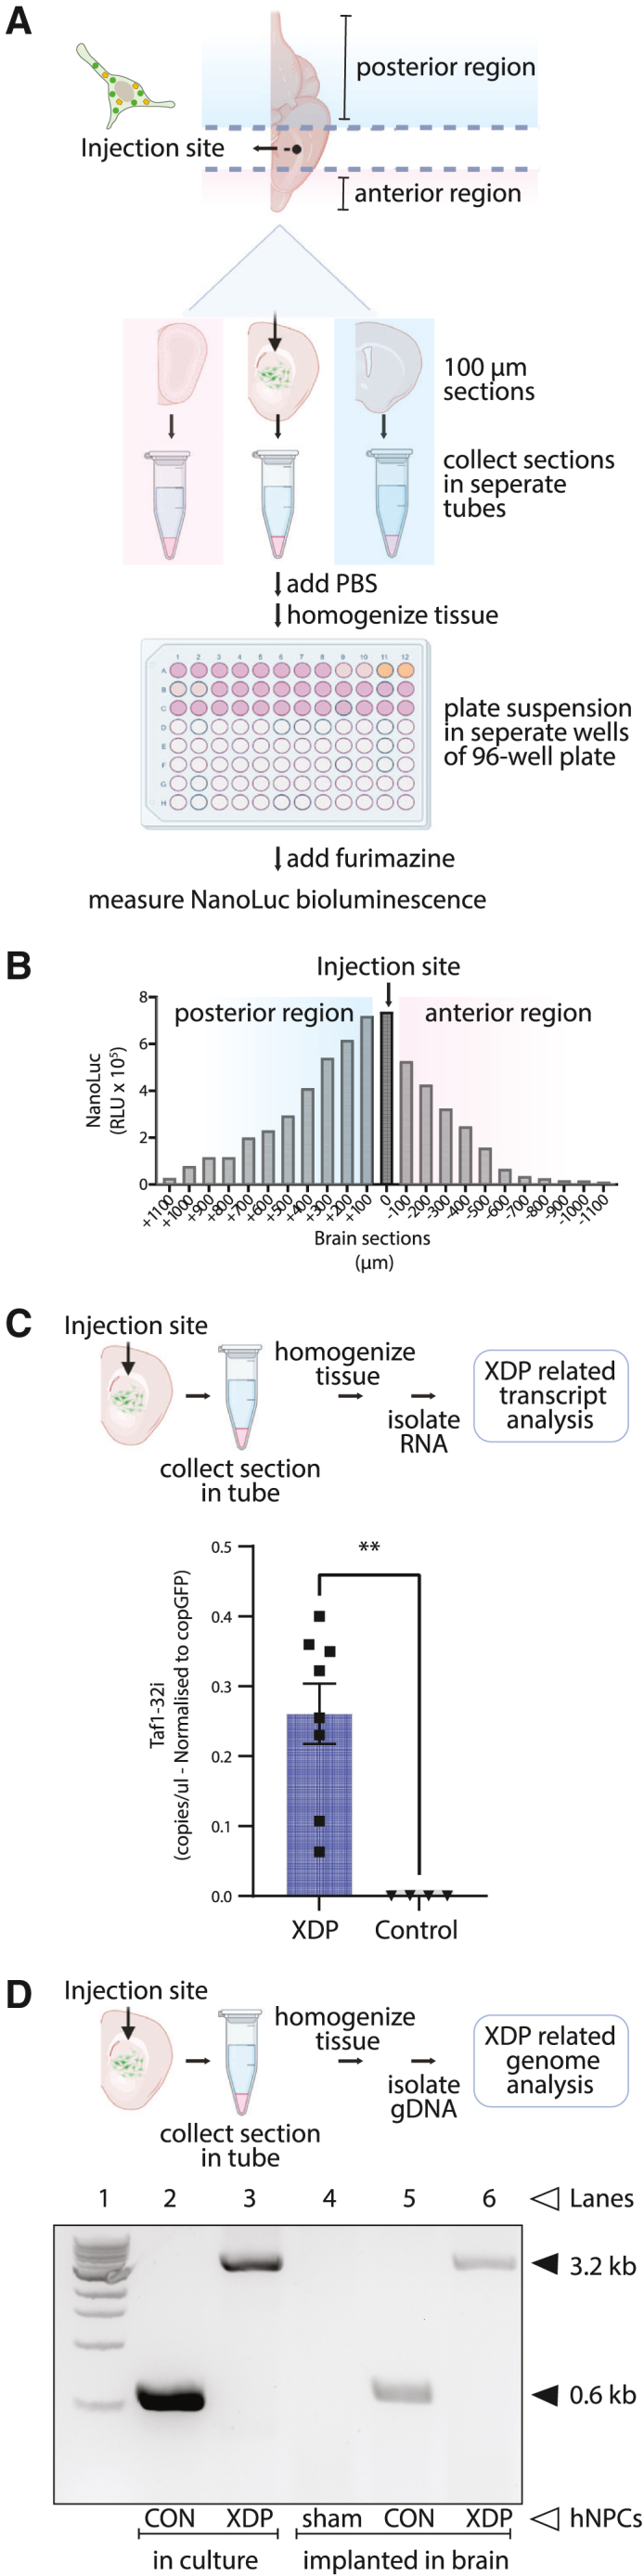
hNPCs from XDP patients and healthy controls were implanted into the left hemisphere of nude mice brains. Twenty-one days later, mice were killed, and their brains were collected for analysis. To locate the injected hNPCs in brains, 100-μm coronal sections of the left hemisphere were collected, homogenized individually, and measured for bioluminescence (Figure 2A). The injected cells were traced back to the sections with peak relative light units (RLU), which was annotated as section 0 (Figure 2B). RNA was isolated from sections with peak RLU for each implanted mouse, and analyzed by droplet digital PCR (ddPCR) analysis with primers and a Taqman probe identifying TAF1-32i transcript.8 Implanted XDP hNPCs at the injection site exhibited a significant 24-fold increase of the TAF1-32i splice variant compared with control hNPCs (p < 0.01) (Figure 2C). The levels of TAF1-32i were normalized to copGFP transcript levels that were measured simultaneously. A representative 2D dot plot that demonstrates how we acquire both TAF1-32i (blue dots) and copGFP (green dots) levels with a ddPCR analysis is shown in Figure S1A. Brain sections with peak RLU were used to extract genomic DNA (gDNA) and assess the SVA retrotransposon insertion using long-range PCR amplification with primers flanking the insertion site.20 As expected, in cultured hNPCs we observed the wild-type 0.6-kb amplicon in control hNPCs (Figure 2D, lane 2) and a 3.2-kb amplicon in XDP hNPCs, representing the wild-type amplicon including the 2.6-kb retrotransposon (Figure 2D, lane 3). These results were replicated with implanted hNPCs (Figure 2D, lanes 5 and 6). In a sham-injected mouse brain control, no amplification of the 3.2-kb amplicon was seen, confirming that the SVA-insertion primers do not detect mouse gDNA (Figure 2D, lane 4).
Figure 2.
Ex vivo detection and analysis of mouse implanted human neural progenitor cells in coronal brain slices
(A) Schematic illustrating the procedure for hNPC analysis post-implantation in mouse brains. Frozen brain slices (100-μm thickness) were collected in the coronal plane in the left hemisphere around the injection site and placed in microcentrifuge tubes. NanoLuc bioluminescence levels in each tube indicated the brain slices that contained the injected hNPCs. (B) Detection of hNPCs in serial brain slices. A peak of NanoLuc luminescence generated by ENoMi-expressing hNPCs corresponded to the region around the injection site. The injection site is annotated as 0 μm. (C) Schematic explaining how levels of TAF1-32i transcript in the implanted area were measured by ddPCR. Measurements were performed on RNA isolated from brain slices with NanoLuc bioluminescence derived from implanted ENoMi-expressing XDP hNPCs (n = 8) or control hNPCs (n = 4). Values and error bars reflect mean ± SEM. Data were analyzed with an unpaired t test. ∗∗p < 0.01. (D) Schematic demonstrating how to detect the SINE-VNTR-Alu (SVA) insertion in the TAF1 gene of implanted hNPCs derived from XDP patients. This procedure was performed hNPCs in culture and implanted in brain slices of mice. The genomic SVA-insertion region was PCR amplified with primers and resolved by gel electrophoresis to confirm the presence of the SVA in XDP hNPCs. First Lane: 1 kb DNA ladder. Second Lane: hNPCs from non-XDP hNPCs in culture. Third Lane: XDP hNPCs in culture. Fourth Lane: Collected brain slices from a sham (PBS)-injected mouse. Fifth Lane: Brain slice containing non-XDP hNPCs. Sixth Lane: Brain slice containing XDP hNPCs. The predicted 3,229-bp SVA product was present in all XDP samples (upper arrow), whereas hNPCs of healthy individuals (control) had a product of ∼599 bp (lower arrow), a difference consistent with the size of this SVA.
The ENoMi reporter is designed to tag construct-expressing cells and EVs produced by them
To report on the status of EVs released from brain-implanted cells, we used LVV transduction to introduce ENoMi into hNPCs from XDP patients and healthy controls. ENoMi is an upgraded version of a previously published vector, NoMi,6 with an upstream EF1-α promoter that sustains transgene expression in progenitor cells (Figure 3A top). The previously published construct was driven by a cytomegalovirus (CMV) promoter, which can be shut down in hNPCs.21 Both constructs consist of a CD63 tetraspanin (TSN) scaffold with a surface-exposed FLAG tag and fluorescent/luminescent proteins to track EVs.6 In addition to CD63, the LVV encodes copGFP separated by a self-cleaving P2A peptide site. Cells stably expressing ENoMi were selected by virtue of a puromycin resistance transgene. Whenever ENoMi is expressed in hNPCs, we expect mCherry (red) expression in the multivesicular body of the cell in addition to the cytosolic copGFP (green) (Figure 3A bottom). Through confocal microscopy, we confirmed this hypothesis as we observed a dotted pattern of inner membrane-associated red fluorescent mCherry and a cytoplasmic non-EV-associated diffuse green fluorescence derived from copGFP (Figure 3B). To study ENoMi association with EVs, size exclusion chromatography (SEC) was performed on conditioned media of transduced XDP and control hNPCs. The first and largest peak (SEC fractions 7 to 11) corresponded to an SEC profile expected from nanosized EVs, and a second, very flattened (10% of the first) peak (SEC fractions 14 to 26) corresponded to smaller molecules, predominantly free protein (Figure 3C). To demonstrate that SEC fractions 7 to 11 are EVs, we analyzed the size of our EVs released from ENoMi-hNPCs with nanoparticle tracking analysis (NTA). The particle size and number from XDP and control ENoMi-hNPCs averaged 238 nm and 221 nm, respectively, and 7.9 × 10⁸ and 2.3 × 10⁹ particles/mL, respectively (differences were non-significant; Figure 3D). We also verified the EV marker CD81 in SEC fractions 7–15 from conditioned media with western blot (Figure 3E). CD81 was only present in the EV fractions 7–11 and not in the protein fractions 12–15.
Figure 3.

A lentivirus ENoMi vector labels extracellular vesicles secreted by brain-implanted human neural progenitor cells
(A) The ENoMi construct encodes for a CD63 TSN membrane scaffold that exposes an FLAG tag peptide and NanoLuc reporter on the EV surface and an mCherry reporter in the EV lumen. The ENoMi transgene is in-frame with two other separate transgenes encoding a fluorescent copGFP protein and antibiotic-selectable puromycin resistance gene. Transcription of this lentiviral construct is initiated by an EF-1alpha promoter, and three separate proteins (ENoMi, copGFP, and puromycin) are produced due to T2A and P2A self-cleavage sites (top) separating them. A schematic of how EVs incorporate the ENoMi construct by their donor hNPC. In hNPCs expressing copGFP in the cytosol, mCherry faces the cytoplasm, while FLAG tag and NanoLuc are located toward the extracellular milieu or the lumen of the multivesicular body (MVB). Next to ENoMi labeling of EVs, ENoMi-EVs incorporate exRNAs from their donor hNPCs. These exRNAs include pathology-related transcripts, such as the XDP hallmark TAF32i or other ENoMi-related transcripts, such as copGFP (bottom). (B) Representative fluorescent microscopy image of hNPCs in culture expressing the ENoMi construct. Upon ENoMi expression, hNPCs express a dotted mCherry pattern in the cytosol, while the copGFP expression is diffuse in the cytosol. Bottom right, DAPI staining of nuclei; bottom left, merged images. Scale bar, 100 μm. (C) Size exclusion chromatography (SEC) of conditioned media from ENoMi-transduced control hNPCs and XDP hNPCs in culture. In the secrete of hNPCs, ENoMi bioluminescence derived from its NanoLuc reporter is detectable in early SEC fractions (F7–F11) where the EVs reside and not so much in the late SEC fractions (F13–F27) that consist of free proteins. The profile is generated with data from four replicates per genotype. (D) Nanoparticle tracking analysis (NTA) of EVs isolated with SEC from conditioned media of ENoMi-transduced control hNPCs or XDP hNPCs in culture. The upper histogram shows the profile of control ENoMi-EVs (mean particle size = 221 nm, and particle number = 2.26 × 10⁹ particles/mL, while the lower histogram illustrates the XDP ENoMi-EVs (mean particle size = 238 nm and particle number = 7.9 × 10⁸ particles/mL). (E) SEC-isolated EVs were verified with an immunoblot against hCD81. SEC fractions 7 to 15 were resolved on a western blot. CD81 appears only in the EV fractions 7 to 11 and not in the protein fractions 12 to 15. (F) Comparison of ENoMi collection of EVs (anti-FLAG tag pulldown) with other magnetic bead-based immune-capture methods using antibodies to TSNs. Bars represent percent NanoLuc luminescence in conditioned media of ENoMi-transduced XDP hNPCs after exposure to anti-FLAG, anti-CD63, anti-CD81, and anti-CD9 coated magnetic beads. Luminescence was measured on beads (immuno-captured EVs - red bars) and in suspension (non-captured EVs - gray bars) after affinity pulldown. Data represent mean ± SEM of n = 3 for each hNPC genotype. (G) Representative electron microscopy image of ENoMi-EVs after isolation from conditioned medium of hNPCs. ENoMi-EVs were isolated from conditioned media mixed with magnetic anti-FLAG-tag immune-capture beads and recovered from the beads with a competing recombinant FLAG tag peptide. Black arrowheads represent eluted ENoMi-EVs after negative stain. Scale bar, 100 nm. (H) Detection of XDP-related exRNA in ENoMi-EVs. Bars represent TAF1-32i RNA levels in conditioned media of ENoMi-transduced hNPCs of XDP patients after exposure to anti-FLAG-tag, anti-CD63, anti-CD81, and anti-CD9 coated magnetic beads. Data representing qRT-PCR analysis of TAF1-32i levels (ratio of immunocaptured Ct values over non-captured Ct values). TAF1-32i was undetectable in control hNPCs. Data represent mean ± SEM of n = 3 for each hNPC genotype.
To isolate only EVs through immuno-capture, conditioned media from ENoMi-transduced hNPCs was precleared to remove any residual cells and concentrated with 100-kDa spin filters. Concentrated media (without SEC) was incubated overnight with anti-FLAG-tag, anti-CD63, anti-CD81, and anti-CD9 magnetic beads. Beads containing bound ENoMi-EVs were separated from media using a magnetic rack, and NanoLuc luminescence was measured in both beads (immune-captured EVs) and supernatant media (non-captured EVs). The highest percent of bioluminescence signal of ENoMi NanoLuc was recovered on the anti-FLAG-tag beads at 70%, with anti-CD63 and anti-CD81 beads being the second highest at around 40%. Anti-CD9 recovered the least at 35% (Figure 3F). ENoMi-EVs isolated from conditioned media with magnetic anti-FLAG-tag immune-capture beads were recovered using a competing recombinant FLAG tag peptide and characterized using electron microscopy (Figure 3G). We also confirmed with SEC fractionation that eluted ENoMi-EVs represented the bioluminescent signal in the EV peak we previously observed with SEC and without anti-FLAG-tag pulldown (Figure S1B). We also analyzed the non-captured EVs by anti-FLAG-tag pulldown with SEC and compared it to the other immune-capture methods (Figure S1C). The NanoLuc signal showed the lowest peak in the non-captured EVs after pulldown with anti-FLAG beads compared with the other TSN-labeled beads. We confirmed the particle size of eluted ENoMi-EVs post-electron microscopy and SEC post-anti-FLAG-tag affinity pulldown in the above-mentioned experiments. However, we want to emphasize that the order of operation is important, as we observed that our technique using anti-FLAG-tag beads is compromised after SEC, reducing the efficacy from 83.9% to 6.2% (Figure S1D).
To analyze TAF1-32i expression in both bead-bound and non-bound EVs, we utilized anti-FLAG, anti-CD63, anti-CD81, and anti-CD9 magnetic bead pulldown followed by ddPCR for bead-bound cDNA. While TAF1-32i was present in all pulldowns from XDP cell-conditioned media, levels were significantly higher in EVs pulled down with anti-FLAG beads, followed by anti-CD63, anti-CD81, and anti-CD9 in decreasing order (Figure 3H). TAF1-32i Ct values in immune-captured bead cDNA were normalized to non-captured supernatant of the beads.
EV-associated TAF1-32i RNA was detected in the plasma of mice implanted with XDP hNPCs
ENoMi-transduced hNPCs from XDP patients and controls were implanted in the striatum of nude mice (Figure 4A). Blood draws were performed at multiple points (days 7, 14, and 21) post-implantation for EV isolation and subsequent TAF-32i transcript analysis. Twenty-one days post-implantation, mice were killed, and EVs were isolated from brain tissue after enzymatic digest and from plasma after cardiac blood draw (CBD). Brain-tissue-derived EVs were isolated with SEC after enzymatic digests of frozen sections of brain tissue collected from the injection site and from a distal site (Figure 4B). Because NanoLuc is incorporated in EVs derived from the brain-implanted ENoMi-transduced hNPCs, we could compare the SEC profile with the one made with ENoMi-culture media (Figure 3C). Interestingly, the NanoLuc signal at the site of implantation was similar to the profile observed in culture media with the highest luminescence peak at fraction 7, corresponding to ENoMi-EVs. Next to NanoLuc, we could also use the FLAG tag of ENoMI to isolate EVs derived from implanted ENoMi-hNPCs and perform a TAF1-32i transcript analysis (Figure 4C). TAF1-32i expression levels were significantly higher (p < 0.05) in XDP-implanted brain-tissue-derived EVs (FLAG tag bound) compared with control-implanted brains where it was undetected. To visualize EVs captured by FLAG tag affinity beads from brain digests, the ENoMi-EVs were eluted from the beads with FLAG tag peptide and imaged by electron microscopy (Figure 4D).
Figure 4.

TAF1-32i XDP signature derived from ENoMi-transduced neural progenitor cells implanted in mouse brains and detected in brain tissue and plasma extracellular vesicles
(A) Schematic of workflow for ENoMi-transduced hNPCs (control and XDP) implantation in nude mouse brain. Post-implantation, EVs were isolated from brain slices and plasma derived from cardiac blood draws (CBDs). exRNA was isolated from brain tissue and plasma of mice to analyze the levels of TAF1-32i and copGFP in EVs. copGFP was used as a unique control for transgene expression by hNPC. (B) ENoMi-EVs were found predominantly near the implantation site of ENoMi-transduced patient-derived hNPCs. Mouse brain slices derived from the hNPC injection site and a distal site were enzymatically digested. Brain digest solutions were separated based on SEC. Representative bars of NanoLuc levels in each SEC fraction of EVs from injected site (red) and EVs from non-injected site (blue) (n > 4 for each group). (C) XDP disease-related exRNA in ENoMi-EVs secreted by ENoMi-transduced patient-derived hNPCs in mouse brain. ENoMi-EVs were isolated from enzymatic mouse brain digests by serial affinity pulldown with magnetic anti-FLAG-tag beads followed by anti-CD81 beads. The non-bound EV condition represents the brain EVs not captured by either anti-FLAG-tag or -CD81. Mice were implanted with either XDP-patient-derived hNPCs (n = 4 mice for each group) or control hNPCs (n = 4). Bar graphs represent TAF1-32i normalized to copGFP RNA levels, both analyzed with ddPCR. N.D. indicates non-detectable levels of TAF1-32i. (D) Electron microscopic image of ENoMi-EVs derived from brain digests. ENoMi-EVs were isolated by pulldown with anti-FLAG-tag magnetic beads, followed by elution with FLAG tag peptide. Black arrows represent eluted EVs after negative staining. Scale bar, 100 nm. (E) SEC-isolated blood EVs secreted by ENoMi-transduced patient-derived hNPCs in mouse brain contain detectable TAF1-32i transcript. On day 21 after implantation, TAF1-32i transcript was detected in mouse plasma (CBD) EVs isolated by SEC injected with XDP hNPCs and not in control hNPCs (n = 4 mice for each cell type). Data were analyzed with an unpaired t test, p < 0.05. (F) TAF1-32i transcript carried by ENoMi-EVs accumulates over time in the blood. Time course on levels of TAF1-32i detected in mouse plasma from CBD on days 7, 14, and 21 after implantation of XDP hNPCs in the brain. EVs were isolated with anti-FLAG-tag beads in mice injected with XDP hNPCs (n = 4 mice for each time point). Two-way ANOVA statistics were performed on data, p < 0.05. N.D. indicates non-detectable levels of TAF1-32i. (G) Electron microscopic image of ENoMi-EVs derived from plasma after negative stain. Plasma EVs from CBD were isolated by pulldown with anti-FLAG-tag magnetic beads and elution with FLAG tag peptide. Black arrows represent eluted EVs. Scale bar, 100 nm. (H) Blood EVs from patient-derived hNPCs in a mouse brain can be isolated from retro-orbital blood draw (ROBD). exRNA was isolated from EVs derived from pooled plasma from ROBD on days 7, 14, and 21. Bar graphs represent TAF1-32i normalized to copGFP levels, both detected with ddPCR. TAF1-32i-containing EVs were isolated with exodisc and subsequently anti-human CD81 capture beads (n = 3 for Control and XDP groups). N.D. indicates non-detectable levels of TAF1-32i.
To detect the release of the XDP biomarker TAF1-32i from implanted cells into the bloodstream, EVs were isolated with SEC from CBD plasma 21 days post-implantation of ENoMi-hNPCs. (Figure 4E). TAF1-32i transcript levels were significantly higher (p < 0.05) in SEC-plasma EVs of XDP-implanted brains compared with control-implanted brains where it was undetected. ENoMi-EVs were isolated with anti-FLAG beads from mouse plasma of CBDs on days 7, 14, and 21 after implantation of ENoMi-hNPCs in the brain (Figure 4F). We observed a significant buildup of the TAF-32i transcript in the blood over time in mice injected with XDP hNPCs. In all plasma samples, TAF1-32i was undetected in control EVs. To visualize EVs captured by FLAG beads from plasma samples, the beads were eluted with FLAG peptide and imaged by electron microscopy (Figure 4G).
We also attempted to analyze EVs derived from brain-implanted hNPCs after retro-orbital blood draw (ROBD). This technique has the advantage that blood can be drawn without the need to sack the mouse. Compared with CBD, only small volumes can be derived from ROBD, limiting the use of techniques such as SEC. We processed the ROBD plasma with exodisc,22 capable of handling low volumes and isolating ENoMi-EVs. The latter has been confirmed with ENoMi conditioned media followed by SEC whereby the peak of NanoLuc signal was retrieved around SEC fraction 7 (Figure S1E). TAF1-32i RNA was detected at low levels in XDP EVs from ROBD processed by exodisc where we distinguished mouse from human-derived EVs using anti-hCD81 beads (Figure 4H). Of note, we also tried to isolate the ROBD ENoMi-EVs with FLAG tag post-exodisc isolation. However, this did not work (Figure S1F), potentially because, similar to SEC preprocessing, exodisc preprocessing compromises anti-FLAG tag capture (Figure S1D).
Characterizing ENoMi-EVs in brain tissue and plasma
Previously, we described that preprocessing of ENoMi-EVs with techniques such as SEC and exodisc compromised FLAG tag binding. To test whether plasma constituents were affecting the binding of ENoMi FLAG tag peptide to the anti-FLAG-tag antibody on the beads, conditioned cell culture media from ENoMi cells was mixed with mouse plasma 2:1 and incubated with anti-FLAG-tag beads (Figure 5A). There was no difference in NanoLuc luminescence on the beads when mouse plasma was added, indicating that the binding of anti-FLAG-tag beads to ENoMi-EVs was not affected by mouse plasma.
Figure 5.
Single-EV characterization of ENoMi-EVs isolated from brain tissue or plasma secreted by mouse brain-implanted ENoMi-transduced human neural progenitor cells on day 21 post-implantation
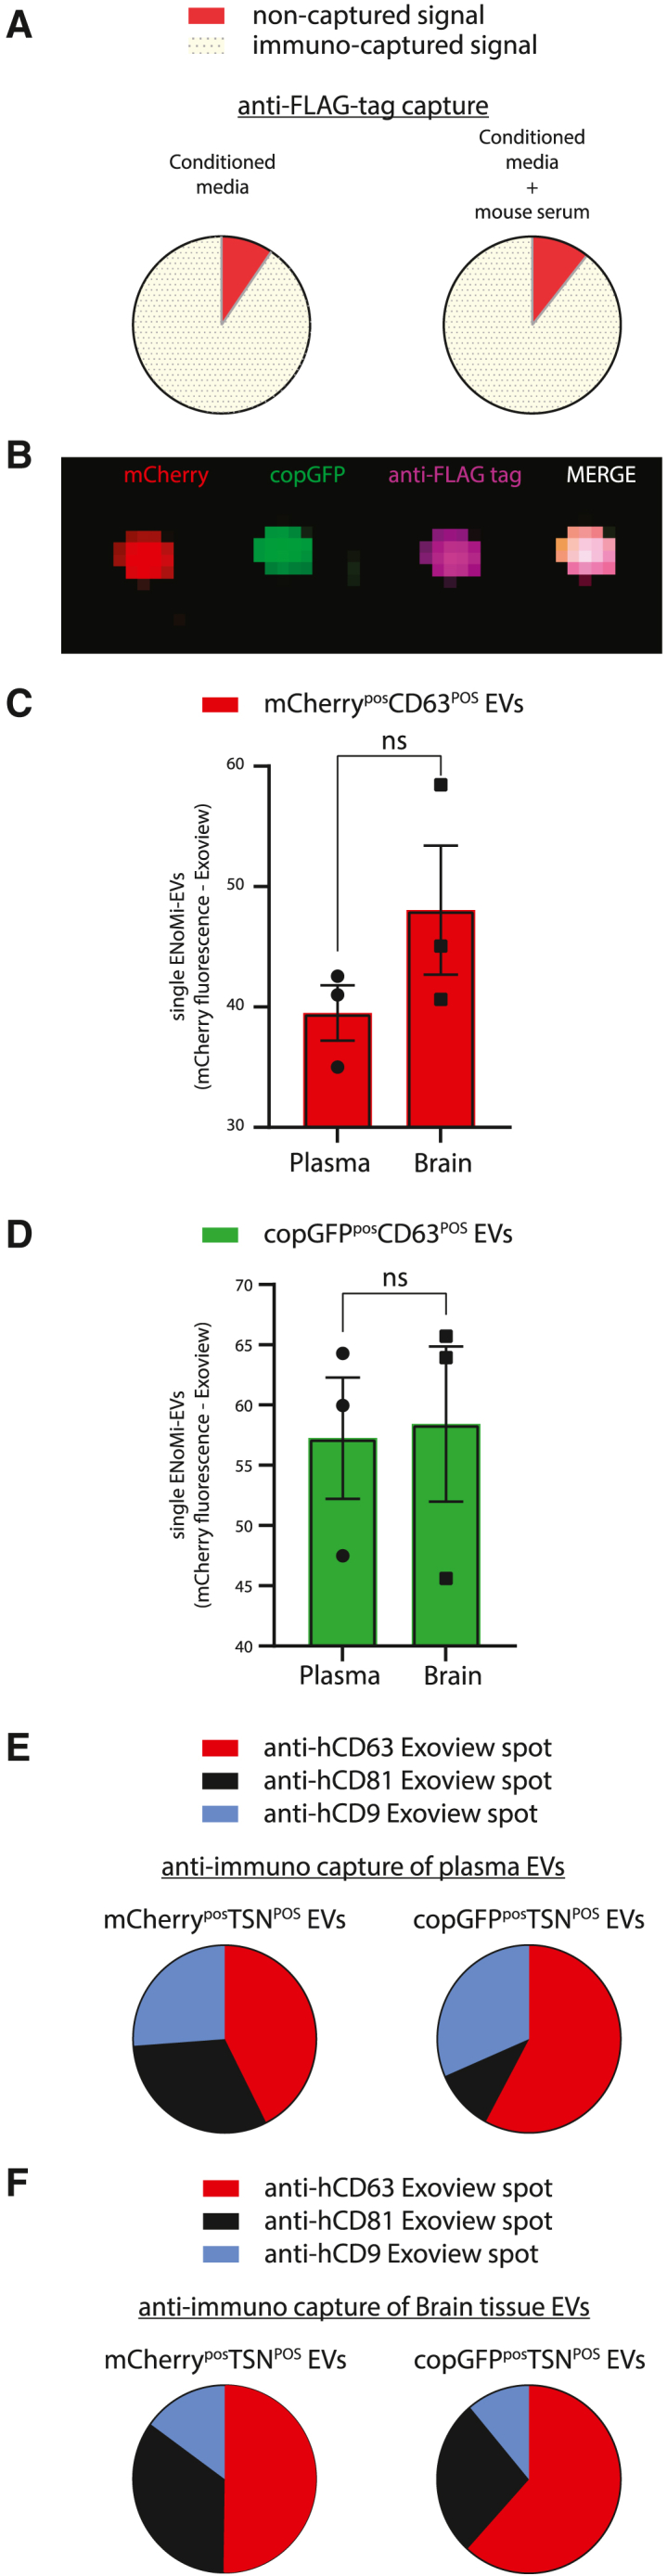
(A) Tethering of ENoMi-EVs from conditioned media to FLAG tag affinity beads. NanoLuc luminescence was measured on magnetic anti-FLAG beads (yellow, 90.5%) and the suspension containing the remaining non-captured EVs (red) (left). The efficacy of the pulldown of ENoMi-EVs by anti-FLAG-tag affinity beads (yellow, 89.4%) in the presence of mouse plasma was tested with NanoLuc luminescence measurements (right). Mouse plasma did not influence the immunocapture of ENoMi-EVs from conditioned media. (B) Colocalization of ENoMi-fluorophores on anti-CD63 spot of ExoView. Representative image of anti-CD63 spot obtained from analysis of brain-derived EVs by ExoView. mCherry (red), copGFP (green), FLAG tag antibody (purple), Merge (pink). (C) Plasma and brain tissue contain ENoMi-EVs. Mice were implanted with ENoMi-expressing hNPCs, ENoMi-EVs were isolated with SEC to analyze red fluorescence-ENoMi with ExoView. On anti-CD63 spots, mCherry-positive EVs were detected in both brain tissue digests and plasma from xerograph mice. Data represent absolute numbers of mCherry-positive EVs attached to individual CD63 antibodies. (D) Plasma and brain contain copGFP-EVs. Similar to (C), green fluorescent-positive EVs derived from the hNPCs xenograft were detected in CD63 EVs derived from brain and plasma of mice. Data represent absolute numbers of copGFP-positive EVs attached to individual CD63 antibodies. Data were analyzed with an unpaired t test. (E) Tetraspanin (TSN) analysis of plasma ENoMi-EVs. Distribution of TSNs of mCherry (left) or copGFP (right) positive EVs in plasma of mice with an ENoMi-expressing hNPC implant. The majority of mCherry and copGFP-positive plasma EVs were detected in anti-CD63 spots of the ExoView chip. Data represent absolute numbers of EVs attached to individual anti-CD63 (red), -CD81 (black), and -CD9 (blue) and are normalized to 100%. (F) TSN analysis of brain-tissue-derived ENoMi-EVs. Similar to (E), mCherry-positive EVs (left) and copGFP-positive EVs (right) were analyzed with ExoView on anti-CD63, anti-CD81, and anti-CD9 tethered spots. Data represent absolute numbers of brain EVs attached to individual anti-CD63 (red), -CD81 (black), and -CD9 (blue) and are normalized to 100%. ExoView data of (B)–(F) were generated with n = 3.
To determine whether the EV-protected cargo remained intact when EVs were released from hNPCs into the mouse bloodstream, plasma EVs isolated from SEC fractions 7–11 were applied to an ExoView Tetraspanin Chip R100 (NanoView Biosciences, Brighton, MA). The chip tethers single EVs to a surface with arrayed antibodies against CD63, CD81, CD9, and immunoglobulin (Ig)G (negative control). A Human ExoView TSN kit was used to ensure we only detected the EVs released by the hNPCs implanted in the mouse brains and not confounding mouse EVs retrieved in the plasma. A representative anti-CD63 spot obtained from analysis of brain-tissue-derived EVs showed a clear colocalization (pink) due to the merge of fluorescent signal of ENoMi mCherry (red), copGFP (green), and anti-FLAG-tag (purple) on a single vesicle (Figure 5B). Both plasma and brain-tissue-derived EVs contained copGFPPOS and mCherryPOS as quantified on a hCD63-binding spot of the ExoView chip (Figures 5C and 5D). We observed differences between TSN-binding spots. Based on ENoMi-mCherry fluorescence distribution seen post-antibody capture, plasma and brain ENoMi-EVs isolated by SEC had a higher antibody capture (for both fluorophores) with human CD63 antibodies as compared with the other TSNs (Figures 5E and 5F).
Discussion
The current lack of reliable preclinical mouse models for XDP, as well as many other neurological disorders, defines an urgent need to develop alternative methods to track disease status in an in vivo system. EVs from blood plasma/serum and cerebral spinal fluid carry potential biomarkers for many diseases,23,24 including cancer,25 liver diseases,26 coronary artery disease,27 and neurological diseases28,29,30,31 We implanted XDP patient and control hNPCs derived from iPSCs in the brains of nude mice and were able to track an XDP EV-associated biomarker in the brain tissue and plasma. The first step was to characterize the survival and stemness status of implanted hNPCs in mouse brains. In a previous study, implanted hNPCs remained viable in the nude mouse brain for a period of at least 14 days.6 To test therapeutic options (RNA-based and/or AAV-based gene therapies) in future studies with an XDP-xenograft model, it was important to extend this period and find out if longer times were feasible to maintain implanted cells in a mouse brain. Stem cell transplantation is being pursued for therapeutic purposes in patients.32,33,34,35 In this study, we adapted this strategy by implanting a xenograft of XDP hNPCs in the brains of immune-compromised mice. hNPCs were maintained in the brain for at least 21 days, enough time to allow for any future applied therapy to be monitored. In 2019, Vogel et al. performed a study for in vivo monitoring of hNPC grafts.36 They showed that neuronal markers appeared after 4 weeks of implantation, which supports our choice of a 21-day timeline prior to differentiation, as TAF1-32i expression varies in different types of iPSC-derived cells. Goldman et al. engrafted human glial progenitor cells to generate parenchymal astrocytes, with the recipient brains generating human glial chimeric mouse brains.37 Such chimeric brains provide a fundamentally new tool by which to assess the pathogenesis of neural cells derived from hereditary human CNS disease states. In their review, Nair et al. state that humanized mouse models could aid in addressing human genetics and cell fate.38 We focused on the implanted hNPCs’ potential to continue to divide in the mouse brain, whether they differentiate, and if they continue to express mis-spliced XDP-associated TAF1 mRNA products for extended periods. In this study, we euthanized mice at 21 days post-implantation and analyzed their brains and plasma. The implanted cells, labeled with copGFP-NanoLuc using an LVV, were engrafted and divided during 21 days, as revealed by immunohistochemistry and IVIS, including staining for the proliferation marker Ki67. The cells also retained their progenitor state, as indicated by the PAX6 and nestin stainings, which are markers of hNPCs. We also confirmed that TAF1-32i transcript expression and SVA insertion remained present in the brain slices with XDP hNPCs at 21 days post-implantation.
In 2018, Aneichyk et al. demonstrated that the presence of a unique SVA retrotransposon in intron 32 of the TAF1 gene in XDP patient cells resulted in mis-splicing of this intron. Thus, TAF1-32i is retained in the mRNA in much higher levels in XDP patient-derived cells as compared with controls.8 In a previous study, we showed that XDP patient-derived NPCs and EVs derived from them, as well as XDP plasma EVs, carried this disease-specific splice variant TAF1-32i at higher levels relative to controls, confirming that this variant could serve as a biomarker for XDP disease status.10 Here, we used the hNPCs from that study to generate an in vivo preclinical XDP mouse model. The ENoMi expression cassette, delivered by an LVV to iPSC-derived NPCs in culture, was used to track secreted hNPC EVs in brain tissue and in the plasma of mice. The high efficiency of this NoMi reporter construct to trace and track brain-derived EVs was demonstrated by Rufino-Ramos et al.6 Here, we cloned the NoMi construct into a new backbone with an EF1-α promoter, which drives sustained, high-transgene expression in NPCs and neuronal stem cells compared with the CMV promoter.21,39 NanoLuc bioluminescence has been widely used for the quantification of EVs both in vitro and in vivo.40,41 In this study, NanoLuc is present in the ENoMi reporter and was used in many ways. We showed high levels of NanoLuc bioluminescence associated with EVs from conditioned media of transduced ENoMi-hNPCs (XDPs and controls), as indicated by the particle size separation method, SEC. We also used NanoLuc to demonstrate affinity pulldown of ENoMi-EVs using magnetic beads coated with an anti-FLAG-tag antibody. A high percentage (70%) of NanoLuc luminescence in conditioned media was bound to the magnetic beads, indicating successful pulldown of ENoMi-EVs. Some NanoLuc signal also appeared in the media separated from the beads, which could indicate that not all ENoMi-EVs were bound to the beads after a single incubation or that some NanoLuc was proteolytically cleaved off the surface of the EVs.43 However, this is unlikely as SEC profiles of ENoMi-hNPC conditioned media demonstrated a low peak in the free protein fractions. A follow-up study might overcome this by moving the FLAG tag to the second loop. However, this second loop integration could compromise the incorporation of the construct into EV membranes.42 More likely is that the conditions of FLAG tag binding to its antibody are not optimal, as can be derived from our SEC and exodisc experiments. In these experiments, NanoLuc, which is situated in the EV’s extracellular loop, appeared in the correct fractions (F7-11) after SEC and exodisc but inhibited FLAG tag capture. ENoMi is not only a tool for pulling down particular EV populations, but it can also aid in assessing the outer surface and the inner lumen of the EVs with NanoLuc and mCherry, respectively. However, it has to be noted that these protein reporters have their limits, as we were unable to detect NanoLuc or mCherry in the plasma of our mice. Nevertheless, magnetic anti-FLAG beads mixed with cardiac plasma contained detectable levels of copGFP mRNA, which means that our immunocapture beads could attach small numbers of ENoMi-EVs from the plasma, but not sufficiently enough to detect NanoLuc or mCherry. The latter detection limit, however, could be overcome by analyzing single plasma EVs with less high-throughput techniques such as ExoView. Being able to assess exRNA associated with EVs is important for studying disease-related biomarkers. TAF1-32i RNA is a rare transcript, even in some XDP cell types, so it requires highly sensitive methods like ddPCR to be detected in EVs. Being able to detect expression of TAF1-32i after anti-FLAG magnetic bead pulldown showcases ENoMi as a convenient tool to detect cell-specific EV-associated biomarkers in biofluids. We performed expression analysis on the hNPC-derived exRNA isolated from the XDP EVs captured with anti-FLAG-tag, anti-CD63, anti-CD-81, and anti-CD9 beads. The highest levels of TAF1-32i were found with anti-FLAG-tag pulldown followed by anti-CD63 beads. These differences between the methods correlated with the NanoLuc signal on each bead, indicating that enriching for ENoMi-EVs facilitates the isolation of this XDP-relevant transcript. Similarly, compromising the pulldown of ENoMi-EVs by prior isolation with SEC of exodisc, jeopardizes the numbers of EVs pulled down by anti-FLAG-tag beads and thus compromises TAF1-32i detection. Future studies will determine if TAF1-32i-carrying EV species differ between sample sites.
Altogether, our results show that it is possible to generate a cellularly humanized preclinical mouse model to study aspects of XDP using patient-derived hNPCs engrafted into immune-compromised mouse brains. This preclinical XDP model allows monitoring of the XDP biomarker TAF1-32i in EVs from brain tissue and biofluids and opens the door to tracking the effectiveness of different therapies for XDP. The detection of the SVA insertion by PCR in the implanted patient hNPCs also provides the opportunity to study gene-editing-based therapies in vivo. The study of the differentiation, function, and proliferation state of patient-derived hNPCs in the brain could provide an important tool for precision medicine, in which the behavior of each individual patient cell line could be assessed in an in vivo setting. EVs from the transduced hNPCs implanted in the mouse brain enter the bloodstream and provide a tool for monitoring human EV biomarkers. To be able to use TAF1-32i as a biomarker for monitoring any future therapies for XDP disease, it was essential to detect it in the brains of mice after implanting the XDP hNPCs. This was successfully performed by sectioning the brain and identifying the site of injection to retrieve the maximum number of implanted cells and EVs derived from them and to avoid diluting the TAF1-32i with mouse brain RNA. We also showed that FLAG tag immunoprecipitation of our ENoMi reporter is compromised after processing with SEC and Exodisc. Our study builds upon Al Ali et al., where we reported expression levels of TAF1-32i as 25-fold higher in XDP-derived hNPCs compared with controls in fibroblasts, iPSCs, and neural stem cells (NSCs),8 as well as in EVs from patient plasma.10 In addition to analyzing gene expression by extracting RNA, implanted cells were used for gDNA extraction and detecting the SVA insertion XDP phenotype.10
In conclusion, our study demonstrates that a xenograft XDP preclinical model can be generated by implanting human iPSC-derived NPCs from patients, and disease-related parameters can be retrieved in EVs secreted from the implanted cells.
Materials and methods
Cell culture
iPSC-derived human neural progenitor cells (hNPCs) were generated from XDP patients and ethnically matched controls as previously described.10 NPCs were grown on Geltrex-coated (ThermoFisher Scientific, Waltham, MA, USA) tissue culture ware in Dulbecco’s Modified Eagle Medium/Nutrient Mixture F-12 (DMEM/F12) (ThermoFisher Scientific) supplemented with 2% B27 (ThermoFisher Scientific), 20 ng/mL epidermal growth factor (PeproTech # AF-100-15, Cranbury, NJ, USA), 20 ng/mL fibroblast growth factor (Millipore Sigma, Burlington, MA, USA), 0.2% heparin (STEMCELL Technologies #07980, Cambridge, MA, USA), and 1% penicillin-streptomycin (Corning #30-002-C, Manassas, VA, USA). HEK293T cells from M. Calos, Stanford University, Stanford, CA, were cultured using Dulbecco’s Modified Eagle Medium supplied with 10% fetal bovine serum (Sigma-Aldrich, St. Louis, MO, USA) and 1% penicillin-streptomycin (Corning #30-002-C). Cells were routinely tested for mycoplasma contamination (Mycoplasma PCR Detection Kit, abm G238, Richmond, Canada) and found negative.
ENoMi cloning and lentiviral vector production
ENoMi construct was produced by doing a high-fidelity amplification (Forward: CAAAGTTTTTTTCTTCCATTTCAGGTGTCGTGAGCAATTGGATCCACCATGGCGGTGGAAGGAGGAATGAAA, reverse: GCTTCAGCAGGCTGAAGTTAGTAGCTCCGCTTCCAAGCTTCTTGTACAGCTCGTCCATGCCGCCGG) of the NoMi (NanoLuc outside and mCherry inside) construct. NoMi, which was originally produced with a CMV promoter by Rufino-Ramos et al.,6 was cloned into a new backbone regulated by an EF1-α promoter (pCDH-EF1-NanoLuc-P2A-copGFP-T2A-Puro), which was a gift from Dr. Kazuhiro Oka (Addgene plasmid #73022, Watertown, MA, USA), using Gibson assembly (New England Biolabs #M5510A, Ipswich, MA, USA). Complete plasmid sequencing was carried out utilizing next-generation sequencing technology (MGH CCIB DNA Core) to check plasmid integrity.
LVVs encoding ENoMi and copGFP-NanoLuc backbone (pCDH-EF1-NanoLuc-P2A-copGFP-T2A-Puro) were produced in HEK293T cells; 1 × 10⁶ seeded cells were transfected with psPAX2 (Addgene #12260) and pMD2.G (Addgene #12259) packaging plasmids and the transgene cassette was flanked by AAV long terminal repeats. Twenty-four hours after transfection, cells were washed with 1x phosphate buffered saline (PBS) (Boston BioProducts # BM-220, Ashland, MA, USA) and provided with fresh medium. Seventy-two hours after transfection, the medium was collected and filtered with 0.2-μm filters (Millipore Sigma, #SLGP033RS) followed by ultracentrifugation at 70,000 × g. The pellet was resuspended in 250 μL 1% bovine serum albumin (Sigma #A8412, Burlington, MA, USA) in PBS and stored at −80°C.
Cell transduction
Stably transduced fluorescent cell lines were generated by transducing hNPCs with ENoMi lentivirus (4.4 × 10⁴ transducing units [TU]/mL for 2 × 10⁵ cells). Cells were incubated with lentivirus for 72 h, after which transfection media was removed and fresh media was added containing 1 μg/mL puromycin (Invivogen, #ant-pr-1, San Diego, CA, USA) to select for transduced cells. After being maintained with puromycin for 2 days, the stably transduced cells were cultured and expanded under standard conditions for no more than 20 passages.
Luminescence assay in vitro
To analyze the expression of the ENoMi construct, NanoLuc was measured in the media, EVs, and cells. Furimazine (Nano-Glo Luciferase, Promega, Madison, WI, USA) was diluted 1:500 in 1x PBS. Samples of 100-μL aliquots were loaded into 96-well white bottom Bio-one plates (Greiner, Monroe, NC, USA) and 50 μL diluted substrate was added to the samples and incubated with the reagent for at least 3 min prior to reading on the luminometer (Synergy H1 Hybrid Multi-Mode Reader, BioTek, Oak Ridge North, TX, USA).
SVA PCR
The SVA PCR on genomic DNA was carried out based on the method used by Ito et al. in 2016.20
Animal experiments
All animal experimental protocols were approved by the Massachusetts General Hospital Institutional Animal Care and Use Committee. NU/NU nude mice (Charles River Laboratories, Wilmington, MA, USA) were maintained with unlimited access to water and food under a 12-h light/dark cycle. Male mice ranging from 8 to 10 weeks in age were randomly assigned to experimental groups.
Stereotaxic injection into the mouse brain
Adult mice were anesthetized using 2.5% isoflurane44 in 100% oxygen via a nose cone. In reference to the bregma, mice were stereotaxically injected into the left striatum with these coordinates: anteroposterior: +0.52 m, medial-lateral: +2.00 mm, dorsal-ventral: −2.5 mm. A total of 200,000 transduced hNPCs in 2 μL Opti-MEM were implanted at an infusion rate of 0.25 μL/min using a 10-μL 26s Gauge Hamilton syringe (Reno, NV, USA). Control animals were injected with 2 μL PBS. Five minutes after the infusion was completed, the needle was retracted 0.3 mm and allowed to remain in place for an additional 3 min prior to complete removal from mouse brains.
In vivo bioluminescence analysis
Survival of the transplanted hNPCs was initially assessed by NanoLuc in vivo bioluminescence imaging using Nano-Glo in vivo substrate from Promega. The FFz substrate was reconstituted by adding 1000 μL 1x PBS to the lyophilized substrate; 100 μL of working solution (0.44 μmol FFz) was injected i.p. into mice. Imaging was acquired 5 min after injection with a Xenogen IVIS 200 Imaging System (PerkinElmer, Waltham, MA, USA), and analysis was performed using Living Image software 4.3.1 (PerkinElmer).
Retro-orbital blood draw
At two time points post injection of transduced hNPCs into mouse brains (day 7 and day 14), the retro-orbital vascular sinus was punctured using a capillary tube (Clay Adams #4619, New Jersey, USA) and around 50 μL of blood was collected into EDTA treated tubes (BD Microtrainer tubes #365974, Franklin Lakes, NJ, USA).
Mouse brain tissue preparation for immunohistochemistry, bioluminescence, RNA extraction, RT-PCR, and ddPCR
Twenty-one days after injection of transduced hNPCs into mouse brains, 4–5 mice/group were euthanized under deep anesthesia with a mixture of xylazine and ketamine (10 mg/kg and 100 mg/kg, respectively).45 For immunohistochemistry, mice were cardially perfused with 1x PBS and brains were collected and frozen at −80°C using embedding medium-optimal cutting temperature compound (Neg-50 #6502, Expredia, Kalamazoo MI, USA) for later coronal sectioning onto glass slides. Mouse brains were coronally sectioned on a freezing cryostat (Leica Microsystems, CM3050S, Deer Park, IL, USA) into 16-μm-thick sections and mounted on slides.
For bioluminescence assays and ddRT-PCR, only the left hemispheres (site of hNPC injection) of mouse brains were collected and snap frozen on dry ice to maintain RNA integrity. Brain tissue (around the injection site) was coronally sectioned with 100-μm thickness on a freezing cryostat and collected in individual tubes. Each 100-μm brain section was later homogenized in 200 μL Nano-Glo Luciferase assay buffer (Promega); 30 μL was used for reading bioluminescence and the rest of the sample was used for RNA extraction and downstream expression analysis.
Isolation of brain EVs from injected site
The mouse brain was collected after PBS perfusion and stored at −80°C until further processing. The frozen tissue was sliced at −20°C to generate 100-μm tissue sections.46,47,48 Twenty-five sections from each sample were collected. The tissue pieces from each sample were weighed and incubated with 23 U/mL collagenase type D (Sigma-Aldrich #11088866001, Mannheim, Germany) in 1x Hank’s Balanced Salt Solution (Gibco, #14025-092, Grand Island, NY, USA) (at ratio of 8 μL/mg tissue) in a shaking incubator (RT for 20 min). After 10 min of incubation, samples were pipetted up and down twice and incubated for another 10 min, followed by addition of ice-cold 10x inhibition buffer containing 10x protease inhibitors and 10x phosphatase inhibitors (ThermoScientific #78441, Rockford, IL, USA) in PBS with a final concentration of 1x inhibition buffer. The digested brain extracts were subjected to the following centrifugation steps at 4°C: 300 × g for 5 min, 2,000 × g for 10 min, and 10,000 × g for 30 min. One milliliter supernatant was then incubated with 5 μL DNase (Zymo research #E1009-A, Irvine, CA, USA) for 10 min and then filtered with a 0.22-μm filter (Millipore #SLGPM33RS Tullagreen, Carrigtwohill, Co. Cork, Ireland).
The 10,000 × g supernatant was loaded onto qEV Original SEC columns (IZON Sciences, Medford, MA, USA) and 24 fractions (500 μL each) were collected by elution with PBS using the Automatic Fraction Collector (AFC) according to the manufacturer’s protocol. One hundred microliters of each fraction was analyzed for NanoLuc luminescence intensity in the plate reader (Synergy H1 Hybrid Multi-Mode Reader, BioTek, Oak Ridge North, TX, USA). The five fractions with highest luminescence were used for further analysis.
Immunohistochemistry
Transduced hNPC injected brain sections were post-fixed with 4% PFA for 20 min, then washed with 1x PBS three times and incubated 30 min with blocking solution (PBS with 0.1% Triton X-100 (USB #22686, Cleveland, OH, USA)) containing 10% normal goat serum (Sigma). Sections were then incubated overnight at 4°C in blocking solution with primary antibodies: rabbit anti-PAX6 (Abcam, ab5790, 1:50, Waltham, MA, USA); mouse anti-nestin (Abcam, ab22035, 1:100), rabbit anti-Ki67 (Abcam, ab15580, 1:1000). Sections were washed with PBS and incubated for 1 h at room temperature with the appropriate secondary antibodies: goat anti-mouse IgG Alexa Fluor 546 (ThermoFisher Scientific, A-11003, 1:1000) and goat anti-rabbit IgG TRITC (Abcam, ab6718, 1:1000) diluted in blocking solution, or with secondary antibody only. The sections were washed with 1x PBS and mounted on glass slides with Vectashield Antifade Mounting Medium (Vector Labs, H-1000, Burlington, CA, USA). Immunofluorescence was visualized and imaged with a Keyence BZ-X810 microscope (Itasca, IL, USA).
Bioluminescence assays
NanoLuciferase expression in EVs, beads, and brain sections were analyzed with the addition of FFz (Nano-Glo Luciferase, Promega) diluted 1:500 in 1x PBS. Samples were loaded into white 96-well culture plates (Lumitrac 200). EV samples from SEC and beads were incubated with the reagent for at least 3 min prior to reading on Synergy H1 Hybrid Multi-Mode Reader (BioTek). For brain sections from hNPC-implanted brains, a kinetic curve was generated by taking a series of measurements to identify the peak emission and signal plateau. The section that emitted the highest bioluminescence was identified as the one with the highest population of injected hNPCs and underwent DNA isolation for PCR and RNA expression analysis.
EV isolation from mouse plasma or ENoMi conditioned media via exodisc
Fifty microliters of cardiac plasma and/or ROBD plasma was diluted 5-fold with PBS. One milliliter of PBS was injected through the sample inlets of Exodisc (Lab Spinner #ExDC-21D201(G), UNIST-gil, Eonyang-eup, Ulju-gun, Ulsan, Korea). Exodisc was spun on the Lab Spinner Exo Discovery (Lab Spinner #EX-R1001, UNIST-gil, Eonyang-eup, Ulju-gun, Ulsan, Korea) after choosing the Exodisc-L/Prime option for 90 s. The diluted sample was injected through the sample inlet. The Exodisc was spun on Exodisc-L/Enrich for 5 min; 500 μL of PBS was added to the sample chamber and Exodisc was spun twice on Exodisc-L/Wash for 15 min. Once the sample chamber was empty, the sealing tape on the elution hole was removed and 10 μL PBS was added to fill the air bubble space. Around 100 μL of EVs were collected from the elution hole. Forty milliliters of ENoMi conditioned media (48 h) was filtered using 0.8-μm filters (Millipore Sigma, SLAAR33SS) and concentrated using 100 kDa AmiconUltra-15 Centrifugal filters. EVs were isolated using the same Exodisc procedure described for the plasma.
Incubation with beads
Conditioned media, plasma, or previously isolated EVs were incubated directly with either anti-FLAG (ThermoFisher, #A36797), anti-CD63 (#63CB-25, Immunostep, Ann Arbor, MI, USA), anti-CD81 (#81CB-25, Immunostep), or anti-CD9 (#9CB-25, Immunostep) magnetic beads overnight at 4°C on a Hula mixer. Beads were pulled down with the magnetic tube stand, washed 3× with PBS, and used for bioluminescence reading, RNA extraction, and/or electron microscopy.
RNA extraction, cDNA synthesis and RT-PCR
RNA extraction was performed from cultured NPCs, mouse brain-injected NPCs, and immuno-labeled beads following the protocol recommendations of the miRNeasy Micro Kit (Qiagen, #217084, Germantown, MD, USA). Isolated RNA samples were quantified by Nanodrop (ThermoFischer Scientific) and Bioanalyzer 2100 (Agilent Technologies, Santa Clara, CA, USA). RNA samples were reverse transcribed using the Superscript IV VILO (11756050, ThermoFisher Scientific).
Western blot
ENoMi cultured media was concentrated using 100 kDa AmiconUltra-15 Centrifugal filters and EVs were isolated using SEC. Fractions 7–15 were individually concentrated using 100 kDa AmiconUltra-0.5 centrifugal filters. Twenty microliters from each fraction was mixed with Laemmli SDS-Sample buffer (Boston BioProducts) and loaded and resolved by electrophoresis on NuPage 4%–12% Bis-Tris polyacrylamide gels (ThermoFisher Scientific) in NuPage MES SDS Running Buffer (ThermoFisher Scientific). After transfer onto nitrocellulose membranes using the iBlot 2 (ThermoFisher Scientific), samples were blocked for 1 h at room temperature in 5% non-fat dry milk (Labscientific, Danvers MA) in Tris-buffered Saline (pH = 7.4) with 0.05% Tween 20 (TBS-T) and probed with primary antibody hCD81 at a 1/1,000 dilution (Cell Signaling Technologies, #56039, Danvers, MA, USA) overnight on a shaker at 4°C. After washing three times with TBS-T for 10 min, membranes were incubated 1 h at room temperature with secondary antibody donkey-anti-rabbit immunoglobulin (ThermoFisher Scientific, #31458). Membranes were developed with Pico staining (ThermoFisher Scientific) and imaged on an Azure Biosystems C300 gel imager.
NTA measurement with nanosight LM10
EV samples were diluted with 1x PBS to a final volume of 500 μL. Settings were adjusted according to the manufacturer’s software manual (NanoSight LM10 and NTA 3.2, Malvern, UK): camera level was increased until all particles were distinctly visible. The detection threshold was set between 5 and 10. Autofocus was adjusted so that indistinct particles were avoided. For each measurement, five 1-min videos were captured, after which all the videos were analyzed by the in-built NanoSight Software NTA 3.2.
Digital droplet PCR
To evaluate levels of expression of TAF1-32i, a preamplification step was performed with TAF1-32i-preamplification primers (forward 5′ ➔ 3′: ACATCTCCAAGCACAAGTATCA) and (reverse 5′ ➔ 3′: GTAATGTACCAATATAAATTTCCTGGTTT, amplicon size 208 base pairs [bp]) to amplify a region of 208 bp spanning the TAF1-32i splice variant site.10 The PCR product was cleaned and concentrated with DNA Clean and Concentrator-5 Kit (Zymo Research, Irvine, CA, USA), according to the manufacturer’s protocol. In hNPCs, TAF1-32i (TaqMan Custom Assay identification number: AJWR28J; ThermoFisher Scientific) expression was normalized to Ubiquitin C (UBC) RNA (# 4331182, ThermoFisher Scientific). For EVs, human GAPDH (#4448489 from ThermoFisher Scientific) and copGFP (Forward primer: CCTCGTACTTCTCGATGCGG; Reverse primer: GGCTACGAGAACCCCTTCCT; Taqman probe: TTGGTGTAGCCGCCGTTGTTGATGGCG) were used as a housekeeping gene and vector control for normalization, respectively. The assay was analyzed using ddPCR following PrimePCR ddPCR Gene Expression Probe Assay. Using the manufacturer’s protocol, droplets were generated with DG8 Cartridge with the QX200 droplet generator (Bio-Rad, Hercules, CA, USA) and PCR performed with thermal cycling conditions via QX200 Droplet Reader, and QuantaSoft Software (Bio-Rad) to analyze mRNA levels.
Single-EV analysis with ExoView
ExoView Human Tetraspanin kit (NanoView #EV-TETRA-C) was used to analyze the EVs that were previously obtained from plasma of mice implanted with ENoMi-hNPCs. According to the guidelines provided by NanoView Biosciences, the samples were incubated on the ExoView Tetraspanin Chip for 16 h at room temperature. After washing the chips three times in 1 mL 1x PBS for 3 min, free label imaging was performed with the ExoView R100 reader.
Data availability
The data that support the findings of this study are available from the corresponding author upon reasonable request. The data will be provided in a format that is easily accessible and usable for further analysis or verification of the findings presented in the paper. We believe that sharing data is crucial for promoting transparency, reproducibility, and advancing scientific knowledge, and we encourage others to use and build upon our data in their own research.
Acknowledgments
We thank Suzanne McDavitt for skilled editorial assistance, and Drs. Lilian Cruz, David Rufino-Ramos, and Sevda Lule for their input into the concepts and tools used in these studies. Schematics in Figures 2, 3, and 4 and the graphical abstract were created with BioRender.com. Funding for this study was provided by the MGH Collaborative Center for X-Linked Dystonia-Parkinsonism (award number: 239283).
Author contributions
K.M. and K.B. performed experiments, analyzed data, and wrote the paper. D.F., A.Y., W.O., S.M., L.N., and J.A. performed experiments. C.V. and C.B. planned and supervised experiments, analyzed data, and edited the paper. X.O.B. and K.B. conceptualized the study, planned and supervised experiments, and wrote and edited the paper.
Declaration of interests
The authors declare no competing interests.
Footnotes
Supplemental information can be found online at https://doi.org/10.1016/j.ymthe.2023.05.011.
Contributor Information
Xandra O. Breakefield, Email: breakefield@hms.harvard.edu.
Koen Breyne, Email: kbreyne@mgh.harvard.edu.
Supplemental information
References
- 1.Hafezparast M., Ahmad-Annuar A., Wood N.W., Tabrizi S.J., Fisher E.M.C. Mouse models for neurological disease. Lancet Neurol. 2002;1:215–224. doi: 10.1016/s1474-4422(02)00100-x. [DOI] [PubMed] [Google Scholar]
- 2.Loomba S., Straehle J., Gangadharan V., Heike N., Khalifa A., Motta A., Ju N., Sievers M., Gempt J., Meyer H.S., Helmstaedter M. Connectomic comparison of mouse and human cortex. Science. 2022;377:eabo0924. doi: 10.1126/science.abo0924. [DOI] [PubMed] [Google Scholar]
- 3.Puzzo D., Gulisano W., Palmeri A., Arancio O. Rodent models for Alzheimer’s disease drug discovery. Expert Opin. Drug Discov. 2015;10:703–711. doi: 10.1517/17460441.2015.1041913. [DOI] [PMC free article] [PubMed] [Google Scholar]
- 4.Shah R., Patel T., Freedman J.E. Circulating extracellular vesicles in human disease. N. Engl. J. Med. 2018;379:2180–2181. doi: 10.1056/NEJMc1813170. [DOI] [PubMed] [Google Scholar]
- 5.Reátegui E., van der Vos K.E., Lai C.P., Zeinali M., Atai N.A., Aldikacti B., Floyd F.P., H Khankhel A., Thapar V., Hochberg F.H., et al. Engineered nanointerfaces for microfluidic isolation and molecular profiling of tumor-specific extracellular vesicles. Nat. Commun. 2018;9:175. doi: 10.1038/s41467-017-02261-1. [DOI] [PMC free article] [PubMed] [Google Scholar]
- 6.Rufino-Ramos D., Lule S., Mahjoum S., Ughetto S., Cristopher Bragg D., Pereira de Almeida L., Breakefield X.O., Breyne K. Using genetically modified extracellular vesicles as a non-invasive strategy to evaluate brain-specific cargo. Biomaterials. 2022;281:121366. doi: 10.1016/j.biomaterials.2022.121366. [DOI] [PMC free article] [PubMed] [Google Scholar]
- 7.Lee L.V., Kupke K.G., Caballar-Gonzaga F., Hebron-Ortiz M., Müller U. The phenotype of the X-linked dystonia-parkinsonism syndrome. An assessment of 42 cases in the Philippines. Medicine. 1991;70:179–187. doi: 10.1097/00005792-199105000-00002. [DOI] [PubMed] [Google Scholar]
- 8.Aneichyk T., Hendriks W.T., Yadav R., Shin D., Gao D., Vaine C.A., Collins R.L., Domingo A., Currall B., Stortchevoi A., et al. Dissecting the causal mechanism of X-linked dystonia-parkinsonism by integrating genome and transcriptome assembly. Cell. 2018;172:897–909.e21. doi: 10.1016/j.cell.2018.02.011. [DOI] [PMC free article] [PubMed] [Google Scholar]
- 9.Makino S., Kaji R., Ando S., Tomizawa M., Yasuno K., Goto S., Matsumoto S., Tabuena M.D., Maranon E., Dantes M., et al. Reduced neuron-specific expression of the TAF1 gene is associated with X-linked dystonia-parkinsonism. Am. J. Hum. Genet. 2007;80:393–406. doi: 10.1086/512129. [DOI] [PMC free article] [PubMed] [Google Scholar]
- 10.Al Ali J., Vaine C.A., Shah S., Campion L., Hakoum A., Supnet M.L., Acuña P., Aldykiewicz G., Multhaupt-Buell T., Ganza N.G.M., et al. TAF1 transcripts and neurofilament light chain as biomarkers for X-linked dystonia-parkinsonism. Mov. Disord. 2021;36:206–215. doi: 10.1002/mds.28305. [DOI] [PMC free article] [PubMed] [Google Scholar]
- 11.Aboulkheyr Es H., Montazeri L., Aref A.R., Vosough M., Baharvand H. Personalized cancer medicine: an organoid approach. Trends Biotechnol. 2018;36:358–371. doi: 10.1016/j.tibtech.2017.12.005. [DOI] [PubMed] [Google Scholar]
- 12.Bleijs M., van de Wetering M., Clevers H., Drost J. Xenograft and organoid model systems in cancer research. EMBO J. 2019;38:e101654. doi: 10.15252/embj.2019101654. [DOI] [PMC free article] [PubMed] [Google Scholar]
- 13.Vijaya Kumar A., Donate C., Imhof B.A., Matthes T. Tumor engraftment in a xenograft mouse model of human mantle cell lymphoma. J. Vis. Exp. 2018 doi: 10.3791/56023. [DOI] [PMC free article] [PubMed] [Google Scholar]
- 14.Abud E.M., Ramirez R.N., Martinez E.S., Healy L.M., Nguyen C.H.H., Newman S.A., Yeromin A.V., Scarfone V.M., Marsh S.E., Fimbres C., et al. iPSC-derived human microglia-like cells to study neurological diseases. Neuron. 2017;94:278–293.e9. doi: 10.1016/j.neuron.2017.03.042. [DOI] [PMC free article] [PubMed] [Google Scholar]
- 15.Dong X., Xu S.-B., Chen X., Tao M., Tang X.-Y., Fang K.-H., Xu M., Pan Y., Chen Y., He S., Liu Y. Human cerebral organoids establish subcortical projections in the mouse brain after transplantation. Mol. Psychiatry. 2021;26:2964–2976. doi: 10.1038/s41380-020-00910-4. [DOI] [PMC free article] [PubMed] [Google Scholar]
- 16.Kim T., Song J.-J., Puspita L., Valiulahi P., Shim J.-W., Lee S.-H. In vitro generation of mature midbrain-type dopamine neurons by adjusting exogenous Nurr1 and Foxa2 expressions to their physiologic patterns. Exp. Mol. Med. 2017;49:e300. doi: 10.1038/emm.2016.163. [DOI] [PMC free article] [PubMed] [Google Scholar]
- 17.Dahlstrand J., Lardelli M., Lendahl U. Nestin mRNA expression correlates with the central nervous system progenitor cell state in many, but not all, regions of developing central nervous system. Brain Res. Dev. Brain Res. 1995;84:109–129. doi: 10.1016/0165-3806(94)00162-s. [DOI] [PubMed] [Google Scholar]
- 18.Gómez-López S., Wiskow O., Favaro R., Nicolis S.K., Price D.J., Pollard S.M., Smith A. Sox2 and Pax6 maintain the proliferative and developmental potential of gliogenic neural stem cells in vitro. Glia. 2011;59:1588–1599. doi: 10.1002/glia.21201. [DOI] [PubMed] [Google Scholar]
- 19.Juríková M., Danihel Ľ., Polák Š., Varga I. Ki67, PCNA, and MCM proteins: markers of proliferation in the diagnosis of breast cancer. Acta Histochem. 2016;118:544–552. doi: 10.1016/j.acthis.2016.05.002. [DOI] [PubMed] [Google Scholar]
- 20.Ito N., Hendriks W.T., Dhakal J., Vaine C.A., Liu C., Shin D., Shin K., Wakabayashi-Ito N., Dy M., Multhaupt-Buell T., et al. Decreased N-TAF1 expression in X-linked dystonia-parkinsonism patient-specific neural stem cells. Dis. Model. Mech. 2016;9:451–462. doi: 10.1242/dmm.022590. [DOI] [PMC free article] [PubMed] [Google Scholar]
- 21.Teschendorf C., Warrington K.H., Siemann D.W., Muzyczka N. Comparison of the EF-1 alpha and the CMV promoter for engineering stable tumor cell lines using recombinant adeno-associated virus. Anticancer Res. 2002;22:3325–3330. [PubMed] [Google Scholar]
- 22.Woo H.-K., Sunkara V., Park J., Kim T.-H., Han J.-R., Kim C.-J., Choi H.-I., Kim Y.-K., Cho Y.-K. Exodisc for rapid, size-selective, and efficient isolation and analysis of nanoscale extracellular vesicles from biological samples. ACS Nano. 2017;11:1360–1370. doi: 10.1021/acsnano.6b06131. [DOI] [PubMed] [Google Scholar]
- 23.Palviainen M., Saraswat M., Varga Z., Kitka D., Neuvonen M., Puhka M., Joenväärä S., Renkonen R., Nieuwland R., Takatalo M., Siljander P.R.M. Extracellular vesicles from human plasma and serum are carriers of extravesicular cargo-Implications for biomarker discovery. PLoS One. 2020;15:e0236439. doi: 10.1371/journal.pone.0236439. [DOI] [PMC free article] [PubMed] [Google Scholar]
- 24.Xu L., Liang Y., Xu X., Xia J., Wen C., Zhang P., Duan L. Blood cell-derived extracellular vesicles: diagnostic biomarkers and smart delivery systems. Bioengineered. 2021;12:7929–7940. doi: 10.1080/21655979.2021.1982320. [DOI] [PMC free article] [PubMed] [Google Scholar]
- 25.Becker A., Thakur B.K., Weiss J.M., Kim H.S., Peinado H., Lyden D. Extracellular vesicles in cancer: cell-to-cell mediators of metastasis. Cancer Cell. 2016;30:836–848. doi: 10.1016/j.ccell.2016.10.009. [DOI] [PMC free article] [PubMed] [Google Scholar]
- 26.Thietart S., Rautou P.-E. Extracellular vesicles as biomarkers in liver diseases: a clinician’s point of view. J. Hepatol. 2020;73:1507–1525. doi: 10.1016/j.jhep.2020.07.014. [DOI] [PubMed] [Google Scholar]
- 27.Boulanger C.M., Loyer X., Rautou P.-E., Amabile N. Extracellular vesicles in coronary artery disease. Nat. Rev. Cardiol. 2017;14:259–272. doi: 10.1038/nrcardio.2017.7. [DOI] [PubMed] [Google Scholar]
- 28.Zetterberg H., Burnham S.C. Blood-based molecular biomarkers for Alzheimer’s disease. Mol. Brain. 2019;12:26. doi: 10.1186/s13041-019-0448-1. [DOI] [PMC free article] [PubMed] [Google Scholar]
- 29.Upadhya R., Shetty A.K. Extracellular vesicles for the diagnosis and treatment of Parkinson’s disease. Aging Dis. 2021;12:1438–1450. doi: 10.14336/AD.2021.0516. [DOI] [PMC free article] [PubMed] [Google Scholar]
- 30.Müller Bark J., Kulasinghe A., Chua B., Day B.W., Punyadeera C. Circulating biomarkers in patients with glioblastoma. Br. J. Cancer. 2020;122:295–305. doi: 10.1038/s41416-019-0603-6. [DOI] [PMC free article] [PubMed] [Google Scholar]
- 31.Shankar G.M., Balaj L., Stott S.L., Nahed B., Carter B.S. Liquid biopsy for brain tumors. Expert Rev. Mol. Diagn. 2017;17:943–947. doi: 10.1080/14737159.2017.1374854. [DOI] [PMC free article] [PubMed] [Google Scholar]
- 32.Martínez-Rojas B., Giraldo E., Grillo-Risco R., Hidalgo M.R., López-Mocholi E., Alastrue-Agudo A., García-García F., Moreno-Manzano V. NPC transplantation rescues sci-driven cAMP/EPAC2 alterations, leading to neuroprotection and microglial modulation. Cell. Mol. Life Sci. 2022;79:455. doi: 10.1007/s00018-022-04494-w. [DOI] [PMC free article] [PubMed] [Google Scholar]
- 33.Jin M.C., Medress Z.A., Azad T.D., Doulames V.M., Veeravagu A. Stem cell therapies for acute spinal cord injury in humans: a review. Neurosurg. Focus. 2019;46:E10. doi: 10.3171/2018.12.FOCUS18602. [DOI] [PubMed] [Google Scholar]
- 34.Lepore A.C., Maragakis N.J. Targeted stem cell transplantation strategies in ALS. Neurochem. Int. 2007;50:966–975. doi: 10.1016/j.neuint.2006.09.005. [DOI] [PubMed] [Google Scholar]
- 35.Riemann L., Younsi A., Scherer M., Zheng G., Skutella T., Unterberg A.W., Zweckberger K. Transplantation of neural precursor cells attenuates chronic immune environment in cervical spinal cord injury. Front. Neurol. 2018;9:428. doi: 10.3389/fneur.2018.00428. [DOI] [PMC free article] [PubMed] [Google Scholar]
- 36.Vogel S., Schäfer C., Hess S., Folz-Donahue K., Nelles M., Minassian A., Schwarz M.K., Kukat C., Ehrlich M., Zaehres H., et al. The in vivo timeline of differentiation of engrafted human neural progenitor cells. Stem Cel Res. 2019;37:101429. doi: 10.1016/j.scr.2019.101429. [DOI] [PubMed] [Google Scholar]
- 37.Goldman S.A., Nedergaard M., Windrem M.S. Modeling cognition and disease using human glial chimeric mice. Glia. 2015;63:1483–1493. doi: 10.1002/glia.22862. [DOI] [PMC free article] [PubMed] [Google Scholar]
- 38.Nair R.R., Corrochano S., Gasco S., Tibbit C., Thompson D., Maduro C., Ali Z., Fratta P., Arozena A.A., Cunningham T.J., Fisher E.M.C. Uses for humanised mouse models in precision medicine for neurodegenerative disease. Mamm. Genome. 2019;30:173–191. doi: 10.1007/s00335-019-09807-2. [DOI] [PMC free article] [PubMed] [Google Scholar]
- 39.Zeng X., Chen J., Sanchez J.F., Coggiano M., Dillon-Carter O., Petersen J., Freed W.J. Stable expression of hrGFP by mouse embryonic stem cells: promoter activity in the undifferentiated state and during dopaminergic neural differentiation. Stem Cells. 2003;21:647–653. doi: 10.1634/stemcells.21-6-647. [DOI] [PubMed] [Google Scholar]
- 40.Gupta D., Liang X., Pavlova S., Wiklander O.P.B., Corso G., Zhao Y., Saher O., Bost J., Zickler A.M., Piffko A., et al. Quantification of extracellular vesicles in vitro and in vivo using sensitive bioluminescence imaging. J. Extracell. Vesicles. 2020;9:1800222. doi: 10.1080/20013078.2020.1800222. [DOI] [PMC free article] [PubMed] [Google Scholar]
- 41.Bonsergent É., Bui S., Lavieu G. Quantitative measurement of extracellular vesicle content delivery within acceptor cells. Methods Mol. Biol. 2022;2473:397–403. doi: 10.1007/978-1-0716-2209-4_25. [DOI] [PubMed] [Google Scholar]
- 42.Corso G., Heusermann W., Trojer D., Görgens A., Steib E., Voshol J., Graff A., Genoud C., Lee Y., Hean J., et al. Systematic characterization of extracellular vesicle sorting domains and quantification at the single molecule - single vesicle level by fluorescence correlation spectroscopy and single particle imaging. J. Extracell. Vesicles. 2019;8:1663043. doi: 10.1080/20013078.2019.1663043. [DOI] [PMC free article] [PubMed] [Google Scholar]
- 43.Zaborowski M.P., Cheah P.S., Zhang X., Bushko I., Lee K., Sammarco A., Zappulli V., Maas S.L.N., Allen R.M., Rumde P., et al. Membrane-bound Gaussia luciferase as a tool to track shedding of membrane proteins from the surface of extracellular vesicles. Sci. Rep. 2019;9:17387. doi: 10.1038/s41598-019-53554-y. [DOI] [PMC free article] [PubMed] [Google Scholar]
- 44.Henry R.T., Casto R. Simple and inexpensive delivery of halogenated inhalation anesthetics to rodents. Am. J. Physiol. 1989;257:R668–R671. doi: 10.1152/ajpregu.1989.257.3.R668. [DOI] [PubMed] [Google Scholar]
- 45.Xu Q., Ming Z., Dart A.M., Du X.-J. Optimizing dosage of ketamine and xylazine in murine echocardiography. Clin. Exp. Pharmacol. Physiol. 2007;34:499–507. doi: 10.1111/j.1440-1681.2007.04601.x. [DOI] [PubMed] [Google Scholar]
- 46.Vella L.J., Scicluna B.J., Cheng L., Bawden E.G., Masters C.L., Ang C.S., Willamson N., McLean C., Barnham K.J., Hill A.F. A rigorous method to enrich for exosomes from brain tissue. J. Extracell. Vesicles. 2017;6:1348885. doi: 10.1080/20013078.2017.1348885. [DOI] [PMC free article] [PubMed] [Google Scholar]
- 47.Su H., Rustam Y.H., Masters C.L., Makalic E., McLean C.A., Hill A.F., Barnham K.J., Reid G.E., Vella L.J. Characterization of brain-derived extracellular vesicle lipids in Alzheimer’s disease. J. Extracell. Vesicles. 2021;10:e12089. doi: 10.1002/jev2.12089. [DOI] [PMC free article] [PubMed] [Google Scholar]
- 48.Huang Y., Cheng L., Turchinovich A., Mahairaki V., Troncoso J.C., Pletniková O., Haughey N.J., Vella L.J., Hill A.F., Zheng L., Witwer K.W. Influence of species and processing parameters on recovery and content of brain tissue-derived extracellular vesicles. J. Extracell. Vesicles. 2020;9:1785746. doi: 10.1080/20013078.2020.1785746. [DOI] [PMC free article] [PubMed] [Google Scholar]
Associated Data
This section collects any data citations, data availability statements, or supplementary materials included in this article.
Supplementary Materials
Data Availability Statement
The data that support the findings of this study are available from the corresponding author upon reasonable request. The data will be provided in a format that is easily accessible and usable for further analysis or verification of the findings presented in the paper. We believe that sharing data is crucial for promoting transparency, reproducibility, and advancing scientific knowledge, and we encourage others to use and build upon our data in their own research.