

Abstract
In the central nervous system (CNS), the crosstalk between neural cells is mediated by extracellular mechanisms, including brain-derived extracellular vesicles (bdEVs). To study endogenous communication across the brain and periphery, we explored Cre-mediated DNA recombination to permanently record the functional uptake of bdEVs cargo over time. To elucidate functional cargo transfer within the brain at physiological levels, we promoted the continuous secretion of physiological levels of neural bdEVs containing Cre mRNA from a localized region in the brain by in situ lentiviral transduction of the striatum of Flox-tdTomato Ai9 mice reporter of Cre activity. Our approach efficiently detected in vivo transfer of functional events mediated by physiological levels of endogenous bdEVs throughout the brain. Remarkably, a spatial gradient of persistent tdTomato expression was observed along the whole brain, exhibiting an increment of more than 10-fold over 4 months. Moreover, bdEVs containing Cre mRNA were detected in the bloodstream and extracted from brain tissue to further confirm their functional delivery of Cre mRNA in a novel and highly sensitive Nanoluc reporter system. Overall, we report a sensitive method to track bdEV transfer at physiological levels, which will shed light on the role of bdEVs in neural communication within the brain and beyond.
Keywords: exosomes, brain, extracellular vesicles, exRNA, extracellular communication, Cre-loxP, Nanoluc, central nervous system, tdTomato
Graphical abstract
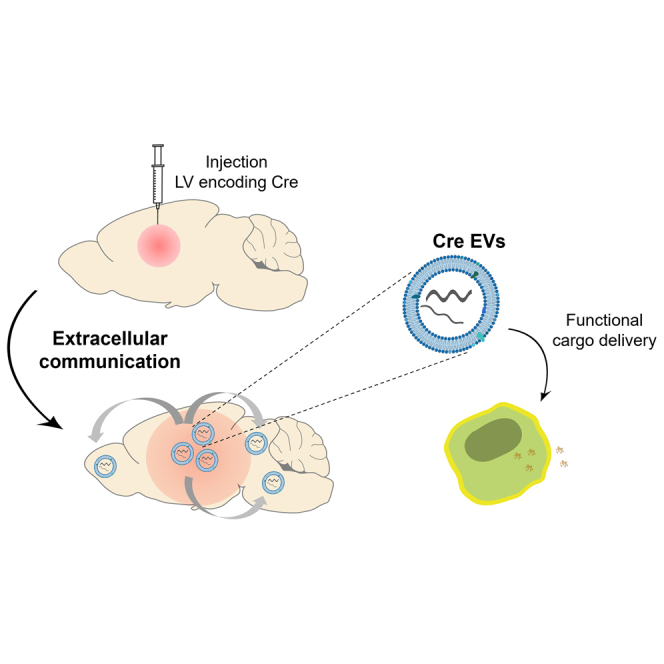
Breyne, de Almeida and colleagues report a sensitive strategy to detect functional transfer of EVs in the brain. A striatal source of EVs carrying Cre mRNA was generated to monitor the physiological distribution of EVs within the brain. The approach achieved high sensitivity by evaluating permanent DNA recombination throughout the whole brain.
Introduction
Exchange of nucleic acids, proteins, and lipids between brain cells, including neurons, oligodendrocytes, astrocytes, and microglia are an essential aspect of homeostasis in the brain.1 Cell-to-cell communication in the central nervous system (CNS) is crucial to support the function and integrity of neurons, control inflammation, and mediate the removal of debris and infectious agents.2,3 Intercellular transfer of molecules in the brain is mediated through direct cytoplasmic connections between cells, such as tunneling nanotubes (TNTs),4,5 and paracrine communication mediated by the release of signaling molecules, such as growth factors, neurotransmitters, and cargo of extracellular vesicles (EVs).3 EVs are nano-sized particles naturally produced by all cells and surrounded by a lipid bilayer, which protects their contents from degradation.6
EVs are released by virtually all neural cells to neighboring or distant compartments and influence a wide range of processes throughout the body.3,7 In fact, EVs released by different cell types of the nervous system have been shown to have different cell-binding specificities and fates for their cargo upon internalization. For example, while neuroblastoma-derived EVs were predominantly internalized by glia, those secreted by cortical neurons were preferentially taken up by other neurons.8 On the other hand, oligodendrocyte EVs were shown to be internalized by neurons and microglia and contribute to neuronal integrity.9 In fact, essential roles for neural function and integrity have been attributed to EV communication between neurons and other neural cells, including synapse assembly and plasticity, neuronal survival, and immune responses.10,11 In addition, EVs have been shown to be involved in several neurodegenerative diseases, such as Alzheimer’s disease and Parkinson’s disease.3,12,13,14,15
EVs communicate between neural cells by transferring protein and nucleic acid cargoes to recipient cells, which alters their gene expression and function. Among nucleic acids, small DNA fragments16,17 and different extracellular RNA (exRNAs) species have been found, such as mRNAs, microRNA, piwi-interacting RNAs, and other non-coding RNAs.18,19 In fact, there are reports supporting transfer of mRNAs <3 kb with some efficiency. Nevertheless, enrichment of long RNA sequences is reduced due to packaging limitations.20 RNA transfer within the brain has been involved in regulation of gene expression in astrocytes,21 decreased22,23 or accelerated24,25 glioma growth, and spreading of misfolded proteins in Alzheimer’s disease and Parkinson’s disease.12,13,14
Thus, uncovering the roles of EVs and their functional events in the CNS is crucial to better understanding of their function in neuronal physiology and pathological conditions. To obtain insights into brain communication mediated by EVs in disease and non-disease conditions, approaches based on extracting brain-derived EVs (bdEVs) from brain tissue have been used to obtain insights into brain communication mediated by EVs and their composition. Despite some reports suggesting L1CAM and NCAM as promising candidates to isolate bdEVs, there is no consensus yet about a specific neuronal marker to selectively isolate bdEVs in the bloodstream.26,27 Interestingly, lipidomics,28 proteomics,29,30,31 and transcriptomics30 were performed to investigate the profile of bdEV signatures to further discriminate normal and diseased EVs produced in neurodegenerative diseases. Despite the findings of some dysregulated molecules with potential to serve as brain signatures, there is a current need to understand whether the bdEVs directly isolated from brain tissue truly represent the EVs population secreted from cells.
Studying biological functions of EVs in vivo present limitations regarding the need of large amounts of previously concentrated particles exposed to cells.32,33 Despite showing functional transfer of proteins and exRNAs that result in phenotypic changes on recipient cells,34,35 there is a lack of understanding of the physiological role of EV transfer. In fact, studying the functional activity of EVs carrying exRNAs at physiological levels in the brain is challenging for several reasons, such as the low number of RNA molecules per vesicle,19,36,37 the degradation of RNA-transferred cargo, which hinders the identification of EV-mediated effects in recipient cells, and the lack of definitive specific markers to isolate bdEVs.31
To counteract these limitations, targeting genomic DNA (gDNA) using systems such as Cre-loxP reporters induces permanent changes at the DNA level allowing a permanent recording of functional events mediated by rare endogenous EVs,38 and offers the advantage of validation with multiple readout analyses from DNA to RNA and protein levels. Fluorescent reporter genes, such as tdTomato, are typically used under the control of promoters with stop regions between loxP sites that are removed upon Cre activation.39 Fluorescent genes can be replaced by luminescent reporters that possess high sensitivity, such as Nanoluciferase (Nanoluc).40,41
Cre-loxP-based systems are powerful systems to study EV-mediated intercellular cargo transfer both in vitro and in vivo.9,42,43,44 Cre mRNA was shown to be naturally incorporated into EVs without requirement of packaging signals.44,45 Functional transfer of Cre molecules contained in EVs was shown to be essential in discriminating metastatic behavior in vivo44,46 by marking cells that internalized vesicles through the expression of fluorescent proteins,47 suggesting the possibility of applying the same rationale to study brain communication.
In this study, we aimed at studying brain communication mediated by endogenous bdEVs secreted from the striatum to peripheral brain regions. We generated an in vivo brain region continuously secreting bdEVs carrying Cre mRNA upon intracranial injection of lentiviral vectors (LVs) encoding the Cre transgene into the striatum of Ai9 reporter mice. Upon transduction, striatal cells continuously express and package Cre molecules in bdEVs. The continuous exposure of brain cells to bdEVs containing Cre mRNA resulted in an increase of tdTomato signal in the whole mouse brain from 4 to 16 weeks as a consequence of a spatial gradient from the initial injection site of LVs and the continuous spreading of bdEVs carrying Cre mRNA over time. Through this strategy we demonstrated EV-mediated brain communication by permanently recording, at the DNA level, the continuous uptake of their functional cargo in the brain. Moreover, we showed that bdEVs can be isolated from brain tissue samples or the bloodstream and successfully internalize into neurons in vitro to functionally deliver Cre mRNA.
Results
Extracellular communication is shown through the functional transfer of Cre activity in vitro
In this study, we aimed at studying brain communication mediated by EVs. For that purpose, we developed a reporter system based on the Cre-loxP recombination, which allows detection and recording of rare events mediated by extracellular communication through gDNA recombination. Therefore, human embryonic kidney 293 (HEK293T) cells were used as a continuous source of EVs packaging Cre mRNA after stable transduction with an LV encoding the CRE sequence under the control of a phosphoglycerate kinase (PGK) promoter. A firefly luciferase (Fluc) reporter under the ubiquitin C gene (UbC) promoter was included as an indicator for Cre expression. Both promotors are ubiquitously expressed and ensured stable and high levels of expression in EV donor cells,48,49 generating applicability to a wide variety of cell types. To retain the protein products of both transgenes in the donor cells, a nuclear localization signal (NLS) and a H2B histone was added to the N-terminal of the CRE and Fluc genes (Figure 1A). Cre (Figure 1A) and Fluc (Figure S1A) protein content were mainly restricted to the nucleus of transduced HEK293T cells. Fluc expression resulted in over 5-fold increase in bioluminescence of transduced HEK293T cells but was barely detectable in culture medium (Figure S1B).
Figure 1.

Extracellular communication shown through functional transfer of Cre activity in vitro
(A) Top: schematic representation of the lentiviral construct expressing nuclear localization signal (NLS) CRE (1,026 bp) under control of PGK promoter, and H2B firefly luciferase (Fluc) (1,650 bp) under control of UBC promoter. Cre and Fluc genes contain a NLS and H2B, respectively, at the N terminus that shuttles the proteins to the nucleus. Bottom: representative immunofluorescent image from confocal microscopy of HEK293T cells stably expressing Cre protein (red) mainly in the nucleus (blue). Actin filaments in cytoplasm were stained with phalloidin (white). Scale bar, 10 μm. (B) Schematic representation of FLExNanoluc switch used to generate a sensitive Cre reporter system. The FLExNanoluc in the OFF-state does not allow Nanoluciferase (Nanoluc) expression, because the gene is backward in the construct. Upon Cre activation, the Nanoluc gene flips and becomes in frame with the EF1α promoter in the ON-state. The resulting Nanoluc expression generates detectable bioluminescence in both cells and medium. (C) Co-culture of HEK293T cells stably expressing Cre (red) and HEK293T cells stably expressing FLExNanoluc and GFP (green) for 72 h. Scale bar, 20 μm. (D) Bioluminescence evaluation of Nanoluc secreted in medium. Nanoluc signal in the cell medium detected after 24 and 72 h of co-culture. Cells were cultured in three FLExNanoluc:Cre ratios (1:1, 1:3, and 3:1). The white bars represent a control condition in which FLExNanoluc reporter cells were co-cultured with WT HEK293T cells (no expression of Cre). Cre activity is represented by a bioluminescence signal relative to control (n = 6). Data are presented as mean ± SEM and compared by unpaired t test, ∗∗∗∗p < 0.0001. (E) Transwell system (1 μm pore inserts) with Cre cells seeded on the apical side of the upper chamber and previously transfected with CMV-STEAP3-SDC4-NadB plasmid to boost small EV production and FLExNanoluc reporter cells seeded in the lower chamber, with the latter showing recombination mediated by EVs. (F) Cre activity in boosted condition relative to non-boosted condition is represented by Nanoluc bioluminescence (RLU) in FLEx cells (n = 3). Data are presented as mean ± SEM and compared by unpaired t test, ∗∗p < 0.01. (G) Evaluation of gDNA recombination by RT-PCR showing Ct values of non-recombined DNA (FLExOFF) and recombined DNA (FLExON) (n = 3/4). FLEx condition (white bar) was used to establish a baseline condition corresponding to no recombination. Data represented as Ct values obtained in each sample condition. Data are presented as mean ± SEM and compared by one-way ANOVA followed by Tukey’s multiple comparison test (F = 19.72, F = 6.956); ∗p < 0.05, ∗∗p < 0.01.
To detect the EV-mediated extracellular transfer of Cre and permanently register its activity in the gDNA, we generated a reporter cell line based on the FLExNanoluc switch reporter.50 In the OFF-state, the FLExNanoluc system does not express Nanoluc as its coding sequence is flipped between loxP regions (Figure 1B). In the presence of Cre, the Nanoluc gene is flipped to the ON-state following the inversion and excision of the flanking loxP sites, thus allowing the Nanoluc gene to be expressed by restoring its frame with the upstream human elongation factor-1 alpha (EF1α) promoter (Figure 1B). A constitutively active CMV-driven GFP reporter was placed downstream of the floxed region to monitor cells encoding the FLEXNanoluc system. Following co-transfection with FLEXNanoluc- and Cre-expressing constructs, the resulting Nanoluc expression generates detectable bioluminescence signal upon addition of furimazine substrate, both in cells (Figure S1C) and medium (Figure S1D). FLEx reporter activation increased proportionally with the amount of Cre activity encoded by 10, 50, and 100 ng PGK-Cre-UbC-Fluc plasmid (Figure S1D). HEK293T cells were transduced with an LV encoding EF1α FLExNanoluc to generate stably expressing reporter cell lines. To evaluate whether Cre exRNA was transferred from the donor cell line to the FLExNanoluc recipient cells, we co-cultured both cell types in three FLEx:Cre ratios, as represented in Figure 1C. Immunocytochemistry allowed distinction of donor and recipient cells using anti-Cre antibody staining (red) and GFP endogenous expression from the FLEx construct (Figure 1C). In the control condition, non-transduced HEK293T cells were co-cultured with FLEx reporter cells. After 24 h of co-culture, bioluminescence was not significantly different from controls. In contrast, after 72 h of co-culture with transduced HEK293T cells, a significant increase in Nanoluc bioluminescence was observed in all conditions, with a 2-fold increase between the 1:1 and 3:1 FLEx/Cre ratios, and more than 3-fold increase for 1:3 FLEx/Cre ratio (Figure 1D). Data suggest that Cre activity is dependent on time and dose to mediate Nanoluc activation.
To exclude the possibility that the observed effects could result from direct cell fusion or formation of TNTs, we used a Transwell system permeable only to particles less than the 1 μm pore size to restrict exchange between donor and recipient cells to EVs. Cre exRNA donor cells were seeded on the apical side of the upper chamber and FLEx-recipient cells were seeded in the lower chamber. (Figure 1E). To boost EV production, we transfected donor cells with the CMV-STEAP3-SDC4-NadB plasmid,51 a tricistronic expression construct described as regulating three distinct pathways—exosome biogenesis, budding of endosomal membranes to form multivesicular bodies and cellular metabolism—which overall increases the production of small EVs.51 Cre activity mediated by EVs between boosted and non-boosted Cre cells was evaluated by bioluminescence of the FLExNanoluc reporter cells. Boosted Cre cells presented 1.58-fold increase in bioluminescence compared with non-boosted condition (Figure 1F). To validate Cre-mediated FLEXNanoluc activation, gDNA recombination was analyzed using a qRT-PCR strategy that allows distinguish between recombined and non-recombined DNA. The levels of non-recombined DNA (FLExOFF) were similar between conditions (Ct values of ∼24). In contrast, the levels of recombined DNA (FLExON) were found to be significantly higher in the condition where Cre donor cells were boosted for production of EVs (Figure 1G). Overall, these results suggest that extracellular communication was mediated through functional transfer of Cre species in particles sized below 1 μm, presumably EVs.
Cre activity is mediated by transfer of Cre mRNA through EVs but not Cre protein
To investigate whether EVs transfer Cre molecules, we isolated EVs from culture medium of Cre-expressing cells after 72 h by size-exclusion chromatography (SEC).52 After pelleting cell debris and concentrating medium, we resolved the samples in SEC columns and collected EV fractions 7 to 11 (Figure 2A) as described previously.53 EVs were analyzed for their protein content by western blotting and found to be positive for typical protein EV markers, including Alix, HSC70, and TSG101 and negative for the endoplasmic reticulum marker, calnexin, and Cre protein (Figure 2B). The latter was detected in Cre-expressing cells but not in their derived EVs, possibly due to the predominant localization of Cre in the cell nucleus due to the presence of the NLS (Figure 1A). Importantly, Cre mRNA was detected both in donor cells (Ct value of 22) (Figure S2A) and in their derived EVs (Ct value of 25) (Figure 2C), being packaged in these vesicles. Similarly, Fluc mRNA was detected in cells (Figure S2A) and their derived EVs (Figure S2B).
Figure 2.

Cre activity is mediated by transfer of Cre mRNA through EVs
(A) Schematic representation of EV isolation by size exclusion chromatography (SEC). In brief, EVs were isolated from the medium of HEK293T stably expressing Cre, cell debris was removed (300 × g × 10 min) and medium concentrated (100 kDa filter) to a final volume of 500 μL and then loaded onto a qEV Original SEC column. Five EV-enriched fractions of 500 μL were collected (fractions 7–11). (B) Western blotting of equimolar amounts of protein from cells and their derived EVs shows the positive markers Alix, HSC70, and TSG101 and undetectable levels of the ER marker calnexin. Cre protein is present in Cre donor cells but was not detectable in EVs from those cells. (C) Cre mRNA is detected in Cre EVs, but not WT EVs (n = 4). hGAPDH was detected in both conditions. Data are presented as Ct values, mean ± SEM and compared by unpaired t test with Welch’s correction. ∗∗∗p < 0.001; ns, not significant. (D) 5′ and-3′ regions of Cre exRNA are detected in Cre EVs, but not in WT EVs (n = 3). Data are presented as Ct values, mean ± SEM and compared by unpaired t test with Welch’s correction. ∗∗p < 0.01. (E) Cre EVs treated with RNase A in the presence or absence of 0.5% Triton X-100 showed that Cre-exRNA is predominantly protected inside EVs (n = 4). Data are presented as mean ± SEM and compared by ordinary one-way ANOVA followed by Dunnett’s multiple comparison test (F = 493.4). ∗∗∗∗p < 0.0001. (F) CMV-STEAP3-SDC4-NadB booster plasmid increases EV production and Cre exRNA detection. hHPRT was used as a housekeeping control. Data are presented as mean ± SEM and compared by ordinary one-way ANOVA followed by Sidak’s multiple comparisons test (F = 192.4). ∗p < 0.05, ∗∗p < 0.01, ∗∗∗p < 0.001; ns, not significant.
To further investigate to what extent Cre mRNA is loaded into EVs we used different Cre primer pairs targeting the 5′ or 3′ ends of Cre mRNA. We detected a higher Ct value in the 5′ region (Ct value of 30) when compared with the 3′ region (Ct value of 32) (Figure 2D), suggesting that a mixture of Cre mRNAs were present in EVs, and possibly Cre mRNA is degraded starting from the 3′ region.54 To evaluate whether Cre mRNA is protected within the EV lumen, EVs were exposed to 0.5% Triton X-100 and RNase, which disrupts EV membranes and degrades mRNA, respectively. Treatment with either RNAse or 0.5% Triton alone did not significantly reduce Cre mRNA Ct value. In contrast, Cre mRNA was not detected when EVs were exposed to both RNAse and 0.5% Triton (Figure 2E), which supports Cre mRNA being protected in the lumen of EVs.
The overexpression of CMV-STEAP3-SDC4-NadB plasmid in cells boosted small EV production in terms of particle numbers and CD63 species (Figure S2C). To evaluate whether Cre mRNA was packaged into small EVs, Cre-expressing cells were transfected with CMV-STEAP3-SDC4-NadB or control plasmids (CMV-RFP), EVs isolated, and Cre mRNA analyzed. Boosting EV production with CMV-STEAP3-SDC4-NadB plasmid increased the detection of Cre mRNA in EVs to a Ct value of 27 compared with non-boosted Cre EVs (transfected with a control plasmid of CMV-RFP) for which a Ct value of 29 was found, suggesting that small EVs originating from the endocytic pathway contain Cre mRNA. The lower Ct value of Cre mRNA in boosted EVs relates to a higher secretion of EVs from boosted cells as observed from higher particle count (Figure S2C) compared with Ct values of HPRT in boosted and non-boosted EVs (Figure 2F).
Overall, our data indicate that we have established a Cre-expressing cell line continuously secreting EVs that have a natural ability to package Cre mRNA but not NLS-modified Cre protein.
EVs transfer functional Cre mRNA in vitro and in vivo
To investigate whether Cre mRNA detected in EVs would be functionally transferred to recipient cells, we exposed FLExNanoluc reporter cells to EVs isolated from Cre mRNA donor cells for 24 and 72 h. To determine Cre activity, Nanoluc bioluminescence was evaluated in culture medium 24 and 72 h after incubation (Figure 3A). The first 24 h of incubation led to a 10% increase while the 72 h of incubation led to a 50% increase in bioluminescence relative to control (incubation with HEK293T EVs), suggesting a time-dependent effect.
Figure 3.

Concentrated EVs transfer functional Cre mRNA in vitro and in vivo
(A) Cre EVs transfer functional Cre mRNA to FLEx reporter cells over time. FLEx reporter cells were incubated with Cre EVs and Nanoluc bioluminescence evaluated in culture medium 24 and 72 h after incubation. Cre activity is represented by bioluminescence signal relative to control (incubated with WT EVs). Data are presented as means ± SEM and compared by unpaired t test. ∗∗∗∗p < 0.0001. (B) Cre EVs transfer functional Cre exRNA to Ai9 cells in a dose-dependent manner. Schematic illustration of Ai9 reporter in which tdTomato expression is prevented by a stop cassette between the promoter and the coding sequence. Removal of the stop cassette by Cre activation results in tdTomato expression. Bar graphs represent tdTomato expression levels evaluated by RT-digital droplet PCR (ddPCR) post-incubation with three different doses of Cre-EVs (2.2, 4.4, and 13.1 × 10⁹ particles) for 72 h. Data are presented as means ± SEM and compared unpaired t test. ∗∗∗∗p < 0.0001. (C) Cre mRNA is functionally delivered to the brain of Ai9 mice. Schematic illustration of Cre EVs intracranially injected in Ai9 reporter mice. Three weeks post-injection, tdTomato mRNA levels in coronal brain sections were evaluated through ddPCR to detect the injection site of Cre EVs (n = 4). Data are presented as tdTomato copies/μL mean ± SEM and compared by one-way ANOVA followed by Tukey’s multiple comparisons test (F = 5.641). ∗p < 0.05; ns, not significant. (D) Cre activity of exogenous EVs in brain. Control EVs (from HEK293T) or Cre EVs injected intracranially into Ai9 mice were compared for Cre activity in the coronal sections at the injection site in the brain. tdTomato expression at the injection site in the striatum of animals were evaluated by ddPCR (control n = 3 and Cre EVs n = 4). Data are presented as mean ± SEM and compared by unpaired t test. ∗∗p < 0.01.
To evaluate whether Cre activity induced by Cre EV uptake is dependent on the dose, we used the Ai9 reporter cells in which tdTomato expression is prevented by a stop cassette between two loxP sites (floxed), encoding three tandem poly(A) sequences between the chicken β-actin (CAG) promoter and the gene coding sequence.39 The removal of the stop cassette upon Cre activation results in tdTomato expression. Co-transfection of HEK293T cells with Ai9 plasmid and increasing amounts of Cre plasmids led to an increase in tdTomato mRNA levels, also validated by detection of gDNA recombination (Figure S3A). To evaluate functional Cre mRNA transfer through EVs, Ai9 reporter cells were incubated with three different doses of Cre EVs (2.2, 4.4, and 13.1 × 10⁹ particles) for 72 h and mRNA expression evaluated by digital droplet PCR (ddPCR). The lowest dose of EVs (2.2 × 10⁹ particles) resulted in 3.1 times significantly higher tdTomato expression than the control (incubation with HEK293T EVs), while the intermediate dose (4.4 × 10⁹ particles) resulted in 6 times higher tdTomato expression and the highest dose (13.1 × 10⁹ particles) resulted in 39 times higher tdTomato expression (Figure 3B). These results were confirmed at the DNA level (Figure S3B). Together, these results indicate a dose-dependent effect of Cre EVs on tdTomato signal in vitro.
To investigate whether Cre EVs mediate functional transfer of Cre mRNA in vivo, we injected 1 × 10⁹ particles of Cre EVs intracranially into the striata of Ai9 transgenic mice (Figure 3C). The same number of HEK293T EVs (lacking Cre mRNA) were injected in the same region of Ai9 mice. Three weeks after the injection, mice were sacrificed and ddPCR of striatum coronal sections was performed to determine the injection. For that aim, we monitored the levels of tdTomato expression in each coronal region that corresponds to the peak of Cre activity in the brain (Figure 3C). To evaluate if the increase in tdTomato signal was due to functional delivery of Cre mRNA, we compared the tdTomato mRNA levels in brain sections of animals injected with Cre EVs and control EVs (Figure 3D). tdTomato mRNA levels of animals injected with Cre EVs were 3.5-fold higher (50 μm sections) relative to control animals, suggesting that tdTomato expression at the injection site was dependent on the activity of Cre mRNA functionally delivered by EVs. Overall, our in vitro and in vivo data indicate that EVs conveying Cre mRNA are responsible for Cre-mediated activity detected by the loxP reporter in vitro and in vivo.
Neurons establish a long-term source of Cre mRNA within the brain
To unravel the role of the spreading EVs in brain communication in vivo, we generated a brain endogenous Cre-secreting region in the striatum using LVs encoding PGK-driven Cre and UbC-driven Fluc genes (Figure 4A). Fluc bioluminescence was used to monitor gene expression in transduced brain cells in living mice (Figure 4B). A bioluminescent signal was observed upon intraperitoneal (i.p.) injection of D-luciferin (100 mg/kg) in LV Cre-injected mice, but not in control mice (injected with 1% PBS/BSA). Bioluminescence was used to monitor gene expression over time (1, 2, 3, 4, 8, 12, and 16 weeks) without the need to sacrifice the mice. When compared with the control-injected animals, there was a tendency for increased Fluc bioluminescence signal over time, suggesting that donor cells are not removed from the brain after transduction and are thus a stable source of Cre-expressing cells to further produce bdEVs able to stably secrete endogenous EVs containing Cre (Figure 4B).
Figure 4.

Cre activity within the brain is shown through long-term transduction of neurons in vivo
(A) Generation of an endogenous brain source of Cre EVs upon intracranial injection of lentiviral vectors (LVs) into the striatum of Ai9 mice. (B) Firefly luciferase bioluminescence was used to monitor transduced brain cells in living mice. Stable production of Cre and Fluc in the brain was monitored by bioluminescence in vivo from 1 to 16 weeks following intracranial injection of LVs. (C) Brain sample processing. Ai9 animals intracranially injected with LV encoding Cre were sacrificed 4 and 16 weeks post-injection. Whole-brain coronal sectioning was performed, and sections processed for immunostaining or DNA/RNA extraction. (D) Immunofluorescence of coronal sections at the injection site at 4 weeks post-intracranial transduction. Brain cells expressing Cre (green) and tdTomato (red) upon intracranial injection of lentivirus encoding Cre in the striatum. Analysis performed with a Keyence BZ-X810 microscope 20×. Scale bar, 200 μm (injection site). (E) tdTomato-positive cells co-localize with parvalbumin and NeuN suggesting the majority of the transduced cells are inhibitory neurons. Nucleus is represented by DAPI staining. Images are representative of a group of five Ai9 animals. Analysis performed with a laser confocal microscopy equipped with Plan-Apochromat 40×/1.40 Oil DIC M27 (420782-9900). Scale bar, 20 μm (neurons). (F) Cre activity profile in the Ai9 mouse brain 4 weeks after LV injection. Whole-brain coronal sections were used to compare tdTomato mRNA expression levels in the brains of Ai9 mice injected with LV Cre (orange) or 1% PBS/BSA (gray). The highest tdTomato signal was detected at the injection site, decreasing in distal rostral and caudal regions (n = 4). Data are presented as tdTomato copies/μL, means ± SEM. (G) Cre activity in the Ai9 mouse brain increases over time. Comparison between tdTomato expression in the whole brain of LV Cre-injected mice after 4 weeks (orange) or 16 weeks (red). Area under the curve (AUC) of tdTomato expression among the two conditions is shown in copies × μm/μL, means ± SEM and compared by unpaired t test. ∗p < 0.05.
To evaluate the extent of EV communication throughout the brain, Ai9 animals were injected intracranially with LVs encoding Cre and sacrificed at 4 and 16 weeks post-injection. Whole-brain coronal sectioning was performed from the rostral to caudal regions and sections processed for immunostaining or DNA/RNA extraction (Figure 4C). The Cre source in the brain was characterized by immunofluorescence on coronal sections in the striatum of Ai9 animals 4 weeks after intracranial injection (Figure 4D). Cre-expressing cells were found to co-localize with tdTomato-expressing cells resulting from Ai9 reporter activity (Figure S4A). tdTomato-positive cells expressed the neuronal makers NeuN and parvalbumin (Figure 4E) and MAP2 (Figure S4B), suggesting that neurons also expressed PGK-Cre-UbC-Fluc. Moreover, GFAP-positive cells were found to partially co-localize with tdTomato-positive cells, suggesting that astrocytes were also partially transduced (Figure S4C). In contrast, IBA1-positive cells did not co-localize with tdTomato-expressing cells (Figure S5C), suggesting that microglia was not transduced by viral vectors or that they migrated to the injection site after the viral injection activity period.
To evaluate whether Cre activity diffuses from the injection site through extracellular mechanisms, longitudinal tdTomato expression profiles from the whole brain were investigated. To that purpose, coronal sections of Ai9 mice with a total thickness of ∼160 μm were collected from the rostral to the caudal region of the brain to extract RNA for ddPCR analysis. To evaluate whether extracellular mechanisms have a significant impact on tdTomato expression throughout the brain over time, we compared tdTomato expression in different sections from the whole brain 4 and 16 weeks after injection. At 4 weeks, we observed a high level of tdTomato at the injection site (0 μm) with a 14-fold increase in expression between control and LV Cre-injected mice with from 7 to 100 copies mRNA/μL (Figure 4F), while at adjacent (distance 1,150 μm) and peripheric regions (distance >3,450 μm) tdTomato levels were restricted to <75 and <20 copies/μL, respectively.
Remarkably, at 16 weeks post-injection, we observed a 10-fold increase of tdTomato expression across all brain sections compared with 4 weeks (Figure 4G), with an area under the curve of 2,749,457 copies × μm/μL (16 weeks) compared with 268,460 copies × μm/μL (4 weeks). The highest tdTomato expression was still observed at the injection site, nonetheless we observe a significant increase in the reporter levels at 16 weeks in the adjacent and peripheric sections compared with 4 weeks post-injection. These results suggest an increase in the spatial gradient of Cre activity over time, possibly due to extracellular mechanisms including EVs diffusion and transfer of Cre mRNA to peripheral brain regions. Moreover, it is unlikely to be mediated by the contribution of LVs spreading from the injection site, since they are not capable of replication and their half-life in culture is less than 48 h according to Dautzenberg et al.55 Although tdTomato expression is primarily driven by Cre activation of loxP sites, we cannot exclude the spreading of secondary bdEVs carrying tdTomato molecules from floxed cells. To exclude the contribution of bdEVs spreading reporter species, we physically separated two distinct brain regions: striatal donor cells secreting bdEVs carrying Cre mRNA and cerebellar recipient cells containing the reporter system, even though we were not successful in showing functional transfer of Cre activity over this extensive distance (Figures S5D–S5F).
More interestingly, we observed that bdEV communication is not restricted to the brain, as we were able to detect diffusion of EVs produced in the brain compartment into the bloodstream. SEC was used to isolate EVs from serum, followed by immunoprecipitation of EVs containing CD9, CD63, and CD81 (Figures S5B and S5C). Cre mRNA was detected in immunoprecipitated SEC EVs from serum of mice injected in the brain with LV Cre compared with their injected controls, corroborating our hypothesis that brain EVs can transfer Cre mRNA from the injection site to other regions and confirming the extension of bdEV communication beyond the brain.
Overall, these results suggest that localized sustained in vivo neuronal secretion of EVs induces effects in extended brain regions that accumulate over time.
bdEVs deliver functional Cre mRNA
To provide further evidence that extracellular transfer of Cre molecules from the striatum were mediated to some extent by bdEVs, we next set out to isolate these bdEVs by adapting previously described protocols.28,30,56 For this purpose, we digested brains of LV Cre-injected mice with collagenase type III and isolated bdEVs according to their density and size, as described in Figure 5A. bdEVs were isolated by OptiPrep (iodixanol) density gradient (ODG) (Figure S6A) and 10 fractions were collected according to their densities (Figure 5B)—fraction 1 corresponds to the lower-density fraction (1.02 g/mL) and fraction 10 to the higher-density fraction (1.25 g/mL). Then, we evaluated the protein amount in each fraction (Figure 5C). Fraction 1 corresponded to 32% of total protein decreasing to 1.8% in fraction 10, suggesting that protein distribution in fractions decreased as density increased. After applying a downstream ultracentrifugation step (100,000 × g for 2 h) of each individual fraction, the protein profile changed favoring bdEV isolation (Figure 5C). This latter purification step eliminated free protein contamination in the first fractions as demonstrated by our micro bicinchoninic acid (microBCA) measurements before and after ultracentrifugation (Figure 5C). The higher percentage of protein was found in ODG fractions 6, 7, and 8 (25%, 12%, and 14%) from the bdEV-associated pellet at 100,000 × g,53 with reduction of free proteins in the first fractions (fractions 1, 2, and 3, 5%, 9%, and 13%, respectively). These results emphasize the relevance of ultracentrifugation as a final step to wash and concentrate EVs. This protocol was used in the subsequent experiments to isolate bdEVs.
Figure 5.

Cre mRNA is detected in brain-derived EVs extracted from the brain
(A) Schematic illustration of the protocol used to isolate brain-derived EVs (bdEVs). (B) Density distribution of 10 fractions as result of iodixanol gradient centrifugation at 100,000 × g for 18 h. EV-enriched fractions were isolated in densities ranging from 1.105 to 1.165 g/mL (middle region) (n = 10). (C) Quantification of protein amount per fraction (in percentage) before and after 100,000 × g purification step. Before 100,000 × g purification step (blue bars), protein is highly enriched in the first fractions decreasing until fraction 10. After 100,000 × g purification step (yellow bars), the majority of free protein was washed out and the highest percentage of protein was located in EV fractions 6, 7, and 8 (n = 4). (D) Particle size distribution of each fraction (represented by mode) was evaluated by nanoparticle tracking analysis (NTA) (red bars). Fraction 1 showed the higher mode with 140 nm and decreasing in each fraction until fraction 10, which showed the mode of 90 nm (n = 3). (E) Particle concentration in each fraction was evaluated by NTA (green bars), with fractions 6, 7, and 8 accounting for more than 50% of total particles, while fractions 1 and 2 and 9 and 10 showed a lower concentration (n = 3). (F) Representative western blotting of 10 fractions obtained after ODG and ultracentrifugation of each fraction in PBS (loaded per volume) show the presence of positive EV markers HSC70 and Flotilin-1. The endoplasmic reticulum protein calnexin was detected in low levels in EV-enriched fractions. (G) Distribution of Cre exRNA in bdEV fractions was evaluated by qRT-PCR (Ct value). Fractions 6, 7, and 8 showed higher levels of Cre exRNA when compared with the other fractions (n = 4) (same volume was used as starting point). (H) Transmission electron microscopy of pool 1 (fractions 1–5) showed lipoproteins (red arrow) and few canonical bdEVs (blue arrow), pool 2 (fractions 6–8) was highly enriched in bdEVs (blue arrow) with cup-shaped format, and pool 3 (fractions 9–10) presented very low number of particles and some protein aggregates (orange arrows). Scale bars, 500 nm (big pictures) and 200 nm (pool 2, crop). Values are presented as mean ± SEM.
bdEVs were characterized in terms of particle size mode (Figure 5D) and particle concentration (Figure 5E) assessed by nanoparticle tracking analysis (NTA), we observed that particles from fraction 1 presented the higher particle size mode (140 nm), which gradually decrease until fraction 10 with the lowest size mode (90 nm) (Figures 5D and S6B). Particle concentration was higher in middle fractions, particularly in fractions 6 and 8, which represented 19.6% and 18.1% of the total particle concentration, respectively (Figure 5E). Interestingly, fractions 6, 7, and 8 accounted for more than 50% of total particles, which was increased by the 100,000 × g ultracentrifugation step.
We corroborated bdEV isolation through this method by western blotting for total protein (Figure S6C) and specific EV protein markers (Figure 5F). Fractions 6, 7, and 8 were positive for HSC70 (70 kDa) and Flotilin-1 (48 kDa). Interestingly, the protein calnexin (70 kDa) was detected in low levels in the EV-enriched fractions, suggesting that this type of EVs are made at contact sites with the endoplasmic reticulum, as suggested in Barman et al.57 Following the confirmation that EVs were derived from brain tissue, we aimed to evaluate the distribution of Cre exRNA in all fractions by RT-PCR. Interestingly, Cre exRNA was detected in EV-enriched fractions 6 (Ct = 32), 7 (Ct = 33), and 8 (Ct = 31) compared with other fractions (Figure 5G). A similar profile was detected when Fluc mRNA was analyzed in bdEVs (Figure S6D).
Taking these findings into consideration, we grouped the 10 fractions in 3 different pools based on particle characteristics (Figure 6A). We analyzed the size and concentration profile of each pool by NTA (Figure S6B) and performed transmission electron microscopy (TEM) to access EV morphology (Figure 5H). Pool 1 (fractions 1–5) was highly enriched in lipoproteins (red arrows), showing few canonical EVs, pool 2 (fractions 6–8) was highly enriched in EVs with cup-shaped morphology, and pool 3 (fractions 9–10) was depleted of EVs, showing mostly protein aggregates.
Figure 6.

Brain-derived EVs (bdEVs) are taken up by neurons and deliver functional Cre mRNA
(A) Schematic illustration of the protocol used to isolate bdEVs labeled with carboxyfluorescein succinimidyl ester (CFSE) from Cre-injected mice. Thick coronal sections containing the injection sites were used as starting material for the EV extraction. (B) CFSE-loaded bdEVs were exposed to neurons. The 10 fractions of CFSE-labeled EVs were divided in 3 pools: pool 1 (fractions 1–5), pool 2 (fractions 6–8), and pool 3 (fractions 9–10) after density gradient separation. Each pool was incubated with cultured primary hippocampal neurons and total CFSE fluorescence was measured. Scale bar, 5 μm. (C) Pool 2 presented the highest fluorescence signal when compared with the other two pools (n = 3/4). Data are presented as means ± SEM and compared by ordinary one-way ANOVA followed by Dunnett’s multiple comparisons test (F = 17.41). ∗∗p < 0.01. Scale bar, 20 μm. (D) Incubation of pool 2 of CFSE-labeled bdEVs (green) with HEK293T cells (red) in culture (left), followed by high-magnification image (right) of primary neurons internalizing bdEVs (green). Cells were stained with phalloidin (red) and DAPI (blue) and analyzed by laser confocal microscopy equipped with Plan-Apochromat 40×/1.40 Oil DIC M27 (420782-9900). Scale bars, 20 μm (left) and 5 μm (crop, right). (E) Imaris 3D rendering showing individual bdEVs (green) being internalized in primary hippocampal neurons in culture. Scale bar, 20 μm. (F) Schematic representation of bdEVs delivering functional Cre mRNA to FLExNanoluc reporter cells. (G) Detection of Cre activity by measurement of Nanoluc bioluminescence in FLExNanoluc reporter cells. The same number of particles was incubated in control (white bars) and Cre conditions (orange bars). The highest luminescent peak was detected in pool 2 containing Cre when compared with control pool 2 carrying the same number of bdEVs without Cre. Values are presented as mean ± SEM and compared by unpaired t test. ∗p ≤ 0.05; ns, not significant. (H) Detection of Cre activity was confirmed at DNA level by analyzing the ratio between FLExON (recombined) and FLExOFF (non-recombined) between control and Cre samples. Values are presented as mean ± SEM and compared by unpaired t test. ∗p ≤ 0.05; ns, not significant.
Considering the successful isolation of bdEVs from brain tissue, our next goal was to evaluate whether retrieved vesicles were functional and could be effectively taken up by recipient brain cells. bdEVs were labeled with a green fluorescent dye, carboxyfluorescein succinimidyl ester (20 μM CFSE), and isolated by ODG followed by ultracentrifugation (Figure 6A). Upon measuring CFSE fluorescence in all fractions, we observed a gradual decrease in fluorescence from fraction 1 to fraction 7, with an increase in fraction 8 (Figure S6E). We hypothesized that fluorescence from the first fractions corresponded to free CFSE molecules nonspecifically bound to lipoproteins, while the peak in fraction 8 corresponds to CFSE incorporated into bdEVs (Figure S6E).
To evaluate whether CFSE-labeled bdEVs could be internalized by recipient cells, the three pools described above, pool 1 (fractions 1–5), pool 2 (fractions 6–8), and pool 3 (fractions 9–10), were incubated with HEK293T cells (Figure S6H) and primary hippocampal rat neurons (Figure 6B). The uptake was assessed by measuring the fluorescence intensity after 6 h of incubation with bdEVs. Pool 2, corresponding to bdEVs, presented over 2-fold increase in fluorescent signal with a mean value of 0.55 a.u. compared with pool 1 with a mean value of 0.23 a.u. and pool 3 with a mean value of 0.16 a.u. (Figure 6C, ∗∗p < 0.01), suggesting that cells exposed to pool 2 took up CFSE-labeled particles. In addition, confocal microscopy confirmed CFSE-labeled bdEV internalization by recipient HEK293T cells (Figure S6H) and primary neurons (Figure S6G) after 6 h of incubation. Moreover, a high-magnification image showed that bdEVs accumulated in the cytoplasm of HEK293T cells (Figure 6D). Similar results were observed in rat primary neuronal cultures, where CFSE-labeled bdEVs (pool 2) were efficiently internalized (Figure S6G). A 3D rendering reconstitution of primary hippocampal neurons internalizing bdEVs from pool 2 showed individual bdEVs inside cells, particularly present in neuronal extensions (Figure 6E).
To study bdEV fate post-uptake, pools of bdEVs isolated from brains of Cre- and control-injected mice were isolated, as described above, and incubated with FLExNanoLuc reporter cells (Figure 6F). After 72 h, cells were analyzed for Nanoluc bioluminescence as a result of Cre activity. We found no significant difference between incubation with pool 1 (fractions 1–5) or pool 3 (fractions 9–10) from Cre or control mice, suggesting the absence of functional Cre exRNA. However, a significant increase in Nanoluc bioluminescence (∗p < 0.05) was observed in FLEx reporter cells incubated with pool 2 (fractions 6–8) from Cre-injected animals (84,011 RLU) compared with controls (72,295 RLU), suggesting that bdEVs can deliver functional Cre mRNA ex vivo (Figure 6G). To confirm our results, Cre activity was confirmed by RT-PCR of gDNA using discriminatory primer pairs between FLExON (recombined) and FLExOFF (non-recombined) gDNA. We detected a 50% increase (∗p < 0.05) in pool 2-derived bdEVs from Cre-injected animals compared with bdEVs of control-injected animals (Figure 6H).
Collectively, our data provide evidence that the bdEV-enriched fraction from brain tissue is functionally active, being internalized by neurons and delivering functional Cre mRNA cargo with the ability to induce Cre activity in recipient cells.
Discussion
In this study, we report a sensitive bioluminescence reporter system that allows us to track the uptake of Cre species mediated by extracellular mechanisms, particularly bdEVs, by the permanent recombination at loxP DNA sites. Upon establishing a striatal source of bdEVs carrying Cre mRNA in mouse brain, we showed a spatial gradient of tdTomato expression in the brain up to 3,500 μm away from the bdEV donor cells and detected EVs containing Cre mRNA circulating in the bloodstream. In addition, upon extracting bdEVs from striata of injected mice, we confirmed bdEV morphology and integrity and observed the transfer of functional Cre mRNA from bdEVs to primary hippocampal neurons.
bdEVs detected in biofluids, such as serum and cerebrospinal fluid, have been studied as potential diagnostic and prognostic biomarkers for brain diseases.3,58,59,60 However, the physiological role of bdEVs in brain communication to near and long distances remains largely unknown. Conclusions about their functions have been based on in vitro experiments, typically using a disproportionally high number of concentrated EVs exposed to a small population of neuronal cells for short periods of time to increase the sensitivity of detection32 and are thus not fully representative of physiological conditions in vivo. In this study, we aimed to translate previous in vitro findings to animal models by tracking the uptake of endogenous bdEVs carrying Cre mRNA in reporter cells through DNA recombination within the brain environment using floxed reporters in transgenic mice.
To create a localized brain region continuously secreting physiological levels of EVs carrying exogenous RNAs, we started by transducing the striatum of Flox-tdTomato Ai9 reporter mice through intracranial injection of a LV encoding Fluc and Cre genes. These transgenes were regulated by ubiquitous promoters to ensure gene expression in the majority of cell types.48 To minimize the content of recombinant proteins in EVs, H2B and NLS peptides were fused to Fluc and Cre, respectively. Both proteins were predominantly located in the nucleus, while their mRNA products remained predominantly in the cytoplasm, thereby accessible to be loaded into EVs. Indeed, we detected Cre mRNA in EVs, even without having EV packaging signals, such as zipcodes61 or exomotifs,62,63,64 which suggests that Cre mRNA is naturally packaged into EVs, probably due to its overexpression in donor cells. On the contrary, we were not able to detect Cre protein in EVs, which is in line with other reports.44,45,47,65 Even though the Cre protein remained undetected in EVs in our work, it has been described previously to be packaged in EVs through passive loading9 or by direct fusion with transmembrane proteins.43 Different findings can be potentially associated with the lack of nucleus targeting sequences fused to Cre, detection limit differences in RT-PCR and western blot, and EV isolation methods.
Our data demonstrate that long-term transduction of striata with LVs encoding Cre and Fluc genes can be established in the brain and monitored by Fluc bioluminescence in living animals, suggesting that a permanent neural source of Cre bdEVs was achieved in a limited brain region. Indeed, we isolated bdEVs from brain tissue of these animals and investigated the delivery of functional mRNA in vitro. Our optimized bdEV isolation protocol using a four-layer ODG provided the isolation and enrichment of bdEVs restricted to just three fractions, as confirmed by the presence of typical EV markers and bdEV cup-shaped morphology. Of note, despite bdEV enrichment based on traditional EV markers, including HSC70 and Flotilin-1, further optimization would be useful to reduce cell-derived contaminants, similar to what was described previously in Huang et al.30 In this study, we carried out DNase treatment before ODG to reduce nucleic acids contaminants that might lead to aggregation of bdEVs, proteins, and cell contaminants. However, further measures can be taken to eliminate the co-isolation of DNA originating from nuclei disruption or organelle isolation, such as amphisomes or autophagosome,66,67 adsorption of corona protein contaminants on the bdEV surface,68 or the co-isolation of particles with overlapping size and density either biologically or protocol driven. This protocol could be improved by increasing the time of tissue digestion from 20 min to several hours together with a reduction of manual disruption and immunocapture of bdEVs based on surface markers.
Although ubiquitous promoters were used, our study was mainly focused on bdEVs secreted by neurons and partially astrocytes, as oligodendrocytes and microglia were not significantly transduced by the LV. Interestingly, we also observed diffusion of bdEVs from the brain to other body compartments. Cre mRNA was found associated with serum circulating bdEVs after isolation by SEC and tetraspanin immunoprecipitation based on the presence of CD63, CD81, and CD9. bdEVs isolated from transduced neural cells were not only enriched in Cre mRNA, but also retained their integrity, functionality, and capacity to deliver Cre mRNA to recipient cells, corroborating their role in transferring functional cargo within the brain compartment and beyond. The analysis of tdTomato expression in peripheral organs would also be informative to evaluate to what extent bdEVs can deliver functional cargo beyond the CNS. In addition, to confirm peripheral diffusion of bdEVs secreted from neural cells into the bloodstream, future analyses should focus on methods to restrict expression to a certain cell type, in this way preventing transduction of blood cells in the brain that may diffuse to peripheral tissues.59 Definitive surface markers for bdEVs would be helpful to distinguish different subpopulations of neural EVs, as neuronal markers such as L1CAM or NCAM were shown previously to be present in EVs from other tissues26,27 and are thus not exclusive of neural cells. Indeed, it has recently been reported that neural cell-type-specific EV markers exist for excitatory neurons (ATP1A3, NCAM1), astrocytes (LRP1, ITGA6), microglia-like cells (ITGAM, LCP1), and oligodendrocyte-like cells (LAMP2, FTH1).31
To detect the transfer of functional cargo by bdEVs at physiological levels, we used a reporter system encoding for an inverted sequence of the Nanoluc gene between Lox regions. Due to its high sensitivity, the expression of Nanoluc in reporter cells is beneficial to detect a low number of Cre-mediated functional events in a limited time frame. Indeed, our previously published FLExNanoluc system50 showed robustness in detecting Cre activity mediated by EV delivery through the expression of Nanoluc. In the brain, we took advantage of the well-established Flox-TdTomato Ai9 mouse model,39 which expresses tdTomato upon Cre recombination, to track the uptake of bdEVs carrying functional Cre mRNA. To allow the detection of tdTomato expression distally from the injection site, we narrowed the region of interest by performing brain coronal sectioning before analysis. Indeed, tdTomato expression was demonstrated following intracranial injection of concentrated EVs containing Cre mRNA in the striatum of Ai9 mice, overcoming the need for additional steps, such as fluorescent cell sorting of brain cells.42,44,69,70
LVs do not replicate and are mostly localized in a restricted region surrounding the injection site compared with an intracranial injection of AAV vectors.71 The continuous secretion of bdEVs carrying Cre mRNA from the injection site to the surrounding areas allowed tracking of bdEV-mediated communication to other Ai9 neural cells in physiological conditions over time. The uptake of bdEVs containing functional Cre mRNA induced a permanent DNA recombination in recipient Ai9 neural cells was detected by ddPCR for tdTomato mRNA in brain sections. This technique enabled us to reveal the distribution patterns of bdEVs produced and secreted by neurons and astrocytes in the striatum. However, the methodology used did not allow to differentiate internalization by specific cell types. Of note, LV expression was mainly restricted to the injection site since they are highly fusogenic and unable to replicate in vivo. We observed a spatial gradient of tdTomato expression from the injection site into the rostral and caudal regions, caused by the continuous spreading of functional Cre exRNA, with a peak at the injection site (0 μm) primarily caused by the lentiviral injection and magnified by bdEV diffusion at short distances in the brain over time. A previous study, detected a similar spatial gradient 500 μm away from the injection site after an intracranial injection of AAV8 encoding Cre into CD63-floxed mice, leading to the secretion of CD63-GFP protein in bdEVs from the injection site to the surrounding regions.72 Surprisingly, we were able to detect tdTomato expression 3,500 μm away from the injection site, possibly due to permanent DNA recombination following the uptake of EVs carrying Cre mRNA in Ai9 reporter cells. Although both methods were able to detect long-term spreading of bdEVs in brain cells, further optimization should be considered to distinguish primary bdEVs transporting functional Cre molecules and secondary bdEVs transporting the product of Cre recombination within the brain. The methodologies used in both studies could not overcome or distinguish the potential spreading of reporter coding forms in bdEVs within the brain, including the spreading of tdTomato exRNA in bdEVs or CD63-GFP protein bdEVs from the injection site to other regions, respectively. Despite that, differences in signal intensity coming from primary or secondary bdEVs should exist since primary Cre-mediated recombination may result in higher expression levels rather than transfer of secondary product mRNA or proteins. We attempted to overcome this obstacle by showing communication between striatum secreting bdEVs carrying Cre mRNA and cerebellum containing the reporter system, even though we did not achieve reliable success (Figures S5D–S5F). To overcome this issue, future analysis of the recombined sequence at the gDNA level would dismiss the contribution of secondary bdEVs transporting tdTomato molecules. Moreover, other types of extracellular communication recently described, such as exomeres, supermeres, and TNTs,4 cannot be discarded and could account for the spreading of both Cre forms and secondary reporters.
In conclusion, our work demonstrates active brain communication between neural cells through bdEVs. Cre-loxP systems allow the detection and permanent recording at DNA level of the uptake of physiological levels of bdEVs. bdEVs mediated the delivery of functional Cre mRNA to distal brain regions in vivo and in vitro thus results in genomic footprints in recipient cells. By mimicking the continuous physiological secretion of Cre exRNA in the brain we were able to corroborate previous in vitro findings and provide further evidence for functional bdEV delivery in vivo and in vitro. The spatiotemporal control of both source cells secreting Cre-containing bdEVs and loxP reporter systems within the brain will contribute to revealing the role of bdEVs in extracellular communication.
Materials and methods
Animals
C57BL/6 and BALB/c mice (Charles River Laboratories) were maintained in groups (2–5 per cage) in plastic cages (365 × 207 × 140 mm) with unlimited access to water and food under a 12-h light/dark cycle at a room with constant temperature (22°C ± 2°C) and humidity (55% ± 15%). Equal number of male and female mice ranging from 8 to 10 weeks of age were randomly assigned to experimental groups. Animals were allowed 1 week of acclimatization to the surroundings before the beginning of stereotaxic injections. The physical state of animals was evaluated daily, and weight measured every week.
All animal experimental protocols were approved by: the Massachusetts General Hospital Institutional Animal Care and the European Union Directive 86/609/EEC for the care and use of laboratory animals. This study is part of a research project that was approved by the Center for Neuroscience and Cell Biology ethics committee (ORBEA_66_2015_/22062015 and ORBEA_289_) and the Portuguese Authority responsible for the regulation of animal experimentation, Direcção Geral da Agricultura e Veterinária (DGAV 0421/000/000/2015).
Researchers received adequate training (Federation of European Laboratory Animal Science Associations [FELASA]-certified course) and certification from Portuguese authorities (Direcção Geral de Alimentação e Veterinária) to perform the experiments.
LV production, isolation, and titer assessment
LVs encoding for the PGK-Cre-UbC-Fluc plasmid and FlexNanoluc plasmid were produced in the HEK293T cell line with a three-plasmid system, following Addgene recommendations. In brief, cells were seeded and, 24 h later, transfected with psPAX2 (Addgene, plasmid no. 12260) and pMD2.G (Addgene, plasmid no. 12259) packaging plasmids and CreFluc or FlexNanoluc plasmids. Six hours after transfection, cells were washed with PBS and incubated in new culture medium. LV isolation was performed 48–72 h later upon ultracentrifugation at 70,000 × g followed by pellet re-suspension in 1% PBS/BSA. The viral particle content was evaluated by assessing HIV-1 p24 antigen levels by ELISA 2.0 (Retro Tek, 0801002), in accordance with the manufacturer’s instructions. Concentrated viral stocks were stored at −80 °C until use.
Stereotaxic injection into the mouse brain
C57BL/6J mice (aged 8–10 weeks) were anesthetized using 2.5% isoflurane in 100% oxygen via a nose cone. Mice were stereotaxically injected into the striatum with the following coordinates: anteroposterior, 0.6 mm; lateral, ±1.8 mm; ventral, 3.3 mm relative to bregma; and tooth bar, 0, with concentrated LVs in a final volume of 3 μL/injection containing 400 ng p24 antigen (capsid protein). Control animals were injected with 3 μL 1% PBS/BSA. For cerebellar injections in deep cerebellar nuclei we used the following coordinates: anteroposterior, −6.5 mm; lateral, ±0.75 mm; ventral, −3.3 mm relative to bregma (bregma and lambda aligned). LVs were injected in a final volume of 4 μL/injection containing 450 ng p24 antigen. The infusion was performed at an injection rate of 0.25 mL/min using a 10-mL Hamilton syringe. Five minutes after the infusion was completed, the needle was retracted 0.3 mm and allowed to remain in place for an additional 3 min before its complete removal from the mouse brains.73 The skin was closed using a 6-0 Prolene suture (Ethicon, Johnson and Johnson, Brussels, Belgium). Mice were kept in their home cages for the corresponding experimental period, before being sacrificed for EVs enrichment, Western blot, qPCR, and immunohistochemical analysis.
In vivo bioluminescence analysis
Stable lentiviral transduction in the brain was monitored by assessing Fluc bioluminescence periodically, using a Xenogen IVIS 200 Imaging System (PerkinElmer). For each determination, mice were anesthetized using 2.5% isoflurane in 100% oxygen via a nose cone and injected i.p. with D-luciferin (100 mg/kg). Bioluminescence images were acquired 5–10 min after D-luciferin injection. Analysis was performed using Living Image software 4.3.1 (PerkinElmer) and quantification of the bioluminescent signal was obtained from a region of interest drawn around the cranium.
Mouse tissue preparation for immunohistochemistry and DNA/RNA extraction
One to 4 months after LV injections mice were perfused with 1% PBS under lethal administration of ketamine and xylazine injected i.p. Blood and brain were collected and stored at −80°C. Mouse brains were coronally sectioned with 16 μm thickness on a freezing cryostat (Leica Microsystems, CM3050S). Brain sections were alternately collected for immunohistochemistry or RNA/DNA extraction.
Immunohistochemistry
Brain sections were post-fixed with 4% PFA for 10 min and then washed with PBS 3 times and incubated 30 min with blocking solution (PBS/0.1% Triton X-100 containing 10% normal goat serum (Sigma-Aldrich)) and then incubated overnight at 4°C in blocking solution with primary antibodies: mouse anti-CRE (1:1,000, Sigma, F3165-2MG), mouse anti-luciferase (1:1,000, Sigma, F3165-2MG), mouse anti-parvalbumin (1:1,000, Sigma, F3165-2MG), mouse anti-MAP2 (1:1,000, Sigma, F3165-2MG), rabbit anti-NeuN (1:1,000, Sigma, F3165-2MG), and rabbit anti-IBA1 (1:1,000, Sigma, F3165-2MG). Sections were washed with PBS and incubated for 2 h at RT with the secondary antibodies: goat anti-mouse IgG Alexa Fluor 488 (1:500, Thermo Fisher Scientific, A31560) and goat anti-rabbit IgG Alexa Fluor 647 (1:1,000, Invitrogen, A32728) diluted in blocking solution. The sections were washed with PBS and incubated during 10 min with DAPI (1:5,000, Sigma), washed, and mounted with Vectashield Antifade Mounting Medium (Vector Labs, H-1000). Immunofluorescence was visualized and imaged with a Keyence BZ-X810 microscope, a Zeiss LSM 510 Meta confocal microscope (Carl Zeiss MicroImaging), equipped with EC Plan-Neofluar 40×/1.30 Oil DIC M27 (420462-9900) and Plan-Apochromat 63×/1.40 Oil DIC M27 (420782-9900) objectives and LSM Image software.
Imaris 3D rendering
Carl Zeiss z stack laser scanning confocal image files were reconstructed using Imaris software (Bitplane, version 9.6.1). The phalloidin staining was used to create a 3D cell-surface mask (represented in pink), which was then applied to select the bdEVs (green dots) present inside of the neuronal cells.
Cell culture and transduction
HEK293T cells were maintained in standard Dulbecco’s modified Eagle’s medium (DMEM) (Sigma) supplemented with 10% fetal bovine serum (Life Technologies) and 1% penicillin/streptomycin (Gibco) and grown at 37°C in 5% CO2. Stock cells were passaged 2–3 times/week with 1:6 split ratio and used within 10–20 passages. Cells were tested for mycoplasma contamination monthly and found negative. Cells grown for EV isolation were cultured in medium supplemented with 10% EV-depleted FBS (FBS was depleted of EVs by 18 h centrifugation at 100,000 × g and the resulting supernatant was filtered at 220 nm).
Cell transduction
HEK293T cells were transduced 24 h after plating with LVs encoding PGK-Cre-UbC-Fluc or FlexNanoluc constructs at a ratio of 400 ng p24 antigen per 200,000 cells. Twenty-four hours later, the medium was replaced with regular medium and cells were cultured and expanded under standard conditions. Luminescence (PGK-Cre-UbC-Fluc construct) and fluorescence (FlexNanoluc construct) were monitored weekly.
Transwell of Cre- and FlexNanoluc-expressing HEK293T cells
HEK293T cells transduced with the FlexNanoluc construct were seeded in the bottom chamber of 12-well plates at 100,000 cells/well in DMEM (Thermo Fisher Scientific) supplemented with 10% FBS (Thermo Fisher Scientific). Meanwhile, HEK293T cells transduced with the Cre construct were seeded in the upper chamber of a 1.0-μm-pore Transwell system at 50,000 cells/well in DMEM supplemented with 10% FBS. After 24 h, Cre-expressing cells were transfected with the CMV-STEAP3-SDC4-NadB plasmid55 to boost EV production. Control Cre cells were not transfected. Six hours following transfection, cells were washed in PBS and fresh medium was added. Twelve hours later, the Transwell systems seeded with Cre-expressing cells were incubated with FlexNanoluc-expressing cells in 12-well plates. After 48 h, cells from the bottom chamber were collected with Passive Lysis Buffer (Promega), luminescence was measured, and DNA extraction was performed as described elsewhere.
Bioluminescence assays
Fluc and Nanoluc expression in EVs, cells, and cerebellum collected with Passive Lysis Buffer (Promega) were analyzed with the addition of luciferin (100 mg/mL) or furimazine (Nano-Glo Luciferase, Promega) diluted 1:200 to 1:500 in 1× PBS, respectively. Samples were incubated with the reagent for at least 1 min before reading on Synergy H1 Hybrid Multi-Mode Reader (BioTek) or FLUOstar Omega Microplate Reader (BMG LABTECH). At least two reads were performed on each sample, and the average values were considered for analysis. For luminescence readings, samples were loaded into white 96-well culture plates (Lumitrac 200) or opaque 96-well plate (Corning). Each sample was loaded in duplicate with a volume of ranging from 20 to 100 μL in each well.
Isolation of EVs by SEC
Conditioned medium was collected from cells after 48–72 h (approximately 80% confluency) and centrifuged at 300 × g for 5 min to remove cellular debris. The supernatant was then concentrated with 100 kDa molecular weight concentrator (UFC9100, Amicon Ultra-15 Centrifugal filters) to a final volume of 0.5 mL (spun at 6,000 × g for 15 min). Concentrated medium was loaded onto qEV Original SEC columns (SP1, IZON Science) and 500 μL fractions were collected by elution with PBS using the automatic fraction collector according to the manufacturer’s protocol. The first five fractions correspond to high particle/low protein fractions (typically described as fractions from 7 to 11) were further concentrated with 30 kDa molecular weight concentrators (UFC503096, AmiconUltra-0.5 Centrifugal filters) to a final volume of 50–100 μL.
EV enrichment from brain tissue
A thick coronal section (1–2 cm of thickness) from the injection site was collected per mouse and stored at −80°C, until further processing. The frozen tissue was sliced lengthwise on ice to generate 1–2 cm long, 2–3 mm wide tissue sections.28,30,56 The tissue pieces from each sample were weighed and incubated with 50 U/mL collagenase type 3 (code: CLS-3, cat. no. LS004182, Worthington) in Hibernate-E medium (at a ratio of 8 μL/mg tissue) in a shaking incubator (25°C–27°C for 20 min). After 10 min of incubation, samples were inverted twice, 5 min later pipetted up and down twice and incubated for another 5 min, followed by addition of ice-cold 10× inhibition buffer containing 10× protease inhibitors (cOmplete Mini Proteinase Inhibitor [Roche], phenylmethylsulfonyl fluoride) and 10× phosphatase inhibitors (sodium orthovanadate and sodium fluoride) in PBS with a final concentration of 1×. The digested brain extracts were subjected to a centrifugation step at 4°C, 300 × g for 5 min. The supernatant was collected and centrifuged at 4°C, 2,000 × g for 10 min. The resulting supernatant was collected and further centrifuged at 4°C, 10,000 × g for 30 min. Supernatant (1 mL) was then incubated with 5 μL of DNase (Sigma D-5025) 10 mg/mL for 10 min and then filtered with a 0.22-μm filter (Millipore).
The 10,000 × g supernatant was loaded on top of a four-layer ODG containing 40, 20, 10, and 5 mM OptiPrep reagent (Sigma-Aldrich) in ultra-clear SW41Ti tubes (Beckman Coulter). The ODGs were centrifuged at 100,000 × g at 4°C for 18 h in SW41Ti rotor (Beckman Coulter). Ten fractions (F1, F2, F3, F4, F5, F6, F7, F8, F9, and F10, each of 1 mL) were collected, weighed, and densities calculated. Each fraction was subjected to a washing step in ice-cold PBS at 100,000 × g at 4°C for 2 h using a SW28Ti rotor (Beckman Coulter). The pelleted EVs were resuspended in ice-cold PBS. Samples were analyzed by NTA and then processed with AllPrep DNA/RNA/Protein Mini Kit (QIAGEN, cat. no. 80004).
Immunomagnetic isolation of EVs from serum
Up to 2 mL of EVs isolated by SEC from serum of C57BL/6J mice stereotaxically injected in the striatum with LVs encoding for Cre construct were incubated with 25 μL of CD9, CD63, or CD81 MicroBeads (Miltenyi Biotec) overnight at 4°C in a tube rotator in the absence of light. Equilibration buffer (100 μL) was applied on top of a μColumn (Miltenyi Biotec) that was previously placed in the magnetic field of the μMACS Separator attached to the MACS MultiStand and rinsed 3 times with 100 μL of isolation buffer. The magnetically labeled samples were applied to the column that was placed in a mMACS Separator (Miltenyi Biotec). The column was washed 4× with isolation buffer and then placed in 1.5-mL tubes. The sample was eluted by adding 100 μL RNA lysis buffer (Miltenyi Biotec) to the column and flushed out by firmly pushing the plunger into the column. Downstream isolation of EV-derived RNA was performed using a Total RNA Purification Plus Kit (Norgen) according to manufacturer’s instructions. cDNA synthesis for mRNA was performed with an iScript cDNA Synthesis Kit (Bio-Rad) and RT-PCR was performed with the SsoAdvanced SYBR Green Supermix Kit (Bio-Rad) using the StepOnePlus Real-Time PCR System (Applied Biosystems).
DNA, RNA, and protein extraction
DNA, RNA, and protein extractions were performed from cultured cells, brain sections, and EVs following the protocol recommendations of the RNeasy Plus Micro Kit (QIAGEN, cat. no. 74034) and the AllPrep DNA/RNA/Protein Mini Kit (QIAGEN, cat. no. 80004). Isolated DNA and RNA samples were quantified by Nanodrop (Thermo Fischer Scientific) and Bioanalyzer 2100 (Agilent Technologies, Santa Clara, CA). Protein concentration was determined by Bradford assay (Bio-Rad) for protein extracted from cultured cells or brain sections and microBCA for protein extracted from EVs according to the manufacturer’s instructions (Bio-Rad).
cDNA synthesis and RT-PCR
RNA samples were reverse transcribed using the SuperScript VILO cDNA Synthesis Kit (Thermo Fisher Scientific) and the iScript Selected cDNA Synthesis kit (Bio-Rad) according to manufacturer’s instructions and stored at −20°C. qRT-PCR was performed using the primers described in Table 1. Gene expression was determined using the SYBR Green Protocol qPCR Mix, as prepared following the manufacturing protocol of Power SYBR Green PCR Master Mix (Applied Biosystems, Beverly, MA) and with the SsoAdvanced SYBR Green Supermix Kit (Bio-Rad). qPCR was started with enzyme activation by heating at 95°C during 10 min, followed by 40 cycles of two steps: 95°C for 20 s and 60°C for 1 min. To verify PCR specificity, a melting curve was performed, with the following program: 95°C for 20 s, 60°C for 1 min, and 60°C–95°C with an increment of 0.3°C per 15 s. RT-PCR was performed using the QuantStudio 3 PCR system (Applied Biosystems) or StepOnePlus Real-Time PCR System (Applied Biosystems).
Table 1.
Primer sequences used in qRT-PCR
| Primer name | Primer sequence | Observations |
|---|---|---|
| Forward Cre PP5 | CGCGGTCTGGCAGTAAAAAC | |
| Reverse Cre PP5 | GTTCGAACGCTAGAGCCTGT | |
| Forward 5′ Cre PP10 | CGGTCGATGCAACGAGTGAT | |
| Reverse 5′ Cre PP10 | CAGGTATGCTCAGAAAACGCC | |
| Forward 3′ Cre PP7 | ACCAGCCAGCTATCAACTCG | |
| Reverse 3′ Cre PP7 | ACCATTGCCCCTGTTTCACT | |
| Forward h2bFirefLy_PP4 | GGAGAGCAACTGCATAAGGC | |
| Reverse h2bFirefLy_PP4 | CACTACGGTAGGCTGCGAAA | |
| Forward Nanoluc_PP2 | AAGGATTGTCCTGAGCGGTG | |
| Reverse Nanoluc_PP2 | AACACGGCGATGCCTTCATA | forward primer for FLEx unfloxed sequence (FLExOFF) reverse primer for FLEx floxed sequence (FLExON) |
| Forward EF1A_PP2 | GGGGAGGGGTTTTATGCGAT | forward primer for FLEx floxed sequence (FLExON) |
| Reverse EF1A_PP2 | CGCTATGTGGATACGCTGCT | |
| Forward WPRE | CGCTATGTGGATACGCTGCT | |
| Reverse WPRE | GTTGCGTCAGCAAACACAGT | reverse primer for FLEx unfloxed sequence (FLExOFF) |
| Forward hHPRT | TTGCTTTCCTTGGTCAGGCA | |
| Reverse hHPRT | ATCCAACACTTCGTGGGGTC | |
| Forward mHPRT | CATCCTCCTCAGACCGCTTT | |
| Reverse mHPRT | TCATCGCTAATCACGACGCT | |
| Forward hGAPDH | CCCCGGTTTCTATAAATTGAGCC | |
| Reverse hGAPDH | TGGCTCGGCTGGCGAC | |
| Forward mGAPDH | TGGAGAAACCTGCCAAGTATGA | |
| Reverse mGAPDH | GGTCCTCAGTGTAGCCCAAG | |
| Forward Ai9 CAG | GCAACGTGCTGGTTATTGTG | forward primer for Ai9 sequence |
| Reverse UNFLOXED | TGCAAGCTTTCATTTATTCATCGC | reverse primer for stop/poly(A) region between loxP regions |
| Reverse Ai9_U1140_ | TTTGATGACCTCCTCGCCCT | reverse primer for tdTomato sequence |
ddPCR
To evaluate levels of gene expression of tdTomato and GAPDH in cells and brain coronal sections, gene expression of tdTomato (TaqMan probe FAM - Mr07319439_mr [Thermo Fisher Scientific]) and GAPDH59,74 was analyzed using ddPCR following the PrimePCR ddPCR Gene Expression Probe Assay (Bio-Rad). Using the manufacturer’s protocol, droplets were generated with the DG8 Cartridge using a QX200 droplet generator, and PCR was performed with thermal cycling conditions using a QX200 Droplet Reader and QuantaSoft Software (Bio-Rad) to analyze mRNA levels.
Western blotting
Total protein from cells and EVs was extracted in RIPA buffer (50 mM Tris-base, 150 mM NaCl, 5 mM EGTA, 1% Triton X-100, 0.5% sodium deoxycholate, 0.1% SDS supplemented with cOmplete Mini Proteinase Inhibitor [Roche] and 0.2 mM phenylmethylsulfonyl fluoride, 1 mM DTT [dithiothreitol], 1 mM sodium orthovanadate, and 5 mM sodium fluoride). Protein concentration was determined by Bradford assay according to the manufacturer’s instructions (Bio-Rad). Protein samples were denatured (95°C for 10 min) with 6× sample buffer (0.375 M Tris [pH 6.8], 12% SDS, 60% glycerol, 0.6 M DTT, and 0.06% bromophenol blue [all from Sigma-Aldrich]]. Samples were resolved by electrophoresis on 10% or 12% SDS-PAGE gels and transferred onto polyvinylidene fluoride membranes (GE Healthcare). Total protein labeling was performed using No Stain Labeling Reagent (Invitrogen) according to the manufacturer’s protocol. Membranes were blocked by incubation in 5% non-fat milk powder in 0.1% Tween 20 in Tris-buffered saline (TBS-T) and incubated overnight at 4°C with primary antibodies: ALIX (1:1,000, BD Biosciences, 611620), calnexin (1:1,000, Santa Cruz, sc-11397), CD63 (1:500, DSHB, AB528158), CRE (1:1,000, Millipore, MAB3120), Flotillin-1 (1:1,000, BD Biosciences, 610820), HSC70 (1:1,000, GeneTex, GTX101144), Lamp-2 (1:1,000, Santa Cruz, sc18822), and TSG101 (1:1,000, BD Biosciences BD612696). Then, the membranes were washed 3 times in TBS-T for 10 min each and incubated with an alkaline phosphatase-linked secondary goat anti-mouse/anti-rabbit antibody (1:10,000; Thermo Scientific Pierce) at RT for 1 h. Bands were visualized with Enhanced Chemifluorescence substrate (GE Healthcare) using chemifluorescence imaging (ChemiDoc Imaging System, Bio-Rad). Analysis was carried out based on the optical density of scanned membranes in ImageLab version 5.2.1 (Bio-Rad).
Characterization of EVs by TEM
bdEVs (isolated by ODG) were fixed with 2% PFA and allowed to absorb on Formvar-carbon-coated grids (TAAB Laboratories Equipment) for 5 min. The excess liquid was blotted off the film surface using filter paper (Whatman). Then, the grids were contrasted with 2% uranyl acetate and, after 1 min, the excess stain was blotted off and the sample air dried. Observations were carried out using a Tecnai G2 Spirit BioTwin electron microscope (FEI) at 100 kV.
Characterization of EVs by NTA
The number of EVs diluted in PBS was assayed using an NTA v.2.2 Build 0375 instrument (NanoSight). Particles were measured by the acquisition of five videos of 30 s and the number of particles (30–800 nm) was determined using NTA software 2.2. Samples were diluted 1:1,000 in PBS before analysis. The following photographic conditions were used: frames processed (1,498 of 1,498 or 1,499 of 1,499), frames per second (24.97 or 24.98 f/s), calibration (190 nm/pixel), and detection threshold (6 or 7 multi). The number of particles per frame was within the recommended range of 20–100 particles/frame for NanoSight NS300.
gDNA recombination analysis
To evaluate gDNA recombination mediated by Cre, two pairs of primers were generated to amplify either the floxed sequence or the unfloxed sequence (described in Table 1). Each pair of primers is either specific for the floxed sequence (gDNA recombination upon CRE activation) or the unfloxed sequence (non-recombined gDNA). Gene expression was determined using the SYBR Green Protocol qPCR Mix, as prepared following the manufacturing protocol of Power SYBR Green PCR Master Mix (Applied Biosystems, Beverly, MA) and with the SsoAdvanced SYBR Green Supermix Kit (Bio-Rad). qPCR was performed using QuantStudio 3 PCR system (Applied Biosystems) or StepOnePlus Real-Time PCR System (Applied Biosystems).
EV-TRACK
We have submitted all relevant data of our experiments to the EV-TRACK knowledgebase (EV-TRACK ID: EV230574).75
Acknowledgments
We thank Shilpa Prabhakar, Sevda Lule, and Lisa Nieland for helping in bioluminescence acquisition. We thank João Peça and Joana Guedes for support with Ai9 colony. We thank Ana Luisa Cardoso for the support with MACs system. CMV-STEAP3-SDC4-NadB booster plasmid and CD63-Nanoluc were kindly provided by Martin Fussenegger. We thank M. Zuzarte and LABCAR (Faculty of Medicine, University of Coimbra) for electron microscopy imaging. We thank Luisa Cortes, Margarida Caldeira, Tatiana Catarino, and the CNC MICC team for assistance with microscopy imaging and Imaris processing. We thank Elisa Corti, Ivan Lalanda, and Carlos Duarte for assistance with primary cell culture. We thank all members of the L.P.d.A. and X.O’B. labs for all the support, discussion, and comments. Schematic figures were created using Biorender.com. This work was funded by the European Regional Development Fund (ERDF), through the Centro 2020 Regional Operational Program; through the COMPETE 2020 – Operational Programme for Competitiveness and Internationalization, and Portuguese national funds via FCT – Fundação para a Ciência e a Tecnologia, under the projects: UIDB/04539/2020, UIDP/04539/2020, LA/P/0058/2020, SpreadSilencing (POCI-01-0145-FEDER-029716), ViraVector (CENTRO-01-0145-FEDER-022095), Fighting Sars-CoV-2 (CENTRO-01-01D2-FEDER-000002), BDforMJD (CENTRO-01-0145-FEDER-181240), ModelPolyQ2.0 (CENTRO-01-0145-FEDER-181258), and MJDEDIT (CENTRO-01-0145-FEDER-181266); ARDAT under the IMI2 JU grant agreement no. 945473 supported by the European Union's H2020 programme and EFPIA; by the American Portuguese Biomedical Research Fund (APBRF) and the Richard Chin and Lily Lock Machado-Joseph Disease Research Fund. X.O’B. was supported by NIH NCI R35 CA232103 and P01 CA069246. D.R.-R. was supported by SFRH/BD/132618/2017 and FLAD 2021/CON001/CAN008. K.L. was supported by SFRH/BD/09513/2020.
Author contributions
D.R.-R., K.L., X.O’B., K.B., and L.P.d.A. conceived and designed the experiments. D.R.-R., K.L., and M.M.P. T.S.v.S. and S.M. performed the experiments. D.R.-R., K.L., K.O'B., P.R.L.P., M.M.P., M.M.S., T.S.v.S., S.M., and K.B. analyzed the data. D.R.-R., K.L., K.O'B., P.R.L.P., M.M.P., M.M.S., T.S.v.S., S.M., X.O’B., K.B., and L.P.d.A. wrote and edited the paper.
Declaration of interests
The authors declare no competing interests.
Footnotes
Supplemental information can be found online at https://doi.org/10.1016/j.ymthe.2023.05.012.
Contributor Information
Koen Breyne, Email: kbreyne@mgh.harvard.edu.
Luís Pereira de Almeida, Email: luispa@cnc.uc.pt.
Supplemental information
Data availability statement
All original data are available from the authors under request.
References
- 1.Li Q., Barres B.A. Microglia and macrophages in brain homeostasis and disease. Nat. Rev. Immunol. 2018;18:225–242. doi: 10.1038/nri.2017.125. [DOI] [PubMed] [Google Scholar]
- 2.Chu A.J., Williams J.M. Astrocytic MicroRNA in ageing, inflammation, and neurodegenerative disease. Front. Physiol. 2021;12:826697. doi: 10.3389/fphys.2021.826697. [DOI] [PMC free article] [PubMed] [Google Scholar]
- 3.Hill A.F. NeuroEVs : characterizing extracellular vesicles generated in the neural domain, by extracellular vesicles and neurodegenerative diseases. J. Neurosci. 2019;39:9269–9273. doi: 10.1523/JNEUROSCI.0147-18.2019. [DOI] [PMC free article] [PubMed] [Google Scholar]
- 4.Khattar K.E., Safi J., Rodriguez A.M., Vignais M.L. Intercellular communication in the brain through tunneling nanotubes. Cancers. 2022;14:1207. doi: 10.3390/cancers14051207. [DOI] [PMC free article] [PubMed] [Google Scholar]
- 5.Rustom A., Saffrich R., Markovic I., Walther P., Gerdes H.H. Nanotubular highways for intercellular organelle transport. Science. 2004;303:1007–1010. doi: 10.1126/science.1093133. [DOI] [PubMed] [Google Scholar]
- 6.van Niel G., D’Angelo G., Raposo G. Shedding light on the cell biology of extracellular vesicles. Nat. Rev. Mol. Cell Biol. 2018;19:213–228. doi: 10.1038/nrm.2017.125. [DOI] [PubMed] [Google Scholar]
- 7.Shi M., Sheng L., Stewart T., Zabetian C.P., Zhang J. New windows into the brain: central nervous system-derived extracellular vesicles in blood. Prog. Neurobiol. 2019;175:96–106. doi: 10.1016/j.pneurobio.2019.01.005. [DOI] [PMC free article] [PubMed] [Google Scholar]
- 8.Chivet M., Javalet C., Laulagnier K., Blot B., Hemming F.J., Sadoul R. Exosomes secreted by cortical neurons upon glutamatergic synapse activation specifically interact with neurons. J. Extracell. Vesicles. 2014;3:24722. doi: 10.3402/jev.v3.24722. [DOI] [PMC free article] [PubMed] [Google Scholar]
- 9.Frühbeis C., Fröhlich D., Kuo W.P., Amphornrat J., Thilemann S., Saab A.S., Kirchhoff F., Möbius W., Goebbels S., Nave K.A., et al. Neurotransmitter-triggered transfer of exosomes mediates oligodendrocyte-neuron communication. PLoS Biol. 2013;11:e1001604. doi: 10.1371/journal.pbio.1001604. [DOI] [PMC free article] [PubMed] [Google Scholar]
- 10.Budnik V., Ruiz-Cañada C., Wendler F. Extracellular vesicles round off communication in the nervous system. Nat. Rev. Neurosci. 2016;17:160–172. doi: 10.1038/nrn.2015.29. [DOI] [PMC free article] [PubMed] [Google Scholar]
- 11.Zappulli V., Friis K.P., Fitzpatrick Z., Maguire C.A., Breakefield X.O. Extracellular vesicles and intercellular communication within the nervous system. J. Clin. Invest. 2016;126:1198–1207. doi: 10.1172/JCI81134. [DOI] [PMC free article] [PubMed] [Google Scholar]
- 12.Wang Y., Balaji V., Kaniyappan S., Krüger L., Irsen S., Tepper K., Chandupatla R., Maetzler W., Schneider A., Mandelkow E., Mandelkow E.M. The release and trans-synaptic transmission of Tau via exosomes. Mol. Neurodegener. 2017;12:5. doi: 10.1186/s13024-016-0143-y. [DOI] [PMC free article] [PubMed] [Google Scholar]
- 13.Rajendran L., Honsho M., Zahn T.R., Keller P., Geiger K.D., Verkade P., Simons K. Alzheimer’s disease beta-amyloid peptides are released in association with exosomes. Proc. Natl. Acad. Sci. USA. 2006;103:11172–11177. doi: 10.1073/pnas.0603838103. [DOI] [PMC free article] [PubMed] [Google Scholar]
- 14.Emmanouilidou E., Melachroinou K., Roumeliotis T., Garbis S.D., Ntzouni M., Margaritis L.H., Stefanis L., Vekrellis K. Cell-produced alpha-synuclein is secreted in a calcium-dependent manner by exosomes and impacts neuronal survival. J. Neurosci. 2010;30:6838–6851. doi: 10.1523/JNEUROSCI.5699-09.2010. [DOI] [PMC free article] [PubMed] [Google Scholar]
- 15.Mahjoum S., Rufino-ramos D., Broekman M.L.D. Living proof of activity of extracellular vesicles in the central nervous system. Int. J. Mol. Sci. 2021;22:7294. doi: 10.3390/ijms22147294. [DOI] [PMC free article] [PubMed] [Google Scholar]
- 16.Balaj L., Lessard R., Dai L., Cho Y.J., Pomeroy S.L., Breakefield X.O., Skog J. Tumour microvesicles contain retrotransposon elements and amplified oncogene sequences. Nat. Commun. 2011;2:180. doi: 10.1038/ncomms1180. [DOI] [PMC free article] [PubMed] [Google Scholar]
- 17.Liu H., Tian Y., Xue C., Niu Q., Chen C., Yan X. Analysis of extracellular vesicle DNA at the single-vesicle level by nano-flow cytometry. J. Extracell. Vesicles. 2022;11:e12206. doi: 10.1002/jev2.12206. [DOI] [PMC free article] [PubMed] [Google Scholar]
- 18.Nolte-’t Hoen E.N.M., Buermans H.P.J., Waasdorp M., Stoorvogel W., Wauben M.H.M., ’t Hoen P.A.C. Deep sequencing of RNA from immune cell-derived vesicles uncovers the selective incorporation of small non-coding RNA biotypes with potential regulatory functions. Nucleic Acids Res. 2012;40:9272–9285. doi: 10.1093/nar/gks658. [DOI] [PMC free article] [PubMed] [Google Scholar]
- 19.Wei Z., Batagov A.O., Schinelli S., Wang J., Wang Y., El Fatimy R., Rabinovsky R., Balaj L., Chen C.C., Hochberg F., et al. Coding and noncoding landscape of extracellular RNA released by human glioma stem cells. Nat. Commun. 2017;8:1145. doi: 10.1038/s41467-017-01196-x. [DOI] [PMC free article] [PubMed] [Google Scholar]
- 20.O’Brien K., Breyne K., Ughetto S., Laurent L.C., Breakefield X.O. RNA delivery by extracellular vesicles in mammalian cells and its applications. Nat. Rev. Mol. Cell Biol. 2020;21:585–606. doi: 10.1038/s41580-020-0251-y. [DOI] [PMC free article] [PubMed] [Google Scholar]
- 21.Morel L., Regan M., Higashimori H., Ng S.K., Esau C., Vidensky S., Rothstein J., Yang Y. Neuronal exosomal miRNA-dependent translational regulation of astroglial glutamate transporter GLT1. J. Biol. Chem. 2013;288:7105–7116. doi: 10.1074/jbc.M112.410944. [DOI] [PMC free article] [PubMed] [Google Scholar]
- 22.Lang M.F., Yang S., Zhao C., Sun G., Murai K., Wu X., Wang J., Gao H., Brown C.E., Liu X., et al. Genome-wide profiling identified a set of miRNAs that are differentially expressed in glioblastoma stem cells and normal neural stem cells. PLoS One. 2012;7:e36248. doi: 10.1371/journal.pone.0036248. [DOI] [PMC free article] [PubMed] [Google Scholar]
- 23.Bhaskaran V., Nowicki M.O., Idriss M., Jimenez M.A., Lugli G., Hayes J.L., Mahmoud A.B., Zane R.E., Passaro C., Ligon K.L., et al. The functional synergism of microRNA clustering provides therapeutically relevant epigenetic interference in glioblastoma. Nat. Commun. 2019;10:442. doi: 10.1038/s41467-019-08390-z. [DOI] [PMC free article] [PubMed] [Google Scholar]
- 24.Abels E.R., Maas S.L.N., Nieland L., Wei Z., Cheah P.S., Tai E., Kolsteeg C.J., Dusoswa S.A., Ting D.T., Hickman S., et al. Glioblastoma-associated microglia reprogramming is mediated by functional transfer of extracellular miR-21. Cell Rep. 2019;28:3105–3119.e7. doi: 10.1016/j.celrep.2019.08.036. [DOI] [PMC free article] [PubMed] [Google Scholar]
- 25.Van Der Vos K.E., Abels E.R., Zhang X., Lai C., Carrizosa E., Oakley D., Prabhakar S., Mardini O., Crommentuijn M.H.W., Skog J., et al. Directly visualized glioblastoma-derived extracellular vesicles transfer RNA to microglia/macrophages in the brain. Neuro. Oncol. 2016;18:58–69. doi: 10.1093/neuonc/nov244. [DOI] [PMC free article] [PubMed] [Google Scholar]
- 26.Ter-Ovanesyan D., Norman M., Lazarovits R., Trieu W., Lee J.H., Church G.M., Walt D.R. Framework for rapid comparison of extracellular vesicle isolation methods. Elife. 2021;10:e70725. doi: 10.7554/elife.70725. [DOI] [PMC free article] [PubMed] [Google Scholar]
- 27.Norman M., Ter-Ovanesyan D., Trieu W., Lazarovits R., Kowal E.J.K., Lee J.H., Chen-Plotkin A.S., Regev A., Church G.M., Walt D.R. L1CAM is not associated with extracellular vesicles in human cerebrospinal fluid or plasma. Nat. Methods. 2021;18:631–634. doi: 10.1038/s41592-021-01174-8. [DOI] [PMC free article] [PubMed] [Google Scholar]
- 28.Su H., Rustam Y.H., Masters C.L., Makalic E., McLean C.A., Hill A.F., Barnham K.J., Reid G.E., Vella L.J. Characterization of brain-derived extracellular vesicle lipids in Alzheimer’s disease. J. Extracell. Vesicles. 2021;10:e12089. doi: 10.1002/jev2.12089. [DOI] [PMC free article] [PubMed] [Google Scholar]
- 29.Vassileff N., Vella L.J., Rajapaksha H., Shambrook M., Kenari A.N., McLean C., Hill A.F., Cheng L. Revealing the proteome of motor cortex derived extracellular vesicles isolated from amyotrophic lateral sclerosis human postmortem tissues. Cells. 2020;9:1709. doi: 10.3390/cells9071709. [DOI] [PMC free article] [PubMed] [Google Scholar]
- 30.Huang Y., Cheng L., Turchinovich A., Mahairaki V., Troncoso J.C., Pletniková O., Haughey N.J., Vella L.J., Hill A.F., Zheng L., Witwer K.W. Influence of species and processing parameters on recovery and content of brain tissue-derived extracellular vesicles. J. Extracell. Vesicles. 2020;9:1785746. doi: 10.1080/20013078.2020.1785746. [DOI] [PMC free article] [PubMed] [Google Scholar]
- 31.You Y., Muraoka S., Jedrychowski M.P., Hu J., McQuade A.K., Young-Pearse T., Aslebagh R., Shaffer S.A., Gygi S.P., Blurton-Jones M., et al. Human neural cell type-specific extracellular vesicle proteome defines disease-related molecules associated with activated astrocytes in Alzheimer’s disease brain. J. Extracell. Vesicles. 2022;11:e12183. doi: 10.1002/jev2.12183. [DOI] [PMC free article] [PubMed] [Google Scholar]
- 32.Gupta D., Zickler A.M., El Andaloussi S. Dosing extracellular vesicles. Adv. Drug Deliv. Rev. 2021;178:113961. doi: 10.1016/j.addr.2021.113961. [DOI] [PubMed] [Google Scholar]
- 33.Rufino-Ramos D., Albuquerque P.R., Leandro K., Carmona V., Martins I.M., Fernandes R., Henriques C., Lobo D., Faro R., Perfeito R., et al. Extracellular vesicle-based delivery of silencing sequences for the treatment of Machado-Joseph disease/Spinocerebellar Ataxia type 3. Mol. Ther. 2023;31:1275–1292. doi: 10.1016/j.ymthe.2023.04.001. [DOI] [PMC free article] [PubMed] [Google Scholar]
- 34.Valadi H., Ekström K., Bossios A., Sjöstrand M., Lee J.J., Lötvall J.O. Exosome-mediated transfer of mRNAs and microRNAs is a novel mechanism of genetic exchange between cells. Nat. Cell Biol. 2007;9:654–659. doi: 10.1038/ncb1596. [DOI] [PubMed] [Google Scholar]
- 35.Pegtel D.M., Cosmopoulos K., Thorley-Lawson D.A., van Eijndhoven M.A.J., Hopmans E.S., Lindenberg J.L., de Gruijl T.D., Würdinger T., Middeldorp J.M. Functional delivery of viral miRNAs via exosomes. Proc. Natl. Acad. Sci. USA. 2010;107:6328–6333. doi: 10.1073/pnas.0914843107. [DOI] [PMC free article] [PubMed] [Google Scholar]
- 36.Li M., Zeringer E., Barta T., Schageman J., Cheng A., Vlassov A.V. Analysis of the RNA content of the exosomes derived from blood serum and urine and its potential as biomarkers. Philos. Trans. R. Soc. Lond. B Biol. Sci. 2014;369:20130502. doi: 10.1098/rstb.2013.0502. [DOI] [PMC free article] [PubMed] [Google Scholar]
- 37.Albanese M., Chen Y.F.A., Hüls C., Gärtner K., Tagawa T., Mejias-Perez E., Keppler O.T., Göbel C., Zeidler R., Shein M., et al. MicroRNAs are minor constituents of extracellular vesicles that are rarely delivered to target cells. PLoS Genet. 2021;17:e1009951. doi: 10.1371/journal.pgen.1009951. [DOI] [PMC free article] [PubMed] [Google Scholar]
- 38.Van Duyne G.D. Cre recombinase. Microbiol. Spectr. 2015;3 doi: 10.1128/microbiolspec.MDNA3-0014-2014. MDNA3-0014-2014. [DOI] [PubMed] [Google Scholar]
- 39.Madisen L., Zwingman T.A., Sunkin S.M., Oh S.W., Zariwala H.A., Gu H., Ng L.L., Palmiter R.D., Hawrylycz M.J., Jones A.R., et al. A robust and high-throughput Cre reporting and characterization system for the whole mouse brain. Nat. Neurosci. 2010;13:133–140. doi: 10.1038/nn.2467. [DOI] [PMC free article] [PubMed] [Google Scholar]
- 40.Hall M.P., Unch J., Binkowski B.F., Valley M.P., Butler B.L., Wood M.G., Otto P., Zimmerman K., Vidugiris G., Machleidt T., et al. Engineered luciferase reporter from a deep sea shrimp utilizing a novel imidazopyrazinone substrate. ACS Chem. Biol. 2012;7:1848–1857. doi: 10.1021/cb3002478. [DOI] [PMC free article] [PubMed] [Google Scholar]
- 41.England C.G., Ehlerding E.B., Cai W. NanoLuc: a small luciferase is brightening up the field of bioluminescence. Physiol. Behav. 2017;176:139–148. doi: 10.1021/acs.bioconjchem.6b00112.NanoLuc. [DOI] [PMC free article] [PubMed] [Google Scholar]
- 42.Ridder K., Sevko A., Heide J., Dams M., Rupp A.K., Macas J., Starmann J., Tjwa M., Plate K.H., Sültmann H., et al. Extracellular vesicle-mediated transfer of functional RNA in the tumor microenvironment. Oncoimmunology. 2015;4:e1008371. doi: 10.1080/2162402X.2015.1008371. [DOI] [PMC free article] [PubMed] [Google Scholar]
- 43.Sterzenbach U., Putz U., Low L.H., Silke J., Tan S.S., Howitt J. Engineered exosomes as vehicles for biologically active proteins. Mol. Ther. 2017;25:1269–1278. doi: 10.1016/j.ymthe.2017.03.030. [DOI] [PMC free article] [PubMed] [Google Scholar]
- 44.Zomer A., Maynard C., Verweij F.J., Kamermans A., Schäfer R., Beerling E., Schiffelers R.M., De Wit E., Berenguer J., Ellenbroek S.I.J., et al. In vivo imaging reveals extracellular vesicle-mediated phenocopying of metastatic behavior. Cell. 2015;161:1046–1057. doi: 10.1016/j.cell.2015.04.042. [DOI] [PMC free article] [PubMed] [Google Scholar]
- 45.Steenbeek S.C., Pham T.V., Ligt J., Zomer A., Knol J.C., Piersma S.R., Schelfhorst T., Huisjes R., Schiffelers R.M., Cuppen E., et al. Cancer cells copy migratory behavior and exchange signaling networks via extracellular vesicles. EMBO J. 2018;37:1–20. doi: 10.15252/embj.201798357. [DOI] [PMC free article] [PubMed] [Google Scholar]
- 46.Ruivo C.F., Bastos N., Adem B., Batista I., Duraes C., Melo C.A., Castaldo S.A., Campos-Laborie F., Moutinho-Ribeiro P., Morão B., et al. Extracellular vesicles from pancreatic cancer stem cells lead an intratumor communication network (EVNet) to fuel tumour progression. Gut. 2022;71:2043–2068. doi: 10.1136/gutjnl-2021-324994. [DOI] [PMC free article] [PubMed] [Google Scholar]
- 47.Zomer A., Steenbeek S.C., Maynard C., Van Rheenen J. Studying extracellular vesicle transfer by a Cre-loxP method. Nat. Protoc. 2016;11:87–101. doi: 10.1038/nprot.2015.138. [DOI] [PubMed] [Google Scholar]
- 48.Wettergren E.E., Gussing F., Quintino L., Lundberg C. Novel disease-specific promoters for use in gene therapy for Parkinson’s disease. Neurosci. Lett. 2012;530:29–34. doi: 10.1016/j.neulet.2012.09.059. [DOI] [PubMed] [Google Scholar]
- 49.Norrman K., Fischer Y., Bonnamy B., Wolfhagen Sand F., Ravassard P., Semb H. Quantitative comparison of constitutive promoters in human ES cells. PLoS One. 2010;5:e12413. doi: 10.1371/journal.pone.0012413. [DOI] [PMC free article] [PubMed] [Google Scholar]
- 50.Breyne K., Ughetto S., Rufino-Ramos D., Mahjoum S., Grandell E.A., de Almeida L.P., Breakefield X.O. Exogenous loading of extracellular vesicles, virus-like particles, and lentiviral vectors with supercharged proteins. Commun. Biol. 2022;5:485. doi: 10.1038/s42003-022-03440-7. [DOI] [PMC free article] [PubMed] [Google Scholar]
- 51.Kojima R., Bojar D., Rizzi G., Hamri G.C.E., El-Baba M.D., Saxena P., Ausländer S., Tan K.R., Fussenegger M. Designer exosomes produced by implanted cells intracerebrally deliver therapeutic cargo for Parkinson’s disease treatment. Nat. Commun. 2018;9:1305. doi: 10.1038/s41467-018-03733-8. [DOI] [PMC free article] [PubMed] [Google Scholar]
- 52.Benedikter B.J., Bouwman F.G., Vajen T., Heinzmann A.C.A., Grauls G., Mariman E.C., Wouters E.F.M., Savelkoul P.H., Lopez-Iglesias C., Koenen R.R., et al. Ultrafiltration combined with size exclusion chromatography efficiently isolates extracellular vesicles from cell culture media for compositional and functional studies. Sci. Rep. 2017;7:15297. doi: 10.1038/s41598-017-15717-7. [DOI] [PMC free article] [PubMed] [Google Scholar]
- 53.Théry C., Witwer K.W., Aikawa E., Alcaraz M.J., Anderson J.D., Andriantsitohaina R., Antoniou A., Arab T., Archer F., Atkin-Smith G.K., et al. Minimal information for studies of extracellular vesicles 2018 (MISEV2018): a position statement of the International Society for Extracellular Vesicles and update of the MISEV2014 guidelines. J. Extracell. Vesicles. 2018;7:1535750. doi: 10.1080/20013078.2018.1535750. [DOI] [PMC free article] [PubMed] [Google Scholar]
- 54.Houseley J., Tollervey D. The many pathways of RNA degradation. Cell. 2009;136:763–776. doi: 10.1016/j.cell.2009.01.019. [DOI] [PubMed] [Google Scholar]
- 55.Dautzenberg I.J.C., Rabelink M.J.W., Hoeben R.C. The stability of envelope-pseudotyped lentiviral vectors. Gene Ther. 2021;28:89–104. doi: 10.1038/s41434-020-00193-y. [DOI] [PMC free article] [PubMed] [Google Scholar]
- 56.Vella L.J., Scicluna B.J., Cheng L., Bawden E.G., Masters C.L., Ang C.S., Willamson N., McLean C., Barnham K.J., Hill A.F. A rigorous method to enrich for exosomes from brain tissue. J. Extracell. Vesicles. 2017;6:1348885. doi: 10.1080/20013078.2017.1348885. [DOI] [PMC free article] [PubMed] [Google Scholar]
- 57.Barman B., Sung B.H., Krystofiak E., Ping J., Ramirez M., Millis B., Allen R., Prasad N., Chetyrkin S., Calcutt M.W., et al. VAP-A and its binding partner CERT drive biogenesis of RNA-containing extracellular vesicles at ER membrane contact sites. Dev. Cell. 2022;57:974–994.e8. doi: 10.1016/j.devcel.2022.03.012. [DOI] [PMC free article] [PubMed] [Google Scholar]
- 58.Street J.M., Barran P.E., Mackay C.L., Weidt S., Balmforth C., Walsh T.S., Chalmers R.T.A., Webb D.J., Dear J.W. Identification and proteomic profiling of exosomes in human cerebrospinal fluid. J. Transl. Med. 2012;10:5. doi: 10.1186/1479-5876-10-5. [DOI] [PMC free article] [PubMed] [Google Scholar]
- 59.Rufino-ramos D., Lule S., Mahjoum S., Ughetto S., Cristopher Bragg D., Pereira de Almeida L., Breakefield X.O., Breyne K. Biomaterials Using genetically modified extracellular vesicles as a non-invasive strategy to evaluate brain-specific cargo. Biomaterials. 2022;281:121366. doi: 10.1016/j.biomaterials.2022.121366. [DOI] [PMC free article] [PubMed] [Google Scholar]
- 60.Badhwar A., Haqqani A.S. Biomarker potential of brain-secreted extracellular vesicles in blood in Alzheimer’s disease. Alzheimers Dement. 2020;12:e12001. doi: 10.1002/dad2.12001. [DOI] [PMC free article] [PubMed] [Google Scholar]
- 61.Bolukbasi M.F., Mizrak A., Ozdener G.B., Madlener S., Ströbel T., Erkan E.P., Fan J.B., Breakefield X.O., Saydam O. miR-1289 and “zipcode”-like sequence enrich mRNAs in microvesicles. Mol. Ther. Nucleic Acids. 2012;1:e10. doi: 10.1038/mtna.2011.2. [DOI] [PMC free article] [PubMed] [Google Scholar]
- 62.Villarroya-Beltri C., Gutiérrez-Vázquez C., Sánchez-Cabo F., Pérez-Hernández D., Vázquez J., Martin-Cofreces N., Martinez-Herrera D.J., Pascual-Montano A., Mittelbrunn M., Sánchez-Madrid F. Sumoylated hnRNPA2B1 controls the sorting of miRNAs into exosomes through binding to specific motifs. Nat. Commun. 2013;4:2980. doi: 10.1038/ncomms3980. [DOI] [PMC free article] [PubMed] [Google Scholar]
- 63.Garcia-Martin R., Wang G., Brandão B.B., Zanotto T.M., Shah S., Kumar Patel S., Schilling B., Kahn C.R. MicroRNA sequence codes for small extracellular vesicle release and cellular retention. Nature. 2022;601:446–451. doi: 10.1038/s41586-021-04234-3. [DOI] [PMC free article] [PubMed] [Google Scholar]
- 64.Shurtleff M.J., Temoche-Diaz M.M., Karfilis K.V., Ri S., Schekman R. Y-Box Protein 1 Is Required to Sort microRNAs into Exosomes in Cells and in a Cell-free Reaction. Nilsen T.W., editor. Elife. 2016;5:e19276. doi: 10.7554/eLife.19276. [DOI] [PMC free article] [PubMed] [Google Scholar]
- 65.Ridder K., Keller S., Dams M., Rupp A.K., Schlaudraff J., Del Turco D., Starmann J., Macas J., Karpova D., Devraj K., et al. Extracellular vesicle-mediated transfer of genetic information between the hematopoietic system and the brain in response to inflammation. PLoS Biol. 2014;12:e1001874. doi: 10.1371/journal.pbio.1001874. [DOI] [PMC free article] [PubMed] [Google Scholar]
- 66.Jeppesen D.K., Fenix A.M., Franklin J.L., Higginbotham J.N., Zhang Q., Zimmerman L.J., Liebler D.C., Ping J., Liu Q., Evans R., et al. Reassessment of exosome composition. Cell. 2019;177:428–445.e18. doi: 10.1016/j.cell.2019.02.029. [DOI] [PMC free article] [PubMed] [Google Scholar]
- 67.Fader C.M., Sánchez D., Furlán M., Colombo M.I. Induction of autophagy promotes fusion of multivesicular bodies with autophagic vacuoles in k562 cells. Traffic. 2008;9:230–250. doi: 10.1111/j.1600-0854.2007.00677.x. [DOI] [PubMed] [Google Scholar]
- 68.Tóth E.Á., Turiák L., Visnovitz T., Cserép C., Mázló A., Sódar B.W., Försönits A.I., Petővári G., Sebestyén A., Komlósi Z., et al. Formation of a protein corona on the surface of extracellular vesicles in blood plasma. J. Extracell. Vesicles. 2021;10:e12140. doi: 10.1002/jev2.12140. [DOI] [PMC free article] [PubMed] [Google Scholar]
- 69.Patel B., Patel J., Cho J.H., Manne S., Bonala S., Henske E., Roegiers F., Markiewski M., Karbowniczek M. Exosomes mediate the acquisition of the disease phenotypes by cells with normal genome in tuberous sclerosis complex. Oncogene. 2016;35:3027–3036. doi: 10.1038/onc.2015.358. [DOI] [PubMed] [Google Scholar]
- 70.Abels E.R., Broekman M.L.D., Breakefield X.O., Maas S.L.N. Glioma EVs contribute to immune privilege in the brain. Trends Cancer. 2019;5:393–396. doi: 10.1016/j.trecan.2019.05.006. [DOI] [PMC free article] [PubMed] [Google Scholar]
- 71.Parr-Brownlie L.C., Bosch-Bouju C., Schoderboeck L., Sizemore R.J., Abraham W.C., Hughes S.M. Lentiviral vectors as tools to understand central nervous system biology in mammalian model organisms. Front. Mol. Neurosci. 2015;8:14. doi: 10.3389/fnmol.2015.00014. [DOI] [PMC free article] [PubMed] [Google Scholar]
- 72.Men Y., Yelick J., Jin S., Tian Y., Chiang M.S.R., Higashimori H., Brown E., Jarvis R., Yang Y. Exosome reporter mice reveal the involvement of exosomes in mediating neuron to astroglia communication in the CNS. Nat. Commun. 2019;10:4136. doi: 10.1038/s41467-019-11534-w. [DOI] [PMC free article] [PubMed] [Google Scholar]
- 73.Carmona V., Cunha-Santos J., Onofre I., Simões A.T., Vijayakumar U., Davidson B.L., Pereira de Almeida L. Unravelling endogenous MicroRNA system dysfunction as a new pathophysiological mechanism in machado-joseph disease. Mol. Ther. 2017;25:1038–1055. doi: 10.1016/j.ymthe.2017.01.021. [DOI] [PMC free article] [PubMed] [Google Scholar]
- 74.Al Ali J., Vaine C.A., Shah S., Campion L., Hakoum A., Supnet M.L., Acuña P., Aldykiewicz G., Multhaupt-Buell T., Ganza N.G.M., et al. TAF1 transcripts and neurofilament light chain as biomarkers for X-linked dystonia-parkinsonism. Mov. Disord. 2021;36:206–215. doi: 10.1002/mds.28305. [DOI] [PMC free article] [PubMed] [Google Scholar]
- 75.EV-TRACK Consortium. Van Deun J., Mestdagh P., Agostinis P., Akay Ö., Anand S., Anckaert J., Martinez Z.A., Baetens T., Beghein E., Bertier L., et al. EV-TRACK: transparent reporting and centralizing knowledge in extracellular vesicle research. Nat. Methods. 2017;14:228–232. doi: 10.1038/nmeth.4185. [DOI] [PubMed] [Google Scholar]
Associated Data
This section collects any data citations, data availability statements, or supplementary materials included in this article.
Supplementary Materials
Data Availability Statement
All original data are available from the authors under request.