

Summary
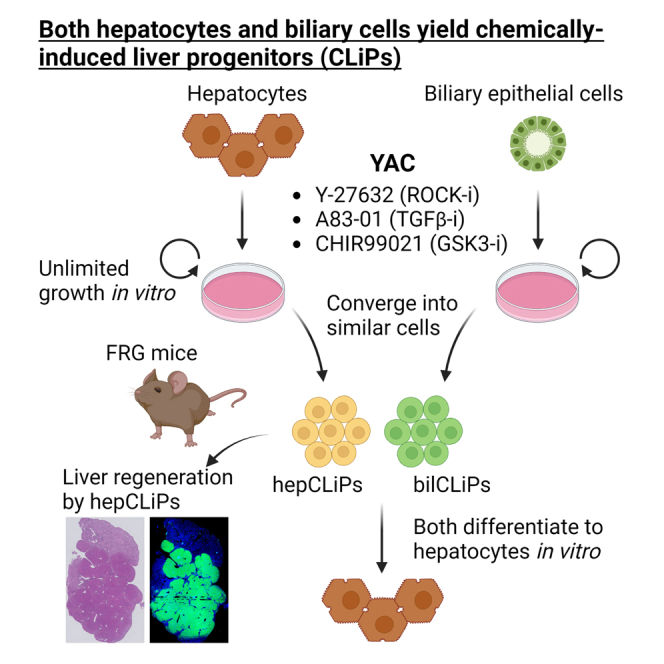
Over the last several years, a method has emerged that endows adult hepatocytes with in vitro proliferative capacity, producing chemically induced liver progenitors (CLiPs). However, there is a growing controversy regarding the origin of these cells. Here, we provide lineage tracing-based evidence that adult hepatocytes acquire proliferative capacity in vitro using rat and mouse models. Unexpectedly, we also found that the CLiP method allows biliary epithelial cells to acquire extensive proliferative capacity. Interestingly, after long-term culture, hepatocyte-derived cells (hepCLiPs) and biliary epithelial cell-derived cells (bilCLiPs) become similar in their gene expression patterns, and they both exhibit differentiation capacity to form hepatocyte-like cells. Finally, we provide evidence that hepCLiPs can repopulate injured mouse livers, reinforcing our earlier argument that CLiPs can be a cell source for liver regenerative medicine. This study advances our understanding of the origin of CLiPs and motivates the application of this technique in liver regenerative medicine.
Keywords: chemically induced liver progenitors, cell of origin, cell transplantation therapy, repopulation, hepatocyte, biliary epithelial cell, reprogramming, cellular plasticity
Graphical abstract
Highlights
-
•
Lineage tracing provides evidence that both rat and mouse hepatocytes yield CLiPs
-
•
The CLiP method allows BECs to acquire nearly unlimited proliferative capacity
-
•
Both hepatocyte-derived and BEC-derived CLiPs can differentiate into hepatocytes
-
•
Transplantation of hepatocyte-derived CLiPs can regenerate injured mouse livers
Using lineage tracing techniques, Katsuda et al. provide evidence that rat and mouse hepatocytes can be converted to extensively proliferative cells, termed chemically induced liver progenitors (CLiPs). They also report that the CLiP method allows biliary epithelial cells to adopt a similar phenotype. Significantly, the authors provide robust evidence that hepatocyte-derived CLiPs enable liver regeneration in chemically injured mouse livers.
Introduction
While adult mature hepatocytes have been used clinically for cell transplantation therapy, demonstrating safety and short-term efficacy (Iansante et al., 2018), they are not expandable in vitro, posing a major challenge for the field of liver regenerative medicine and limiting the widespread use of this therapy. Over the last several years, we and others have established a methodology to obtain proliferative progenitor-like cells from hepatocytes without gene manipulation (Fu et al., 2019; Katsuda et al., 2017, 2019; Kim et al., 2018; Li et al., 2021; Wu et al., 2017; Zhang et al., 2018), which we have termed “chemically induced liver progenitors (CLiPs)” (Katsuda et al., 2017, 2019). Because CLiPs can regenerate liver tissue when they are transplanted within injured mouse livers (Fu et al., 2019; Katsuda et al., 2017, 2019; Kim et al., 2018; Li et al., 2021; Wu et al., 2017; Zhang et al., 2018), this methodology has demonstrated potential for clinical translation and is becoming more widely studied.
Despite the promising potential of this methodology, there is active debate surrounding the origin of CLiPs. Our original study (Katsuda et al., 2017) and others (Li et al., 2021; Wu et al., 2017) provide evidence for the ability to convert mouse hepatocytes to proliferative progenitors using in vitro lineage tracing. However, the evidence for this observation in rats has been lacking. Of note, Fu et al. (2022) recently reported a study challenging our model that CLiPs are derived from hepatocytes by instead proposing that the CLiPs arise from putative resident progenitor cells in the liver. In addition, it has remained unclear whether biliary epithelial cells (BECs), another epithelial cell type in the liver besides hepatocytes, can give rise to proliferative cells by using the same strategy. Given that BECs are considered a crucial building block in liver tissue engineering, as they comprise the bile drainage system (Katsuda et al., 2013; Rizki-Safitri et al., 2018, 2020; Tanimizu et al., 2021), if the CLiP technique allows BECs to expand in vitro, these cells would be a useful source for advanced liver tissue engineering.
In this study, using the rat lineage tracing system, we first provide evidence that CLiPs are induced from rat hepatocytes. Then, using a mouse lineage tracing system, a more established and widely used system than the rat system, we provide evidence that the CLiP strategy enables extensive proliferation of BECs as well. Together, these results allow us to expand our model to include both hepatocytes and BECs as possible sources for CLiPs.
Results
Rat CLiPs can be derived from adult hepatocytes
Whether CLiPs can be derived from rat hepatocytes is a growing controversy in the field of regenerative liver biology. Specifically, Fu et al. recently identified two morphologically distinct populations that appear under the stimulation of a combination of small molecule inhibitors called YAC (Y-27632, A-83-01 and CHIR99021), which we previously reported as in vitro proliferation factors (Katsuda et al., 2017). One population formed colonies composed of small cells and proliferated efficiently, while the second population consisted of large cells and did not proliferate (Fu et al., 2022). Using a recently established rat lineage tracing system (Rosa26-LSL-tdTomato rats [Igarashi et al., 2016]), Fu et al. found that tdTomato+ hepatocyte-derived cells contributed to the large cell population but not the small cell population. From these data, Fu et al. concluded that CLiPs are not derived from hepatocytes.
Here, we provide evidence against their conclusion using the same rat system. We injected adult Rosa26-LSL-tdTomato rats with AAV8-TBG-iCre (improved Cre), and harvested hepatocytes by the standard Percoll density gradient method (Figure 1A). Consistent with Fu et al.’s observation, the labeling efficiency in this system was very low (0.05%–0.1% of hepatocytes were labeled with tdTomato), thereby making the initial plating density of tdTomato+ hepatocytes very sparse (Figure 1B). However, this observation led us to hypothesize that tdTomato+ cell clusters appearing in the later time points should be derived from only a single or a few hepatocytes, which would allow us to evaluate the clonal proliferative capacity of hepatocytes. After culturing the cells in the presence of YAC for approximately 2 weeks, large tdTomato+ cell clusters with small cell morphologies emerged (Figure 1B). This observation was readily apparent for multiple microscopic fields in two independent experiments (Figure S1). Thus, although we do not have a specific explanation for the conflict between Fu et al.’s observation and ours, we conclude that hepatocytes can give rise to CLiPs under YAC stimulation.
Figure 1.

In vitro lineage tracing of rat hepatocytes
(A) Schematic representation of in vitro lineage tracing of rat hepatocytes.
(B) Phase contrast and the corresponding tdTomato fluorescent images of rat hepatocytes cultured with or without YAC at the designated time points. Arrows indicate the single tdTomato-labeled hepatocyte identified at day 1 in this microscopic field. Scale bars: 100 μm.
Both mouse hepatocytes and BECs acquire extensive proliferative capacity
Although we and others have provided evidence that hepatocytes can be the origin of CLiPs, it does not rule out the possibility that other cell types also can yield proliferative cells under YAC treatment. The very low labeling efficiency of hepatocytes in the rat system precludes generating conclusive results, thereby prompting us to continue the exploration using the mouse system in which >98% of hepatocytes can be labeled (Katsuda et al., 2022). Our earlier lineage tracing study in mice was performed during the primary culture period to focus on the emergence of rapidly proliferating cells from hepatocytes (Katsuda et al., 2017). Here, we extended the culture period to test whether hepatocyte-derived cells continue to proliferate after multiple passages and whether non-hepatocyte cells, namely non-parenchymal cells (NPCs), proliferate as well. Using the Rosa26-LSL-EYFP mouse system (Figure 2A), we confirmed robust proliferation of YFP+ hepatocyte-derived cells and that these cells exhibited multiple BEC markers, which were not expressed in the original hepatocytes (Figure 2B). These BEC markers included those expressed in different stages of hepatobiliary metaplasia in vivo (Merrell et al., 2021) (Figure S2A), e.g., SPP1, SOX9, and HNF1B in the early stage, ITGA6 in the intermediate stage, and KRT19 in the late stage. The YFP+ proliferative cells retain expression of HNF4A, a hepatocyte marker (Figure 2B), indicating that they acquired biphenotypic characteristics. We also observed the persistence of Hnf4a gene expression in hepatocyte-to-BEC reprogrammed cells in vivo by single-cell RNA sequencing (scRNA-seq) (Figure S2A), suggesting a partly similar behavior of hepatocyte-derived cells between the processes of in vivo reprogramming and our in vitro culture system.
Figure 2.

Mouse hepatocytes proliferate and undergo partial biliary reprogramming, while contaminated BECs gradually dominate the population
(A) Schematic representation of in vitro lineage tracing of mouse hepatocytes.
(B) Confirmation of biphenotypic marker expression of YAC-treated proliferative hepatocytes. Scale bars: 100 μm.
(C) Existence of the contaminated BECs becomes evident around 5 days after plating. Scale bars: 100 μm.
(D) YFP− epithelial cells express both HNF1B and EPCAM, while YFP+ cells express only HNF1B. Scale bars: 100 μm.
(E) Quantification of YFP+ hepatocyte-derived population by flow cytometry throughout the continued passages. Date represent mean ± SEM (n = 4 donors).
(F) Quantification of BEC marker expression in hepatocyte-derived YFP+ cells and that in contaminated YFP− BECs by flow cytometry. Fresh BECs are defined as cells positive for EPCAM or CD24, and the positive values are set to 100%. Date represent mean ± SEM (n = 4 donors).
We then assessed the possibility that NPCs proliferate under the YAC culture condition. Flow cytometry using the Percoll density gradient-enriched cells yielded a population that was >98% positive for YFP. The ∼2% YFP-negative population contained non-epithelial NPCs, including CD11B+ monocytes/Kupffer cells, CD45+ leukocytes, and CD31+ endothelial cells (Figure S2B). Following culture in YAC medium, such non-epithelial NPCs decreased over time and became almost undetectable by the end of primary culture (Figure S2C). By contrast, we observed that YFP- epithelial cells grew rapidly in primary culture (Figure 2C), and these cells were confirmed to be BECs based on the expression of HNF1B and EPCAM (Figure 2D). Considering the rarity of BECs detected in the Percoll density gradient-enriched population (Figure S2D), the growth rate of BECs was much faster than that of hepatocytes. Moreover, BEC proliferation was apparent as early as 2–3 days after plating as assessed by microscopic observation, while hepatocyte proliferation became apparent after around 4–5 days (data not shown). Consequently, the YFP+ cell fraction steadily decreased over the period of the subsequent passages (Figure 2E). We estimated the kinetics of reduction of the YFP+ fraction by calculating the ratio of doubling times between hepatocytes and BECs (Figure S2E, also see supplementary experimental procedures), which suggested that BECs have ∼15% shorter doubling time than that of hepatocytes. To assess the biliary characteristics, we monitored the protein expression of two BEC surface markers, CD24 and EPCAM. In a mouse hepatobiliary reprogramming model, we recently found that CD24 expression began in the early to intermediate stage of biliary reprogramming of hepatocytes, while EPCAM expression began in the intermediate to late stage (Katsuda et al., 2023). Thus, these two markers would give insight into the plastic characteristics of hepatocytes and BECs in vitro. We found that CD24 was readily expressed in all the BECs and hepatocytes after 5 days in primary culture, while EPCAM expression was present only in BECs throughout the culture until the fifth passage (P5) (Figure 2F). Interestingly, we found that EPCAM expression was lost by P3 in BECs, while CD24 expression was retained in both populations throughout the culture period (Figure 2F). These results indicate that hepatocytes partly gained biliary characteristics (CD24 expression), while BECs partly lost biliary characteristics (EPCAM expression). Intriguingly, when sorted BECs were cultured with YAC (Figure S3A), they partly exhibited morphologies resembling hepatocytes, as characterized by polygonal and cytoplasm-rich morphologies with occasional binucleation (Figure S3B), a characteristic feature of hepatocytes (Tanimizu et al., 2016). Indeed, these cells expressed HNF4A, while co-expressing SOX9, indicating that BEC-derived proliferative cells also gain the biphenotypic property seen in hepatocyte-derived cells (Figure S3C). Collectively, these results suggest that hepatocytes and BECs converge into a similar cell type under YAC culture. Thus, hereafter, we refer to these YAC-induced proliferative cell populations as hepatocyte-derived CLiPs (hepCLiPs) and BEC-derived CLiPs (bilCLiPs), respectively. We confirmed that both cell types had almost unlimited proliferative capacity (no reduction in proliferation after at least 20 passages, where cell density was diluted by 1/20 to 1/40 in each passage). These results lead us to expand our model, concluding that both hepatocytes and BECs can be the origin of CLiPs, not just hepatocytes.
Hepatocyte-derived and BEC-derived cells become similar in vitro
We then sought to characterize hepCLiPs and bilCLiPs in terms of their gene expression profiles. Using a Rosa26-LSL-EYFP mouse, we generated clonal hepCLiP (n = 23) and bilCLiP cell lines (n = 11). These clones were generated through fluorescence-activated cell sorting (FACS) of cells after 2 weeks of primary culture in YAC followed by an additional four passages. (Figure 3A). We first compared the growth rates of these CLiP cell lines. Although there was no statistically significant difference during the first 3 days after plating (Figure S4A), bilCLiPs exhibited faster proliferation if the culture period is extended (data not shown), consistent with our earlier observation (Figures 2E and S2E). We then compared their gene expression patterns along with freshly isolated hepatocytes and BECs by qRT-PCR. As shown in Figure 3B, hepCLiPs and bilCLiPs demonstrated higher similarity to BECs than to hepatocytes. This is likely due to the decreased expression of most of the assessed hepatocyte genes and the upregulation of BEC genes in hepCLiPs (Figure 3B). Some of the assessed BEC genes, including Tacstd2, Grhl2, and Epcam, were substantially decreased in bilCLiPs, but many others, including Spp1, Hnf1b, Itga6, and Krt19, were retained throughout the culture period. The expression of these bilCLiP-retained genes was upregulated in hepCLiPs, thereby making their overall expression patterns similar to each other (Figure 3B). We also observed that many bilCLiP-retained genes were also acquired at early to intermediate stages of hepatobiliary metaplasia in vivo; however, many bilCLiP-downregulated genes are acquired at the late stage of hepatobiliary metaplasia with a few notable exceptions such as Krt19 and Krt7 (Figure S2A).
Figure 3.

Both hepCLiPs and bilCLiPs exhibit BEC-like phenotypes under 2D culture, while they become more hepatocyte-like under the 3D culture
(A) Schematic of strategy to establish hepCLiPs and bilCLiPs.
(B) Heatmap of hepatic and BEC markers as assessed by qRT-PCR with clonal hepCLiPs (n = 23), bilCLiPs (n = 11), fresh hepatocytes (n = 6), and fresh BECs (n = 5).
(C) Schematic of 3D culture-based hepatic induction of hepCLiPs and bilCLiPs. Images obtained for one of the hepCLiP clones are shown as a representative example. Scale bars: 100 μm.
(D) Gene set enrichment analysis (GSEA) comparing hepCLiPs cultured under 2D and 3D conditions using sets of hepatocyte-enriched genes (n = 3,432) compared with BECs and BEC-enriched genes (n = 2,048) compared with hepatocytes (Merrell et al., 2021) (n = 3 hepCLiP clones established from two donors; n = 3 bilCLiP clones established from one donor).
(E) PCA mapping of hepCLiPs and bilCLiPs cultured in 2D and 3D (n = 3) along with in vivo reprogrammed cells (n = 3). In vivo samples were harvested from normal mouse livers and those under hepatobiliary reprogramming induced by challenging the mice with 0.1% 3,5-diethoxycarbonyl-1,4-dihydrocollidine (DDC). For in vivo reprogramming experiments, the cells were harvested by FACS.
(F) Heatmap of hepatic (n = 3,432) and BEC (n = 2,048) marker genes as assessed by RNA-seq with clonal hepCLiPs (n = 3 clones from two donors) and bilCLiPs (n = 3 clones from one donor) along with DDC-induced in vivo reprogrammed cells (n = 3).
While CLiPs resemble BEC-like cells in the routine monolayer culture, they can re-differentiate into hepatocyte-like cells under a condition that induces the hepatocyte phenotype (Li et al., 2021; Wu et al., 2017). We were interested in whether this is also the case for bilCLiPs. First, using a new culture system (Figure 3C) where CLiPs were cultured under a three-dimensional (3D) condition in the presence of hepatocyte-inducible cytokine oncostatin M (Kamiya et al., 2002), we attempted hepatic induction of these two cell types. Using multiple clonal hepCLiP and bilCLiP cell lines (n = 3 each), we performed bulk RNA-seq. Principal-component analysis (PCA) confirmed that both hepCLiPs and bilCLiPs underwent similar phenotypic changes, as shown by the PC1 axis (Figure S4B). Strikingly, gene set enrichment analysis (GSEA) clearly demonstrated that in the 3D culture, both cell types gained a hepatocyte-like phenotype, while losing their biliary phenotype (Figure 3D). We also compared our in vitro dataset with our in vivo dataset, where biliary reprogramming of hepatocytes was induced by challenging the mice with 3,5-diethoxycarbonyl-1,4-dihydrocollidine (DDC) diet (Katsuda et al., 2023). The hepatobiliary axis represented by the PC1 demonstrated that both hepCLiPs and bilCLiPs transitioned from a biliary phenotype to a hepatocyte phenotype in the in vivo setting under induced stress (Figure 3E). In terms of the PC1 axis, the hepatic characteristics of CLiPs cultured under the 3D condition were inferred to be similar to that of intermediately reprogrammed cells in vivo (Figure 3E). Hierarchical clustering based on the whole transcriptome indicated that hepCLiP_3D and bilCLiP_3D are similar to reprogrammed cells in the early stage (namely, they are more “hepatocyte-like”), while hepCLiP_2D and bilCLiP_2D clustered with the late-stage reprogrammed cells and BECs (Figure S4C). A heatmap visualization of a curated list of hepatocyte-enriched genes (n = 2,048) and BEC-enriched genes (n = 3,432) (Katsuda et al., 2023) further supported this observation (Figure 3F). Meanwhile, we also noted that hepCLiPs are more hepatocyte-oriented compared with bilCLiPs both in 2D and 3D culture conditions (Figure S4D), suggesting that these two types of cells partly retain the phenotypes of their cell of origin even after long-term culture. A GSEA of the Hallmark pathways further confirmed that multiple hepatocyte function-related pathways are more enriched in hepCLiPs, such as “xenobiotic metabolism,” “bile acid metabolism,” and “coagulation” (Figure S4E). In contrast, only a few pathways were relatively enriched in bilCLiPs (Figure S4E), suggesting that the major difference between these cell types is dictated by the extent of their hepatocyte phenotype. In summary, these data demonstrate that although neither hepCLiPs nor bilCLiPs acquire fully differentiated hepatic characteristics, both of them clearly change their phenotype toward hepatocyte-like cells in the 3D conditions.
hepCLiPs regenerate injured livers of FRG mice
Finally, we sought to re-evaluate our earlier model in which hepatocyte-derived CLiPs can regenerate an injured liver, which was not fully demonstrated in our previous study using the rat CLiPs due to remaining questions about their cellular origins (Katsuda et al., 2017). To this end, we assessed the repopulation capacity of one of the clonal hepCLiP cell lines that was also analyzed via RNA-seq (Figure 3), in FRG (Fah−/−Rag2−/−Il2rg−/−) mice, a well-established liver injury model that offers a permissive environment for repopulation by transplanted hepatocytes (Azuma et al., 2007) (Figure 4A). We previously described that rat CLiPs were able to repopulate the injured mouse liver without hepatic induction prior to transplantation (Katsuda et al., 2017). However, given that it would be beneficial to know whether there is a difference in the repopulation efficiency between hepCLiP_2D and hepCLiP_3D cells, we prepared cells from both conditions (see experimental procedures for details) (Figure 4A). FRG mice develop liver disease when the protective drug 2-(2-nitro-4-trifluoromethylbenzoyl)-1,3-cyclohexanedione (NTBC) is withdrawn (Azuma et al., 2007). Upon intrasplenic transplantation of hepCLiPs, we started the NTBC cycling to gradually invoke liver injury (see experimental procedures for details) (Figure 4A). At approximately 1.5 months after transplantation, we challenged the mice with extended NTBC withdrawal (3 weeks OFF/5 days ON). Of the nine animals, eight survived after the third round of the long NTBC withdrawal cycles, indicating the therapeutic effect of transplantation. The one mouse that did not survive was one of the three hepCLiP_2D-transplanted mice. Accordingly, both hepCLiP_2D and hepCLiP_3D cells exhibited robust repopulation in the host livers (Figure 4B). The repopulation efficiency was roughly estimated to be comparable between hepCLiP_2D and hepCLiP_3D cells (Figure 4C). The sizes of CFP+ repopulated nodules tended to be larger when transplanted with hepCLiP_2D cells, while the number of nodules formed in the FRG livers tended to be greater when transplanted by hepCLiP_3D cells (Figure 4D). Although more samples will be needed to be statistically conclusive, this observation suggests that hepCLiPs treated with hepatic induction prior to transplantation have higher engraftment efficiency in the host liver compared with hepCLiPs maintained under the routine monolayer culture condition. Since the engraftment efficiency is one of the key determinants for successful cell transplantation therapy (Rezvani et al., 2016), our observation may give an insight into strategies to improve CLiP-based cell transplantation therapy.
Figure 4.

Mouse hepCLiPs repopulate chronically injured mouse livers
(A) Schematic of experimental design for the establishment of CFP-labeled clonal hepCLiPs and the repopulation assay for one of these CFP+ hepCLiP clones using the FRG mouse system.
(B) Macroscopic brightfield and fluorescent images of the FRG mouse livers. Livers were harvested from the host mice, which were treated with the nitisinone cycle for 3.8 months.
(C) Estimation of repopulation efficiency based on the gross fluorescent images described in (B). The horizontal bars indicate the mean values. Global p value among the three groups was calculated by the Kruskal-Wallis test.
(D) Number of nodules visible on the liver surface were counted on each image shown in (B) and represented as “per transplanted 5 × 10⁵ cells” (note that 5 × 10⁵ cells/mouse were transplanted for 2D_TrypLE and 3D_TrypLE groups, while 2.5 × 10⁵ cells/mouse were transplanted for 3D_Accutase. See experimental procedures for details). The horizontal bars indicate the mean values. Global p value among the three groups was calculated by the Kruskal-Wallis test.
(E) Stitched image of an H&E-stained hepCLiP-repopulated FRG mouse liver tissue (left), and the CFP IF and DAPI counterstained images of the corresponding region are shown (right). A TrypLE-dissociated hepCLiP_3D-transplanted sample is shown as a representative image. Similar staining patterns are observed for the other two groups as shown in Figure S5. Scale bars: 1 mm.
(F) A higher magnification image of the region indicated by the rectangle in the H&E staining of Figure 4E. Scale bar: 50 μm.
We then assessed the tissue integrity of the repopulated livers by hematoxylin and eosin (H&E) staining and immunofluorescence (IF) (Figures 4E and S5). Repopulated tissue was readily identified by cyan fluorescent protein (CFP) staining (Figures 4E and S5). Host tissue had a larger number of expanding ductal cells, a general feature of chronic liver injury called “ductular reaction” (Sato et al., 2019), while the repopulated regions were filled with densely packed hepatocytes (Figure 4F). The Rosa-LSL-Confetti mouse system, from which we generated clonal cell lines transplanted to the FRG mice (see experimental procedures for details), expresses CFP designed to localize on the cellular membrane (Maddipati and Stanger, 2015). Thus, we confirmed that nearly all the CFP+ cells expressed mature hepatocyte genes FAH (Figure 5A) and ABCB11 (also known as Bile Salt Export Pump, BSEP) (Figures 5B and 5C), while we did not find any evidence of KRT19 expression in the CFP+ cells (Figure 5A), indicating that hepCLiPs differentiated into hepatocytes in vivo. We also stained for GLUL (also known as Glutamine Synthetase, GS) and CYP2E1, both of which are known to be expressed in pericentral hepatocytes (Halpern et al., 2017), and confirmed proper localization of these proteins (Figures 5B–5D). SOX9, usually regarded as a BEC marker, is known to be expressed in a small fraction of periportal hepatocytes at the protein level (Font-Burgada et al., 2015). Indeed, we confirmed that hepCLiP-derived hepatocytes occasionally expressed SOX9 (Figure 5E). The SOX9 expression levels in the CFP+ cells were much lower than in BECs, and the CFP+SOX9+ cells were morphologically hepatocyte-like (Figure 5E). Thus, these observations further support the conclusion that hepCLiPs serve as hepatocytes, but not BECs, after repopulation of the FRG mouse livers. In summary, we have provided direct evidence that hepCLiPs can regenerate injured livers.
Figure 5.

Histological characterization of hepCLiP-repopulated FRG mouse livers
IF images of (A) CFP, FAH, and KRT19, where arrows indicate atypically expanding ductal cells (known as ductular reaction); (B) CFP, GLUL, and ABCB11 in a pericentral region; (C) CFP, GLUL, and ABCB11 in a periportal region; (D) CFP and CYP2E1; (E) CFP and SOX9, where arrows indicate hepatocytes weakly expressing SOX9. The nuclei of all the IF samples are counterstained with DAPI. All the images shown are taken from the hepCLiP_3D_TrypLE samples (Figure 5A), but we confirmed similar staining patterns for both hepCLiP_2D_TrypLE and hepCLiP_3D_Accutase samples (data not shown). CV, central vein; PV, portal vein. Scale bars: 50 μm.
Discussion
This study provides lineage tracing-based evidence that hepatocytes can be expanded in vitro using the small inhibitor cocktail YAC both in rats and mice. Transplantation experiments further confirmed that hepatocyte-derived CLiPs regenerate the injured mouse liver, thereby providing evidence that hepatocytes can be a cell source for liver regenerative medicine. We also provided evidence that BECs can acquire proliferative capacity in the presence of YAC and exhibit a similar gene expression pattern to that of hepCLiPs. Moreover, bilCLiPs exhibit the capacity to differentiate to hepatocyte-like cells. Future studies are needed to further characterize the capacity of bilCLiPs to regenerate the liver parenchyma as well as their potential contribution to bile duct reconstruction.
This study was partly motivated by a growing controversy related to the origin of CLiPs, which was recently highlighted by Fu et al. (2022). Our original study (Katsuda et al., 2017), as well other studies employing a similar experimental strategy (Fu et al., 2019; Huang et al., 2019, 2021b, 2021a; Katsuda et al., 2017, 2019; Kim et al., 2018; Wu et al., 2017; Zhang et al., 2018), are based on the assumption that the contamination of BECs is almost negligible and would minimally confound the conclusion that hepatocytes are the sole origin of CLiPs. However, our careful examinations in the present study require us to revise this conclusion, in particular in the mouse model. However, there is a need for further investigation for the rat model, given that the currently available rat lineage tracing system fails to efficiently label hepatocytes, making the assessment inconclusive. Interestingly, unlike the steep decline of YFP+ cells in mouse CLiP culture during the first several passages (Figure 2E), our preliminary data suggest that the tdTomato+ growth rate in rat CLiP culture was relatively stable (data not shown). Thus, it is possible that the growth capacities of hepatocytes and BECs are less divergent in rats compared with mice. It should be also noted that, in rats, both hepatocytes and BECs undergo a proliferative crisis, a phase in which cell growth transiently slows down during passages P2–P7 (Katsuda et al., 2017, 2018). Neither mouse hepatocytes nor mouse BECs undergo the proliferative crisis, as we confirmed that FACS-sorted YFP+ cells kept growing without a transient decrease (data not shown). Furthermore, in our original study, we demonstrated that nine of 14 rat clonal CLiP lines exhibited efficient hepatic differentiation, while the other five showed very little differentiation capacity (Katsuda et al., 2017). Although lineage tracing-based evidence is lacking, we speculate that the former nine clones were derived from hepatocytes, while the latter five clones were derived from BECs. This observation is in stark contrast to that in mouse CLiP experiments in the same study, which revealed substantially decreased hepatocyte differentiation efficiency after the long-term culture (Katsuda et al., 2017), presumably reflecting the dominant growth of BECs over hepatocytes. Of note, we used the monolayer induction system in the original study, which had much less hepatic inducibility than the 3D system used in this study. These observations collectively indicate that there is a species-dependent difference in the proliferative properties of liver cells in vitro, which require further characterization in future studies.
We also aim to reconcile differences between Fu et al.’s interpretation and our own (Fu et al., 2022). First, contrary to the conclusion by Fu et al. that rat CLiPs are derived from putative liver progenitor cells, we propose that it is more likely that the “small cell population” they identified is identical to the reprogrammable 2c subset of hepatocytes, which we identified as the origin of CLiPs (Katsuda et al., 2017). In our follow-up study, we reported that the diameters of 2c, 4c, and 8c hepatocytes were 18.0 ± 3.3 μm, 24.4 ± 3.6 μm, and 29.3 ± 4.3 μm, respectively (mean ± SD) (Katsuda et al., 2020), which was reasonably consistent with Fu et al.’s observation that the diameter of purified small cells is ∼16.8 μm, while the diameter of hepatocytes is ∼24.5 μm (Fu et al., 2022). Moreover, given that the size of rat BECs is reported to be 8–14 μm in diameter (Glaser et al., 2006), it is more reasonable to consider the small cells described by Fu et al. as 2c hepatocytes than BECs. Second, the discrepancy related to the emergence of tdTomato+ small cell clusters could be attributed to failure in labeling the 2c hepatocytes by Fu et al. due to their lower infection efficiency. In our preliminary study, while the tdTomato labeling efficiency was 0.09% in the isolated hepatocytes, it unexpectedly increased to 4.8% at 14 days of culture (n = 1, data not shown). Our interpretation is that the tdTomato+ ratio did not reach the plateau at the time of hepatocyte isolation (3 days post infection). Thus, we approximate that the actual infection efficiency was ∼5% in our study, which is 100 times greater than the efficiency Fu et al. determined at 7 days post infection (0.05%). The difference in the infection efficiency could at least partly be attributed to the difference in viral dose: we injected 7.5 × 10¹² viral particles/rat, while Fu et al. injected 1.1 × 10¹² viral particles/rat. In summary, given that the remainder of Fu et al.’s study describes very similar observations as to what we reported previously, namely the demonstration of hepatic/biliary differentiation capacities (Katsuda et al., 2017), we would consider that their report faithfully reproduces our earlier study, thereby reinforcing the concept of the CLiP methodology.
Lastly, although it is important to clarify the origin of CLiP, the most significant conclusions relate to the clinical potential of this cellular technology. Therefore, beyond expanding our model on the cellular origin of CLiPs, the present study provides clear evidence that hepCLiPs can repopulate injured livers, providing substantial motivation for the therapeutic applicability of CLiP-based liver regenerative medicine. However, we used only one hepCLiP cell line, and thus reproducibility must be assessed carefully in future studies. Nonetheless, given that RNA-seq analysis confirmed that the other two hepCLiP lines also had the similar transcriptomic signatures (Figure 3), we expect that these hepCLiPs are likely to have repopulation capacity as well. Future studies are also needed to further support the translational potential of bilCLiPs in diseases involving impaired hepatic function and biliary complications. Moreover, based on our expanded model of CLiP generation, future studies are needed to determine which type of CLiPs, either hepCLiPs or bilCLiPs, are better suited to regenerate liver tissue in patients. Specifically, we hypothesize that each type of CLiP may be better suited for the treatment of liver diseases with different etiologies, for example whether the hepatocytes or biliary cells comprise the primary driver of hepatic decompensation. We believe that this work provides key evidence for the feasibility of CLiP-based regenerative medicine and broadens the possibility for cell-based therapy in patients suffering from irreversible liver damage.
Experimental procedures
Resource availability
Corresponding author
Further information and requests for resources and reagents should be directed to and will be fulfilled by the corresponding author, Takeshi Katsuda, e-mail: tkatsuda412@gmail.com.
Materials availability
All unique and stable reagents generated in this study of which sufficient quantities exists are available from the corresponding author with a complete Materials Transfer Agreement.
Rats
Rosa26-LSL-tdTomato rats on Long Evans background were injected with 7.5 × 10¹² viral particles/rat with AAV8-TBG-iCre (improved Cre) virus (VectorBio Lab) via the jugular vein. Three days following injection, hepatocytes were harvested as described below. Studies were conducted in accordance with the guidelines of the Institute for Laboratory Animal Research, National Cancer Center Research Institute.
Mice
Heterozygous or homozygous Rosa26-LSL-EYFP and Rosa26-LSL-Confetti mice on C57BL/6 backgrounds at 6–10 weeks of age were injected retro-orbitally with 2.5 × 10¹¹ viral particles of AAV8-TBG-Cre virus (Penn Vector Core). One week following injection, liver cells were isolated as described below. FRG mice (Azuma et al., 2003) at 5–6 months of age were used as host animals for the repopulation assay. Hepatobiliary reprogramming was modeled in Rosa26-LSL-Cas9-IRES-EGFP mice on C57BL/6 by challenging the mice with 0.1% 3,5-diethoxycarbonyl-1,4-dihydrocollidine (DDC) diet (Envigo) 1 week after AAV8-TBG-Cre injection. FRG mice were purchased from Yecuris, bred in the Penn Stem Cell & Xenograft Core and maintained on 1 mg/mL NTBC. Studies were conducted in accordance with the NIH and University of Pennsylvania Institutional Animal Care and Use Committee guidelines.
Hepatocyte isolation from rats
A step-by-step protocol is available online (Katsuda et al., 2018). Briefly, the liver was digested by two-step collagenase perfusion. The extracted liver was further digested in a collagenase solution at 37°C for 15 min. The digested liver was then filtered twice through a sterilized cotton mesh, and the cells were collected via centrifugation at 57 × g for 1 min. Following resuspension in 50 mL/tube of E-MEM (Sigma), large cell aggregates were eliminated by filtering the cell suspension with a 60-μm stainless cell strainer (Ikemoto Scientific Technology), and the cells were collected by centrifugation at 57 × g for 1 min. Then, the cells were resuspended in 24.5 mL/tube of complete Percoll media (composed of 25 mL of L-15 medium [Life Technologies] supplemented with 0.429 g/L HEPES [Sigma], 2 g/L BSA [Sigma], 1 × 10⁻⁷ M insulin [Sigma], 2.4 mL of 10× Hank’s balanced salt solution (HBSS)(−) [Life Technologies], and 21.6 mL of Percoll [GE Healthcare]). Dead cells were removed via centrifugation at 57 × g for 10 min. Then, the cells were washed in 50 mL/tube of E-MEM twice via centrifugation at 57 × g for 2 min, and used for cell culture.
Hepatocyte isolation from mice
Livers were perfused with 40 mL of 1× HBSS, followed by 40 mL HBSS/1 mM EGTA, and 40 mL of HBSS/5 mM CaCl2/40 μg/mL liberase. Following perfusion, livers were mechanically dissociated with tweezers, resuspended in 10 mL DMEM supplemented with 5% fetal bovine serum (FBS) (hereafter called DMEM5), and filtrated with a 70-μm cell strainer. The cells were centrifuged at 50 × g for 5 min. Then, the cells were resuspended in complete Percoll solution (10.8 mL Percoll, 12.5 mL DMEM5, and 1.2 mL 10× HBSS(−)), and centrifuged at 50 × g for 10 min. The cells were washed in 10 mL DMEM5 once by centrifugation at 50 × g for 5 min, then the cells were used for cell culture, flow cytometry, FACS, and RNA extraction.
Whole liver cell isolation from mice
Livers were digested by the two-step liberase perfusion as described above. Then, the undigested remaining tissue was transferred to a 1.5-mL tube, minced with surgical scissors, and further digested with 10× concentrated liberase (∼430 μL/tube of 400 μg/mL in HBSS with 5 mM CaCl2) at 37°C for 30 min while vortexing the sample several times intermittently. The digested tissue was filtered with a 70-μm cell strainer and combined with the cell suspension digested previously. The cells were then centrifuged at 300 × g at 4°C for 5 min. Then, the cells were suspended in 10 mL ACK lysis buffer (Quality Biological) and incubated on ice for 10 min to remove red blood cells. The cells were then collected by centrifugation at 300 × g at 4°C for 5 min, and further processed for BEC isolation as follows.
BEC isolation from mice by FACS
In some experiments, we enriched BECs using a magnetic activated cell sorting (MACS) system (Miltenyi) for more efficient FACS sorting, while in other experiments we directly proceeded to staining for FACS. We confirmed that high purity of FACS-sorted BECs was achieved in each setting (YFP− EPCAM+ rate >90%). For MACS enrichment, the cells were resuspended in MACS buffer (PBS, 0.5% BSA, 2 mM EDTA) to the final volume of approximately 1.5 mL, and 150 μL CD326 (EPCAM) MicroBeads (Miltenyi) were added. After incubation at 4°C for 15 min, the cells were washed with an equal volume of MACS buffer, and then centrifuged at 2,000 rpm (∼800 × g) at 4°C for 2 min. The cells were resuspended in 1 mL MACS buffer, and EPCAM+ cells were separated using LS columns (Miltenyi) (2 columns were used per animal; 0.5 mL suspension/column). The cells were then collected by centrifugation at 2,000 rpm (∼800 × g) at 4°C for 2 min. The cells were then resuspended in 100 μL flow buffer(+), and approximately 1 μL BV421-EPCAM (Biolegend) on ice for 20 min. After washing in 200 μL flow buffer(+) once by centrifugation at 2,000 rpm (∼800 × g) at 4°C for 2 min, the cells were resuspended in 0.5 mL flow buffer(+) with 1/1,000 TO-PRO-3, and the cells were sorted on an Aria II sorter (BD).
Cell culture
For rat cell culture, FBS-free small hepatocyte culture medium (SHM) was used as basal medium (Chen et al., 2007), namely, DMEM/F12 (Corning) containing 2.4 g/L NaHCO3 and L-glutamine, which was supplemented with 5 mM HEPES (Corning), 30 mg/L L-proline (Sigma), 0.05% BSA (Sigma), 10 ng/mL epidermal growth factor (Sigma), insulin-transferrin-serine (ITS)-X (Thermo), 10−7 M dexamethasone (Dex) (Sigma), 10 mM nicotinamide (Sigma), 1 mM ascorbic acid-2 phosphate (Wako), and 1× antibiotics (anti-anti (Thermo) or gentamycin (Gemini Bio-Products)). Cells were cultured in SHM with or without 10 μM Y-27632 (Wako), 0.5 μM A-83-01 (Wako), and 3 μM CHIR99021 (Axon Medchem). For mouse cell culture, we used SHM supplemented with 10% FBS and YAC. Isolated cells were suspended in SHM, SHM+YAC, or SHM+10% FBS+YAC at 1 × 10⁴ cells/mL, and plated on collagen-coated plates (IWAKI) according to the surface areas (0.5 mL/well, 1 mL/well, 2 mL/well, and 10 mL/plate for a 24-well, 12-well, 6-well, and 10-cm plate, respectively). Culture medium was replaced every 2–3 days. When cells reached 70%–100% confluence, they were harvested by standard trypsinization, and passaged to new plates at 1/20–1/40 dilution.
Flow cytometry and FACS
Cells were stained with antibodies listed in Table S2 at 1/100 dilution in flow buffer (HBSS, pH 7.4, supplemented with 25 mM HEPES [Thermo], 5 mM MgCl2 [MedSupply Partners], 1× Pen/Strep [Thermo], 1× Fungizone [Thermo], 1× NEAA [Thermo], 1× Glutamax [Thermo], 0.3% glucose [Sigma], 1× sodium pyruvate [Thermo]) supplemented with 40 μg/mL DNase I (hereafter called flow buffer(+)). The cells were washed twice in flow buffer(+) and centrifuged at 800 × g for 1 min before and after each wash, then were resuspended in flow buffer(+) containing 1/1,000× TO-PRO-3 (Thermo) and analyzed using an LSR II analyzer (BD) for flow cytometry or sorted on an Aria II sorter (BD).
Hepatic induction
To generate spheroids, we used Aggrewell400 24-well plates (Stemcell Technologies), which were pre-treated with Anti-Adherence Rinsing Solution according to the manufacturer’s instructions (Stemcell Technologies). After trypsinization, cells were resuspended in SHM+YAC without FBS, and the cell concentration was adjusted to 1–1.2 × 10⁶ cells/mL. Then, 1 mL of the cell suspension was added to an Aggrewell400 plate well, which was pre-filled with 1 mL of SHM+YAC, and mixed thoroughly by pipetting. Then, plates were centrifuged at 100 × g for 3 min, and placed in a CO2 incubator. Following incubation for 3 days without medium change, spheroids were harvested in a 15-mL tube. After sitting for approximately 5 min, the supernatant was removed, and spheroids were resuspended in 5 mL SHM+YAC supplemented with 10 ng/mL mouse oncostatin M (R & D), and seeded to a 60 mm ultra-low attachable suspension culture plate (Corning). Then, spheroids were cultured on a rocking shaker at 15 rpm speed for 6–8 days. Half volume (2.5 mL) of the medium was removed and 2.5 mL fresh medium was replenished every 2 days.
Intrasplenic transplantation of hepCLiPs
Two-dimensional cultured cells were harvested using TrypLE (Thermo). Briefly, hepCLiPs grown in a 10-cm plate were treated with 2 mL TrypLE at 37°C for approximately 10 min, and harvested with 5 mL 10%FBS-DMEM. Three-dimensional cultured spheres were collected in 15-mL tubes by gravity for approximately 1 min. After washing twice in PBS (collected by gravity), the spheres were dissociated with TrypLE Express or Accutase (Sigma) supplemented with 40 μg/mL DNase I at 37°C for 25–45 min with intermittent inversion. Following further dissociation with gentle pipetting with P1000 tips, the cells were resuspended in 5 mL 10% FBS-DMEM supplemented with 0.04 mg/mL DNase. Harvested cells were then filtered with a 35-μm cell strainer-equipped FACS tube (BD) and collected by centrifugation at 1,500 rpm (approximately 480 × g) for 3 min. For hepCLiP_2D and hepCLiP_3D cells harvested with TrypLE, the cells were resuspended in HBSS at 1 × 10⁷ cells/mL. Then, a small incision was made on the left flank of the mice, the spleen was extracted and held with tweezers, and 5 × 10⁵ cells/50 μL were injected into the spleen of FRG mice. For hepCLiP_3D cells harvested with Accutase, the cells were resuspended in HBSS at 5 × 10⁶ cells/mL, and 2.5 × 10⁵ cells/50 μL were injected into the spleen of FRG mice. All the transplantation procedures were conducted by the Penn Stem Cell & Xenograft Core. The FRG mice were maintained under nitisinone cycles following the guideline by Yecuris, the animal supplier, and all animals were maintained by the Penn Stem Cell & Xenograft Core.
NTBC ON/OFF cycling
We followed the NTBC cycling schedule recommended by Yecuris with a minor modification. We did not take the option of Adenovirus-uPA injection prior to transplantation. FRG mice were maintained on 1 mg/mL NTBC until 1 day before transplantation. NTBC was withdrawn for the next 3 days, including the day of transplantation. The mice were challenged with short cycles: NTBC ON (3–5 days) and OFF (5–7 days) for approximately 1.5 months. Then, the mice were further challenged with long cycles: NTBC ON (5 days) and OFF (21–22 days) for 2.3 months. The mice were harvested in the middle of the third round of the long cycles (on the 12th or 14th day, corresponding to ∼3.8 months from the day of transplantation).
Author contributions
Conceptualization, T.K.; Experiments, T.K., A.J.M., W.V., A.S.; Data Analysis, T.K., J.L, J.S.; Investigation, T.K., A.J.M., J.S., J.M.; Writing, T.K., J.S.; Funding Acquisition, T.K., B.Z.S., T.O.
Acknowledgments
We thank the staff of the Penn Stem Cell & Xenograft Core for providing the FRG mice, performing transplantation experiments, and taking care of the NTBC cycles to maintain the mice. We thank the Center for Molecular Studies in Digestive and Liver Diseases (P30DK050306) and University of Pennsylvania Perelman School of Medicine Molecular Pathology and Imaging Core (MPIC), RRID: SCR_022420, for preparing paraffin sections and performing H&E staining. We thank Dr. Bin Li (Grompe Lab in OHSU) for providing valuable advice on the repopulation experiments. We thank Drs. Hiroshi Maeno and John Seykora (University of Pennsylvania) for generously granting us use of their Keyence BZX710 microscope. This work was supported by NIH grants R01DK083355, the Fred and Suzanne Biesecker Pediatric Liver Center, the Abramson Family Cancer Research Institute, the Mochida Memorial Foundation for Medical and Pharmaceutical Research, the Uehara Memorial Foundation, the Kanae Foundation, and the Osamu Hayaishi Memorial Scholarship for study abroad of the Japanese Biochemical Society.
Conflict of interests
The authors declare no competing interests.
Published: June 22, 2023
Footnotes
Supplemental information can be found online at https://doi.org/10.1016/j.stemcr.2023.05.016.
Supplemental information
Data and code availability
The RNA-seq data that were generated during the study have been deposited in the Gene Expression Omnibus (GEO) with the accession number GEO: GSE229543 (in vitro) and GEO: GSE218945 (in vivo). Detailed scripts and parameters used for each step of the analysis provided by reasonable request to the authors.
References
- Azuma H., Hirose T., Fujii H., Oe S., Yasuchika K., Fujikawa T., Yamaoka Y. Enrichment of hepatic progenitor cells from adult mouse liver. Hepatology. 2003;37:1385–1394. doi: 10.1053/jhep.2003.50210. [DOI] [PubMed] [Google Scholar]
- Azuma H., Paulk N., Ranade A., Dorrell C., Al-Dhalimy M., Ellis E., Strom S., Kay M.A., Finegold M., Grompe M. Robust expansion of human hepatocytes in Fah-/-/Rag2-/-/Il2rg-/- mice. Nat. Biotechnol. 2007;25:903–910. doi: 10.1038/nbt1326. [DOI] [PMC free article] [PubMed] [Google Scholar]
- Chen Q., Kon J., Ooe H., Sasaki K., Mitaka T. Selective proliferation of rat hepatocyte progenitor cells in serum-free culture. Nat. Protoc. 2007;2:1197–1205. doi: 10.1038/nprot.2007.118. [DOI] [PubMed] [Google Scholar]
- Font-Burgada J., Shalapour S., Ramaswamy S., Hsueh B., Rossell D., Umemura A., Taniguchi K., Nakagawa H., Valasek M.A., Ye L., et al. Hybrid periportal hepatocytes regenerate the injured liver without giving rise to cancer. Cell. 2015;162:766–779. doi: 10.1016/j.cell.2015.07.026. [DOI] [PMC free article] [PubMed] [Google Scholar]
- Fu G.-B., Huang W.-J., Zeng M., Zhou X., Wu H.-P., Liu C.-C., Wu H., Weng J., Zhang H.-D., Cai Y.-C., et al. Expansion and differentiation of human hepatocyte-derived liver progenitor-like cells and their use for the study of hepatotropic pathogens. Cell Res. 2019;29:8–22. doi: 10.1038/s41422-018-0103-x. [DOI] [PMC free article] [PubMed] [Google Scholar]
- Fu Q., Ohnishi S., Suda G., Sakamoto N. Small-molecule inhibitor cocktail promotes the proliferation of pre-existing liver progenitor cells. Stem Cell Rep. 2022;17:1589–1603. doi: 10.1016/j.stemcr.2022.05.023. [DOI] [PMC free article] [PubMed] [Google Scholar]
- Glaser S., Francis H., Demorrow S., Lesage G., Fava G., Marzioni M., Venter J., Alpini G. Heterogeneity of the intrahepatic biliary epithelium. World J. Gastroenterol. 2006;12:3523–3536. doi: 10.3748/wjg.v12.i22.3523. [DOI] [PMC free article] [PubMed] [Google Scholar]
- Halpern K.B., Shenhav R., Matcovitch-Natan O., Tóth B., Lemze D., Golan M., Massasa E.E., Baydatch S., Landen S., Moor A.E., et al. Single-cell spatial reconstruction reveals global division of labour in the mammalian liver. Nature. 2017;543:742. doi: 10.1038/nature21729. [DOI] [PubMed] [Google Scholar]
- Huang Y., Sakai Y., Hara T., Katsuda T., Ochiya T., Adachi T., Hidaka M., Gu W.-L., Eguchi S. Development of bifunctional three-dimensional cysts from chemically induced liver progenitors. Stem Cell. Int. 2019;2019 doi: 10.1155/2019/3975689. [DOI] [PMC free article] [PubMed] [Google Scholar]
- Huang Y., Miyamoto D., Li P.-L., Sakai Y., Hara T., Adachi T., Soyama A., Hidaka M., Kanetaka K., Gu W.-L., Eguchi S. Chemical conversion of aged hepatocytes into bipotent liver progenitor cells. Hepatol. Res. 2021;51:323–335. doi: 10.1111/hepr.13609. [DOI] [PubMed] [Google Scholar]
- Huang Y., Sakai Y., Hara T., Katsuda T., Ochiya T., Gu W.L., Miyamoto D., Hamada T., Hidaka M., Kanetaka K., et al. Bioengineering of a CLiP-derived tubular biliary-duct-like structure for bile transport in vitro. Biotechnol. Bioeng. 2021;118:2572–2584. doi: 10.1002/bit.27773. [DOI] [PubMed] [Google Scholar]
- Iansante V., Mitry R.R., Filippi C., Fitzpatrick E., Dhawan A. Human hepatocyte transplantation for liver disease: current status and future perspectives. Pediatr. Res. 2018;83:232–240. doi: 10.1038/pr.2017.284. [DOI] [PubMed] [Google Scholar]
- Igarashi H., Koizumi K., Kaneko R., Ikeda K., Egawa R., Yanagawa Y., Muramatsu S.I., Onimaru H., Ishizuka T., Yawo H. A novel reporter rat strain that conditionally expresses the bright red fluorescent protein tdTomato. PLoS One. 2016;11 doi: 10.1371/journal.pone.0155687. [DOI] [PMC free article] [PubMed] [Google Scholar]
- Kamiya A., Kojima N., Kinoshita T., Sakai Y., Miyaijma A. Maturation of fetal hepatocytes in vitro by extracellular matrices and oncostatin M: induction of tryptophan oxygenase. Hepatology. 2002;35:1351–1359. doi: 10.1053/jhep.2002.33331. [DOI] [PubMed] [Google Scholar]
- Katsuda T., Kojima N., Ochiya T., Sakai Y. Biliary epithelial cells play an essential role in the reconstruction of hepatic tissue with a functional bile ductular network. Tissue Eng. 2013;19:2402–2411. doi: 10.1089/ten.TEA.2013.0021. [DOI] [PubMed] [Google Scholar]
- Katsuda T., Kawamata M., Hagiwara K., Takahashi R.U., Yamamoto Y., Camargo F.D., Ochiya T. Conversion of terminally committed hepatocytes to culturable bipotent progenitor cells with regenerative capacity. Cell Stem Cell. 2017;20:41–55. doi: 10.1016/j.stem.2016.10.007. [DOI] [PubMed] [Google Scholar]
- Katsuda T., Hosaka K., Ochiya T. Generation of chemically induced liver progenitors (CLiPs) from rat adult hepatocytes. Bio. Protoc. 2018;8:269–e2726. doi: 10.21769/BioProtoc.2689. [DOI] [PMC free article] [PubMed] [Google Scholar]
- Katsuda T., Matsuzaki J., Yamaguchi T., Yamada Y., Prieto-Vila M., Hosaka K., Takeuchi A., Saito Y., Ochiya T. Generation of human hepatic progenitor cells with regenerative and metabolic capacities from primary hepatocytes. Elife. 2019;8 doi: 10.7554/eLife.47313. [DOI] [PMC free article] [PubMed] [Google Scholar]
- Katsuda T., Hosaka K., Matsuzaki J., Usuba W., Prieto-Vila M., Yamaguchi T., Tsuchiya A., Terai S., Ochiya T. Transcriptomic dissection of hepatocyte heterogeneity: linking ploidy, zonation, and stem/progenitor cell characteristics. Cell. Mol. Gastroenterol. Hepatol. 2020;9:161–183. doi: 10.1016/j.jcmgh.2019.08.011. [DOI] [PMC free article] [PubMed] [Google Scholar]
- Katsuda T., Cure H., Sussman J., Simeonov K.P., Krapp C., Arany Z., Grompe M., Stanger B.Z. Rapid in vivo multiplexed editing (RIME) of the adult mouse liver. Hepatology. 2022 doi: 10.1002/hep.32759. [DOI] [PMC free article] [PubMed] [Google Scholar]
- Katsuda T., Sussman J., Ito K., Katznelson A., Yuan S., Li J., Merrell A.J., Takenaka N., Cure H., Li Q., et al. Physiological reprogramming in vivo mediated by Sox4 pioneer factor activity. bioRxiv. 2023 doi: 10.1101/2023.02.14.528556. [DOI] [PMC free article] [PubMed] [Google Scholar]
- Kim Y., Kang K., Lee S.B., Seo D., Yoon S., Kim S.J., Jang K., Jung Y.K., Lee K.G., Factor V.M., et al. Small molecule-mediated reprogramming of human hepatocytes into bipotent progenitor cells. J. Hepatol. 2019;70:97–107. doi: 10.1016/j.jhep.2018.09.007. [DOI] [PubMed] [Google Scholar]
- Li B., Wang Y., Pelz C., Moss J., Shemer R., Dor Y., Akkari Y.K., Canady P.S., Naugler W.E., Orloff S., Grompe M. In vitro expansion of cirrhosis derived liver epithelial cells with defined small molecules. Stem Cell Res. 2021;56 doi: 10.1016/j.scr.2021.102523. [DOI] [PubMed] [Google Scholar]
- Maddipati R., Stanger B.Z. Pancreatic cancer metastases harbor evidence of polyclonality. Cancer Discov. 2015;5:1086–1097. doi: 10.1158/2159-8290.CD-15-0120. [DOI] [PMC free article] [PubMed] [Google Scholar]
- Merrell A.J., Peng T., Li J., Sun K., Li B., Katsuda T., Grompe M., Tan K., Stanger B.Z. Dynamic transcriptional and epigenetic changes drive cellular plasticity in the liver. Hepatology. 2021;74:444–457. doi: 10.1002/hep.31704. [DOI] [PMC free article] [PubMed] [Google Scholar]
- Rezvani M., Grimm A.A., Willenbring H. Assessing the therapeutic potential of lab-made hepatocytes. Hepatology. 2016;64:287–294. doi: 10.1002/hep.28569. [DOI] [PMC free article] [PubMed] [Google Scholar]
- Rizki-Safitri A., Shinohara M., Miura Y., Danoy M., Tanaka M., Miyajima A., Sakai Y. Efficient functional cyst formation of biliary epithelial cells using microwells for potential bile duct organisation in vitro. Sci. Rep. 2018;8:11086–11111. doi: 10.1038/s41598-018-29464-w. [DOI] [PMC free article] [PubMed] [Google Scholar]
- Rizki-Safitri A., Shinohara M., Tanaka M., Sakai Y. Tubular bile duct structure mimicking bile duct morphogenesis for prospective in vitro liver metabolite recovery. J. Biol. Eng. 2020;14:11–13. doi: 10.1186/s13036-020-0230-z. [DOI] [PMC free article] [PubMed] [Google Scholar]
- Sato K., Marzioni M., Meng F., Francis H., Glaser S., Alpini G. Ductular reaction in liver diseases: pathological mechanisms and translational significances. Hepatology. 2019;69:420–430. doi: 10.1002/hep.30150. [DOI] [PMC free article] [PubMed] [Google Scholar]
- Tanimizu N., Ichinohe N., Ishii M., Kino J., Mizuguchi T., Hirata K., Mitaka T. Liver progenitors isolated from adult healthy mouse liver efficiently differentiate to functional hepatocytes in vitro and repopulate liver tissue. Stem Cell. 2016;34:2889–2901. doi: 10.1002/stem.2457. [DOI] [PubMed] [Google Scholar]
- Tanimizu N., Ichinohe N., Sasaki Y., Itoh T., Sudo R., Yamaguchi T., Katsuda T., Ninomiya T., Tokino T., Ochiya T., et al. Generation of functional liver organoids on combining hepatocytes and cholangiocytes with hepatobiliary connections ex vivo. Nat. Commun. 2021;12:3390. doi: 10.1038/s41467-021-23575-1. [DOI] [PMC free article] [PubMed] [Google Scholar]
- Wu H., Zhou X., Fu G.-B., He Z.-Y., Wu H.-P., You P., Ashton C., Wang X., Wang H.-Y., Yan H.-X. Reversible transition between hepatocytes and liver progenitors for in vitro hepatocyte expansion. Cell Res. 2017;27:709–712. doi: 10.1038/cr.2017.47. [DOI] [PMC free article] [PubMed] [Google Scholar]
- Zhang K., Zhang L., Liu W., Ma X., Cen J., Sun Z., Wang C., Feng S., Zhang Z., Yue L., et al. In vitro expansion of primary human hepatocytes with efficient liver repopulation capacity. Cell Stem Cell. 2018;23:806–819.e4. doi: 10.1016/j.stem.2018.10.018. [DOI] [PubMed] [Google Scholar]
Associated Data
This section collects any data citations, data availability statements, or supplementary materials included in this article.
Supplementary Materials
Data Availability Statement
The RNA-seq data that were generated during the study have been deposited in the Gene Expression Omnibus (GEO) with the accession number GEO: GSE229543 (in vitro) and GEO: GSE218945 (in vivo). Detailed scripts and parameters used for each step of the analysis provided by reasonable request to the authors.