

Summary
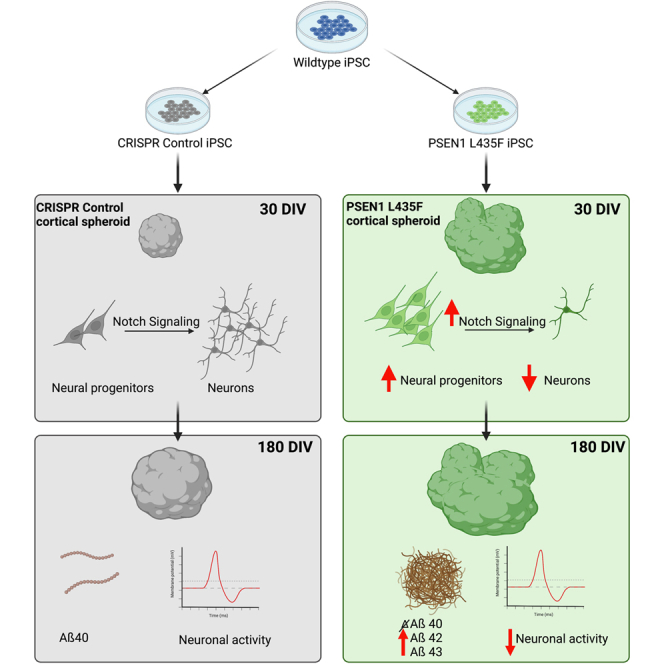
Alzheimer’s disease (AD) is the most common neurodegenerative disorder, but its root cause may lie in neurodevelopment. PSEN1 mutations cause the majority of familial AD, potentially by disrupting proper Notch signaling, causing early unnoticed cellular changes that affect later AD progression. While rodent models are useful for modeling later stages of AD, human induced pluripotent stem cell-derived cortical spheroids (hCSs) allow access to studying the human cortex at the cellular level over the course of development. Here, we show that the PSEN1 L435F heterozygous mutation affects hCS development, increasing size, increasing progenitors, and decreasing post-mitotic neurons as a result of increased Notch target gene expression during early hCS development. We also show altered Aβ expression and neuronal activity at later hCS stages. These results contrast previous findings, showing how individual PSEN1 mutations may differentially affect neurodevelopment and may give insight into fAD progression to provide earlier time points for more effective treatments.
Keywords: Alzheimer’s disease, neurodevelopment, human cortical spheroids, NOTCH signaling, neurodegeneration, organoid, iPSC, PSEN1, γ-secretase
Graphical abstract
Highlights
-
•
PSEN1 L435F affects cortical spheroid growth and morphology
-
•
PSEN1 L435F increases cortical progenitors and reduces neuron differentiation
-
•
Specific Notch1 inhibition rescues cellular phenotypes
-
•
PSEN1 L435F increases Aβ42/40 and Aβ43/40 ratios
Hsieh and colleagues found the Alzheimer’s-related Presenilin1 L435F mutation causes increased Notch signaling in hiPSC-derived 3D cortical spheroids. They found altered size and morphology of PSEN1 hCSs, reduced neuronal differentiation, and increased Notch target gene expression. Phenotypes were rescued with Notch1 inhibition. The authors also found increased Aβ42/40 and Aβ43/40, suggesting that altered neurodevelopment may play a role in Alzheimer’s pathology.
Introduction
Alzheimer’s disease (AD) is the sixth leading cause of death in the United States, yet the exact cause of AD remains unknown (Alzheimer’s disease facts and figures, 2022). Existing approved treatments for AD are designed to target the already existing AD neuropathology, potentially limiting their effectiveness as they may be administered too late to see significant effects. More effective treatments will begin with preventative medicine, raising the crucial task of determining the exact cellular mechanisms underlying AD. Familial AD (fAD) provides a tractable inroad to begin understanding these mechanisms, as autosomal dominant genetically inherited mutations are known to cause AD earlier in life. The majority of fAD is caused by genetic mutations in Presenilin1 (PSEN1) (Shen and Kelleher, 2007; Selkoe, 1997, 2001; Bekris et al., 2010).
PSEN1, the catalytic component of γ-secretase, is responsible for cleaving the amyloid precursor protein (APP) that deposits the amyloid plaques as seen in all AD postmortem brains (De Strooper et al., 2012; Haass and Selkoe, 1993). γ-Secretase also cleaves the Notch1 receptor during neurodevelopment to control cell fate decision making (Lee and Ch’ng, 2020). After contacting a neighboring cell and binding to its ligand Delta or Jagged, the Notch1 receptor undergoes multiple cleavages, with cleavage by γ-secretase releasing the Notch intracellular domain (NICD). NICD then translocates to the nucleus of the receiving cell, binding the CSL-MAML complex to activate transcription factors, including HES1, to inhibit neuronal differentiation, keeping this cell in the progenitor pool (De Strooper et al., 1999; Handler et al., 2000; Lasky and Wu, 2005; Cau and Blader, 2009). Hence, Notch signaling controls the amounts of neural progenitors as well as post-mitotic neurons in the developing brain, crucial for proper neurodevelopment. Mutations in PSEN1 may therefore disrupt Notch signaling long before fAD symptoms manifest.
Previous studies in mice have shown that embryonic PSEN1 knockout causes premature neuronal differentiation, a depletion in neural progenitors, and lethality at birth (Handler et al., 2000). In addition, the conditional double knockout of PSEN1 and PSEN2 in the forebrain of newborn mice show significant reduction in cortical volume and neuronal number, further supporting PSEN1’s crucial role in proper neurodevelopment (Wines-Samuelson et al., 2010). PSEN1 knockout has not been associated with fAD in humans, but over 300 mutations have been discovered in PSEN1 associated with human fAD. Of those, the M146L mutation is the most frequently occurring, and the L435F mutation is one of the least common but highly severe, causing widespread Aβ43 cotton wool plaques (Morelli et al., 1998; Rogaeva et al., 2001).
Mutations in PSEN1 have been categorized as loss of function, similar to the knockout. This includes the dominant negative D385A mutation. Although not found in AD patients, this mutation has been shown to be critical for γ-secretase activity in vitro (Kim et al., 2005). Although several PSEN1 mutations have been shown to also act like this, there also may be gain of function mutations in PSEN1 associated with AD. One example of which is the PSEN1 M146L mutation, which has been shown to increase γ-secretase function in relation to cleavage of the STIM1 calcium pore sensor (Tong et al., 2016). The M146L mutation also has shown to increase the Aβ42/40 ratio through increased Aβ42 production and no change in Aβ40 in iPSC-derived neurons (Liu et al., 2014; Sproul et al., 2014; Schrank et al., 2020). These two mutations show that there are many possible mechanisms of action that result in AD pathology and prognosis, which is crucial when attempting to develop more effective therapeutics targeted at preventing or reversing the onset of AD.
In addition to distinctive mutations having differential effects, it is also possible that a single-point mutation may have unique effects on γ-secretase activity in relation to individual pathways. The PSEN1 L435F mutation has been categorized as a loss of function in relation to APP processing in that it decreases the production of both Aβ42 and Aβ40, while increasing the ratio of Aβ42/40 (Sun et al., 2017). The L435F mutation also increased Aβ43 production and tau pathology (Oakley et al., 2020, 2021). Previous studies also showed loss of γ-secretase function in relation to Notch signaling in rodent models harboring the L435F mutation (Xia et al., 2015). Here, we report for the first time that the PSEN1 L435F mutation causes a gain of function in relation to Notch signaling in human iPSC-derived 3D cortical spheroids and an increase in Aβ43 levels. PSEN1 L435 has been shown to directly interact with APP, but not Notch1, which may result in the different effects the L435F mutation have on γ-secretase activity in relation to APP processing and Notch signaling (Yang et al., 2019; Zhou et al., 2019).
As there are also significant differences between human and mouse brain development, there is crucial need for a human-based model to study PSEN1’s role in neurodevelopment. Human induced pluripotent stem cells (iPSCs) are a valuable model in which to do so. Previous studies using iPSC-derived neurons and neuronal progenitors with various PSEN1 mutations have shown premature neuronal differentiation in vitro, seen by increased neurons and a reduction in NICD (Arber et al., 2021). However, this process has not been widely studied in a human three-dimensional (3D) cellular model. iPSC-derived 3D human cortical spheroids (hCSs) provide a technically relevant opportunity to model the developing human cortex in vitro and to study neurodevelopment at the cellular and molecular level, something that is not feasible in human fetal brain development. In addition, the 3D structure of hCSs also greatly increases cell-cell contact, which is necessary for Notch signaling to occur and proper neurodevelopment to ensue. The use of 3D hCSs provides an advantage over previously used 2D cultures of neural progenitors or neurons derived from iPSCs harboring PSEN1 mutations, as hCSs provide a significantly greater opportunity for Notch signaling to occur, and hCSs also contain a wider variety of cell types as they mature, including radial glia, neural stem cells, deep and upper layer neurons, and astrocytes.
In this study, we derive hCSs from isogenic iPSC lines harboring the PSEN1 L435F, M146L, or D385A mutations. L435F and M146L have previously been studied in mice and in patient-derived iPSC neurons in 2D in the context of Aβ production. Both mutations resulted in an increased Aβ42/40 ratio, but through different mechanisms: L435F decreased both Aβ42 and Aβ40 production while M146L increased Aβ42 production without affecting Aβ40 (Liu et al., 2014; Sproul et al., 2014; Schrank et al., 2020; Sun et al., 2017). Isogenic iPSC lines provide the opportunity to reveal any changes as a result of an individual point mutation, as the cell lines are identical aside from the specific induced mutation. The PSEN1 L435F, M146L, or the D385A mutations have also not been studied in a 3D cellular model or in the context of Notch signaling in human cells. Further studies are necessary to determine how specific PSEN1 mutations affect Notch signaling during human neurodevelopment and if any changes in neurodevelopment affect AD pathology.
We report that all three individual point mutations increased the size of hCSs throughout their development compared with their isogenic control line, but the L435F mutation displayed a distinct morphological change throughout the differentiation. We further show that hCSs carrying the PSEN1 L435F mutation show increased neural progenitors and decreased post-mitotic neurons throughout the lifespan of the hCSs. Underlying these cellular differences is an increase in Notch target genes HES1, HEY1, and FABP7 and increased NICD, suggesting a gain of function of γ-secretase activity in hCSs. We also show an increase in AD-related neuropathology and a decrease in extracellular neuronal activity. Size and morphology differences, as well as progenitor and neuron amounts, were rescued in the presence of a Notch signaling inhibitor, further supporting a role of perturbed Notch signaling in relation to fAD pathology.
These findings support that specific PSEN1 mutations may have differential effects during neurodevelopment but have the same result of fAD later in life. These findings also suggest that neuronal development may play a large role in neurodegeneration, providing an earlier time for treatment, increasing the likelihood of successful intervention in AD and prolonging a healthy life.
Results
PSEN1 mutations increase area and affect morphology of hCSs across time
Eight isogenic iPSC lines were used for the following studies: two parent control lines, one male and one female line which successfully went through CRISPR-Cas9 gene editing with an empty guide RNA sequence, and three lines per male and female harboring the PSEN1 L435F, M146L, or D385A point mutations (Figure S1A). All eight lines were genotyped and confirmed for heterozygous point mutations, as well as confirmed normal karyotype (Figure S1C). In addition, pluripotency was confirmed before experiments began (Figure S1B). The eight iPSC lines were individually patterned toward a neural fate to 3D hCSs adapted from a previous protocol (Amin and Pasca, 2018; Birey et al., 2017) (Figure 1A). hCSs were imaged using bright-field fluorescence at 14, 30, 60, 90, 120, 180, 270, and 365 days in vitro (DIV) (Figures 1B, S2A, and S2D). All PSEN1 mutations showed a significant increase in area beginning at 60 DIV and at all subsequent time points, through 180 DIV; the PSEN1 L435F male and female hCSs showed increased area beginning at 14 DIV and persisting through 365 DIV (Figures 1B, 1C, S2A, S2B, S2D, and S2E). Along with the increased area, the PSEN1 L435F hCSs showed a very prominent morphological change beginning at 14 DIV and persisting through 365 DIV (Figures 1B and S2D). The morphological differences were quantified using a measure of circularity, and the PSEN1 L435F hCSs show a significantly reduced circularity measure at all time points from 14 to 365 DIV (Figures 1D and S2F). No changes in PSEN1 expression at 30 DIV or cell death occurred in later-stage differentiation (Figures S1D and S1E). This phenotype was specific to the PSEN1 L435F hCSs, as the control, the M146L or D385A hCSs do not show any morphological differences and have a characteristic spherical morphology at all time points (Figures 1B, S2A, and S2C). In addition, this was confirmed in the female iPSC-derived hCSs, with the L435F hCSs showing increased area and reduced circularity, but not the M146L or D385A hCSs (Figures S2D–S2F). Due to its significant increase in area and distinct morphology, we performed subsequent studies with the PSEN1 L435F mutation.
Figure 1.

Differentiation and growth of hCSs
(A) Schematic of differentiation of iPSCs to hCSs including the specific time points and factors used for differentiation and readouts.
(B) Representative bright-field images of male control and PSEN1 L435F hCSs at each time point from 14 to 365 DIV. Scale bar, 500 μm (for all images).
(C) Quantification of area of male hCSs at each time point. n = 10–15 hCSs from 2 to 3 independent replicates.
(D) Circularity measure of male hCSs at each time point. Data are presented as mean ± SEM. ∗p < 0.05, ∗∗p < 0.01, ∗∗∗p < 0.001 from unpaired t tests per time point.
PSEN1 L435F increases neural progenitors
To begin to determine the cause of the increased size and change in morphology, we looked at the cell-type composition of the hCSs. Due to PSEN1’s role in Notch1-mediated neural fate decisions, we measured neural progenitors in the hCSs. At 30 DIV we found a significant increase in PAX6+ neural progenitors in the male L435F hCSs by immunohistochemistry (IHC) analysis (Figures 2A and 2B). This increase is specific to the L435F hCSs, as the M146L or D385A hCSs did not show any differences in PAX6 expression at 30 DIV (Figure S3A). Along with increased PAX6 expression, we also saw an increased number of ventricular zones (VZs) in the L435F hCSs, as defined by a tubular-like region of PAX6+ cells (Figure 2C). Similar results are seen in the female iPSC-derived hCSs (Figures S3B and S3C). As these data contrast previous reports of a reduction in neural progenitors and a depletion of neural stem cells as a result of PSEN1 mutations or PSEN1 knockout, we then measured SOX2+ and NESTIN+ neural stem cells and found no significant differences between hCSs at 30 DIV (Figures S3D and S3E). This increase specifically in neural progenitors and VZs may account for the increased size and morphological change of the L435F hCSs. Size differences are not accounted for by increased proliferation in male hCSs, as L435F hCSs did not affect KI67 or BrdU expression by IHC, TOP2A expression, a gene for cell proliferation, by qRT-PCR, but increased KI67 was seen in the female hCSs (Figures 2D–2F, S3F, and S3H). No changes in proliferating progenitors were seen, as no differences between PAX6/KI67 colocalization were detected at 30 DIV (Figure S3G). In addition, there were also no changes in cell-cycle states between the hCSs as measured by flow cytometry (Figure S3I). Therefore, the PSEN1 L435F mutation may be increasing neural progenitors by virtue of reducing neuronal differentiation in the hCSs, keeping cells in the progenitor stage and preventing differentiation into post-mitotic neurons.
Figure 2.

PSEN1 L435F increases PAX6+ neural progenitors and VZs at day 30
(A) Representative IHC images of male control and PSEN1 L435F hCSs stained for PAX6 and DAPI.
(B and C) (B) Quantification of PAX6 at 30 DIV and (C) quantification of VZs at 30 DIV in male hCSs; VZs defined as a circular PAX6+ structure. N = 10–12 hCSs from 4 individual replicates, including outliers. Scale bars, 50 μm.
(D) Representative IHC images of male hCSs stained for KI67 and DAPI at 30 DIV.
(E and F) (E) Quantification of KI67 and (F) BrdU in male hCSs at 30 DIV. N = 9–12 hCSs from 3 to 4 independent replicates. Data are presented as mean ± SEM. p value from unpaired t tests and Cohen’s d value for effect size are shown.
PSEN1 L435F decreases neuronal differentiation
Previous studies have reported that PSEN1 mutations cause premature neuronal differentiation in 2D iPSC-derived cells. As our findings showed increased neural progenitors, we then aimed to determine if the PSEN1 L435F mutation affects neuronal differentiation. We found at 30 DIV a significant reduction in both TUJ1+ and MAP2+ neurons in male L435F hCSs (Figures 3A–3D) and significant reduction in TUJ1+ neurons in the female L435F hCSs (Figure S4A). This neuronal reduction persisted at 60 DIV, as seen by a significant reduction of TUJ1+ neurons in L435F hCSs (Figures 3E and 3F). In addition, we also found that this decrease in neurons persisted through 180 DIV, as seen by a significant reduction in MAP2+ neurons in L435F hCSs (Figures 3G and 3H). TUJ1+ neurons also showed a trend toward a reduction in the L435F male hCSs at 180 DIV (Figure S4B). Therefore, in addition to increased neuronal progenitors, the PSEN1 L435F mutation causes reduced neuronal differentiation in hCSs.
Figure 3.

PSEN1 L435F reduces neuronal differentiation
(A and B) (A) TUJ1 IHC and (B) quantification of male control and PSEN1 L435F hCSs at 30 DIV.
(C and D) (C) MAP2 IHC and (D) quantification in male hCSs at 30 DIV.
(E and F) (E) TUJ1 IHC and (F) quantification in male hCSs at 60 DIV.
(G and H) (G) MAP2 IHC and (H) quantification in male hCSs at 180 DIV. N = 10–12 hCSs from 4 individual replicates, including outliers. p values from unpaired t tests and Cohen’s d value for effect size are shown. Scale bars, 500 and 75 μm (inset). Data are presented as mean ± SEM.
PSEN1 L435F affects Notch target gene expression
To determine the molecular causes underlying our findings of increased progenitors and decreased neuronal differentiation, we next determined if PSEN1 L435F affects Notch signaling, due to γ-secretase’s role in Notch signaling during neurodevelopment. Previous studies of PSEN1 knockout or homozygous PSEN1 L435F knockin in mice resulted in a loss of Notch signaling as determined by a decrease in the expression of the NICD. In contrast, results of our protein analysis revealed no change or slight increase in NICD expression levels in L435F hCSs (Figures 4A and 4B). As hCSs are heterogeneous, some replicates showed an increase in NICD, a slight decrease, but no loss of NICD as previously reported in PSEN1 mutants (Tambini and D'Adamio, 2020). In addition, western blot protein analysis was performed in bulk from four pooled hCSs, containing a mixture of cell types, potentially leading to no observable change in NICD expression. To confirm these findings, we used qRT-PCR to measure expression of downstream Notch target genes HEY1, FABP7, and HES1 in the hCSs. We found an increase in all three genes in the L435F hCSs at 30 DIV, revealed by significance or large effect sizes in each gene (Figure 4C). The PSEN1 L435F mutation is specifically affecting Notch signaling in the hCSs to increase HES1 expression, as ATF2, a Notch-independent upstream regulator of HES1, expression by qRT-PCR is not affected (Figure S5A). In addition, we see a significant decrease in ASCL1 in L435F hCSs (Figure 4C), which is supported by previous research showing decreased ASCL1 expression as a result in increased HES1 expression (Sueda et al., 2019). These findings also support our decreased neuronal expression by IHC at 30 DIV (Figures 3B–3D), as ASCL1 is a proneural gene and suppression results in the prevention of neuronal differentiation. These findings are also mutation specific, as the M146L and D385A hCSs did not affect Notch target gene expression (Figure S5B). As qRT-PCR measures bulk gene expression of hCSs, we employed RNAScope to detect mRNA expression within control and L435F hCSs to determine the localization and cell-type co-expression of HES1 mRNA. RNAScope results reveal that 30 DIV L435F hCSs show increased PAX6 mRNA, similar to the increased PAX6 protein expression revealed by IHC (Figures 4D, 4E, 2A, and 2B) and increased HES1 mRNA (Figures 4D and 4E) compared with control hCSs. This is accompanied by no change in the amount of PAX6 cells that also express HES1 mRNA (Figure 4E). We also found a decrease in TUBB3 mRNA in L435F hCSs (Figures 4F and 4G) similarly to our finding of decreased TUJ1 protein expression by IHC (Figure 3B). Surprisingly, we see a large effect size increase in the amount of TUBB3 cells that also express HES1 mRNA in the L435F hCSs (Figure 4G). As TUJ1 is a marker of immature neurons or neuroblasts, this could be due to the presence of neuroblasts cycling and preventing differentiation into mature neurons in the L435F hCSs. These findings also support our IHC data suggesting that L435F progenitors are staying cycling as progenitors rather than differentiating into post-mitotic neurons. Taken together, these data suggest that the PSEN1 L435F mutation is increasing γ-secretase activity during neurodevelopment, associated with increased Notch signaling and subsequent reduction in neuronal differentiation.
Figure 4.

PSEN1 L435F increases Notch signaling
(A) Western blot results of NICD and Notch1 in male control and PSEN1 L435F hCSs at 30 DIV. GAPDH is used as a loading control. Image depicts three independent hCS replicates on one gel.
(B) Quantification of western blot results graphed as the ratio of NICD/Notch1. N = 6 independent replicates; 50 μg protein from 4 pooled hCSs per replicate. p value result of unpaired t test and Cohen’s d effect size are displayed.
(C) qRT-PCR results of Notch target gene expression in male hCSs. N = 5 independent replicates; 500 ng of RNA from 4 pooled hCSs per experiment.
(D) RNAScope images of PAX6, HES1, and DAPI at 30 DIV in male hCSs. Scale bars, 500 and 25 μm (inset).
(E) Quantification of PAX6+ and HES1+ cells, graphed as the ratio of mRNA to DAPI expression, and the colocalization of PAX6 and HES1. N = 3 hCSs.
(F) RNAScope images of TUBB3, HES1, and DAPI at 30 DIV.
(G) Quantification of TUBB3+ and HES1+ cells, graphed as the ratio of mRNA to DAPI expression, and the colocalization of TUBB3 and HES1. N = 3 hCSs. Data are presented as mean ± SEM. p values from unpaired t tests and Cohen’s d are displayed.
Notch1 cleavage inhibition, but not β-secretase inhibition, affects PSEN1 L435F hCS area and morphology
To further support that PSEN1 L435F specifically affects Notch signaling during neurodevelopment, male control and L435F hCSs were treated with a Notch1 cleavage-specific inhibitor Crenigacestat (CREN), or the β-secretase inhibitor LY-2886721 (BSI), or vehicle control DMSO (Figure 5B). CREN specifically inhibits the release of NICD by binding to the Notch1 receptor and subsequently blocking its cleavage, reducing NICD levels and HES1 expression (Mancarella et al., 2020) (Figures S6A and S6B). hCSs were treated with these factors beginning at 6 DIV, immediately following the neural induction phase of culture, ensuring that the hCSs were patterned to a neural fate before inhibiting pathways crucial for neurodevelopment, and were treated until 30 DIV (Figures 5A and S6C). Bright-field images of hCSs were taken at 30 DIV (Figure 5C). At 30 DIV, the Notch1 inhibitor CREN significantly reduced the area of both control and L435F hCSs compared with their individual vehicle controls (Figures 5C and 5D). The addition of BSI hCSs did not affect the area of either the control or L435F hCSs (Figures 5C and 5D). Interestingly, at 30 DIV, the addition of CREN to the hCSs abolished the L435F’s distinguished morphology, as seen by no change in circularity compared with the hCSs treated with vehicle, whereas the presence of BSI did not affect the morphology (Figures 5C and 5D). The general γ-secretase inhibitor, DAPT, was added to separate hCSs at the same timeline. Similar to CREN, DAPT reduced the size and rescued the morphology of the L435F hCSs (Figures S6D and S6E). Taken together, these data suggest that the size and morphology differences caused by the PSEN1 L435F mutation are due to altered Notch1 cleavage and subsequent signaling through γ-secretase.
Figure 5.

Notch inhibitors affect PSEN1 L435F hCS growth and cell types
(A) Schematic of timeline of treatment during hCS differentiation.
(B) Table of factors used.
(C) Representative bright-field images of male hCSs at 30 DIV. Scale bar, 500 μm.
(D) Quantification of hCS area and circularity at 30 DIV in presence of factors listed in (B). N = 15 hCSs from 4 independent replicates.
(E) Representative IHC images of PAX6 and DAPI in male hCSs at 30 DIV in the presence of vehicle or CREN. Scale bars, is 250 and 25 μm (inset).
(F) Quantification of PAX6 in male hCSs at 30 DIV.
(G) Quantification of PAX6+ VZs at 30 DIV. N = 12 hCSs per group from 4 independent replicates. Data are presented as mean ± SEM. ∗p < 0.05, ∗∗p < 0.01, ∗∗∗p < 0.001, ∗∗∗∗p < 0.0001; ns, not significant; p > 0.05 from two-way ANOVA.
Notch1 cleavage inhibition rescues neural progenitor and neuronal differentiation defects in PSEN1 L435F hCSs
Due to the rescue in size and morphology as a result of Notch1 inhibition, we then determined the effects of Notch signaling inhibition in neuronal differentiation. Control and L435F hCSs were treated with CREN from 6 to 30 DIV and assessed for amounts of PAX6+ neural progenitors at 30 DIV (Figure 5A). At 30 DIV, immediately following treatment, L435F hCSs treated with vehicle showed significantly increased PAX6+ neural progenitors, similar to that shown previously (Figures 5E and 5F). Treatment with CREN did not affect progenitors in control hCSs but decreased progenitors in L435F hCSs to levels comparable with control hCSs (Figures 5E and 5F). Interestingly, CREN reduced VZs in both control and L435F hCSs (Figure 5G). These data suggest that treatment of L435F hCSs with the Notch1-specific inhibitor CREN was able to rescue the differences in neuronal differentiation seen and further supports that the PSEN1 L435F mutation is increasing Notch signaling. Because CREN may have multiple targets during early stages of development, such as an associated change in Notch signaling, treatment during development could override the PSEN1 L435F mutation through indirect effects. We then treated hCSs with CB-103, an inhibitor of the CSL-NICD complex (Figure S6F) (Lehal et al., 2020). CB-103 was added to independent hCSs during the same timeline as previous CREN treatment and rescued the size, but not morphology, of the L435F hCSs at 30 DIV (Figure S6G). CB-103 treatment also rescued the increased number of VZs, but not the PAX6 expression at 30 DIV in the L435F hCSs (Figure S6H). Taken together, these findings are consistent with the PSEN1 L435F mutation affecting early development through increased Notch signaling, although there could be Notch-independent mechanisms.
PSEN1 L435F affects Aβ neuropathology
Previous reports of iPSC-derived cortical neurons harboring the PSEN1 L435F mutation show increased levels of Aβ43 and Aβ42/40 ratios and increased tau pathology similar to that seen in human brains (Oakley et al., 2020, 2021). To determine if the PSEN1 L435F mutation also affects AD-related neuropathology in the hCS model, we first analyzed total Aβ levels through IHC analysis in control and L435F hCSs at 180 DIV. We found that, at 180 DIV, the L435F hCSs show a trend toward increased total levels of Aβ (Figures 6A and 6B). To determine the specific Aβ peptides that were increasing, we performed enzyme-linked immunosorbent assay (ELISA) analysis of hCS supernatant culture medium at 175 DIV. We found no change in Aβ40, but a significant increase in Aβ42 levels as well as a significant increase in Aβ43 levels in L435F hCSs (Figure 6C). This also resulted in significantly increased ratios of Aβ42/40 and Aβ43/40 (Figure 6D). We then sought to determine if this increased Aβ would result in aggregation in the hCSs. We performed thioflavin-S staining, a marker of aggregated Aβ (Bussière et al., 2004), in hCSs at 180 DIV and found no differences in thioflavin-S expression (Figure S7). This supports previously known human data that there are increased Aβ levels in CSF of AD patients before cognitive decline or Aβ aggregation by PET scans (Foster et al., 2018; Kennedy et al., 2012; Fuller et al., 2019; Gatchel et al., 2019; Quiroz et al., 2015). Taken together, our data support a developmental role of the PSEN1 L435F mutation, showing changes in Aβ expression during cortical brain development, occurring long before patient symptom manifestation.
Figure 6.

PSEN1 L435F affects AD-related pathology
(A) Representative IHC of Aβ, MAP2, and GFAP at 180 DIV in male control and PSEN1 L435F hCSs. Scale bars, 250 and 25 μm (inset).
(B) Quantification of Aβ IHC at 180 DIV. N = 9–12 hCSs from 4 independent replicates.
(C) ELISA results of Aβ40, Aβ 42, and Aβ 43 at 175 DIV in hCS medium.
(D) Ratios of Aβ42/40 and Aβ43/40 from ELISA. N = 9 hCSs from 3 independent replicates of hCSs. p values from individual t tests and effect sizes are displayed. Data are presented as mean ± SEM.
PSEN1 L435F reduced extracellular neuronal activity
To determine if our findings of increased Aβ expression and decrease in neuronal levels at 180 DIV has an effect on neuronal activity, we used the multi-electrode array (MEA) to record extracellular activity of 180–190 DIV hCSs, as previous studies have showed altered neuronal activity in AD (Foster et al., 2018; Kennedy et al., 2012; Ghatak et al., 2019) (Figure 7A). Extracellular activity was measured in control and L435F hCSs at baseline, and the L435F hCSs showed significantly reduced activity (Figure 7B). To promote neuronal activity, hCSs were treated with KCl, as KCl has been shown to depolarize neurons and increase activity (Ismael et al., 2021). After treatment with KCl, we found the L435F hCSs continued to show reduced levels of extracellular activity (Figure 7B). These data suggest that the reduction in neuronal differentiation seen by reduced neuronal expression at this time point, caused by increased Notch signaling, results in decreased neuronal activity. Taken together, the PSEN1 L435F mutation affects AD-related neuropathology by increasing amyloid levels and decreasing extracellular neuronal activity.
Figure 7.

PSEN1 L435F reduces extracellular activity
(A) Experimental schematic for MEA recordings and analysis from male control and PSEN1 L435F hCSs at 180–190 DIV.
(B) MEA results from hCSs displayed as spikes/10-min recording. Baseline is average of two 10-min recordings, all others are one 10-min recording. N = 19 hCSs from 3 individual replicates. p values from individual t tests and effect sizes are displayed. Data are presented as mean ± SEM.
Discussion
The findings we report suggest that the PSEN1 L435F mutation causes increased γ-secretase activity in relation to Notch signaling during hCS development. This is supported by an early increase in neural progenitors and VZs and a persisting reduction in post-mitotic neurons, resulting in a distinct prolonged morphological change in PSEN1 L435F hCSs. This is the result of increased Notch signaling by increased γ-secretase activity, as a Notch1 cleavage-specific inhibitor, a CSL-NICD complex inhibitor, and a γ-secretase inhibitor rescued these findings. We also report the PSEN1 L435F mutation alters AD-related neuropathology, including an increase in Aβ42 and Aβ43 and reduced extracellular activity. The early and transient treatment of the Notch1 cleavage inhibitor was not sufficient to rescue the later Aβ43 increases, suggesting there are specific treatment windows to rescue the alterations in neurodevelopment and AD pathology (data not shown). These findings imply that the PSEN1 L435F mutation can affect neurodevelopment at an early stage as well as later stage AD pathology, providing a new insight into the cellular causes of AD.
The results of our findings suggest that the PSEN1 L435F heterozygous mutation can alter neurodevelopment that precedes AD-related pathology and can be reversed at an early time point using specific Notch1 inhibitors. This provides an earlier time point for treating the causes rather than the consequences of AD. Our hCSs carrying the PSEN1 L435F, M146L, or D385A mutation all show an early increase in size compared with control hCSs. This is consistent with previous reports of AD-related mutation carriers. A large cross-sectional study of the PSEN1 E280A kindred revealed an increase in gray matter volume in children 9–17 years old carrying this mutation 24–36 years before the onset of mild cognitive impairment (MCI) and fAD, as well as increased Aβ42 plasma levels at this age (Fuller et al., 2019; Gatchel et al., 2019; Quiroz et al., 2015). Other reports of older age groups (32–55 years old) showed increased cortical thickness in carriers of PSEN1 L286P, M139T, or K293N (Fortea et al., 2010). In addition, studies of infants carrying the risk allele for late-onset AD, APOE4, showed increased gray matter volume in frontal cortical regions in infants aged 6–22 months, and even as early as 1–3 months, long before any clinical symptoms of MCI or AD manifest (Dean et al., 2014). These reports, together with our data, suggest that neuroanatomical changes during development precede the onset of AD symptoms. Further studies are needed to determine the role of these increased structures in AD progression. In addition, altered Notch signaling has been implicated in neurodevelopment and schizophrenia and bipolar disorder, further implicating the role of altered Notch signaling affecting proper neurodevelopment and subsequent neurological disorders (Hoseth et al., 2018).
To our knowledge, Notch signaling or neurodevelopmental mechanisms have not been studied in a human cell-based model carrying the PSEN1 L435F mutation. Previous studies using mice with homozygous PSEN1 L435F show a loss of NICD, while rats with homozygous PSEN1 L435F show no change in Notch target gene expression (Xia et al., 2015; Tambini and D'Adamio, 2020). Here, using hCSs, we found a slight increase in NICD and significant increase in Notch target gene expression. This may be a result of the hCS model we chose. There is an expanded progenitor pool in the human cortex as compared with the rodent, which also may account for why PSEN1 knockout and homozygous mutations are perinatally lethal in mouse models but heterozygous PSEN1 mutations’ effects go unnoticed in developing humans. hCSs also provide a 3D structure similar to the microenvironment of the developing human cortex, with great cell diversity and increased cell-cell contact (Kelava and Lancaster, 2016). This cell-cell contact is necessary for Notch signaling to occur, which may help offer explanation into why we see increased Notch signaling and subsequent reduction in neuronal differentiation in the hCS model. hCSs do show great variability in batch-to-batch differences, but still provide a useful model for determining cell-type expression. Previous studies of the PSEN1 L435F mutation have also shown no change in AD-related pathology in postnatal day 15 rat brains, suggesting that AD-related pathology occurs later in life and does not play a role in the development of the cortex (Tambini and D'Adamio, 2020). In addition to producing the longer Aβ43, iPSC-derived neurons carrying the PSEN1 L435F mutation have been shown to display increased tau phosphorylation and seeding, another key pathology of fAD, demonstrating that iPSC-derived cells have the means to reproduce AD-related pathology (Oakley et al., 2021). Future studies will focus on determining the role of AD-related pathology on PSEN1 L435F hCS development and maturation.
Although there have been over 300 mutations identified in PSEN1 that cause fAD, each individual mutation may not all act in the same manner to result in fAD, and there may be species-dependent and substrate-dependent effects in different PSEN1 mutations. Rodent and iPSC models report differences in APP processing in the presence of the L435F mutation. All models report the production of the longer, potentially more pathogenic Aβ43; rodent models report a significant reduction in both Aβ42 and Aβ40 levels, while iPSC-derived neurons show no change. Here, we show that the PSEN1 L435F hCSs produce increased levels of Aβ42 and Aβ43, with no change in Aβ40. In contrast, the PSEN1 M146L mutation has been shown to increase the Aβ42/40 ratio by decreasing the production of both Aβ42 and Aβ40. Here, we find that there also is an increase in the Aβ42/40 ratio in the PSEN1 L435F hCSs, but this is a result of increasing Aβ42 production without affecting Aβ40 production. While Notch signaling has not been studied in a human model carrying the L435F mutation, a previous report of iPSC-derived neurons and progenitors reported a reduction of NICD when pooling five different PSEN1 mutations, and this resulted in premature neuronal differentiation (Arber et al., 2021; Yang et al., 2017). Here, we show that, in hCSs, the PSEN1 L435F mutation causes a slight increase in NICD and a significant increase in Notch target gene expression, resulting in decreased neuronal differentiation. Increased PAX6 was seen in both male and female hCSs; female hCSs showed significant increase in VZs and strong trend toward increased PAX6, but did not reach significance as the male did, which can be accounted for by the lower sample size used. In addition, the hCSs we generated harboring the PSEN1 M146L or PSEN1 D385A mutations did not show the altered morphology, increased PAX6 expression, or altered Notch target gene expression at 30 DIV as the hCSs harboring the PSEN1 L435F mutation did. The PSEN1 M146L mutation did increase HES1 mRNA expression, but this could be through a Notch-independent mechanism, as HEY1 and FABP7 mRNA expression were unaffected. In addition, γ-secretase cleaves many transmembrane proteins, including β-catenin, providing alternative mechanisms for the increased areas in the PSEN1 M146L and D385A hCSs (Lee and Ch’ng, 2020). Together, our data suggest that, although all PSEN1 mutations result in AD diagnosis, the mechanism by which they cause AD may not all be the same. This is crucial when attempting to treat the causes of AD; specific therapeutics must be administered according to an individual’s specific genetic makeup to best treat or prevent AD.
Hyperactivity has greatly been associated with preclinical AD. However, it has been reported in cognitively normal adults that there is hypoactivity as a result of increased Aβ burden, independent of age. Previous studies have reported a quadratic relationship of Aβ burden and BOLD activation in healthy adults ranging from 31 to 89 years old, where slightly elevated Aβ burden is associated with hyperactivation and better performance on a memory encoding task, while the higher Aβ burden is associated with hypoactivation and poorer task performance across the lifespan (Foster et al., 2018; Kennedy et al., 2012). Our findings report a decrease in extracellular activity in 6-month-old PSEN1 L435F hCSs as well as an increase in both Aβ42 and Aβ43, which supports these findings. Our finding of reduced MEA activity may be a result of the reduced neuronal expression at this time point; future studies using single-cell electrophysiology to determine individual neuronal activity and network analysis. Contrary to our findings, iPSC-derived neurons and cortical organoids harboring the PSEN1 M146V mutation show increased Aβ in culture medium, but an increase in activity in 2D neurons via whole-cell patch clamp and in 6-week-old 3D cortical organoids via the MEA (Ghatak et al., 2019). This may be mutation specific, as the PSEN1 L435F hCS activity has not previously been tested. It may also follow the clinical transition from hyperactivity during preclinical AD to hypoactivity following the manifestation of AD pathology in human brains. Previous studies found increased activity in 6-week-old hCSs, and we found decreased activity in 6-month-old hCSs. Future studies are needed to determine any age-related activity differences in the hCS model. Our current data support the hCS model for AD-related neuropathology.
In summary, we find that, in heterozygous PSEN1 L435F hCSs, there are deficits in neuronal differentiation caused by dysregulated Notch signaling at an early stage in neurodevelopment. We show an early reduction in neurons and an increase in cortical volume many years before any behavioral symptoms would manifest. This may provide a potential therapeutic target for innervation and stopping AD before it begins, treating the causes rather than the consequences of AD.
Experimental procedures
Resource availability
Corresponding author
Further information and requests for resources and reagents should be directed to and will be fulfilled by the corresponding author, Jenny Hsieh (jenny.hsieh@utsa.edu).
Materials availability
This study did not generate new unique reagents. Materials are listed in experimental procedures, supplemental information, and can be requested from the corresponding author.
Experimental methods
CRISPR-Cas9 gene-editing and characterization of iPSCs
Isogenic iPSCs were used in this study; heterozygous point mutations were generated using CRISPR-Cas9 at Rutgers University by Inifinity BiologiX (https://ibx.bio/services/). One male isogenic line was used for all studies, and one female isogenic line was used for experiments in Figures S1–S4. The CRISPR controls were gene edited without a specific guide RNA. iPSCs were confirmed for genotype, pluripotency, and karyotype. iPSCs were cultured on six-well tissue culture-treated plates (Corning) coated with Matrigel (Corning), maintained with daily mTeSR1 (STEMCELL Technologies) medium changes, and were passaged using Versene (Gibco) and mTesR supplemented with ROCK1 inhibitor (Selleck Chemicals) for maintenance.
hCS culture
hCSs were generated using previously described methods (Amin and Pasca, 2018; Birey et al., 2017). Full culture conditions and medium formulations can be found in supplemental information.
hCS area and circularity analysis
Bright-field images of hCSs were taken on either a Leica fluorescent microscope or a Nikon TS100 Phase Optics microscope at 14–365 DIV. Areas were analyzed using Fiji by ImageJ. The outer border of the hCS was traced, and the area and perimeter were measured for each spheroid. Circularity was measured using 4∗Π∗area/perimeter2 for each hCS. Data were analyzed using GraphPad Prism 8 software and presented as mean ± SEM.
IHC
IHC conditions and antibodies can be found in the supplemental information. Imaging was performed using a Leica SPE-II or Zeiss LSM 710 confocal microscope. Image analysis was performed using Fiji/ImageJ. Three to four hCSs sections were imaged, analyzed, and averaged per hCS; each dot on a graph represents the average of the three to four sections. Data are presented as %area of marker divided by the area of DAPI. VZs are defined as a PAX6+ round tubular region; VZs were counted per section and three to four sections were averaged per hCS.
Western blot analysis
Four hCSs were pooled for protein at each time point and measured using BCA analysis. Membranes were imaged on a Bio-Rad ChemiDoc MP Imager and quantified using the Bio-Rad Image Lab 6.1 software. Results were graphed using GraphPad Prism 8 as the ratio of NICD to full-length Notch1 after being normalized to their individual GAPDH loading control expression. Full western blot protocol can be found in the supplemental information.
RNAScope and quantification
hCSs were processed as described for IHC. RNAScope was performed according to the manufacturer’s protocol, with antigen retrieval (ACDBio). Human probes were custom-made by ACDBio for PAX6, TUBB3, and HES1 mRNA. After RNAScope was performed, sections were immediately imaged or stored dried overnight in the dark at 4°C and imaged the following day. Imaging was performed using a Leica SPE-II confocal microscope at 20× tile scan. One section from three independent hCSs were imaged and analyzed. Quantification was performed using CellProfiler, modified for use. Data were reported as the ratio of target mRNA to DAPI expression.
qRT-PCR
Four hCSs were harvested at 30 DIV into 1 mL of TRIzol and frozen at −80°C until RNA extraction took place. RNA extraction was performed using the RNeasy Micro Kit (QIAGEN). After final elution, RNA was measured using NanoDrop and three measurements were averaged per sample. A total of 500 ng of RNA was reverse transcribed into cDNA using SuperScript VILO MasterMix (Invitrogen) and stored at 4°C until used for qPCR. Primers used are listed in Figure S5C qPCR was performed in triplicate using PowerUp SYBR Green (Thermo Fisher Scientific). Conditions are listed in the supplemental information. CT values were analyzed and reported as delta CT compared with individual GAPDH.
Inhibitor treatment
Control and PSEN1 L435F hCSs were treated for 24 days beginning on the 6 day of culture. Factors used are as follows: Crenigacestat (CREN, Selleck Chemicals); LY-2886721 (BSI, Selelck Chemicals); CB-103 (Selleck Chemicals), and DMSO (Millipore Sigma). CREN and BSI were diluted in DMSO to 100 mM and CB-103 to 50 mM before being diluted further in hCS medium to the used concentrations. Factors were added to the specific medium required for the time point following the protocol used for hCS culture. Fresh factors were added with each medium change.
MEA
Six-month hCSs were plated on a 24-well MEA plate (Harvard MCS Multiwell-MEA-system) that had been coated in poly-ornithane overnight and laminin for 5 h. hCSs were incubated on plates overnight and read the following day. Two 10-min recordings were averaged for the baseline recording. One microliter of 10 mM KCl was added to each well immediately before 10-min recording. A 2-min pause occurred followed by an additional 1 μL KCl addition and 10-min recording. After waiting 10 min, another 10-min recording was performed. Only electrodes in which an hCS was touching were analyzed. High-pass and low-pass filters of five standard deviations of the mean were used to filter the spike recordings for each 10-min recording session. Spikes per 10-min recording were graphed for each hCS using GraphPad Prism 8 software.
ELISA
ELISAs were run according to the manufacturer’s instructions. At 175 DIV hCS medium was removed from culture medium 3 days following the previous medium change and individually stored at −80°C until use. Total protein amounts were measured from thawed culture medium using the Pierce BCA Protein Assay Kit (Thermo Fisher Scientific). BCA was read at 562 nm and quantified using the standard curve. Medium was diluted 1:2 for Aβ40 and Aβ42 and undiluted for Aβ43. ELISA plates were read at 450 nm using Promega Glomax Explorer. Expression levels were quantified using the standard curve, normalized to their individual protein expression from BCA results, and graphed using GraphPad Prism 8 software. Detection kits used were as follows: human Aβ1-40 (Fujifilm-WAKO 298–64601), human Aβ1-42 (Fujifilm-WAKO 298–62401), and human Aβ1-43 (Immuno-Biological Laboratories America 27710).
Statistical analysis
All data are presented as mean ± SEM. Statistical analyses were carried out using GraphPad Prism 8 software and p values are reported. Outlier tests were conducted for each analysis using GraphPad Prism 8 software. Cohen’s d effect sizes were calculated using mean and standard deviation online at https://www.psychometrica.de/effect_size.html. Each N is one individual hCS.
Author contributions
E.M.H., R.D., and J.H. conceived and designed the experiments. P.M. and R.D. provided the CRISPR-edited iPSC lines. E.M.H. performed the experiments, analyzed the data, and wrote the manuscript. J.H. edited the manuscript and provided financial support.
Acknowledgments
This work was supported by NIH grants U01DA054170, R01NS113516, and R21AG066496 (to J.H.) and R01AG062475 (to R.D.), the Robert J. Kleberg, Jr. and Helen C. Kleberg Foundation (to J.H.), the Semmes Foundation, Inc. (to J.H.) and the Alzheimer's Association AARG-NTF-220-971669 (to J.H.). We would like to thank Truman Gamblin, Melanie Carless, and Hyoung-gon Lee for use of reagents and equipment, and for providing helpful advice. We would like to thank Gary Gaufo for confocal use. We would also like to thank Nikolas Merlock for help with analyzing RNAscope data. Some figures were created with BioRender.com.
Conflict of interests
The authors declare no competing interests.
Published: June 22, 2023
Footnotes
Supplemental information can be found online at https://doi.org/10.1016/j.stemcr.2023.05.018.
Supplemental information
Data and code availability
Data can be requested from the corresponding author.
References
- Alzheimer's disease facts and figures. Alzheimers Dement. 2022;18:700–789. doi: 10.1002/alz.12638. [DOI] [PubMed] [Google Scholar]
- Amin N.D., Paşca S.P. Building models of brain disorders with three-dimensional organoids. Neuron. 2018;100:389–405. doi: 10.1016/j.neuron.2018.10.007. [DOI] [PubMed] [Google Scholar]
- Arber C., Lovejoy C., Harris L., Willumsen N., Alatza A., Casey J.M., Lines G., Kerins C., Mueller A.K., Zetterberg H., et al. Familial Alzheimer's disease mutations in PSEN1 Lead to premature human stem cell neurogenesis. Cell Rep. 2021;34:108615. doi: 10.1016/j.celrep.2020.108615. [DOI] [PMC free article] [PubMed] [Google Scholar]
- Bekris L.M., Yu C.E., Bird T.D., Tsuang D.W. Genetics of Alzheimer disease. J. Geriatr. Psychiatry Neurol. 2010;23:213–227. doi: 10.1177/0891988710383571. [DOI] [PMC free article] [PubMed] [Google Scholar]
- Birey F., Andersen J., Makinson C.D., Islam S., Wei W., Huber N., Fan H.C., Metzler K.R.C., Panagiotakos G., Thom N., et al. Assembly of functionally integrated human forebrain spheroids. Nature. 2017;545:54–59. doi: 10.1038/nature22330. [DOI] [PMC free article] [PubMed] [Google Scholar]
- Bussière T., Bard F., Barbour R., Grajeda H., Guido T., Khan K., Schenk D., Games D., Seubert P., Buttini M. Morphological characterization of Thioflavin-S-positive amyloid plaques in transgenic Alzheimer mice and effect of passive Abeta immunotherapy on their clearance. Am. J. Pathol. 2004;165:987–995. doi: 10.1016/s0002-9440(10)63360-3. [DOI] [PMC free article] [PubMed] [Google Scholar]
- Cau E., Blader P. Notch activity in the nervous system: to switch or not switch? Neural Dev. 2009;4:36. doi: 10.1186/1749-8104-4-36. [DOI] [PMC free article] [PubMed] [Google Scholar]
- De Strooper B., Annaert W., Cupers P., Saftig P., Craessaerts K., Mumm J.S., Schroeter E.H., Schrijvers V., Wolfe M.S., Ray W.J., et al. A presenilin-1-dependent gamma-secretase-like protease mediates release of Notch intracellular domain. Nature. 1999;398:518–522. doi: 10.1038/19083. [DOI] [PubMed] [Google Scholar]
- De Strooper B., Iwatsubo T., Wolfe M.S. Presenilins and gamma-secretase: structure, function, and role in Alzheimer Disease. Cold Spring Harb. Perspect. Med. 2012;2:a006304. doi: 10.1101/cshperspect.a006304. [DOI] [PMC free article] [PubMed] [Google Scholar]
- Dean D.C., 3rd, Jerskey B.A., Chen K., Protas H., Thiyyagura P., Roontiva A., O'muircheartaigh J., Dirks H., Waskiewicz N., Lehman K., et al. Brain differences in infants at differential genetic risk for late-onset Alzheimer disease: a cross-sectional imaging study. JAMA Neurol. 2014;71:11–22. doi: 10.1001/jamaneurol.2013.4544. [DOI] [PMC free article] [PubMed] [Google Scholar]
- Fortea J., Sala-Llonch R., Bartrés-Faz D., Bosch B., Lladó A., Bargalló N., Molinuevo J.L., Sánchez-Valle R. Increased cortical thickness and caudate volume precede atrophy in PSEN1 mutation carriers. J. Alzheimers Dis. 2010;22:909–922. doi: 10.3233/JAD-2010-100678. [DOI] [PubMed] [Google Scholar]
- Foster C.M., Kennedy K.M., Horn M.M., Hoagey D.A., Rodrigue K.M. Both hyper- and hypo-activation to cognitive challenge are associated with increased beta-amyloid deposition in healthy aging: a nonlinear effect. Neuroimage. 2018;166:285–292. doi: 10.1016/j.neuroimage.2017.10.068. [DOI] [PMC free article] [PubMed] [Google Scholar]
- Fuller J.T., Cronin-Golomb A., Gatchel J.R., Norton D.J., Guzmán-Vélez E., Jacobs H.I.L., Hanseeuw B., Pardilla-Delgado E., Artola A., Baena A., et al. Biological and cognitive markers of Presenilin1 E280A autosomal dominant Alzheimer's disease: a Comprehensive Review of the Colombian kindred. J. Prev. Alzheimers Dis. 2019;6:112–120. doi: 10.14283/jpad.2019.6. [DOI] [PMC free article] [PubMed] [Google Scholar]
- Gatchel J.R., Lopera F., Norton D.J., Baena A., Guzman-Velez E., Sanchez J.S., D'oleire Uquillas F., Schultz A., Vannini P., Artola A., et al. Association of subjective cognitive decline with markers of brain pathology in preclinical autosomal dominant Alzheimer's disease. J. Neurol. Neurosurg. Psychiatry. 2019;91:330–332. doi: 10.1136/jnnp-2019-321205. [DOI] [PMC free article] [PubMed] [Google Scholar]
- Ghatak S., Dolatabadi N., Trudler D., Zhang X., Wu Y., Mohata M., Ambasudhan R., Talantova M., Lipton S.A. Mechanisms of hyperexcitability in Alzheimer's disease hiPSC-derived neurons and cerebral organoids vs isogenic controls. Elife. 2019;8:e50333. doi: 10.7554/eLife.50333. [DOI] [PMC free article] [PubMed] [Google Scholar]
- Haass C., Selkoe D.J. Cellular processing of beta-amyloid precursor protein and the genesis of amyloid beta-peptide. Cell. 1993;75:1039–1042. doi: 10.1016/0092-8674(93)90312-e. [DOI] [PubMed] [Google Scholar]
- Handler M., Yang X., Shen J. Presenilin-1 regulates neuronal differentiation during neurogenesis. Development. 2000;127:2593–2606. doi: 10.1242/dev.127.12.2593. [DOI] [PubMed] [Google Scholar]
- Hoseth E.Z., Krull F., Dieset I., Mørch R.H., Hope S., Gardsjord E.S., Steen N.E., Melle I., Brattbakk H.R., Steen V.M., et al. Attenuated Notch signaling in schizophrenia and bipolar disorder. Sci. Rep. 2018;8:5349. doi: 10.1038/s41598-018-23703-w. [DOI] [PMC free article] [PubMed] [Google Scholar]
- Ismael S., Sindi G., Colvin R.A., Lee D. Activity-dependent release of phosphorylated human tau from Drosophila neurons in primary culture. J. Biol. Chem. 2021;297:101108. doi: 10.1016/j.jbc.2021.101108. [DOI] [PMC free article] [PubMed] [Google Scholar]
- Kelava I., Lancaster M.A. Stem cell models of human brain development. Cell Stem Cell. 2016;18:736–748. doi: 10.1016/j.stem.2016.05.022. [DOI] [PubMed] [Google Scholar]
- Kennedy K.M., Rodrigue K.M., Devous M.D., Sr., Hebrank A.C., Bischof G.N., Park D.C. Effects of beta-amyloid accumulation on neural function during encoding across the adult lifespan. Neuroimage. 2012;62:1–8. doi: 10.1016/j.neuroimage.2012.03.077. [DOI] [PMC free article] [PubMed] [Google Scholar]
- Kim H., Ki H., Park H.S., Kim K. Presenilin-1 D257A and D385A mutants fail to cleave Notch in their endoproteolyzed forms, but only presenilin-1 D385A mutant can restore its gamma-secretase activity with the compensatory overexpression of normal C-terminal fragment. J. Biol. Chem. 2005;280:22462–22472. doi: 10.1074/jbc.M502769200. [DOI] [PubMed] [Google Scholar]
- Lasky J.L., Wu H. Notch signaling, brain development, and human disease. Pediatr. Res. 2005;57:104R–109R. doi: 10.1203/01.PDR.0000159632.70510.3D. [DOI] [PubMed] [Google Scholar]
- Lee Y.J., Ch'ng T.H. RIP at the Synapse and the role of intracellular domains in neurons. Neuromolecular Med. 2020;22:1–24. doi: 10.1007/s12017-019-08556-4. [DOI] [PubMed] [Google Scholar]
- Lehal R., Zaric J., Vigolo M., Urech C., Frismantas V., Zangger N., Cao L., Berger A., Chicote I., Loubéry S., et al. Pharmacological disruption of the Notch transcription factor complex. Proc. Natl. Acad. Sci. USA. 2020;117:16292–16301. doi: 10.1073/pnas.1922606117. [DOI] [PMC free article] [PubMed] [Google Scholar]
- Liu Q., Waltz S., Woodruff G., Ouyang J., Israel M.A., Herrera C., Sarsoza F., Tanzi R.E., Koo E.H., Ringman J.M., et al. Effect of potent gamma-secretase modulator in human neurons derived from multiple presenilin 1-induced pluripotent stem cell mutant carriers. JAMA Neurol. 2014;71:1481–1489. doi: 10.1001/jamaneurol.2014.2482. [DOI] [PMC free article] [PubMed] [Google Scholar]
- Mancarella S., Serino G., Dituri F., Cigliano A., Ribback S., Wang J., Chen X., Calvisi D.F., Giannelli G. Crenigacestat, a selective NOTCH1 inhibitor, reduces intrahepatic cholangiocarcinoma progression by blocking VEGFA/DLL4/MMP13 axis. Cell Death Differ. 2020;27:2330–2343. doi: 10.1038/s41418-020-0505-4. [DOI] [PMC free article] [PubMed] [Google Scholar]
- Morelli L., Prat M.I., Levy E., Mangone C.A., Castaño E.M. Presenilin 1 Met146Leu variant due to an A -> T transversion in an early-onset familial Alzheimer's disease pedigree from Argentina. Clin. Genet. 1998;53:469–473. doi: 10.1111/j.1399-0004.1998.tb02597.x. [DOI] [PubMed] [Google Scholar]
- Oakley D.H., Chung M., Klickstein N., Commins C., Hyman B.T., Frosch M.P. The Alzheimer disease-causing presenilin-1 L435F mutation causes increased production of Soluble Abeta43 species in patient-derived iPSC-neurons, Closely Mimicking Matched patient brain tissue. J. Neuropathol. Exp. Neurol. 2020;79:592–604. doi: 10.1093/jnen/nlaa025. [DOI] [PMC free article] [PubMed] [Google Scholar]
- Oakley D.H., Klickstein N., Commins C., Chung M., Dujardin S., Bennett R.E., Hyman B.T., Frosch M.P. Continuous Monitoring of tau-induced Neurotoxicity in patient-derived iPSC-neurons. J. Neurosci. 2021;41:4335–4348. doi: 10.1523/JNEUROSCI.2590-20.2021. [DOI] [PMC free article] [PubMed] [Google Scholar]
- Quiroz Y.T., Schultz A.P., Chen K., Protas H.D., Brickhouse M., Fleisher A.S., Langbaum J.B., Thiyyagura P., Fagan A.M., Shah A.R., et al. Brain imaging and Blood Biomarker Abnormalities in children with autosomal dominant Alzheimer disease: a cross-sectional study. JAMA Neurol. 2015;72:912–919. doi: 10.1001/jamaneurol.2015.1099. [DOI] [PMC free article] [PubMed] [Google Scholar]
- Rogaeva E.A., Fafel K.C., Song Y.Q., Medeiros H., Sato C., Liang Y., Richard E., Rogaev E.I., Frommelt P., Sadovnick A.D., et al. Screening for PS1 mutations in a referral-based series of AD cases: 21 novel mutations. Neurology. 2001;57:621–625. doi: 10.1212/wnl.57.4.621. [DOI] [PubMed] [Google Scholar]
- Schrank S., Mcdaid J., Briggs C.A., Mustaly-Kalimi S., Brinks D., Houcek A., Singer O., Bottero V., Marr R.A., Stutzmann G.E. Human-induced neurons from presenilin 1 mutant patients model Aspects of Alzheimer's disease pathology. Int. J. Mol. Sci. 2020;21:1030. doi: 10.3390/ijms21031030. [DOI] [PMC free article] [PubMed] [Google Scholar]
- Selkoe D.J. Alzheimer's disease: genotypes, phenotypes, and treatments. Science. 1997;275:630–631. doi: 10.1126/science.275.5300.630. [DOI] [PubMed] [Google Scholar]
- Selkoe D.J. Alzheimer's disease: genes, proteins, and therapy. Physiol. Rev. 2001;81:741–766. doi: 10.1152/physrev.2001.81.2.741. [DOI] [PubMed] [Google Scholar]
- Shen J., Kelleher R.J. The presenilin hypothesis of Alzheimer's disease: evidence for a loss-of-function pathogenic mechanism. Proc. Natl. Acad. Sci. USA. 2007;104:403–409. doi: 10.1073/pnas.0608332104. [DOI] [PMC free article] [PubMed] [Google Scholar]
- Sproul A.A., Jacob S., Pre D., Kim S.H., Nestor M.W., Navarro-Sobrino M., Santa-Maria I., Zimmer M., Aubry S., Steele J.W., et al. Characterization and molecular profiling of PSEN1 familial Alzheimer's disease iPSC-derived neural progenitors. PLoS One. 2014;9:e84547. doi: 10.1371/journal.pone.0084547. [DOI] [PMC free article] [PubMed] [Google Scholar]
- Sueda R., Imayoshi I., Harima Y., Kageyama R. High Hes1 expression and resultant Ascl1 suppression regulate quiescent vs. active neural stem cells in the adult mouse brain. Genes Dev. 2019;33:511–523. doi: 10.1101/gad.323196.118. [DOI] [PMC free article] [PubMed] [Google Scholar]
- Sun L., Zhou R., Yang G., Shi Y. Analysis of 138 pathogenic mutations in presenilin-1 on the in vitro production of Abeta42 and Abeta40 peptides by gamma-secretase. Proc. Natl. Acad. Sci. USA. 2017;114:E476–E485. doi: 10.1073/pnas.1618657114. [DOI] [PMC free article] [PubMed] [Google Scholar]
- Tambini M.D., D'Adamio L. Knock-in rats with homozygous PSEN1(L435F) Alzheimer mutation are viable and show selective gamma-secretase activity loss causing low Abeta40/42 and high Abeta43. J. Biol. Chem. 2020;295:7442–7451. doi: 10.1074/jbc.RA120.012542. [DOI] [PMC free article] [PubMed] [Google Scholar]
- Tong B.C.K., Lee C.S.K., Cheng W.H., Lai K.O., Foskett J.K., Cheung K.H. Familial Alzheimer's disease-associated presenilin 1 mutants promote gamma-secretase cleavage of STIM1 to impair store-operated Ca2+ entry. Sci. Signal. 2016;9:ra89. doi: 10.1126/scisignal.aaf1371. [DOI] [PMC free article] [PubMed] [Google Scholar]
- Wines-Samuelson M., Schulte E.C., Smith M.J., Aoki C., Liu X., Kelleher R.J., 3rd, Shen J. Characterization of age-dependent and progressive cortical neuronal degeneration in presenilin conditional mutant mice. PLoS One. 2010;5:e10195. doi: 10.1371/journal.pone.0010195. [DOI] [PMC free article] [PubMed] [Google Scholar]
- Xia D., Watanabe H., Wu B., Lee S.H., Li Y., Tsvetkov E., Bolshakov V.Y., Shen J., Kelleher R.J., 3rd Presenilin-1 knockin mice reveal loss-of-function mechanism for familial Alzheimer's disease. Neuron. 2015;85:967–981. doi: 10.1016/j.neuron.2015.02.010. [DOI] [PMC free article] [PubMed] [Google Scholar]
- Yang G., Zhou R., Zhou Q., Guo X., Yan C., Ke M., Lei J., Shi Y. Structural basis of Notch recognition by human gamma-secretase. Nature. 2019;565:192–197. doi: 10.1038/s41586-018-0813-8. [DOI] [PubMed] [Google Scholar]
- Yang J., Zhao H., Ma Y., Shi G., Song J., Tang Y., Li S., Li T., Liu N., Tang F., Gu J., Zhang L., Zhang Z., Zhang X., JIN Y., LE W. Early pathogenic event of Alzheimer's disease documented in iPSCs from patients with PSEN1 mutations. Oncotarget. 2017;8:7900–7913. doi: 10.18632/oncotarget.13776. [DOI] [PMC free article] [PubMed] [Google Scholar]
- Zhou R., Yang G., Guo X., Zhou Q., Lei J., Shi Y. Recognition of the amyloid precursor protein by human gamma-secretase. Science. 2019;363:eaaw0930. doi: 10.1126/science.aaw0930. [DOI] [PubMed] [Google Scholar]
Associated Data
This section collects any data citations, data availability statements, or supplementary materials included in this article.
Supplementary Materials
Data Availability Statement
Data can be requested from the corresponding author.