

Abstract
Background:
Nurse practitioners (NPs) are the largest group of providers delivering home-based primary care (HBPC) in the U.S. We examined the association of scope-of-practice regulations and NP-HBPC rates.
Methods:
Using Centers for Medicare and Medicaid Services Provider Utilization and Payment Data Public Use File (PUF) for 2019, we conducted a state-level analysis to examine the impact of scope-of-practice regulations on utilization of NP-HBPC. Healthcare Common Procedure Coding System (HCPCS) codes were used to identify the HBPC visits in private residences (99341–99345, 99347–99350) and domiciliary settings (99324–99328, 99334–99337). We used linear regression to compare NP-HBPC utilization rates between states of either restricted or reduced scope-of-practice laws to states with full scope-of-practice, adjusting for number of NP-HBPC providers, state ranking of total assisted living, the proportion of FFS Medicare beneficiaries and neighborhood-level socio-economic status and race and ethnicity.
Results:
Nearly half of NPs providing HBPC (46%; n=7151) were in states with restricted scope of practice regulations. Compared to states with full scope-of-practice, states with restricted or reduced scope-of-practice had higher adjusted rates of NP- HBPC per 1,000 FFS Medicare beneficiaries. The average level of utilization rate of NP- HBPC was 89.9, 63, and 49.1 visits, per 1000 FFS Medicare beneficiaries in states with restricted, reduced, and full- scope-of-practice laws, respectively. The rate of NP-HBPC visits were higher in states with restricted (Beta coefficient=0.92; 95%CI 0.13–1.72; p=0.023) and reduced scope-of-practice laws (Beta coefficient=0.91; 95%CI 0.03–1.79; p=0.043) compared to states with full scope-of-practice laws.
Conclusion:
Restricted state NP scope-of-practice regulations were associated with higher rates of fee-for-service Medicare NP-HBPC care delivery compared with full or reduced scope-of-practice. Understanding underlying mechanisms of how scope-of-practice affects NP-HBPC delivery could help to develop scope-of-practice regulations that improve access to HBPC for the underserved homebound population.
Keywords: Scope-of-practice, Medicare, Home Based Primary care, Nurse Practitioner, Aging
Introduction
Nurse practitioners (NPs), the fastest growing workforce of primary care providers in the U.S,1,2 are an integral component of the home-based primary care (HBPC) workforce.3–5 Growth in labor supply of NPs delivering HBPC accompany a concurrent increase in the homebound population,6,7primary care physician shortages,8,9 and a national shift towards community-based care.10 In a study using national claims data from 2012 to 2013, among physicians, NPs, and physician assistants who provided HBPC, almost 3,300 NPs made over 1.1 million home visits to Medicare fee-for-service beneficiaries.5 Between 2012 and 2016 the number of NPs providing HBPC nearly doubled in the U.S.11 More recent data from 2017 shows that 5899 NPs made 2.1 million visits compared to 1.9 million visits by 5704 physicians.12
Despite the expanding utilization of NP - HBPC, there are substantial barriers to NP delivery of HBPC. A commonly cited barrier is that restricted scope-of-practice are thought to reduce availability of NP HBPC.13–16 State scope-of-practice regulations stipulate the extent to which an NP can practice without physician oversight and vary by state. In some states, scope-of- practice regulations impose significant limitations on the services that a NP may provide. States with restricted scope-of- practice regulations require NPs to have “career - long supervision” by a physician while full scope-of-practice states allow NPs to practice without physician supervision.17 Such supervision requires physicians to conduct chart review of patients assigned to NPs, on-going communication with NPs about patient care, and supervised controlled substance prescribing.
Most evidence about the impact of scope-of-practice regulations is focused on NP care in ambulatory or inpatient settings, and shows that full scope-of-practice policies increase access to NP care particularly for low income adults with greater shortage of primary care clinicians, and rural residents18–22 These findings may not be generalizable to care provided in a patient’s home environment. Access to HBPC is particularly important for homebound older adults because of its associations with fewer hospitalizations/emergency room visits,4,23 higher rates of advance care planning,24 and coordinated care required to enable homebound adults remain in their own homes and out of nursing home settings.25 With the NP workforce expected to nearly double in upcoming years,2,26 and states progressively expanding NP scope-of-practice regulations to allow NPs to care for patients without physician oversight,27 the growing numbers of NPs may be deployed to meet this growing demand for HBPC. Yet, little research has examined the impact of scope-of-practice regulations on the delivery of HBPC.
Only 12% of homebound older adults currently access HBPC, which may be in part due to lack of HBPC workforce.7 Strategies to ensure adequate NP workforce to meet the demands for HBPC require an understanding of state-level barriers that may impact access to NP- HBPC. To understand the relationship between states’ scope-of-practice regulations and the utilization of NP-HBPC, we analyzed variation in state scope-of-practice regulations for nurse practitioners in all 50 states. Using 2017 provider-level data, one study has shown that in states with restricted scope-of-practice regulations, compared to NPs, physicians and physician assistants had higher odds of providing HBPC.12 In the present study, we conducted an updated state-level analysis to examine the impact of NP scope-of-practice regulations on delivery of NP-HBPC and describe utilization of NP-HBPC by race, ethnicity, and socioeconomic conditions. We hypothesized that full scope-of-practice regulations would be associated with greater utilization of NP-HBPC.
Methods
Data Source and Sample
We used CMS Provider Utilization and Payment Data Public Use File (Physician and Other Supplier PUF) for the calendar year 2019. The provider PUF includes data on utilization, payment, and submitted charges for Medicare beneficiaries enrolled in the fee-for-service program organized by National Provider Identifier (NPI) and Healthcare Common Procedure Coding System (HCPCS) code. These data include physician claims activities such as utilization, payment, and place of service but not information about specific patients, as the PUF only reports on provider billings where greater than 11 beneficiaries per HCPCS were served.
Providers were identified by using the provider type variable included in the Physician and Other Supplier PUF and assigned to the State where their NPI was registered. Only NPs were included in the analysis. HCPCS codes were used to identify the HBPC visits to private residences (99341–99345, 99347–99350) and domiciliary settings (99324–99328, 99334–99337).22
Measures
Outcome variable. The outcome of interest was NP- HBPC utilization, calculated by dividing the sum of all NP-HBPC visits for individual states by the state-level Medicare FFS population size. The state-level count of FFS population was obtained from the Geographic Variation PUF.28
Covariates. The main independent variable was State designation of NP scope-of-practice regulation, as classified according to the 2019 scope-of-practice regulation defined by the American Academy of Nurse Practitioners (AANP).29 This 3-level classification categorizes states as: (1) “full practice” whereby NPs have full and independent practice and prescriptive authority without physician supervision; (2) “reduced practice” which requires NPs to have collaborative agreement with physicians for at least one element of NP practice; and (3) “restricted practice,” where by career-long supervision, delegation, or team management by a physician is required in order for an NP to practice or prescribe.29
State-level indicators of socioeconomic status were grouped by state-level median household income obtained from the 2015 –19 American Community Survey (ACS): (<47999; $48,000-$60,999; $61,000-$81,999; and $82,000 or greater).27 ACS data were used to identify the proportion of patient population who were black, Hispanic, as well as the proportion of those living below the poverty line who were 65 years or older. A state-level indicator of assisted living options and residential care capacity was included using the 2019 long-term services and supports (LTSS) State Scorecard rankings of assisted living and residential care units per 1000 older adults served.30
Statistical analysis
Summary statistics were calculated of the number of all providers who had HBPC visits, NPs who provided HBPC visits, NP-HBPC utilization rate, as well as covariates using mean (standard deviation) and median for continuous variables and frequency and proportion for categorical variables. Summary statistics stratified by scope-of-practice categories(full/reduced/restricted) were also calculated. Linear regression was used to compare NP-HBPC utilization rate between states of either restricted or reduced scope-of-practice with full scope-of-practice states, with and without adjusting for the aforementioned state-level covariates. HBPC visits were log transformed to account for its skewed distribution. The analysis was conducted using SAS (v9.4) and R (V4.0.2).
Results
Table 1 depicts characteristics of NP-HBPC utilization rates by state scope-of-practice status. NPs represented 50% of the total HBPC providers (n=15,418). Twenty-three (45%) states were with full scope-of-practice, 16 (31%) were states with reduced scope-of-practice, and the remaining 12 (24%) were states with restricted scope-of-practice (Figure 1). Nearly half of HBPC-NPs (46%; n=7151) were located in restricted practice states, while the lowest number of NP-HBPC providers were located in states with full scope-of-practice regulations(18.9%; n=1467).
Table 1.
Summary characteristics of NP- HBPC utilization rates by scope-of-practice status.
| All | Full scope-of-practice (23; 45%) |
Reduced scope-of-practice (16; 31%) |
Restricted scope-of-practice (12; 24%) |
|
|---|---|---|---|---|
| Mean (SD) | Mean (SD) | Mean (SD) | Mean (SD) | |
| Overall HBPC | 63 (49.2) | 49.1 (50.7) | 63 (38.2) | 89.9 (51.6) |
| HBPC in private residences | 22.5 (25.8) | 15.4 (28.9) | 27.4 (24.2) | 29.5 (19.2) |
| HBPC in domiciliary settings | 40.5 (33.9) | 33.6 (33.7) | 35.6 (23.6) | 60.4 (40.5) |
| a Overall HBPC | 40.4 (3.3) | 24.5 (4.3) | 51.0 (2.0) | 77.3 (1.8) |
| a HBPC in private residences | 10.6 (5.0) | 4.6 (6.9) | 18.4 (2.7) | 25.0 (1.8) |
| a HBPC in domiciliary settings | 24.1 (4.3) | 15.2 (6.8) | 27.2 (2.3) | 49.1 (2.0) |
| b FFS population in 1000 | 648 (593.9) | 291.9 (221.4) | 718 (473.9) | 1237 (740.6) |
| c LTSS Scorecard rankings of assisted living and residential care units per 1000 older adults | 24.4 (14.1) | 18 (14; 13) | 30.5 (14.7) | 28.5 (7.8) |
| d State-level %Black population | 11.3 (10.7) | 6.6 (10.6; 3.3) | 14.7 (10.3) | 15.8 (7.9) |
| d State-level %Hispanic population | 11.9 (10.3) | 12.6 (11.1; 10.5) | 8.8 (5.9) | 14.6 (12.8) |
| State-level %population living below the poverty line who were 65+ years old | 1.4 (0.3) | 1.3 (0.3; 1.3) | 1.5 (0.4) | 1.5 (0.2) |
| d State-level median household income level | N (%) | N (%) | N (%) | N (%) |
| ≤ $47999 | 3 (6%) | 0 (0%) | 3 (19%) | 0 (0%) |
| $48,000 – $60,999 | 22 (43%) | 8 (35%) | 6 (38%) | 8 (67%) |
| $61,000 – $81,999 | 23 (45%) | 13 (57%) | 6 (38%) | 4 (33%) |
| ≥ $82,000 | 3 (6%) | 2 (9%) | 1 (6%) | 0 (0%) |
Note: Data in HBPC visits delivered by nurse practitioners were based on 2019 provider PUF, https://www.cms.gov/Research-Statistics-Data-and-Systems/Statistics-Trends-and-Reports/Medicare-Provider-Charge-Data/Physician-and-Other-Supplier;
, geometric mean and the equivalent SD based on the natural log transformed data;
, based on state-level enrollment PUF Medicare Geographic Variation - by National, State & County. Accessed June 28, 2021, https://www.cms.gov/Research-Statistics-Data-and-Systems/Statistics-Trends-and-Reports/Medicare-Geographic-Variation/GV_PUF;
, based on 20020 data from the Long-Term Services & Supports State Scorecard. Accessed November 9, 2021, http://www.longtermscorecard.org/;
, based on 2015–2019 ACS data;
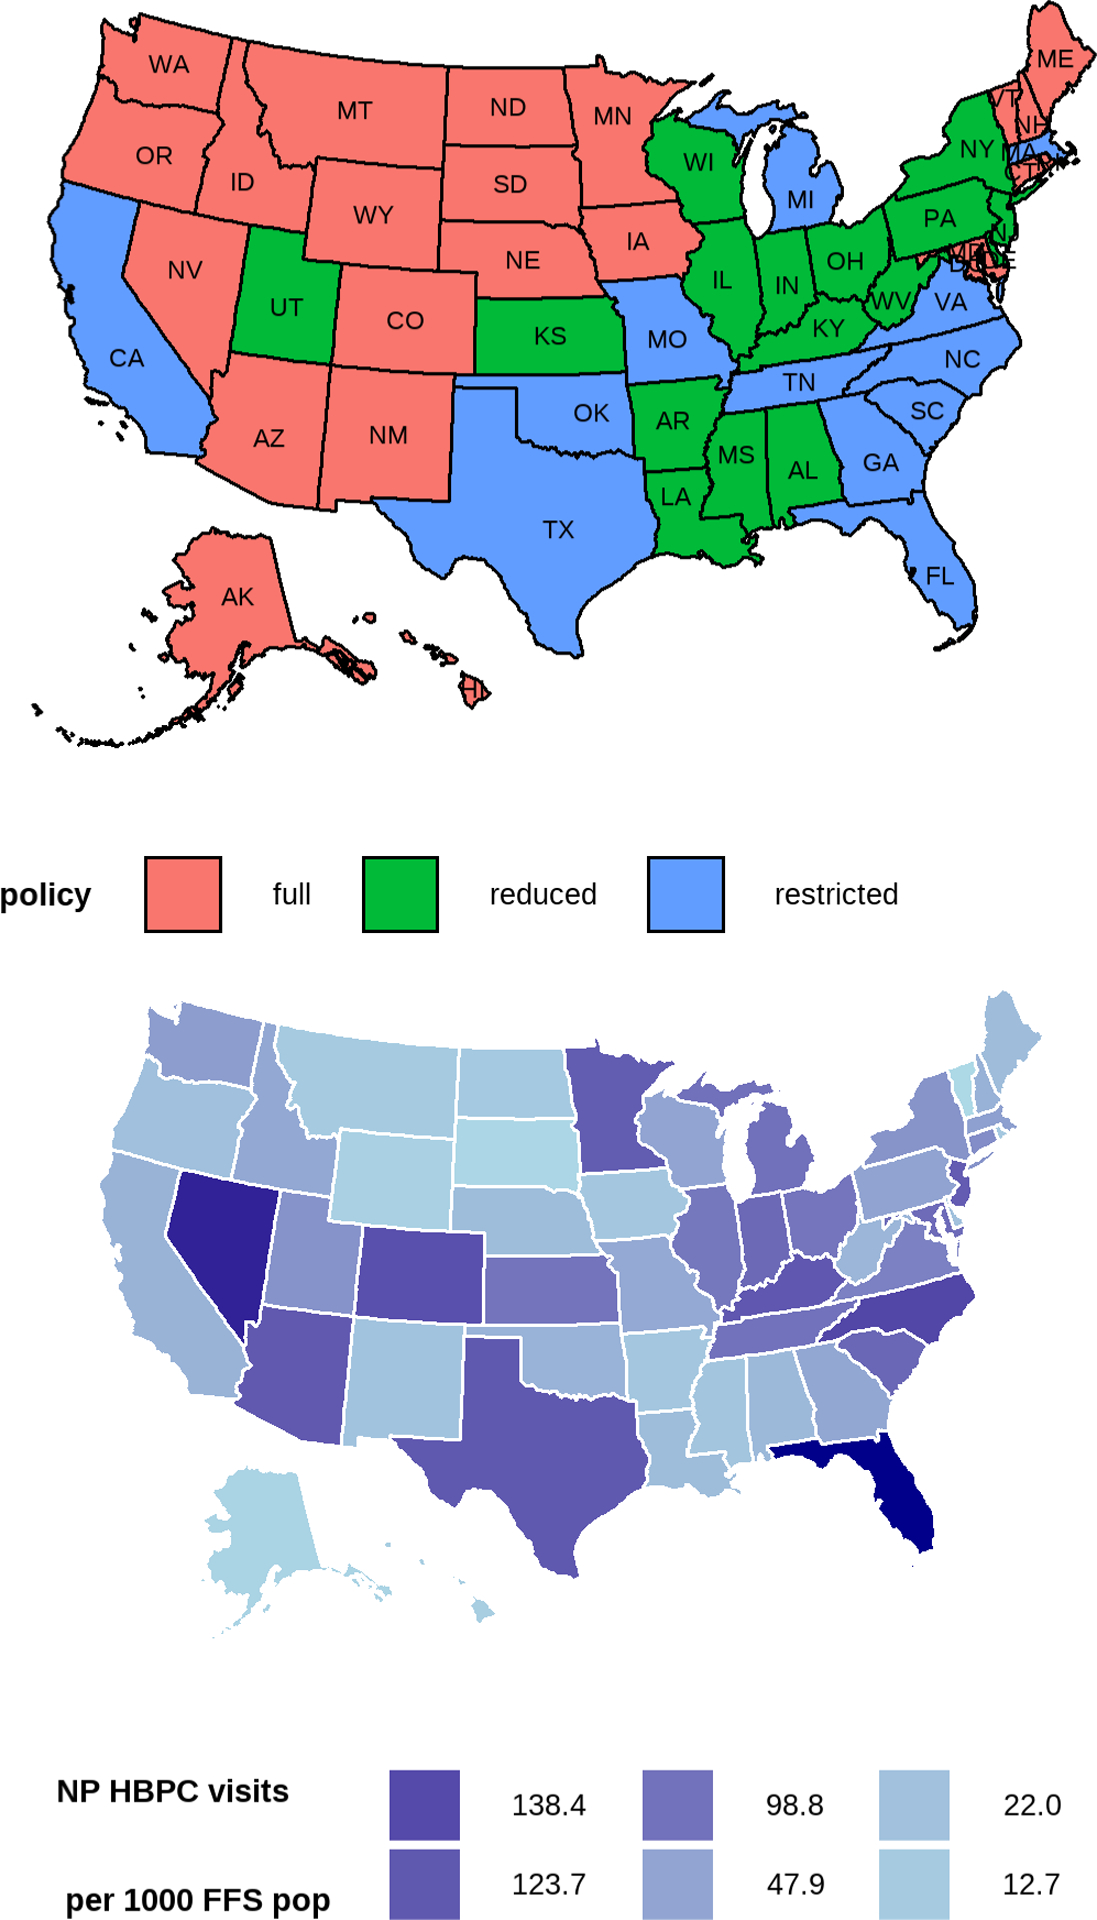
State-level scope-of-practice status and state-level NP- HBPC utilization rate.
Note: The increasing color darkness of HBPC visits corresponds to the 10th, 25th, 50th, 75th, 90th, and 95th percentiles of the state-level HBPC rate). NP=nurse practitioner; HBPC=home based primary care; FFS pop=fee for service population
Overall, the average number of NP-HBPC was greater in states with restricted scope-of-practice laws (mean=89.9 [SD 51.6]), compared to reduced (63 [38.2]) or full (49.1[50.7]) scope-of-practice laws. States with restrictive scope-of-practice regulations had the highest rates of minoritized populations. For example, states with reduced (14.7%) and restrictive (15.8%) scope-of-practice regulation had a greater proportion of Black NP- HBPC compared to full practice states (6.6%). In addition, states with restrictive scope-of-practice regulations served the highest proportion of the Hispanic population (14.6%). Median income was significantly higher in full scope-of-practice states. The more restricted the state scope-of-practice regulation in a state, the greater the socioeconomic disadvantage. Sixty-six per cent of states with median income level $61,000 or above had full scope-of-practice laws, compared to 44% in states with reduced scope-of-practice laws and 33% in states with restricted scope-of-practice laws.
In both crude and adjusted models, the differences by scope-of-practice category were significant (Table 2). NP- HBPC visits rate was higher in restricted (Beta coefficient=0.92; 95%CI (0.13–1.72), p=0.023) and reduced (Beta coefficient=0.91; 95%CI (0.03–1.79), p=0.043) scope-of-practice states than that in the full scope-of-practice states, after adjusting for relevant covariates (Table 2).
Table 2.
Results from the linear regression. Compared to full-scope-of-practice states, states with restricted or reduced scope-of-practice had significantly higher NP-led HBPC visits per 1,000 FFS Medicare beneficiaries.
| Crude model | Adjusted model | |||
|---|---|---|---|---|
| Beta coefficient (95% CI) | p-value | Beta coefficient (95% CI) | p-value | |
| Full- scope-of-practice states | Reference | Reference | ||
| Reduced scope-of-practice states | 0.74 (0.01–1.46) | 0.046 | 0.92 (0.13–1.72) | 0.023 |
| Restricted- scope-of-practice states | 1.15 (0.36–1.94) | 0.005 | 0.91 (0.03–1.79) | 0.043 |
Note: The adjusted model controlled for the following state-level covariates: median household income, proportion of population who were Black, Hispanic, and the proportion of those living below the poverty line who were 65 years or older. The outcome of the model was the natural-log transformed HBPC utilization rate (visits per 1000 FFS Medicare beneficiaries). In the log scale, the beta coefficient is the difference in the expected geometric means of the log of HBPC rates between the full-scope- of-practice and reduced- or restricted-scope-of-practice states. An example of interpreting the beta coefficient in the original scale is to exponentiate the coefficient and subtract one. For example, exp(0.91) – 1 =1.46, which can be interpreted as switching from full-scope- of- practice states to restricted- scope- of- practice states, we expect to see approximately 146% increase in the geometric mean of HBPC utilization rate.
Discussion
Using 2019 Medicare fee-for-service data, we examined the association of state scope of practice regulations on the utilization of NP-HBPC. Contrary to expectations, we found higher rates of delivery of NP-HBPC in states with reduced and restricted scope-of-practice regulations.
Prior studies,22,31,32 including one study focused on HBPC,12 found that restricted scope-of-practice regulations limit availability and utilization of NP provided care. Osakwe et al, using 2017 Medicare PUF data,12 conducted a provider-level analysis and found that in states with restricted scope-of-practice laws, compared to NPs, physicians and physician assistants had higher odds of providing HBPC. An important difference between the current study and prior analyses is that this was a state-level analyses and the sample was limited to NPs only. Furthermore, this article extends prior research by examining the potential influence of area-level race/ethnicity and socioeconomic conditions using more recent data.
Several factors may help explain why states with restricted scope-of-practice regulations were more likely to have greater uptake of NP-HBPC compared to full practice states. One potential factor is that in addition to scope-of-practice regulations, organizational characteristics of health systems employing NPs influence or create favorable practice environments for NPs.33 Previous research has shown that practice settings that promote NP-role visibility, autonomy, and professional collaboration between NPs and physicians and/or administrators favor NPs, and are associated with greater retention of NPs.34,35 Large HBPC health care delivery organizations in the private sector that play a dominant role in the delivery of HBPC may use a collaborative practice model between physicians and NPs, that while constraining some NP autonomy, may offer a rich interdisciplinary community and a culture of mutual respect that is appealing to some NPs. Consistent with this hypothesis is that several states with restricted scope-of-practice have multiple HBPC health care delivery organizations (e.g., Visiting Physicians Association, Optum Health and/or Landmark) with a large NP workforce. In addition, large HBPC health care delivery organizations may offer benefits such as compensation or reimbursement and administrative support, which prior work has found to be attractive to NPs.36 Higher reimbursement for NP- HBPC visits under managed care organizations or large HBPC health care delivery organizations are important incentives that may attract NPs in restricted states. Efforts to expand access to HBPC in states with full scope-of-practice laws need to prioritize investment in training the NP workforce, and increase financial incentives for providing NP HBPC visits.
The large and growing NP workforce is critically important to expand access to HBPC in rural locations where they are most needed. In our study, compared to reduced and restricted states, several states with full scope-of-practice law had a large rural population(e.g., Montana, Maine, North Dakota[see Figure 1]), lower population density, fee-for-service population and less NP HBPC visits. These findings add to growing concerns about inadequate access to HBPC for homebound rural Medicare beneficiaries.37
Prior studies have found that although states with full scope-of-practice have the highest numbers of NPs per capita,38 the fastest NP growth and increase in number of patients seen by NPs occurred in states with reduced and restricted scope - of - practice.39 More recent studies show that relaxing scope-of-practice restrictions do not affect the provision of low-value services (e.g., respiratory illness and low-back pain).40 It is possible, however, that relaxed scope-of-practice could lead to more isolation and less interprofessional care, which may be unappealing to some NPs. Data on HBPC clinician team configurations necessary to deliver high-quality HBPC are needed to better understand more about the delivery of NP-HBPC in restricted states, and how NPs navigate the regulatory environment.
Future research should examine the impact of the practice environment of NPs on delivery of HBPC, such as team-based models of care, or the density of accountable care organizations in states with restricted scope-of-practice regulations.41 Finally, further work should examine the impact of NP scope-of - practice laws on HBPC provided by Medicare Advantage programs.
There are several limitations to this study. First, these findings might not generalize to NPs caring for other populations, such as those with Medicare Advantage coverage, which may differ socioeconomically from Medicare fee-for-service beneficiaries. Second, this was an exploratory, observational study; our findings reflect associations, not causal relationships about the role of scope-of-practice regulation in HBPC and should thus be treated as descriptive. Further research needs to employ more nuanced methods such as pseudo-experimental design focused on changes in state scope - of - practice regulations. Third, we may have underestimated NP participation in Medicare due to the prevalence of incident-to-billing under which care provided by NPs is billed under a physician’s National Provider Identifier number.42 Finally, while we accounted for the number of NP-HBPC providers, state ranking of total assisted living, the proportion of FFS Medicare beneficiaries and neighborhood-level socio-economic status and race and ethnicity, we did not account for other differences in states that may influence delivery of NP-HBPC including rurality, ratio of NP/physician and other primary care workforce (e.g., physician assistants).
In the present study, we found that utilization of NP-HBPC was greater in states with restricted scope-of-practice regulations. The highest rates of NP-HBPC were not in the states with full scope-of-practice regulations as hypothesized. We suggest several areas of further research needed to understand potential organizational-level sources of this variation in the utilization of NP-HBPC.
Key points:
Nearly half of NPs providing HBPC (46%; n=7151) were in states with restricted scope of practice regulations.
The NP-HBPC visit rates were higher in states with restricted and reduced scope-of-practice laws than full scope-of-practice states.
Why does this paper matter?
Understanding underlying mechanisms of how state scope-of-practice environment affects NP-HBPC delivery could help to develop scope-of-practice regulations that improve access to HBPC for the underserved homebound population.
Acknowledgements
Funding resources:
The study was supported by the National Institute on Aging (P01 AG066605 234 and P30AG028741).
Funding sources:
The study is supported by the National Institute on Aging (P01 AG066605 and P30AG028741). Zainab Toteh Osakwe was supported by a grant from the National Institute on Aging (5P30AG028741-07) awarded to the Claude D Pepper Older Americans Independence Center at the Icahn School of Medicine at Mount Sinai.
Role of the Funder/Sponsor:
The funding organizations had no role in the design and conduct of the study; collection, management, analysis, and interpretation of the data; preparation, review, or approval of the manuscript; and decision to submit the manuscript for publication.
Footnotes
Conflict of Interest Disclosures: Authors have no conflicts of interest to disclose.
References
- 1.Department of Health US and Human Services. National and regional projections of supply and demand for primary care practitioners: 2013–2025. Health Resources and Services Administration Rockville, MD. 2016. [Google Scholar]
- 2.Auerbach DI, Buerhaus PI, Staiger DO. Implications Of The Rapid Growth Of The Nurse Practitioner Workforce In The US: An examination of recent changes in demographic, employment, and earnings characteristics of nurse practitioners and the implications of those changes. Health Affairs. 2020;39(2):273–279. [DOI] [PubMed] [Google Scholar]
- 3.Wolff-Baker D, Ordona RB. The expanding role of nurse practitioners in home-based primary care: Opportunities and challenges. Journal of gerontological nursing. 2019;45(6):9–14. [DOI] [PubMed] [Google Scholar]
- 4.Eric De Jonge K, Jamshed N, Gilden D, Kubisiak J, Bruce SR, Taler G. Effects of home-based primary care on Medicare costs in high-risk elders. Journal of the American Geriatrics Society. 2014;62(10):1825–1831. [DOI] [PubMed] [Google Scholar]
- 5.Yao N, Rose K, LeBaron V, Camacho F, Boling P. Increasing role of nurse practitioners in house call programs. Journal of the American Geriatrics Society. 2017;65(4):847–852. [DOI] [PubMed] [Google Scholar]
- 6.Ankuda CK, Leff B, Ritchie CS, Siu AL, Ornstein KA. Association of the COVID-19 pandemic with the prevalence of homebound older adults in the United States, 2011–2020. JAMA internal medicine. 2021;181(12):1658–1660. [DOI] [PMC free article] [PubMed] [Google Scholar]
- 7.Ornstein KA, Leff B, Covinsky KE, et al. Epidemiology of the homebound population in the United States. JAMA internal medicine. 2015;175(7):1180–1186. [DOI] [PMC free article] [PubMed] [Google Scholar]
- 8.Streeter RA, Zangaro GA, Chattopadhyay A. Perspectives: Using results from HRSA’s health workforce simulation model to examine the geography of primary care. Health Services Research. 2017;52:481–507. [DOI] [PMC free article] [PubMed] [Google Scholar]
- 9.Department of Health US and Human Services. Health resources and services administration. National Center for Health Workforce Analysis. 2014:2012–2025. [Google Scholar]
- 10.Kaye HS, Williamson J. Toward a model long-term services and supports system: State policy elements. The Gerontologist. 2014;54(5):754–761. [DOI] [PMC free article] [PubMed] [Google Scholar]
- 11.Yao N, Mutter JB, Berry JD, Yamanaka T, Mohess DT, Cornwell T. In Traditional Medicare, Modest Growth In The Home Care Workforce Largely Driven By Nurse Practitioners: Study examines the characteristics of the workforce providing home-based medical care for traditional (fee-for-service) Medicare beneficiaries. Health Affairs. 2021;40(3):478–486. [DOI] [PubMed] [Google Scholar]
- 12.Osakwe ZT, Kim RS, Obioha CU, Osborne JC, Harun N, Saint Fleur-Calixte R. Impact of state scope-of-practice laws on nurse practitioner-provided home visits. Geriatric Nursing. 2021;42(3):674–680. [DOI] [PubMed] [Google Scholar]
- 13.Naylor MD, Kurtzman ET. The role of nurse practitioners in reinventing primary care. Health affairs. 2010;29(5):893–899. [DOI] [PubMed] [Google Scholar]
- 14.Spetz J, Parente ST, Town RJ, Bazarko D. Scope-of-practice laws for nurse practitioners limit cost savings that can be achieved in retail clinics. Health Affairs. 2013;32(11):1977–1984. [DOI] [PubMed] [Google Scholar]
- 15.Barnett ML, Lee D, Frank RG. In rural areas, buprenorphine waiver adoption since 2017 driven by nurse practitioners and physician assistants. Health Affairs. 2019;38(12):2048–2056. [DOI] [PMC free article] [PubMed] [Google Scholar]
- 16.Nguyen T, Muench U, Andraka-Christou B, Simon K, Bradford WD, Spetz J. The association between scope of practice regulations and nurse practitioner prescribing of buprenorphine after the 2016 opioid bill. Medical Care Research and Review. 2022;79(2):290–298. [DOI] [PMC free article] [PubMed] [Google Scholar]
- 17.Fairman JA, Rowe JW, Hassmiller S, Shalala DE. Broadening the scope of nursing practice. Journal of the Dermatology Nurses’ Association. 2011;3(2):88–90. [DOI] [PubMed] [Google Scholar]
- 18.Poghosyan L, Norful AA, Martsolf GR. Primary care nurse practitioner practice characteristics: barriers and opportunities for interprofessional teamwork. The Journal of ambulatory care management. 2017;40(1):77. [DOI] [PMC free article] [PubMed] [Google Scholar]
- 19.Lozada MJ, Raji MA, Goodwin JS, Kuo Y-F. Opioid prescribing by primary care providers: a cross-sectional analysis of nurse practitioner, physician assistant, and physician prescribing patterns. Journal of general internal medicine. 2020;35(9):2584–2592. [DOI] [PMC free article] [PubMed] [Google Scholar]
- 20.Kuo Y-F, Chen N-W, Baillargeon J, Raji MA, Goodwin JS. Potentially preventable hospitalizations in Medicare patients with diabetes: a comparison of primary care provided by nurse practitioners versus physicians. Medical care. 2015;53(9):776. [DOI] [PMC free article] [PubMed] [Google Scholar]
- 21.Hughes DR, Filar C, Mitchell DT. Nurse practitioner scope of practice and the prevention of foot complications in rural diabetes patients. The Journal of Rural Health. 2021. [DOI] [PubMed] [Google Scholar]
- 22.Xue Y, Kannan V, Greener E, et al. Full scope-of-practice regulation is associated with higher supply of nurse practitioners in rural and primary care health professional shortage counties. Journal of Nursing Regulation. 2018;8(4):5–13. [Google Scholar]
- 23.Stanhope SA, Cooley MC, Ellington LF, et al. The effects of home-based primary care on Medicare costs at Spectrum Health/Priority Health (Grand Rapids, MI, USA) from 2012-present: a matched cohort study. BMC Health Services Research. 2018;18(1):1–7. [DOI] [PMC free article] [PubMed] [Google Scholar]
- 24.Federman AD, Brody A, Ritchie CS, et al. Outcomes of home-based primary care for homebound older adults: a randomized clinical trial. Journal of the American Geriatrics Society. 2022. [DOI] [PMC free article] [PubMed] [Google Scholar]
- 25.Leff B, Weston CM, Garrigues S, et al. Home-based primary care practices in the United States: current state and quality improvement approaches. Journal of the American Geriatrics Society. 2015;63(5):963–969. [DOI] [PubMed] [Google Scholar]
- 26.U.S. Department of Health and Human Services Health Resources and Services Administration Bureau of Health Workforce National Center for Health Workforce Analysis. National and Regional Projections of Supply and Demand for Primary Care Practitioners: 2013–2025. https://bhw.hrsa.gov/sites/default/files/bhw/health-workforce-analysis/research/projections/primary-care-national-projections2013-2025.pdf. Published November 2016. Accessed May 8, 2017.
- 27.Buerhaus P Nurse practitioners: A solution to America’s primary care crisis. American Enterprise Institute. 2018:1–30. [Google Scholar]
- 28.Centers for Medicare and Medicaid Services. Medicare Geographic Variation – by National SC.
- 29.American Academy of Nurse Practitioners. 2019. Nurse Practitioner State Practice. Accessed November 18, 2021, https://storage.aanp.org/www/documents/state-leg-reg/stateregulatorymap.pdf
- 30.Reinhard S, Houser A, Ujvari K, et al. Long-Term Services and Supports State Scorecard 2020. Edition. Accessed Feb 28, 2022, http://longtermscorecard.org/~/media/Microsite/Files/2020/LTSS%202020%20Short%20Report%20PDF%20923.pdf
- 31.Poghosyan L, Timmons EJ, Abraham CM, Martsolf GR. The economic impact of the expansion of nurse practitioner scope of practice for Medicaid. Journal of Nursing Regulation. 2019;10(1):15–20. [Google Scholar]
- 32.Patel EY, Petermann V, Mark BA. Does state-level nurse practitioner scope-of-practice policy affect access to care? Western journal of nursing research. 2019;41(4):488–518. [DOI] [PMC free article] [PubMed] [Google Scholar]
- 33.Carthon MB, Brom H, Nikpour J, Todd B, Aiken L, Poghosyan L. Supportive Practice Environments Are Associated With Higher Quality Ratings Among Nurse Practitioners Working in Underserved Areas. Journal of Nursing Regulation. 2022;13(1):5–12. [DOI] [PMC free article] [PubMed] [Google Scholar]
- 34.Poghosyan L, Liu J, Shang J, D’Aunno T. Practice environments and job satisfaction and turnover intentions of nurse practitioners: Implications for primary care workforce capacity. Health care management review. 2017;42(2):162–171. [DOI] [PubMed] [Google Scholar]
- 35.Poghosyan L, Kueakomoldej S, Liu J, Martsolf G. Advanced practice nurse work environments and job satisfaction and intent to leave: Six-state cross sectional and observational study. Journal of Advanced Nursing. 2022. [DOI] [PMC free article] [PubMed] [Google Scholar]
- 36.Poghosyan L, Ghaffari A, Liu J, Friedberg MW. Physician-nurse practitioner teamwork in primary care practices in New York: A cross-sectional survey. Journal of general internal medicine. 2020;35(4):1021–1028. [DOI] [PMC free article] [PubMed] [Google Scholar]
- 37.Yao N, Ritchie C, Cornwell T, Leff B. Use of home-based medical care and disparities. Journal of the American Geriatrics Society. 2018;66(9):1716–1720. [DOI] [PubMed] [Google Scholar]
- 38.Graves JA, Mishra P, Dittus RS, Parikh R, Perloff J, Buerhaus PI. Role of geography and nurse practitioner scope-of-practice in efforts to expand primary care system capacity. Medical care. 2016;54(1):81–89. [DOI] [PubMed] [Google Scholar]
- 39.Barnes H, Richards MR, McHugh MD, Martsolf G. Rural and nonrural primary care physician practices increasingly rely on nurse practitioners. Health Affairs. 2018;37(6):908–914. [DOI] [PMC free article] [PubMed] [Google Scholar]
- 40.Smith LB. The effect of nurse practitioner scope of practice laws on primary care delivery. Health Economics. 2022;31(1):21–41. [DOI] [PubMed] [Google Scholar]
- 41.Huang N, Raji M, Lin Y-L, Chou L-N, Kuo Y-F. Nurse practitioner involvement in Medicare accountable care organizations: association with quality of care. American Journal of Medical Quality. 2021:1062860620935199. [DOI] [PMC free article] [PubMed] [Google Scholar]
- 42.O’Donnell B, Bloniarz K Medicare payment policies for advanced practice registered nurses (APRNs) and physician assistants (PAs). Paper presented at: MedPAC Public Meeting2018. [Google Scholar]