

Abstract
Sleeve gastrectomy (SG) is effective in treating cardiometabolic complications of obesity but is associated with bone loss. Our aim was to determine the effect of SG on the lumbar spine by biomechanical CT analysis in adolescents/young adults with obesity. We hypothesized that SG would lead to a decrease in strength and BMD compared to non-surgical controls. In a 12-month prospective non-randomized study, adolescents/young adults with obesity underwent SG (N=29, 18.0 ± 2.1 years, 23 female) or were followed without surgery (controls, N=30, 17.95 ± 3.0 years, 22 female). At baseline and 12 months, participants underwent QCT of L1 and L2 for biomechanical assessment and MRI of the abdomen and mid-thigh for body composition assessment. 12-month changes between groups and within groups were assessed. Analyses were controlled for baseline and 12-month changes in BMI by multivariable analyses. Regression analysis was performed to evaluate the effect of body composition on bone parameters. Our IRB approved the study, and informed consent/assent was obtained. Participants in the SG group had a higher baseline BMI than controls (p=0.01) and lost an average of 34.3±13.6 kg 12 months after surgery, whereas weight was unchanged in controls (p<0.001). There were significant reductions in abdominal adipose tissue and thigh muscle area in the SG group compared to controls (p<0.001). Bone strength, bending stiffness, and average and trabecular volumetric BMD decreased in the SG group compared to controls (p<0.001). After controlling for change in BMI, a 12-month reduction in cortical BMD was significant in the SG group compared to controls (p=0.02). Reductions in strength and trabecular BMD were associated with reductions in BMI, visceral adipose tissue, and muscle (p≤0.03). In conclusion, SG in adolescents decreased strength and volumetric BMD of the lumbar spine compared to non-surgical controls. These changes were associated with decreases in visceral fat and muscle mass.
JBMR Keywords: Radiology, Analysis – Bone QCT, Clinical Trials, Orthopaedics – Biomechanics, Therapeutics – Other
Global Keywords: Finite element analysis, metabolic and bariatric and metabolic surgery, sleeve gastrectomy, adolescents, bone mineral density, quantitative computed tomography
Introduction
Childhood obesity is a severe public health threat and is increasing worldwide (1). Obesity during childhood and adolescence is associated with cardiometabolic complications, including type 2 diabetes mellitus, non-alcoholic fatty liver disease, dyslipidemia, and hypertension (2), as well as reduced self-esteem and poor mental health (3,4). Importantly, children and adolescents with obesity are likely to have obesity as adults (5,6). Metabolic and bariatric surgery (MBS) is the most effective strategy to treat severe obesity and its associated cardiometabolic complications (7,8). The Teen-Longitudinal Assessment of Bariatric Surgery (Teen-LABS) study, a multicenter study of 242 adolescents with severe obesity who underwent MBS, and others have demonstrated sustained weight loss and reversal of cardiometabolic complications up to five years post-surgery, with results similar to or slightly better than in adults (9,10). Sleeve gastrectomy (SG), where about 80% of the stomach is removed, causing mechanical restriction, and altering hormone secretion, is the most commonly performed MBS procedure in youth (11). Despite being effective in treating obesity and its complications, SG is associated with bone loss in adolescents, as manifested by a mean decrease of BMD z-score of up to 0.416 at the lumbar spine 12 months after SG (12), and increased fracture risk by about 45% within the 2 years post-surgery in adults (13). The adolescent years are crucial for optimal bone accrual and peak bone mass (14), and MBS during adolescence might therefore have greater detrimental long-term effects on bone health compared to adults.
Only a few studies have evaluated the effect of MBS in adolescents on bone (15–18), and most have used dual-energy x-ray-absorptiometry (DXA) to assess areal bone mineral density (BMD), which is susceptible to artifactual changes from a reduction in soft tissue thickness following severe weight loss (19). Quantitative computed tomography CT (QCT) is more accurate in determining BMD following interventions associated with extreme changes in body fat (20). Moreover, QCT assesses not only BMD but can also be used for biomechanical assessment of bone strength using finite element analysis (FEA) (21). Biomechanical CT represents the combination of biomechanics and FEA using CTs and can accurately assess bone strength and thus predict fracture risk better than BMD (21–23). However, this technique has not been used to examine the impact of MBS on bone and could help advance our understanding of the effect of MBS on skeletal integrity on the growing skeleton.
Therefore, our study aimed to determine the effect of SG on bone strength of the lumbar spine by biomechanical CT analysis in adolescents and young adults with severe obesity. We hypothesized that SG would lead to a decrease in strength estimates compared to non-surgical controls.
Materials and Methods
The authors declare no conflict of interest. In a prior study, we reported BMD by QCT in 52 of the 59 subjects (16). The current study expands on this by performing biomechanical CT analysis to determine strength and more detailed volumetric assessments. Our institutional review board approved this prospective longitudinal study and the study complied with health insurance portability and accountability act guidelines. Written informed consent/assent was obtained from all subjects or their parents, depending on age.
Participant Selection
Inclusion criteria for all participants were (1) age 13 to 25 years and (2) moderate-to-severe obesity (BMI of ≥35 kg/m2) in adults and BMI ≥ 120 % of the 95th percentile for age and sex in adolescents. For the surgical group, additional inclusion criteria were (1) plan to undergo sleeve gastrectomy (SG), (2) BMI of ≥35 kg/m2 with at least one obesity-related co-morbidity, or (3) a BMI of ≥40 kg/m2. Exclusion criteria were (1) pregnancy, (2) history of medical disorders or use of medications known to affect bone metabolism, (3) history of smoking more than ten cigarettes per day or of substance abuse per DSM-5, and (4) weight >200 kg given weight limitations of the CT and MRI scanners. Groups were matched for age and sex, and we aimed to match for BMI upon inclusion.
The study was performed at an academic medical center. After a screening visit to confirm eligibility, study participants were evaluated at baseline (before SG) and 12 months after surgery. Non-surgical control subjects were also examined at baseline and 12 months and were counseled regarding diet and exercise. Study participants underwent a history and physical examination, fasting blood tests [calcium, phosphate, 25OHD, and PTH assessed by a reference laboratory (LabCorp, Burlington, NC, USA)], and imaging at baseline and 12 months. Race and ethnicity (self-reported) were collected given racial differences in BMD (24). All study participants were advised to take vitamin D supplementation based on 25OHD levels (25OHD 20 to 30 ng/mL: 4,000 IU/per day; 25OHD 12 to 20 ng/mL: 50,000 IU/week for 2 months; 25OHD < 12 ng/mL: 50,000 IU/week for 3 months). Participants were recruited from 2015 to 2020 for their baseline visit.
Biomechanical CT
At the baseline and 12-month visits, participants underwent helical CT of the lumbar spine (L1 and L2) (LightSpeed Pro, GE Healthcare, Waukesha, WI, USA) lying supine on a calibration phantom (Mindways Software, Inc., Austin, TX, USA) with the following scan parameters: tube voltage of 120kV, tube current of 100mA, slice thickness of 2.5 mm, FOV of 500 mm, and table height of 144 mm (one-year coefficient of variation (CV) ≤ 2%).
Biomechanical CT analyses were performed with validated, FDA-approved VirtuOst software (O.N. Diagnostics, Berkeley, Calif) and remotely conducted on deidentified Digital Imaging and Communications in Medicine (DICOM) images at O.N. Diagnostics (21). The following strength variables were assessed: bone strength (N), determined as the force required to virtually fracture the subject’s lumbar spine under compressive loading conditions, and vertebral bending stiffness (kNm/radian (rad)), determined by subjecting the vertebra to an anterior-posterior bending moment. For this analysis, a bending rotation of 1° was applied to the top endplate using a linearly elastic analysis (25). Greater stiffness represents stronger bone. Average volumetric BMD of the vertebral body (mg/cm3), the trabecular compartment (mg/cm3), and the cortical compartment (the peripheral 2 mm layer of bone) (mg/cm3) were also assessed. Biomechanical CT analyses were derived from volumetric whole-vertebra data of L1 and L2 and reported as averages of those levels, except for three subjects who only had one matching level available.
Magnetic Resonance Imaging
Participants underwent single-slice MRI of the abdomen at the level of L4 and the mid-thigh for body composition assessment at baseline and 12 months (Siemens Trio; Siemens Medical Systems, Erlangen, Germany), using a T1-weighted fast spin-echo pulse sequence (slice thickness 10 mm, TR 300 msec, TE 12 msec, echo train 4, 512 × 512 matrix). Visceral adipose tissue (VAT), abdominal subcutaneous adipose tissue (SAT), and mid-thigh muscle cross-sectional areas (cm2) were determined using software (VITRAK, Merge/eFilm, Milwaukee, WI) (CV ≤ 2.5%).
All image acquisitions and analyses were blinded to the group assignment under the supervision of a musculoskeletal radiologist with 17 years of experience (M.A.B.).
Statistical Analysis
Statistical analyses were performed using JMP Statistical Software (Version 16, SAS Institute, Carey, NC). Sample size was determined based on preliminary data. With 59 participants, the study was powered at 90% to detect a 2.45% difference between groups for 1-year changes in bone parameters at an alpha level of 0.05, based on an estimated SD of change of 2.85%. Baseline characteristics of the SG and control groups were compared using Student’s t-test for continuous variables and a chi-square test for categorical variables. Student’s t-test compared 12-month changes between groups, and 12-month changes within groups were assessed using paired t-tests. Multivariable analysis was used to determine differences between groups controlling for baseline BMI and 12-month BMI changes. Linear regression analysis was performed to determine associations between biomechanical CT parameters and body composition changes. Pearson correlation coefficients are reported. Continuous variables are presented as means ± SD, and categorical variables are presented as frequencies and percentages. 95% CI are provided. P < 0.05 was used to denote significance.
Results
Participants Characteristics
Of 98 subjects screened for study participation, 87 were enrolled in the study and underwent a baseline visit (SG group n=39, non-surgical group: 48). Seventy-two study participants completed the 12-month visit (SG group n=32, non-surgical group: n=40). The final study cohort included participants who had undergone a QCT of L1 and L2 at baseline and 12 months and had matching levels available (SG group n=29, non-surgical group n=30) (Figure 1). Both groups had comparable age, sex, and race distribution and similar levels of calciotropic hormones, body composition, and biomechanical spine parameters. Participants in the SG group had a higher baseline weight and BMI than non-surgical controls (Table 1).
Figure 1:

Flowchart
Table 1:
Participant demographics
| Sleeve Gastrectomy group (n=29) | Non-surgical group (n=30) | p-value | |
|---|---|---|---|
| Age (years) | 18.0 ± 2.1 | 17.95 ± 3.0 | 0.94 |
| Female/Male (n) | 23/6 | 22/8 | 0.59 |
| Race | 0.72 | ||
| Asian | 0 | 1 (3.33 %) | |
| Black or African American | 5 (17.2 %) | 4 (13.33 %) | |
| Hispanic/Latinx | 8 (27.6 %) | 10 (33.33 %) | |
| Native American | 0 | 1 (3.33 %) | |
| White | 13 (44.8 %) | 10 (33.33 %) | |
| More than one | 3 (10.3 %) | 4 (13.33 %) | |
| Height (cm) | 167.6 ± 9.7 | 166.9 ± 8.0 | 0.76 |
| Weight (kg) | 133.4 ± 25.2 | 120.6 ± 21.7 | 0.04 |
| BMI (kg/m2) | 47.4 ± 6.7 | 43.1 ± 5.5 | 0.01 |
| Body Composition by MRI | |||
| Visceral adipose tissue (VAT) (cm2) | 118.0 ± 50.6 | 111.9 ± 75.6 | 0.72 |
| Subcutaneous adipose tissue (SAT) (cm2) | 734.8 ± 162.5 | 698.7 ± 141.3 | 0.39 |
| VAT/SAT | 0.17 ± 0.08 | 0.16 ± 0.09 | 0.77 |
| Thigh muscle (cm2) | 180.4 ± 32.7 | 173.7 ± 25.6 | 0.41 |
| Calciotropic hormones | |||
| Serum calcium (mg/dL) | 9.33 ± 0.29 | 9.28 ± 0.39 | 0.59 |
| Serum 25-hydoxyvitamin D (ng/mL) | 26.24 ± 10.13 | 22.34 ± 7.55 | 0.10 |
| Serum phosphorus (mg/dL) | 3.62 ± 0.51 | 3.61 ± 0.66 | 0.98 |
| Serum parathyroid hormone (pg/mL) | 39.74 ± 13.17 | 40.75 ± 16.35 | 0.80 |
| Biomechanical CT analysis | |||
| Vertebral body strength (N) | 10962 ± 1811 | 10233 ± 1935 | 0.14 |
| Vertebral bending stiffness (kNm/rad) | 2.87 ± 0.71 | 2.68 ± 0.66 | 0.30 |
| Average vertebral BMD (mg/cm³) | 261 ± 30 | 252 ± 36 | 0.32 |
| Trabecular vertebral BMD (mg/cm³) | 250 ± 33 | 238 ± 35 | 0.19 |
| Cortical vertebral BMD (mg/cm³) | 285 ± 27 | 283 ± 40 | 0.79 |
Continuous variables are presented as means ± SD and categorial variables are presented as frequencies and percentages.
rad=radian.
Participants in the SG group lost an average of 34.3±13.6 kg (95% CI −39.5, −29.1) 12 months after surgery, while there was no significant change in the non-surgical control group (p<0.001 between groups). Accordingly, BMI decreased in the SG group by 12.3±4.5 kg/m2 (95% CI −14, −10.6) without significant change in the control group. As expected, there was a significant reduction in visceral and subcutaneous adipose tissue and thigh muscle in the SG group compared to the non-surgical group (p<0.001). The differences between groups remained significant after controlling for baseline BMI. Calciotropic hormones did not significantly change within the SG group (p≥0.05), and there was no significant difference between groups (p≥ 0.06) (Table 2).
Table 2:
Effects of sleeve gastrectomy on body composition, calciotropic hormones, and biomechanical CT parameters 12 months after surgery vs. nonsurgical care
| Baseline measure | 12-month measure | 12-month change | p-value 12-months within groups | p-value 12-month change between groups | |||||
|---|---|---|---|---|---|---|---|---|---|
| Group | SG | NS | SG | NS | SG | NS | SG | NS | |
| Weight (kg) | 133.4 ± 25.2 | 120.6 ± 21.7 | 99.1 ± 26.9 | 121.9 ± 21.4 | −34.3 ± 13.6 (−39.5, −29.1) | 1.3 ± 7.1 (−1.4, 4.0) | <0.001 | 0.32 | <0.001* |
| BMI (kg/m2) | 47.4 ± 6.7 | 43.1 ± 5.5 | 35.1 ± 8.5 | 43 ± 5.5 | −12.3 ± 4.5 (−14, −10.6) | −0.05 ± 2.6 (−1, 0.9) | <0.001 | 0.92 | <0.001* |
| Visceral adipose tissue (VAT) (cm2) | 118.0 ± 50.6 | 111.9 ± 75.6 | 58.2 ± 36.6 | 123.5 ± 67.9 | −58.3 ± 36.4 (−73.3, −43.3) | 10.5 ± 33.4 (−2.4, 23.5) | <0.001 | 0.11 | <0.001* |
| Subcutaneous adipose tissue (SAT) (cm2) | 734.8 ± 162.5 | 698.7 ± 141.3 | 455.2 ± 172.1 | 724.0 ± 154.9 | −277.1 ± 156.1 (−341.6, −212.7) | 18.2 ± 81.6 (−13.4, 49.8) | <0.001 | 0.25 | <0.001* |
| Thigh Muscle (cm2) | 180.4 ± 32.7 | 173.7 ± 25.6 | 150.5 ± 26.6 | 176.1 ± 27.0 | −29.9 ± 23 (−39.4, −20.33) | 2.5 ± 11.4 (−1.9, 6.9) | <0.001 | 0.26 | <0.001* |
| Calcium (mg/dL) | 9.33 ± 0.29 | 9.28 ± 0.39 | 9.21 ± 0.29 | 9.19 ± 0.41 | −0.11 ± 0.32 (−0.24, 0.01) | −0.10 ± 0.35 (−0.23, 0.04) | 0.07 | 0.15 | 0.84 |
| 25-hydroxy vitamin D (ng/dL) | 26.24 ± 10.13 | 22.34 ± 7.55 | 30.24 ± 11.66 | 21.44 ± 5.6 | 3.75 ± 11.80 (−0.82, 8.32) | −1.22 ± 6.39 (−3.70, 1.26) | 0.05 | 0.32 | 0.06 |
| Phosphorus (mg/dL) | 3.62 ± 0.51 | 3.61 ± 0.66 | 3.86 ± 0.61 | 3.71 ± 0.48 | 0.25 ± 0.7 (−0.03, 0.53) | 0.1 ± 0.70 (−0.17, 0.37) | 0.07 | 0.45 | 0.42 |
| Parathyroid Hormone (pg/mL) | 39.74 ± 13.17 | 40.75 ± 16.35 | 35.62 ± 11.63 | 41.80 ± 21.91 | −3.45 ± 12.94 (−8.57, 1.67) | 2.04 ± 15.63 (−4.02, 8.11) | 0.18 | 0.50 | 0.16 |
| Vertebral body strength (N) | 10962 ± 1811 | 10233 ± 1935 | 10353 ± 1697 | 10337 ± 1852 | −609 ± 838 (−928, −291) | 103 ± 741 (−173, 380) | <0.001 | 0.45 | 0.001* |
| Vertebral bending stiffness (kNm/rad) | 2.87 ± 0.71 | 2.68 ± 0.66 | 2.79 ± 0.74 | 2.75 ± 0.71 | −0.08 ± 0.16 (−0.14, −0.02) | 0.07 ± 0.15 (0.01, 0.12) | 0.013 | 0.02 | <0.001* |
| Average vertebral BMD (mg/cm³) | 261 ± 30 | 252 ± 36 | 249 ± 29 | 252 ± 35 | −12 ± 12 (−16, −7) | 0 ± 13 (−5, 5) | <0.001 | 0.97 | <0.001* |
| Trabecular vertebral BMD (mg/cm³) | 250 ± 33 | 238 ± 35 | 235 ± 32 | 239 ± 34 | −15 ± 13 (−19, −10) | 2 ± 13 (−3, 7) | <0.001 | 0.49 | <0.001* |
| Cortical vertebral BMD (mg/cm³) | 285 ± 27 | 283 ± 40 | 279 ± 25 | 279 ± 38 | −6 ± 16 (−12, 0) | −4 ± 14 (−9, 2) | 0.05 | 0.19 | 0.52 |
Note. Data are reported as mean ± SD, data in parentheses indicate 95 % CI.
SG = Sleeve Gastrectomy; NS = Non-Surgical Control Group; rad=radian.
p<0.01 after controlling for baseline BMI
Biomechanical CT analysis
QCTs for biomechanical CT analysis were successfully obtained in all participants who completed the CT visit. No CTs were excluded based on technical factors. Fifty-two subjects had matching L1 and L2 levels at baseline and 12 months. The T12 and L1 levels were scanned in three subjects, and the L2 and L3 levels were scanned in one subject due to transitional anatomy. In 3 subjects, only the L2 vertebra was available for analysis due to a mismatch of the second vertebral level between the baseline and 12-month CT.
Effects of sleeve gastrectomy on lumbar biomechanical CT parameters
Bone strength decreased by −5.3 ± 7.9% within the SG group (p<0.001) (Figure 2), while there was no significant change in the non-surgical group (Figure 3). Bending stiffness decreased by −2.8 ± 4.9% in the SG group (p<0.001) and increased in the non-surgical control group by 2.5 ± 5.4% (p=0.02). Average and trabecular volumetric BMD decreased within the SG group by −4.4 ± 5.0% and −5.7 ± 5.4%, respectively (p<0.001), without a change in the control group (p<0.001 between groups for all measures). For all measures, the group differences remained significant after controlling for baseline BMI (p<0.01). There was a reduction in cortical BMD in the SG group, but the difference between the groups was not significant (p=0.52) (Table 2).
Figure 2.
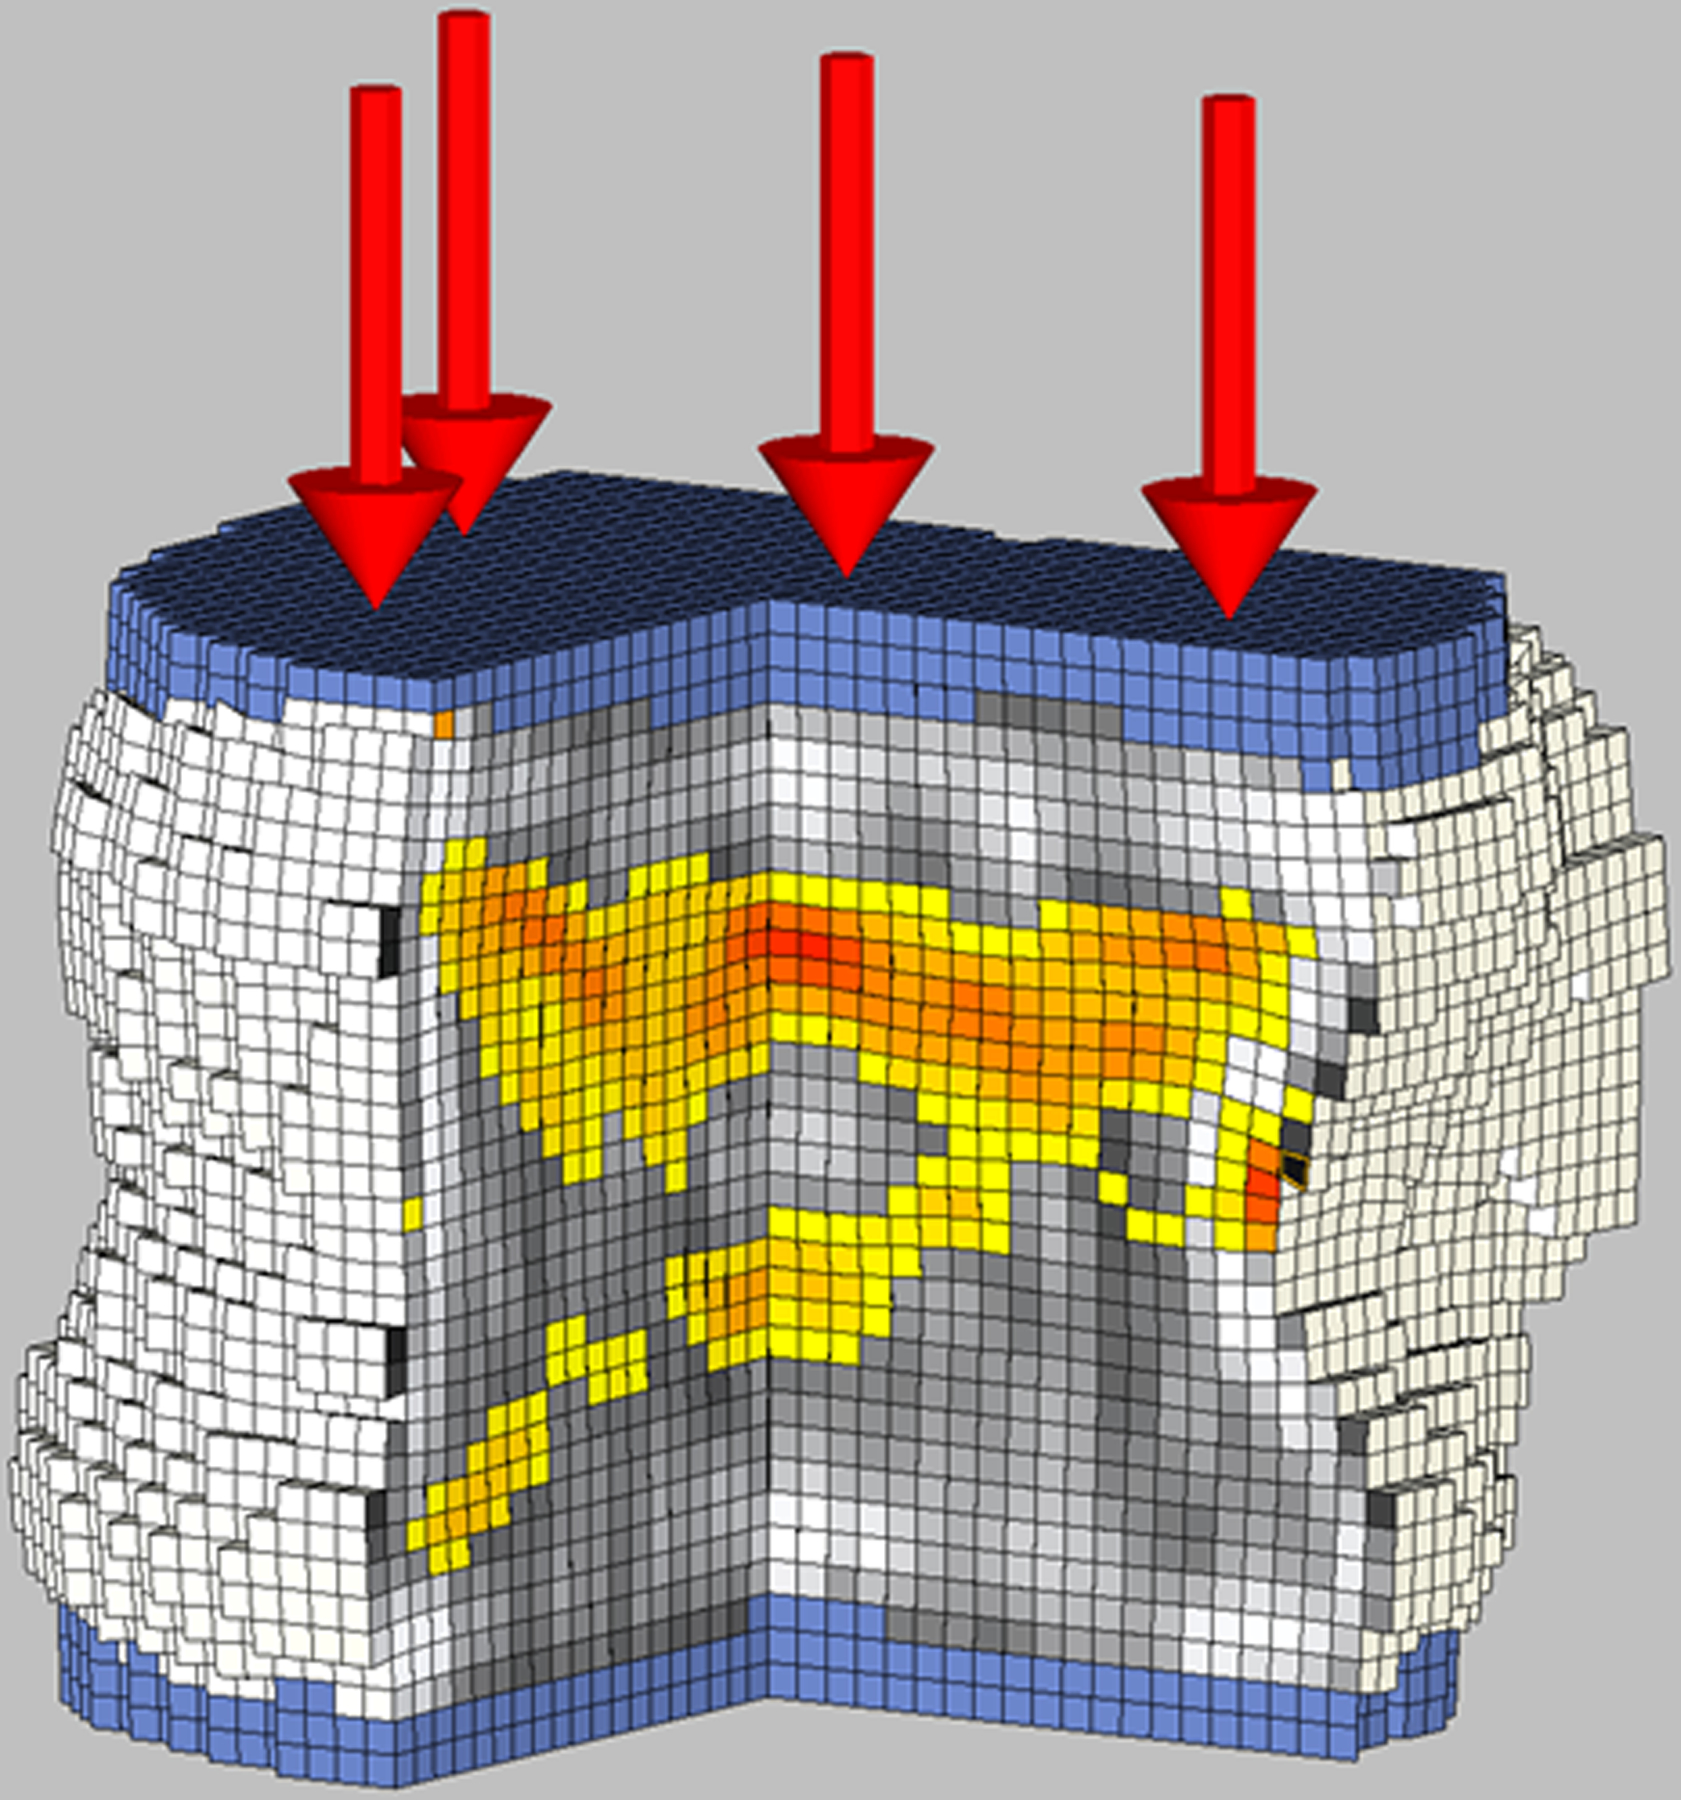
Biomechanical CT analysis of the L1 vertebral body in a 17-year-old female study participant with severe obesity (BMI: 39.7 kg/m2) who underwent sleeve gastrectomy.
A: Baseline evaluation before sleeve gastrectomy revelated bone strength of 9,260 N. Cut-out view of the finite element models under compressive load to failure depicts the distribution of BMD (black and white) and bone failure (colored areas). Red color indicates tissue that failed earlier during the compressive load (weaker bone). Shades of gray indicate different bone densities, with white being dense bone and black being little or no bone mineral.
B: 12 months after sleeve gastrectomy, bone strength was 7,510N. Finite element models under compressive load to failure show an increase in the areas of bone failure (colored areas) and more red color, indicating tissue that failed earlier during the compressive load, and more gray areas indicting lower bone density.
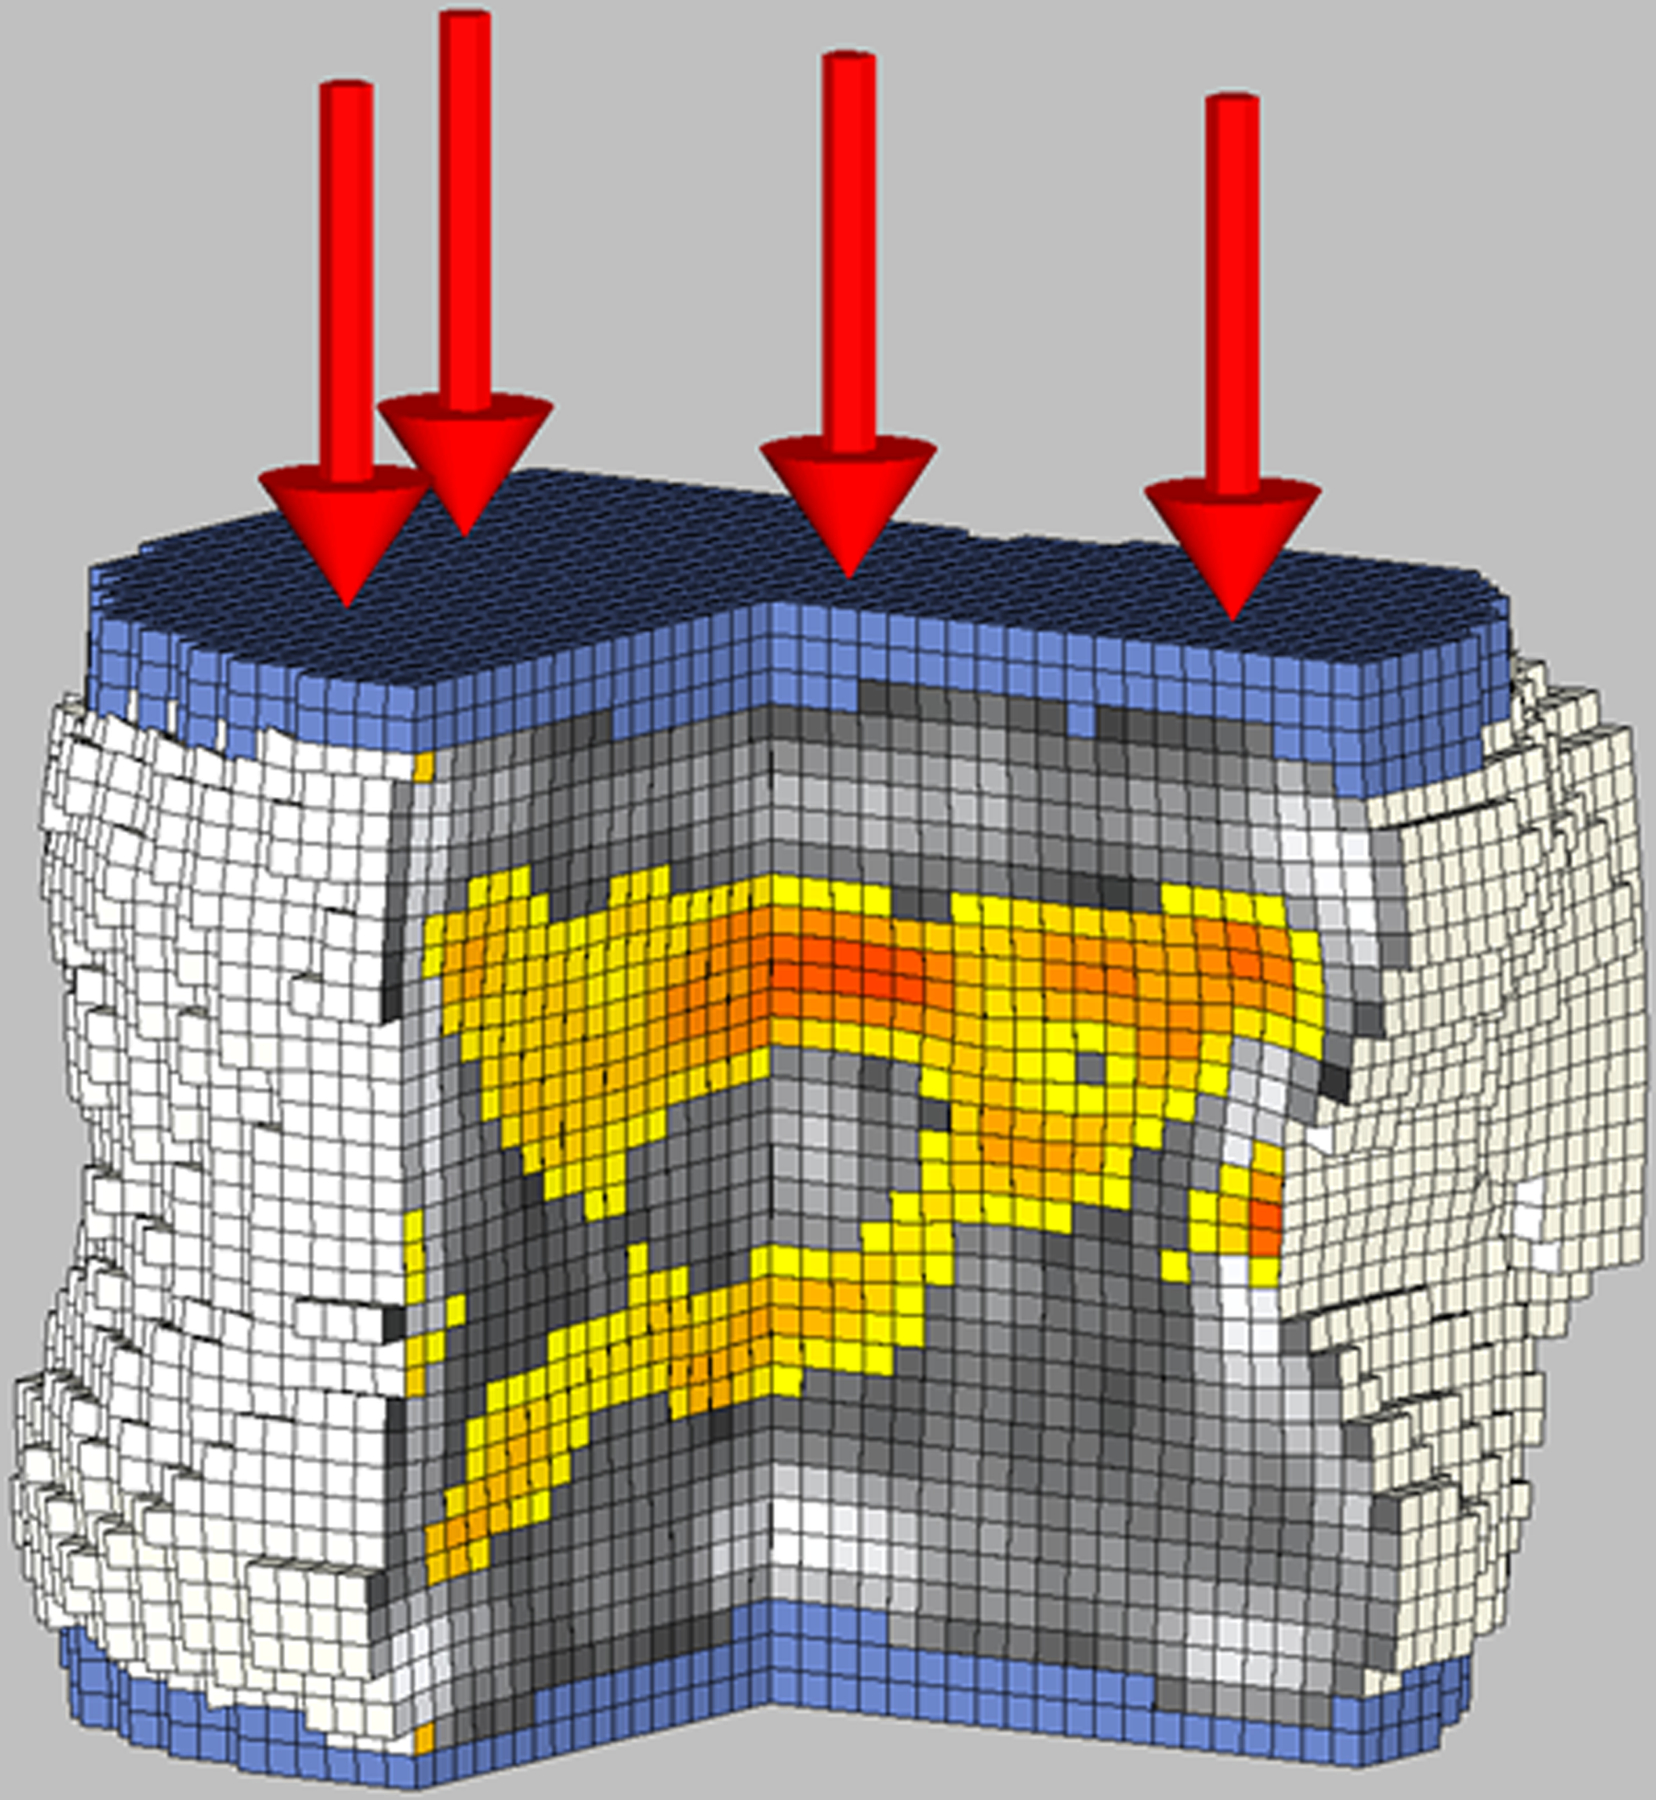
Figure 3.

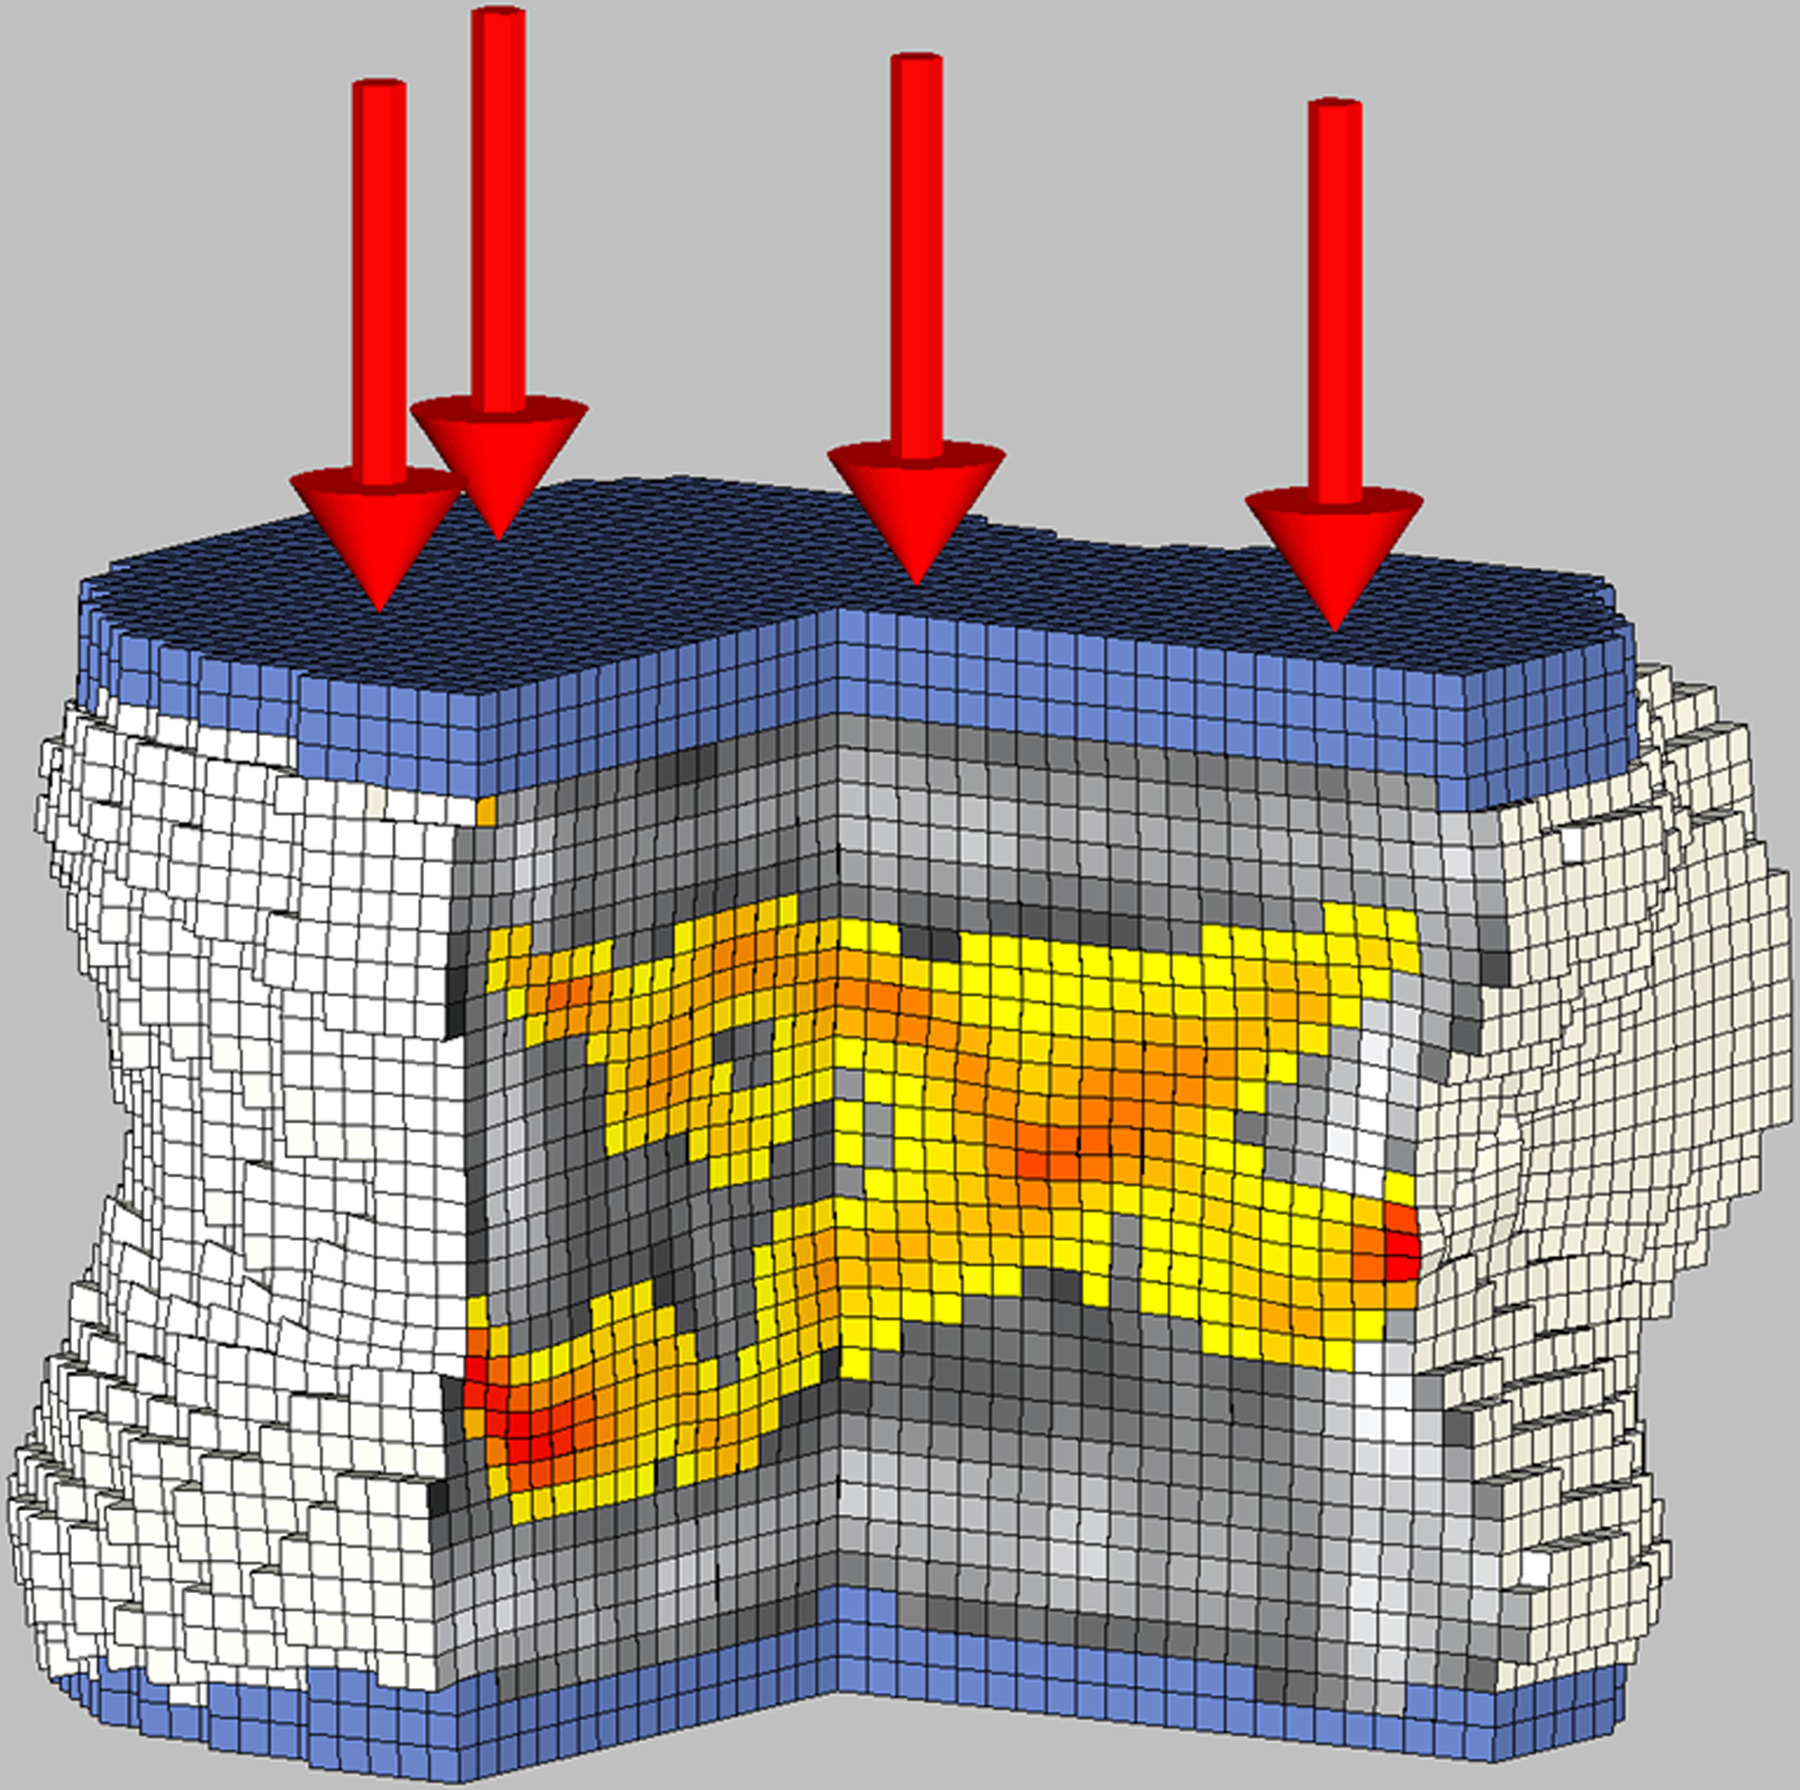
Biomechanical CT analysis of the L1 vertebral body in a 17-year-old female study participant with severe obesity (BMI: 46.9 kg/m2) who was followed with routine care.
A: Baseline evaluation revelated bone strength of 7,850 N. Cut-out view of the finite element models under compressive load to failure depicts the distribution of BMD (black and white) and bone failure (colored areas).
B: 12 months after routine care bone strength was 8,870 N. Finite element models under compressive load to failure show areas of bone failure (colored areas). Of note, areas that were red at baseline (early failure) became stronger at follow-up (more yellow color).
To detect weight-loss independent changes in biomechanical CT parameters, we also controlled for a 12-month change in BMI in our analyses. After controlling for baseline and 12-month change in BMI, differences between groups for 12-month change in strength and trabecular density lost significance (p=0.08 and p=0.09, respectively). However, differences between groups for changes in bending stiffness and average BMD remained significant (p=0.02 and p=0.04, respectively) and became significant for changes in cortical BMD (p=0.02).
Association between Changes in Biomechanical CT and Body Composition
In the entire cohort, 12-month changes in BMI, abdominal fat, and thigh muscle were positively associated with 12-month changes in vertebral body strength and bending stiffness, average and trabecular volumetric BMD, indicating that subjects who had the greatest loss of BMI, fat, and muscle had the greatest loss of vertebral strength, stiffness, and BMD (Figure 4). There were no associations between 12-month changes in body composition and 12-month changes in cortical BMD (Table 3).
Figure 4.
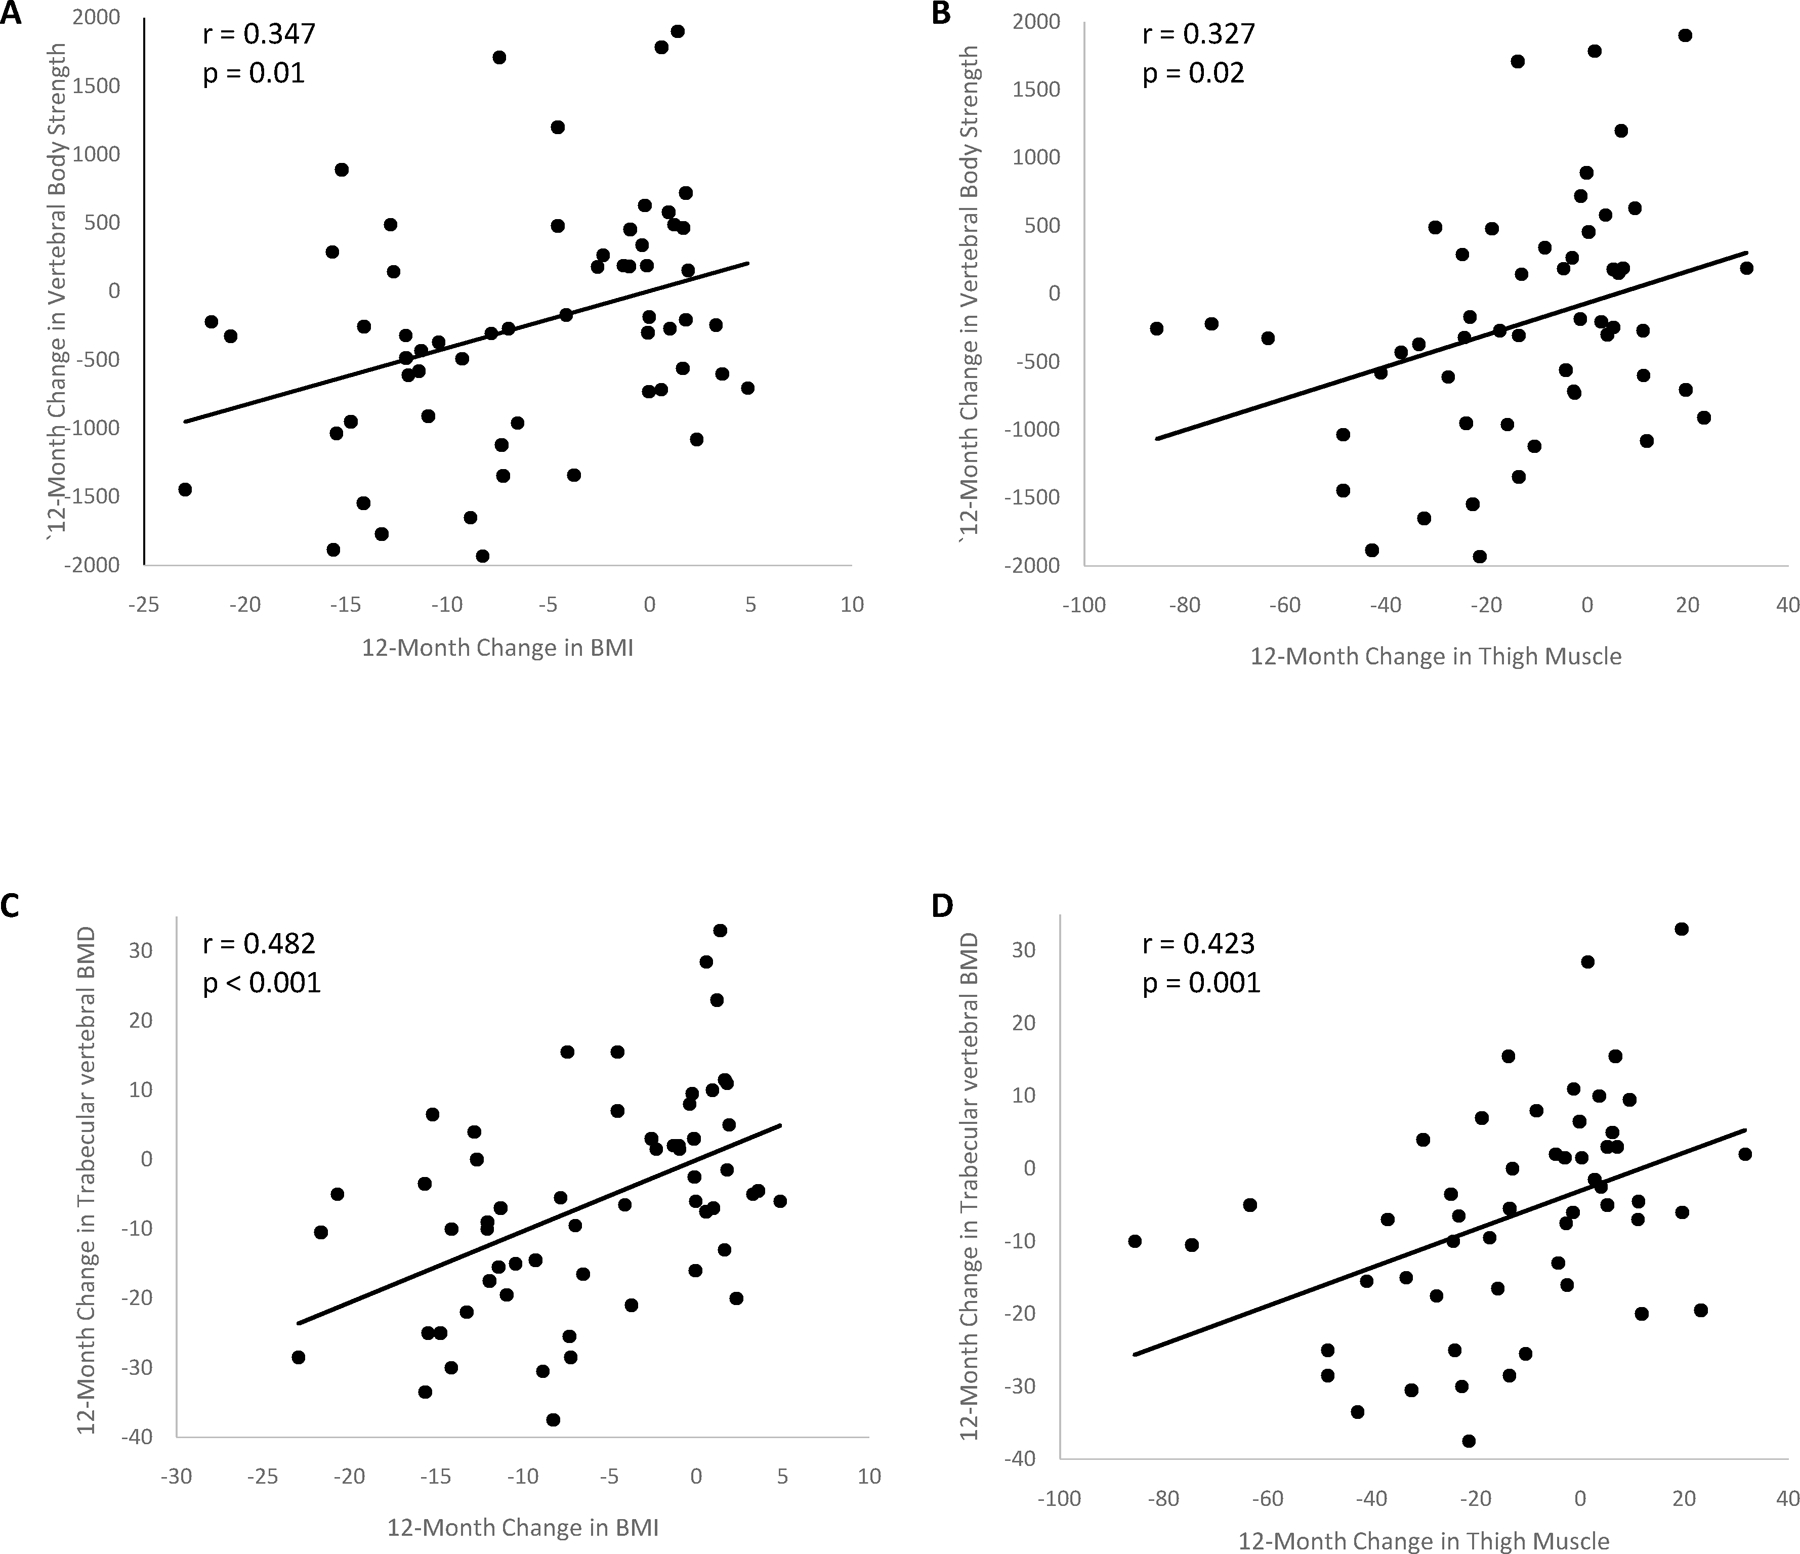
Regression analyses between 12-month changes in vertebral bone strength and trabecular volumetric BMD and 12-month changes in body composition.
There are positive correlations between changes in bone strength and (A) changes in BMI and (B) muscle area, and changes in trabecular vertebral BMD and (C) BMI and (D) muscle area.
Table 3:
Pairwise correlation between 12-month changes of biomechanical CT parameters and 12-month changes in body composition in the entire cohort
| 12-month change | ||||||||||
|---|---|---|---|---|---|---|---|---|---|---|
| Vertebral Body Strength | Vertebral Bending stiffness | Average vertebral BMD | Trabecular vertebral BMD | Cortical vertebral BMD | ||||||
| 12-month change | R | p | R | p | R | p | R | p | R | p |
| BMI | 0.347 (0.099, 0.554) | 0.01 | 0.329 (0.079, 0.539) | 0.01 | 0.334 (0.085, 0.543) | 0.001 | 0.482 (0.259, 0.658) | <0.001 | −0.089 (−0.338, 0.171) | 0.50 |
| VAT | 0.315 (0.049, 0.539) | 0.02 | 0.249 (−0.022, 0.487) | 0.07 | 0.322 (0.057, 0.545) | 0.02 | 0.397 (0.142, 0.603) | 0.003 | 0.048 (−0.2255, 0.314) | 0.73 |
| SAT | 0.231 (−0.042, 0.472) | 0.10 | 0.260 (−0.011, 0.495) | 0.06 | 0.211 (−0.063, 0.456) | 0.13 | 0.368 (0.109, 0.581) | 0.007 | −0.191 (−0.439, 0.084) | 0.17 |
| Thigh Muscle | 0.327 (0.063, 0.549) | 0.02 | 0.327 (0.062, 0.549) | 0.02 | 0.294 (0.026, 0.523) | 0.03 | 0.423 (0.173, 0.622) | 0.001 | −0.083 (−0.345, 0.192) | 0.56 |
Note. Data in parentheses are 95 % CI.
VAT = Visceral Adipose Tissue; SAT = Subcutaneous Adipose Tissue.
Discussion
This prospective longitudinal study aimed to assess the effect of sleeve gastrectomy (SG) on vertebral bone strength and density by biomechanical CT analysis in adolescents and young adults with obesity. Our main findings are that (1) bone strength and bending stiffness decrease 12 months after SG compared to non-surgical controls, (2) average and trabecular BMD decrease 12 months after SG compared to non-surgical controls, and (3) reductions in strength and trabecular BMD are associated with reductions in BMI, visceral adipose tissue and muscle area.
Obesity in children and adolescents is a significant public health threat with negative consequences on morbidity, life expectancy, and quality of life (2,26). As a result of the growing prevalence of childhood obesity, MBS is increasingly performed, with SG being the most common procedure in this age-group (8). MBS is safe and effective in achieving sustained weight loss and remission of obesity-associated comorbidities (7,9,27). In our study on adolescents and young adults with moderate-severe obesity, SG led to significant weight loss 12 months after surgery. At the same time, participants in the non-surgical control group, who were followed only with counseling regarding diet and exercise, showed no significant change in weight. However, participants in the SG group demonstrated deterioration in bone parameters compared to non-surgical controls. We now demonstrate using biomechanical CT analysis derived from QCTs that SG results in significant decreases in bone strength, the force required to virtually fracture lumbar vertebral bodies under compressive loading conditions, and in bending stiffness, the response of the vertebra to bending loads applied in the anterior-posterior direction (25). These results indicate that MBS has adverse effects on skeletal integrity of the lumbar spine in youth and this is significant as bone accrual in the pubertal years is critical for achieving optimal peak bone mass (14).Increased fracture risk of the lumbar spine has been reported for adults who underwent MBS (28) and this may be the case for adolescents as well.
Nonetheless, the effects of MBS on bone in childhood obesity have not been thoroughly evaluated. Two studies assessed bone outcomes following Roux-en-Y gastric bypass surgery in adolescents and showed a decrease in whole body areal BMD (g/cm2) using DXA, two years after surgery (15,17). Of note, whole body DXA is less accurate in determining the bone loss and fracture risk compared to regional DXA (29). Two studies assessed lumbar and hip BMD by DXA and lumbar spine BMD by QCT in adolescents 12 months after SG and non-surgical controls (16,18). While there was a reduction in hip BMD by DXA in the SG group by −0.086 g/cm2 (18) and a reduction in lumbar spine volumetric BMD by QCT by −6.9 g/cm³ (16) on average, reductions in lumbar spine BMD after SG were not significantly different from controls (16,18). DXA is less accurate in determining BMD changes following MBS due to the extensive changes in soft tissues (19). Moreover, DXA is limited by its planar, 2D technique and resulting inability to distinguish between cortical and trabecular compartments. FEA of clinical QCTs can assess vertebral strength and predict fractures independent of areal BMD assessed by DXA and volumetric BMD by QCT (30,31). In addition, biomechanical CT analysis allows separate assessment of the trabecular and cortical compartments.
We observed a significant reduction in trabecular volumetric BMD after SG compared to non-surgical controls. There was a trend toward a within-group decrease in cortical bone in the SG group, but no significant difference compared to non-surgical controls. A study examining cortical and trabecular compartments in the distal radius and tibia by peripheral high-resolution CT 12 months after SG found an increase in cortical BMD in the distal radius and distal tibia after SG and a reduction of trabecular BMD in the distal tibia compared to non-surgical controls. Of note, there were no differences in strength estimates by FEA at either site in this study (18). These results indicate that the lumbar spine, which contains primarily trabecular bone, responds differently to SG than the more cortical sites, such as the distal tibia and radius, and that biomechanical CT is accurate in assessing these changes. Of note, a higher rate of vertebral fractures has been reported in adults after MBS (28), emphasizing the importance of accurately assessing the lumbar spine after MBS. However, in our adolescent population with obesity the declines in vertebral body strength and stiffness were not below those seen in the control group at 12 months and remained above reported thresholds for “fragile bone strength” and “low bone strength” (32). Long-term studies will be required to assess whether this decline will lead to an increased risk of fracture later in life.
We found a positive association of reductions in strength and BMD parameters with reductions in BMI and abdominal fat and muscle compartments, suggesting that participants with the greatest weight loss experienced the greatest bone strength and density loss. While mechanisms of bone loss after SG are multifactorial, mechanical unloading from fat loss and muscle mass plays a vital role (33). Differences between groups for 12-month change in strength and trabecular BMD lost significance after controlling for change in BMI, confirming that changes in these parameters are primarily affected by the marked weight loss. However, differences between groups for changes in bending stiffness and average density remained significant. Changes in cortical density became significant after controlling for changes in BMI, suggesting that changes in these parameters are determined by factors other than weight loss, and require further exploration.
SG is associated with reduced absorption of nutrients, including calcium and vitamin D (34). Therefore, we provided calcium and vitamin D supplementation to study participants. Consequently, we found no significant calcium, phosphorus, and vitamin D reduction and no increases in PTH levels after SG. This suggests that the BMI-independent reductions in bending strength and cortical BMD reflect alterations other than mechanical unloading or insufficient calcium or vitamin D intake.
Our study adds to the growing body of literature suggesting that adolescents who undergo MBS may require post-surgical care to prevent detrimental effects of weight loss on bone accrual. Current strategies of post-surgical care in adults undergoing MBS include optimizing calcium and vitamin D intake, and mechanical loading by weightbearing activities and these strategies should be applied to adolescents (12).
Our study had several limitations. Subjects were not randomized to SG vs. non-surgical care (to maintain equipoise). While we aimed to match study participants for clinical characteristics, the SG group had higher baseline weight and BMI. We, therefore, controlled our analyses for baseline BMI. While biomechanical CT has been shown to predict fracture risk accurately, we only followed our participants for 12 months. Studies in adults have shown continued bone loss after MBS even when weight loss plateaued (35). Therefore, a longer follow-up period is necessary to determine whether the deleterious changes in vertebral strength will continue and lead to spine fractures. Furthermore, there are no normal values by biomechanical CT for adolescents and it will require further studies to determine whether our observed reductions in bone parameters will translate into increased fractures later in life. Last, we did not evaluate the effect of pharmacotherapy on bone. Given the recent FDA-approval of anti-obesity medication in children and adolescents and the frequent off-label use of such medication in this population (36), studies are needed to evaluate the effect of anti-obesity medication on bone in adolescents. Strengths of our study include the prospective longitudinal study design and detailed assessment of bone strength and density by biomechanical CT in adolescents and young adults after SG and control subjects followed with routine care.
In conclusion, our study showed that sleeve gastrectomy in adolescents and young adults decreases bone strength and BMD of the lumbar spine 12 months after surgery compared to non-surgical controls. These changes are associated with BMI, fat, and muscle mass reductions. Reductions in bending stiffness, average and cortical BMD were independent of BMI loss and affected by alterations other than mechanical unloading.
Acknowledgments
The authors thank David Lee, PhD, and Tony M Keaveny, PhD, for their help with the analysis of biomechanical CTs.
Grant support
This work was supported by the following grants:
NIH K24DK109940 (MAB), NIH R01 DK103946 (MM, MAB), NIH K23DK110419 (VS), P30DK040561 (VS, FCS), K24HD071843 (MM), U24 DK132733 (FCS), NIH P30DK057521 (VS).
Footnotes
Disclosures
The authors do not have any conflicts of interest to disclose.
ClinicalTrials.gov Identifier
Data Availability Statement
The data that support the findings of this study are available from the corresponding author upon reasonable request.
References
- 1.Dehghan M, Akhtar-Danesh N, Merchant AT. Childhood obesity, prevalence and prevention. Nutr J 2005; 4:24. [DOI] [PMC free article] [PubMed] [Google Scholar]
- 2.Caprio S, Santoro N, Weiss R . Childhood obesity and the associated rise in cardiometabolic complications. Nat Metab 2020; 2:223–232 [DOI] [PMC free article] [PubMed] [Google Scholar]
- 3.Gibson-Smith D, Halldorsson TI, Bot M, Brouwer IA, Visser M, Thorsdottir I, Birgisdottir BE, Gudnason V, Eiriksdottir G, Launer LJ, Harris TB, Gunnarsdottir I. Childhood overweight and obesity and the risk of depression across the lifespan. BMC Pediatr 2020; 20:25. [DOI] [PMC free article] [PubMed] [Google Scholar]
- 4.Rankin J, Matthews L, Cobley S, Han A, Sanders R, Wiltshire HD, Baker JS. Psychological consequences of childhood obesity: psychiatric comorbidity and prevention. Adolesc Health Med Ther 2016; 7:125–146 [DOI] [PMC free article] [PubMed] [Google Scholar]
- 5.Abdullah A, Peeters A, de Courten M, Stoelwinder J. The magnitude of association between overweight and obesity and the risk of diabetes: a meta-analysis of prospective cohort studies. Diabetes Res Clin Pract 2010; 89:309–319 [DOI] [PubMed] [Google Scholar]
- 6.Llewellyn A, Simmonds M, Owen CG, Woolacott N. Childhood obesity as a predictor of morbidity in adulthood: a systematic review and meta-analysis. Obes Rev 2016; 17:56–67 [DOI] [PubMed] [Google Scholar]
- 7.Chang SH, Stoll CR, Song J, Varela JE, Eagon CJ, Colditz GA. The effectiveness and risks of bariatric surgery: an updated systematic review and meta-analysis, 2003–2012. JAMA Surg 2014; 149:275–287 [DOI] [PMC free article] [PubMed] [Google Scholar]
- 8.Pratt JSA, Browne A, Browne NT, Bruzoni M, Cohen M, Desai A, Inge T, Linden BC, Mattar SG, Michalsky M, Podkameni D, Reichard KW, Stanford FC, Zeller MH, Zitsman J. ASMBS pediatric metabolic and bariatric surgery guidelines, 2018. Surg Obes Relat Dis 2018; 14:882–901 [DOI] [PMC free article] [PubMed] [Google Scholar]
- 9.Inge TH, Courcoulas AP, Jenkins TM, Michalsky MP, Brandt ML, Xanthakos SA, Dixon JB, Harmon CM, Chen MK, Xie C, Evans ME, Helmrath MA, Teen LC. Five-Year Outcomes of Gastric Bypass in Adolescents as Compared with Adults. N Engl J Med 2019; 380:2136–2145 [DOI] [PMC free article] [PubMed] [Google Scholar]
- 10.Stanford FC, Mushannen T, Cortez P, Campoverde Reyes KJ, Lee H, Gee DW, Pratt JS, Boepple PA, Bredella MA, Misra M, Singhal V. Comparison of Short and Long-Term Outcomes of Metabolic and Bariatric Surgery in Adolescents and Adults. Front Endocrinol (Lausanne) 2020; 11:157. [DOI] [PMC free article] [PubMed] [Google Scholar]
- 11.Angrisani L, Santonicola A, Iovino P, Vitiello A, Zundel N, Buchwald H, Scopinaro N. Bariatric Surgery and Endoluminal Procedures: IFSO Worldwide Survey 2014. Obes Surg 2017; 27:2279–2289 [DOI] [PMC free article] [PubMed] [Google Scholar]
- 12.Misra M, Bredella MA. Bone Metabolism in Adolescents Undergoing Bariatric Surgery. J Clin Endocrinol Metab 2021; 106:326–336 [DOI] [PMC free article] [PubMed] [Google Scholar]
- 13.Saad RK, Ghezzawi M, Habli D, Alami RS, Chakhtoura M. Fracture risk following bariatric surgery: a systematic review and meta-analysis. Osteoporos Int 2022; 33:511–526 [DOI] [PubMed] [Google Scholar]
- 14.Gordon CM, Zemel BS, Wren TA, Leonard MB, Bachrach LK, Rauch F, Gilsanz V, Rosen CJ, Winer KK. The Determinants of Peak Bone Mass. J Pediatr 2017; 180:261–269 [DOI] [PubMed] [Google Scholar]
- 15.Beamish AJ, Gronowitz E, Olbers T, Flodmark CE, Marcus C, Dahlgren J. Body composition and bone health in adolescents after Roux-en-Y gastric bypass for severe obesity. Pediatr Obes 2017; 12:239–246 [DOI] [PubMed] [Google Scholar]
- 16.Bredella MA, Singhal V, Hazhir Karzar N, Animashaun A, Bose A, Stanford FC, Carmine B, Misra M. Effects of Sleeve Gastrectomy on Bone Marrow Adipose Tissue in Adolescents and Young Adults with Obesity. J Clin Endocrinol Metab 2020; 105 [DOI] [PMC free article] [PubMed] [Google Scholar]
- 17.Kaulfers AM, Bean JA, Inge TH, Dolan LM, Kalkwarf HJ. Bone loss in adolescents after bariatric surgery. Pediatrics 2011; 127:e956–961 [DOI] [PMC free article] [PubMed] [Google Scholar]
- 18.Misra M, Singhal V, Carmine B, Bose A, Kelsey MM, Stanford FC, Bram J, Aidlen J, Inge T, Bouxsein ML, Bredella MA. Bone outcomes following sleeve gastrectomy in adolescents and young adults with obesity versus non-surgical controls. Bone 2020; 134:115290. [DOI] [PMC free article] [PubMed] [Google Scholar]
- 19.Javed F, Yu W, Thornton J, Colt E. Effect of fat on measurement of bone mineral density. Int J Body Compos Res 2009; 7:37–40 [PMC free article] [PubMed] [Google Scholar]
- 20.Yu EW, Thomas BJ, Brown JK, Finkelstein JS. Simulated increases in body fat and errors in bone mineral density measurements by DXA and QCT. J Bone Miner Res 2012; 27:119–124 [DOI] [PMC free article] [PubMed] [Google Scholar]
- 21.Keaveny TM, Clarke BL, Cosman F, Orwoll ES, Siris ES, Khosla S, Bouxsein ML. Biomechanical Computed Tomography analysis (BCT) for clinical assessment of osteoporosis. Osteoporos Int 2020; 31:1025–1048 [DOI] [PMC free article] [PubMed] [Google Scholar]
- 22.Allaire BT, Lu D, Johannesdottir F, Kopperdahl D, Keaveny TM, Jarraya M, Guermazi A, Bredella MA, Samelson EJ, Kiel DP, Anderson DE, Demissie S, Bouxsein ML. Prediction of incident vertebral fracture using CT-based finite element analysis. Osteoporos Int 2019; 30:323–331 [DOI] [PMC free article] [PubMed] [Google Scholar]
- 23.Wang X, Sanyal A, Cawthon PM, Palermo L, Jekir M, Christensen J, Ensrud KE, Cummings SR, Orwoll E, Black DM, Osteoporotic Fractures in Men Research G, Keaveny TM. Prediction of new clinical vertebral fractures in elderly men using finite element analysis of CT scans. J Bone Miner Res 2012; 27:808–816 [DOI] [PMC free article] [PubMed] [Google Scholar]
- 24.Ettinger B, Sidney S, Cummings SR, Libanati C, Bikle DD, Tekawa IS, Tolan K, Steiger P. Racial differences in bone density between young adult black and white subjects persist after adjustment for anthropometric, lifestyle, and biochemical differences. J Clin Endocrinol Metab 1997; 82:429–434 [DOI] [PubMed] [Google Scholar]
- 25.Crawford RP, Keaveny TM. Relationship between axial and bending behaviors of the human thoracolumbar vertebra. Spine (Phila Pa 1976) 2004; 29:2248–2255 [DOI] [PubMed] [Google Scholar]
- 26.Koletzko B, Fishbein M, Lee WS, Moreno L, Mouane N, Mouzaki M, Verduci E. Prevention of Childhood Obesity: A Position Paper of the Global Federation of International Societies of Paediatric Gastroenterology, Hepatology and Nutrition (FISPGHAN). J Pediatr Gastroenterol Nutr 2020; 70:702–710 [DOI] [PubMed] [Google Scholar]
- 27.Inge TH, Courcoulas AP, Jenkins TM, Michalsky MP, Helmrath MA, Brandt ML, Harmon CM, Zeller MH, Chen MK, Xanthakos SA, Horlick M, Buncher CR. Weight Loss and Health Status 3 Years after Bariatric Surgery in Adolescents. N Engl J Med 2016; 374:113–123 [DOI] [PMC free article] [PubMed] [Google Scholar]
- 28.Blom-Hogestol IK, Hewitt S, Chahal-Kummen M, Brunborg C, Gulseth HL, Kristinsson JA, Eriksen EF, Mala T. Bone metabolism, bone mineral density and low-energy fractures 10years after Roux-en-Y gastric bypass. Bone 2019; 127:436–445 [DOI] [PubMed] [Google Scholar]
- 29.Arlot ME, Sornay-Rendu E, Garnero P, Vey-Marty B, Delmas PD. Apparent pre- and postmenopausal bone loss evaluated by DXA at different skeletal sites in women: the OFELY cohort. J Bone Miner Res 1997; 12:683–690 [DOI] [PubMed] [Google Scholar]
- 30.Crawford RP, Cann CE, Keaveny TM. Finite element models predict in vitro vertebral body compressive strength better than quantitative computed tomography. Bone 2003; 33:744–750 [DOI] [PubMed] [Google Scholar]
- 31.Melton LJ, 3rd, Riggs BL, Keaveny TM, Achenbach SJ, Hoffmann PF, Camp JJ, Rouleau PA, Bouxsein ML, Amin S, Atkinson EJ, Robb RA, Khosla S. Structural determinants of vertebral fracture risk. J Bone Miner Res 2007; 22:1885–1892 [DOI] [PubMed] [Google Scholar]
- 32.Kopperdahl DL, Aspelund T, Hoffmann PF, Sigurdsson S, Siggeirsdottir K, Harris TB, Gudnason V, Keaveny TM. Assessment of incident spine and hip fractures in women and men using finite element analysis of CT scans. J Bone Miner Res 2014; 29:570–580 [DOI] [PMC free article] [PubMed] [Google Scholar]
- 33.Yu EW. Bone metabolism after bariatric surgery. J Bone Miner Res 2014; 29:1507–1518 [DOI] [PMC free article] [PubMed] [Google Scholar]
- 34.Folli F, Sabowitz BN, Schwesinger W, Fanti P, Guardado-Mendoza R, Muscogiuri G. Bariatric surgery and bone disease: from clinical perspective to molecular insights. Int J Obes (Lond) 2012; 36:1373–1379 [DOI] [PubMed] [Google Scholar]
- 35.Lindeman KG, Greenblatt LB, Rourke C, Bouxsein ML, Finkelstein JS, Yu EW. Longitudinal 5-Year Evaluation of Bone Density and Microarchitecture After Roux-en-Y Gastric Bypass Surgery. J Clin Endocrinol Metab 2018; 103:4104–4112 [DOI] [PMC free article] [PubMed] [Google Scholar]
- 36.Czepiel KS, Perez NP, Campoverde Reyes KJ, Sabharwal S, Stanford FC. Pharmacotherapy for the Treatment of Overweight and Obesity in Children, Adolescents, and Young Adults in a Large Health System in the US. Front Endocrinol (Lausanne) 2020; 11:290. [DOI] [PMC free article] [PubMed] [Google Scholar]
Associated Data
This section collects any data citations, data availability statements, or supplementary materials included in this article.
Data Availability Statement
The data that support the findings of this study are available from the corresponding author upon reasonable request.