

Abstract
Background:
To assess whether vitamin D3 supplementation attenuates decline in daily physical activity in low functioning adults at risk for falls.
Methods:
Secondary data analyses of STURDY (Study to Understand Fall Reduction and Vitamin D in You), a response-adaptive randomized clinical trial. Participants included 571 adults aged 70 years and older with baseline serum 25(OH)D levels of 10–29ng/mL and elevated fall risk, who wore a wrist accelerometer at baseline and at least one follow-up visit and were randomized to receive: 200IU/day (control), 1000IU/day, 2000IU/day, or 4000IU/day of vitamin D3. Objective physical activity quantities and patterns (total daily activity counts, active minutes/day, and activity fragmentation) were measured for 7-days, 24-hours/day, in the free-living environment using the Actigraph GT9x over up to 24-months of follow-up.
Results:
In adjusted models, physical activity quantities declined (p<0.001) and became more fragmented, or “broken up”, (p=0.017) over time. Supplementation with vitamin D3 did not attenuate this decline. Changes in physical activity were more rapid among those with baseline serum 25(OH)D <20ng/mL compared to those with baseline 25(OH)D levels of 20–29ng/mL (time*baseline 25(OH)D, p<0.05).
Conclusion:
In low-functioning older adults with serum 25(OH)D levels 10–29ng/mL, vitamin D3 supplementation of 1000 IU/day or higher did not attenuate declines in physical activity compared with 200 IU/day. Those with baseline 25(OH)D <20ng/mL showed accelerated declines in physical activity. Alternative interventions to supplementation are needed to curb declines in physical activity in older adults with low serum 25(OH)D.
Keywords: Physical activity, Serum vitamin D, Vitamin D supplementation, Accelerometry
Introduction
Low serum vitamin D in older adults has been associated with reduced physical performance, accelerated declines in muscle strength and physical functioning, and increased risk of falls.1–3 Consistent with this evidence, low levels of vitamin D have also been associated with low physical activity,4,5 which may exacerbate functional deficits, hastening the onset of frailty and disability.6 In observational studies, there is often a direct association between physical activity and serum vitamin D levels, independent of the effects of sun exposure.7–10 However, the majority of these studies used questionnaires to assess daily quantity and intensity of physical activity, which may be confounded by recall bias and difficulty quantifying time spent in light-intensity activities, especially among older adults.11 For objectively measured physical activity, data from the National Health and Nutrition Examination Survey (NHANES) have shown strong cross-sectional associations between accelerometer-measured physical activity and serum vitamin D, but these analyses have been mainly limited to intensity-driven activity metrics, such as time spent in moderate or greater intensity activities,12 which may not adequately capture the light intensity activities in which most older adults engage.11 Further, the cross-sectional nature of this work limits inferences about temporality, specifically whether older adults with lower serum vitamin D experience faster declines in physical activity over time. After some trials reported that vitamin D supplementation may increase fall risk,13,14 it was postulated that vitamin D supplementation might increase physical activity leading to a higher risk of falls; yet to date, this theory has not been objectively tested.
In 2014, the National Institute on Aging funded the Study To Understand Fall Reduction and Vitamin D in You (STURDY) to identify the best dose of vitamin D3 supplementation to prevent falls (primary outcome) in older adults, with a secondary outcome of gait speed. To better understand potential mechanisms contributing to falls and function in this population, physical activity was measured using accelerometers at baseline and during follow-up through supplemental funding from the National Institutes of Health Office of Dietary Supplements. Specifically, accelerometers were used to measure total daily physical activity volume and intensity, time spent physically active per day, and patterns of physical activity fragmentation, measures associated with low physical functioning and mortality in older adults.15,16
The primary findings from STURDY indicated that higher vitamin D3 supplementation (doses of 1000, 2000, and 4000IU/d) did not prevent falls compared with the control dose (200IU/d), and that gait speed in the higher doses group did not differ from gait speed in the control group.17 Although these findings suggest no improvement in falls or function, an important secondary consideration is whether vitamin D3 supplementation attenuated age-related declines in physical activity, which may have longer-term benefits on health and functional status. Accordingly, this manuscript examined the association between randomized vitamin D3 dose and objectively measured physical activity in STURDY participants. We hypothesized that low levels of serum vitamin D would be associated with lower levels and adverse patterns of physical activity and that participants randomized to receive higher doses of supplemental vitamin D3 would experience less decline in physical activity over follow-up.
Methods
The trial protocol was approved by the Johns Hopkins University Institutional Review Board, and all participants provided written informed consent. A data and safety monitoring board approved the protocol and monitored the trial.
Setting
The rationale and design of STURDY and the primary outcome results have been reported.17,18 Briefly, STURDY was a seamless two-stage Bayesian response-adaptive, randomized dose-finding trial in older persons with low serum 25-hydroxyvitamin D (25(OH)D). Participants were randomized to once-daily doses of 200IU/d (control), 1000IU/d, 2000IU/d, or 4000IU/d of vitamin D3. During the dose-finding stage, the 1000IU/d dose was associated with the lowest falls rate and selected as the best of the non-control doses. After the dose-finding stage, participants who had been randomized to 2000IU/d or 4000IU/d were switched to 1000IU/d, and new enrollees were randomized 1:1 to either 1000IU/d or control. The data and safety monitoring board (DSMB) recommended termination of the trial on 2/8/2019 after review of trial data indicated sufficient power to address the primary research question of vitamin D3 supplementation and falls. Randomization began on 10/30/2015 and ended on 2/11/2019; data collection ended on 5/31/2019.
Participants
Eligible participants were community-dwelling older adults aged ≥70 years with elevated fall risk and 25(OH)D levels in the low or deficient range (10–29 ng/mL).19 Elevated fall risk was defined as reporting one or more of the following: an injurious fall in the past year, multiple (≥2) falls in the past year, fear of falling due to balance or walking difficulties, balance problems, or use of an assistive device for walking. Persons who reported taking ≤1000IU/d of vitamin D supplements were eligible if their 25(OH)D level was 10–29 ng/mL, and they agreed to continue taking the same dose throughout the trial.
Exclusion criteria included cognitive impairment (Mini-Mental State Examination score <24); hypercalcemia; kidney, bladder or ureteral stone (1 recent or ≥2 lifetime); and use of personal vitamin D supplement >1000IU/d or calcium supplements >1200mg/d. Participants were enrolled at two centers (Hagerstown, MD and Woodlawn, MD) at approximately 39° latitude. Participants attended clinic visits at baseline, 3-, 12-, and 24-months post-randomization and completed telephone visits at 1, 6, 9, 15, 18, and 21 months. At each of these visits, study staff assessed medical events, compliance with supplements, and falls occurrence.
Treatment and Randomization
Pills for all vitamin D3 doses (200IU/d [control], 1000IU/d, 2000IU/d, and 4000IU/d) had identical appearance and were manufactured by Continental Vitamin Company (Vernon, CA). The rationale for these dose levels was explained previously.17,18 At randomization, each participant was issued a bottle of 100 study pills, and study staff issued replacement bottles consistent with the participant’s dose assignment every 3 months. A single pill was taken daily. Duration of pill-taking and follow-up was 24-months or until the end of the trial, whichever came first. Pill compliance was documented by participants using study calendars.
Eligible participants were randomized to one of the four vitamin D3 doses. Assignments were generated centrally using a web-based application and a computer-generated random number. The probability of assignment to the 200IU/d group was 0.50. At the start of the trial, each of the higher non-control dose groups (1000, 2000, and 4000IU/d) had equal probability of assignment (0.1667). In March 2018, 1000IU/d was identified as the best non-control dose for preventing falls, and participants randomized to 2000IU/d or 4000IU/d were subsequently switched to 1000IU/d, and new enrollees were randomized 1:1 to 1000IU/d or control. Participants and study personnel were blinded to randomized dose and transition from the dose-finding to the confirmatory stage.
Assessments
Participant demographics and health status
Reported sociodemographic and behavioral information were collected at baseline. Body mass index (BMI; kg/m2) was calculated according to standard procedures using measured weight (digital scale) and height (wall-mounted stadiometer). History of chronic conditions was assessed at baseline by asking participants whether a physician ever told them they had any of the following conditions: cancer, heart disease, high cholesterol, high blood pressure, stroke, peripheral vascular disease, chronic obstructive pulmonary disease, diabetes, kidney disease, liver disease, connective tissue disease, arthritis, Parkinson’s disease, or multiple sclerosis. Physical performance was assessed at baseline and at 3-, 12-, and 24-months after randomization using the Short Physical Performance Battery (SPPB), which consists of tests of balance, gait speed, and chair rises.
Physical activity assessment
Physical activity was not a pre-specified outcome in STURDY. Physical activity was assessed at baseline, 3-, 12-, and 24-months using an Actigraph GT9x wrist-worn physical activity monitor (ActiGraph Corp., Pensacola, FL). At each clinic visit, participants were given the accelerometer and asked to wear the device continuously for the following seven days, removing it only for periods of swimming or bathing lasting longer than 30 minutes. After the seven-day period, participants returned the device to the clinical center via pre-addressed, pre-paid mailers. Participants who reported using a walker or scooter for daily ambulation were excluded from the accelerometry portion of the study due to the potential for measurement error at the wrist location.11
Data were downloaded from the devices and transferred in their raw file format to the accelerometry reading center at the Johns Hopkins Center on Aging and Health. Raw data were converted to minute-level epochs of activity counts, and periods of ≥90 minutes of consecutive zero-value observations were labeled as missing due to non-wear.20 Days with >144 minutes missing (10% of the day) were labeled as invalid and removed.21 A minimum of three valid days was required for inclusion in the analysis.11,21 For periods of missing data on valid days (<10% of the day missing), the average activity counts observed in the same time period/minutes from other valid days were imputed.22
Physical activity outcomes
Three physical activity outcomes featuring activity volume and patterns were assessed: total activity counts per day, active minutes per day, and activity fragmentation.
Total daily activity volume was assessed using total activity counts per day (TAC), defined as a sum of activity counts observed on valid days divided by the number of valid days.22 An active state was defined as activity counts ≥1853 counts/minute and a non-active state was defined as activity counts <1853 counts/minute.21,23 Active minutes/day was defined as the number of minutes where activity counts exceeded 1853 counts/minute each day and averaged across valid days.21
A measure of activity fragmentation, the active-to-sedentary transition probability (ASTP) was calculated by quantifying each participant’s active and sedentary time on a minute-by-minute basis (12:00 am – 11:59 pm) for each valid day.15 Bout length was defined as the number of consecutive minutes spent in either an active or a sedentary state, and a daily activity profile was created for each participant to detect alternating bouts of sedentary and active states. ASTP was defined as the probability of transitioning from an active minute to a sedentary state in the next minute, calculated as the reciprocal of the average active bout duration, and expressed as a percentage.15 ASTP was averaged across valid days to derive a single measure of activity fragmentation for each participant, with higher scores indicating higher activity fragmentation.
Statistical analysis
Participants’ characteristics at study entry were examined using means, standard deviations, medians, and interquartile ranges (IQR) for continuous variables and frequencies and percentages for categorical variables by randomized treatment assignment and across the total sample. Means and standard deviations of physical activity metrics (TAC, ASTP, and active minutes) were examined at baseline and follow-up visits. The intraclass correlation (ICC) and rate of change in all physical activity metrics across time were examined in the total sample (Table 2).
Table 2:
Consistency and rate of change in physical activity across time (n=571)
| Variable | Correlation: Baseline with 3-mos |
Intraclass Correlation | Unadjusted Slope* | P-value for Slope |
Adjusted Slope* | P-value |
|---|---|---|---|---|---|---|
| TAC | 0.86 | 0.86 | −43,353 | <.0001 | −42,019 | <0.0001 |
| Active Time | 0.83 | 0.83 | −7.86 | <0.001 | −7.67 | <0.0001 |
| ASTP | 0.85 | 0.82 | 0.003 | 0.010 | 0.003 | 0.017 |
TAC = total activity counts, Active Time = minutes per day spent at or above an activity threshold of 1853 counts/min, ASTP = Activity fragmentation defined by the active-to-sedentary transition probability
Time effect from linear mixed effects models with random intercept and slope. Age, sex, and race (non-white vs. white), BMI, number of comorbidities, and history of falls (fell vs. did not fall) were adjusted to derive the adjusted slope.
Linear mixed-effects models were used to examine changes in physical activity at follow-up visits across vitamin D3 dose groups (Table 3, sTable 2, sTable 3). The models comprised fixed effects including baseline physical activity level, dose group, time, dose group-by-time interaction, baseline serum 25(OH)D level, baseline serum 25(OH)D level-by-time interaction, and baseline serum 25(OH)D level-by-dose group interaction terms, as well as random intercepts and slopes. Time was defined as years from baseline (0 for baseline, 0.25 for 3 months, 1 for 12 months, and 2 for 24 months). Baseline serum 25(OH)D level was dichotomized into 10–19 ng/mL and 20–29 ng/mL, and the 10–19 ng/mL level compared to the 20–29 ng/mL level. An unstructured covariance matrix was used to account for within-subject correlation, and restricted maximum likelihood (REML) estimation were used to fit the models. Model 1 presents the unadjusted associations between vitamin D3 dose and physical activity. Model 2 is adjusted for age, sex, and race (non-white vs. white), and Model 3 additionally adjusts for BMI, number of comorbidities, and history of falls. The model deviance, Akaike Information Criteria (AIC), and Bayesian Information Criteria (BIC) were calculated for model comparison.
Table 3.
Linear mixed models of physical activity over time comparing the pooled higher doses group (≥1000 IU/d) versus the control group (200 IU/d).
| Model 1 (n=571) | Model 2 (n=566) | Model 3 (n=565) | |||||||
|---|---|---|---|---|---|---|---|---|---|
| Variable | B | SE | p value | B | SE | p value | B | SE | p value |
| TAC | |||||||||
| Baseline TAC | 0.859 | 0.019 | <0.001 | 0.839 | 0.021 | <0.001 | 0.826 | 0.021 | <0.001 |
| Timea | −24979 | 15705 | 0.113 | −23612 | 15729 | 0.134 | −23810 | 15727 | 0.131 |
| Dose group | 6476 | 29607 | 0.827 | 5962 | 29695 | 0.841 | 7817 | 29686 | 0.793 |
| Dose group*timea | −10099 | 19750 | 0.610 | −11332 | 19811 | 0.568 | −10886 | 19838 | 0.584 |
| Serum vitamin Db | 7004 | 37293 | 0.851 | −1407 | 37584 | 0.970 | −2507 | 37506 | 0.947 |
| Time*serum vitamin D | −41911 | 21109 | 0.048 | −40534 | 21166 | 0.057 | −40302 | 21179 | 0.058 |
| Dose group*serum vitamin D | 12713 | 48377 | 0.793 | 20458 | 48591 | 0.674 | 21146 | 48433 | 0.663 |
| ASTP (%) | |||||||||
| Baseline ASTP | 0.842 | 0.021 | <0.001 | 0.817 | 0.022 | <0.001 | 0.808 | 0.022 | <0.001 |
| Timea | 0.307 | 0.231 | 0.185 | 0.290 | 0.231 | 0.209 | 0.287 | 0.230 | 0.213 |
| Dose group | 0.093 | 0.378 | 0.807 | 0.063 | 0.379 | 0.869 | 0.037 | 0.381 | 0.922 |
| Dose group*timea | −0.043 | 0.290 | 0.882 | −0.055 | 0.290 | 0.851 | −0.073 | 0.291 | 0.803 |
| Serum vitamin D | −0.023 | 0.477 | 0.962 | 0.057 | 0.480 | 0.905 | 0.066 | 0.481 | 0.892 |
| Time*serum vitamin D | 0.607 | 0.310 | 0.051 | 0.627 | 0.310 | 0.045 | 0.636 | 0.310 | 0.042 |
| Dose group*serum vitamin D | −0.486 | 0.624 | 0.437 | −0.567 | 0.624 | 0.364 | −0.573 | 0.624 | 0.360 |
| Active time (min/day) | |||||||||
| Baseline active time | 0.844 | 0.021 | <0.001 | 0.828 | 0.022 | <0.001 | 0.820 | 0.022 | <0.001 |
| Timea | −4.93 | 3.44 | 0.153 | −4.66 | 3.45 | 0.177 | −4.76 | 3.44 | 0.168 |
| Dose group | −0.643 | 6.15 | 0.917 | −0.525 | 6.19 | 0.933 | 0.021 | 6.19 | 0.997 |
| Dose group*timea | 1.42 | 4.33 | 0.742 | 1.21 | 4.34 | 0.782 | 1.08 | 4.34 | 0.805 |
| Serum vitamin D | 0.443 | 7.71 | 0.954 | −0.636 | 7.80 | 0.935 | −0.940 | 7.79 | 0.904 |
| Time*serum vitamin D | −11.80 | 4.63 | 0.011 | −11.57 | 4.64 | 0.013 | −11.41 | 4.64 | 0.015 |
| Dose group*serum vitamin D | 7.83 | 9.85 | 0.428 | 8.63 | 9.93 | 0.386 | 8.75 | 9.92 | 0.379 |
Note. N=571. TAC = total activity counts, ASTP = Activity fragmentation defined by the active-to-sedentary transition probability
Time=0 at baseline, 0.25 at 3 months follow-up visit, 1 at 12 months follow-up visit, and 2 at 24 months follow-up visit.
Linear mixed effects model with random intercept and slope, using unstructured correlation structure. Model 1 was the unadjusted model; Model 2 was adjusted for age, sex, and race (non-white vs. white); Model 3 was additionally adjusted for BMI, number of comorbidities, and history of falls (fell vs. did not fall).
Baseline serum vitamin D at 10–19 ng/mL (deficient) vs. 20–29 ng/mL (low).
The primary comparison was between the pooled higher doses (≥1000IU/d) group and the control group (200IU/d) (Table 2). This comparison allowed use of data from all randomized participants regardless of dose assignment across all available assessments, and also assessed the effectiveness of the “best dose” for preventing falls, as described in the STURDY main results paper.17 Two sensitivity analyses were also conducted to compare the control group to: (1) participants randomized to 1000IU/d (the “pure 1000IU/d group”) (sTable 2), and (2) each higher dose (1000IU/d, 2000IU/d, and 4000IU/d) among participants in the “burn-in cohort”, which refers to the group of participants randomized before any adaptions of the randomization probabilities to the three higher doses began as part of the trial’s dose-finding stage (sTable 3).17 For those randomized to receive 2000IU/d or 4000IU/d, only data obtained prior to switching to 1000IU/d was used.
All statistical analyses were conducted in SAS 9.4 (Cary, NC) or R-v3 6.0 (https://www.r-project.org/), with significance set as 0.05.
Results
Study Population
Of the 688 randomized participants, 670 participants were eligible and wore an accelerometer (Figure 1). Of these participants, 645 (96.2%) wore the accelerometer for the required three or more days at one or more visits. The final longitudinal analytical sample included 571 participants who wore an accelerometer at baseline and at least one follow-up visit. Table 1 shows the baseline characteristics of these 571 participants overall and by randomized dose of vitamin D3 (pooled higher doses and control), and sTable 1 by baseline serum 25(OH)D level. The overall study population was aged 77.2 years on average, of which 56.4% were men, and 16.4% were Black adults. Participants averaged 2.0 (1.2) comorbid conditions, the most common being hypertension, cardiovascular disease, arthritis, and diabetes. All other conditions were relatively rare, with a prevalence of <10%. Serum 25(OH)D averaged 22.0 (5.1) ng/mL and 37.5% of participants reported taking a vitamin D supplement at study entry. Participants were lower functioning, with 64.1% reporting a fall in the past year and a mean SPPB score of 8.8 (2.4). Total daily activity counts at baseline averaged 1,911,732 (573,548) counts/day, with 388.3 (109.6) minutes of daily active time and an activity fragmentation index of 26.1 (6.9) %. Average follow-up time was 1.3 (0.7) years.
Figure 1:
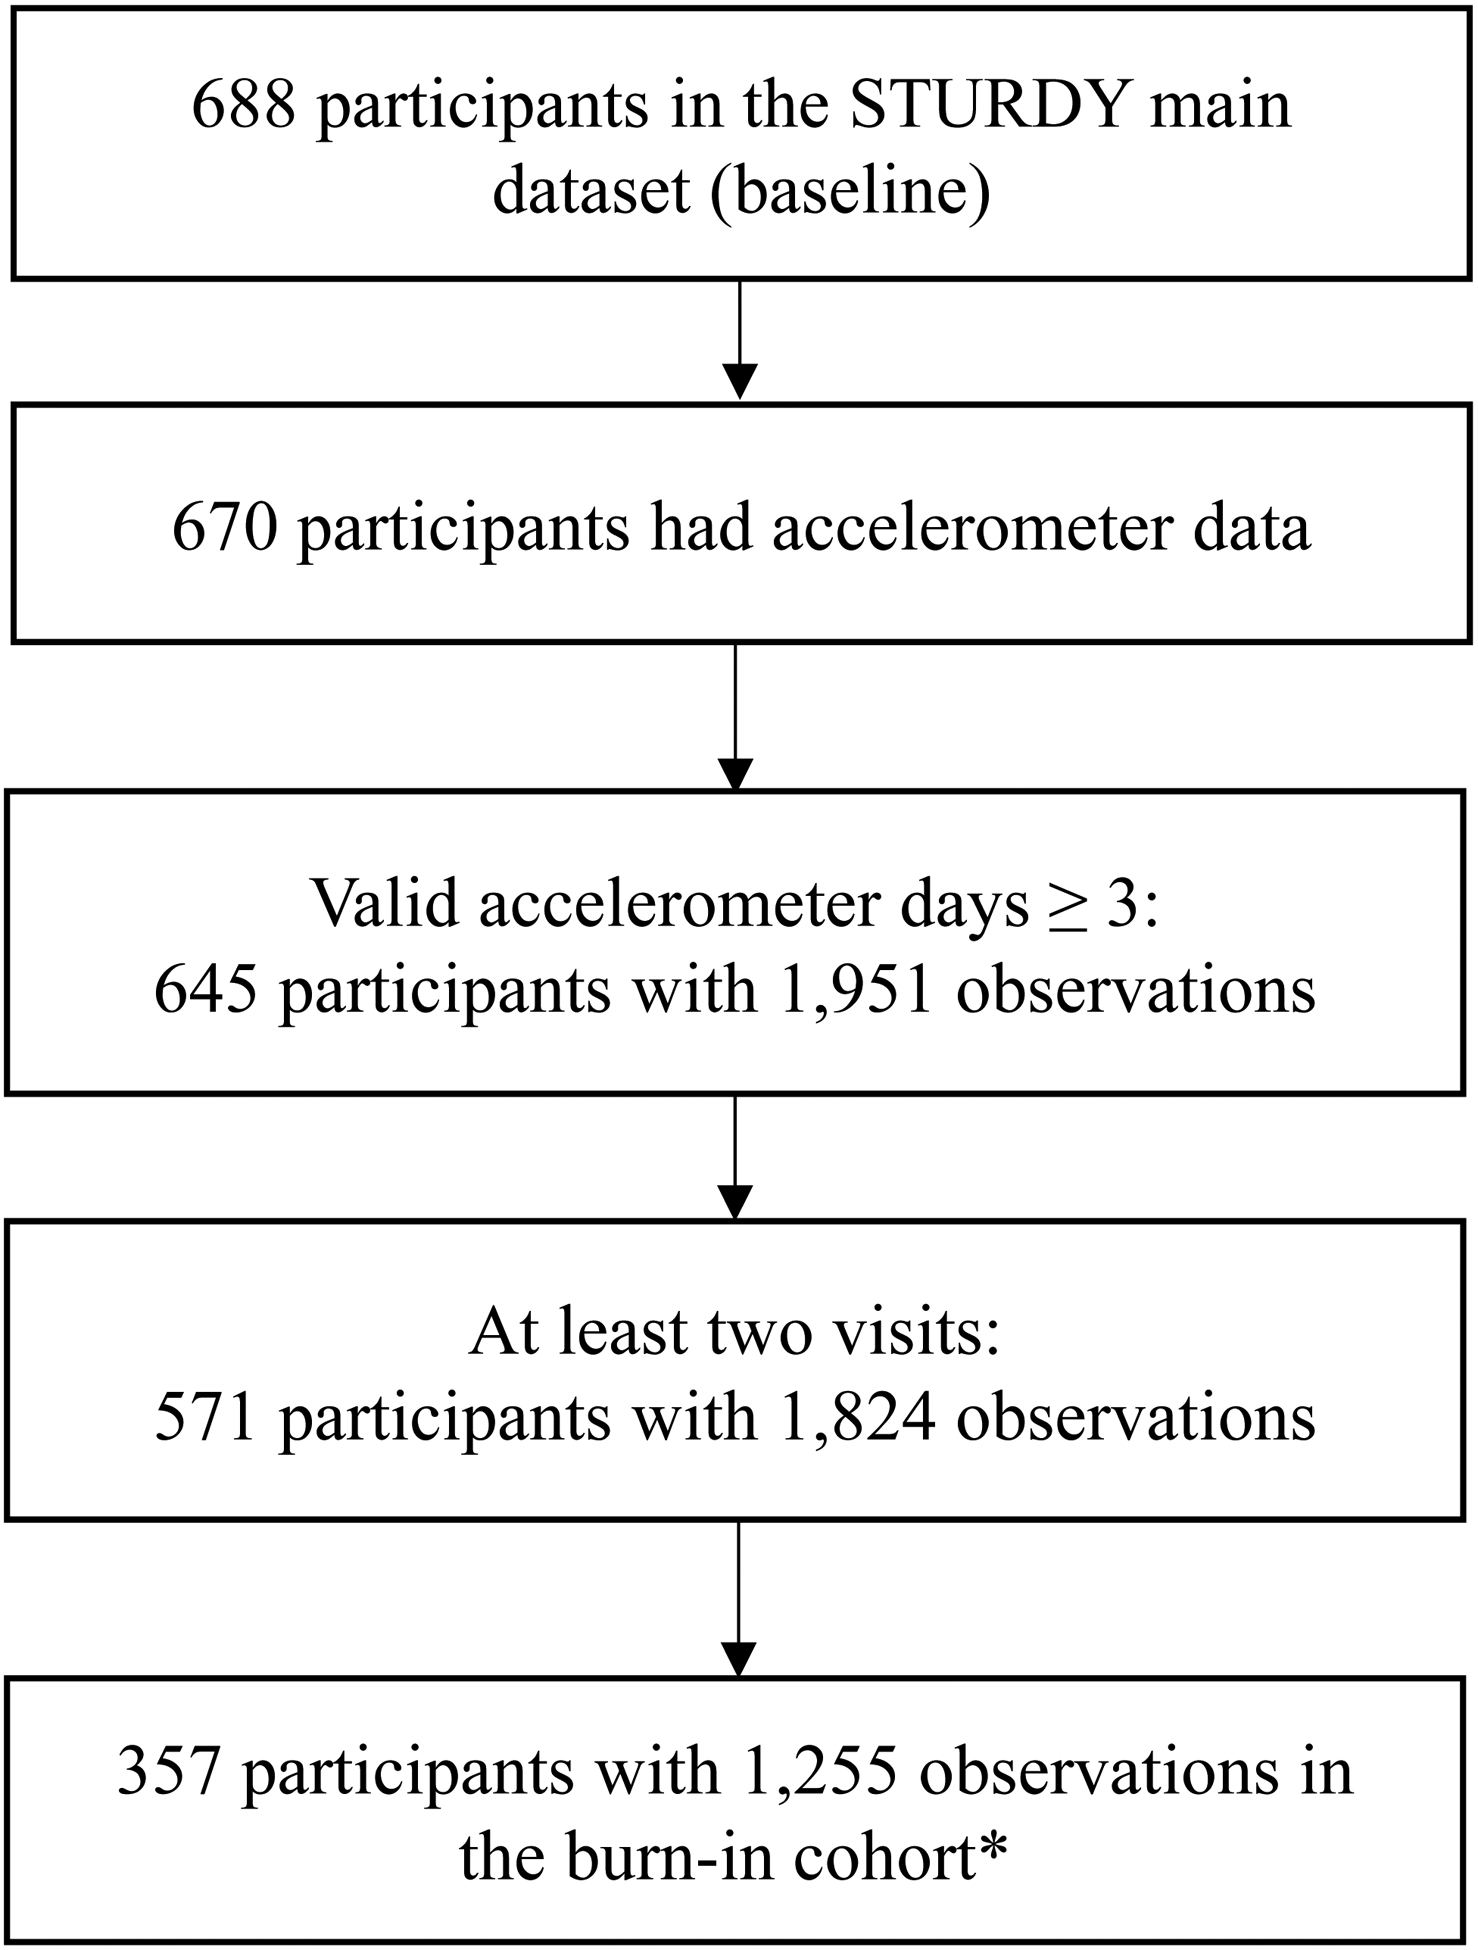
Flow chart from total STURDY sample to analytic sample
*In this trial with a response-adaptive design, the burn-in cohort is an unbiased sample to explore the relation of the 4 vitamin D doses with outcomes.
Table 1.
Characteristics of STURDY accelerometer participants at enrollment by vitamin D3 dose (n=571).
| All (N=571) |
Primary Analysis Population (all doses IU/d; N=571) |
||
|---|---|---|---|
| Pooled Higher Dosesa
(N=293) |
Control (200 IU/d) (N=278) |
||
| Age (years), mean (SD) | 77.2 (5.3) | 77.2 (5.3) | 77.2 (5.3) |
| Sex, no. (%) | |||
| Male | 322 (56.4) | 163 (55.6) | 159 (57.2) |
| Female | 249 (43.6) | 130 (44.4) | 119 (42.8) |
| Race, no. (%)b | |||
| White | 457/566 (80.7) | 229/291 (78.7) | 228/275 (82.9) |
| Black | 93/566 (16.4) | 50/291 (17.2) | 43/275 (15.6) |
| Other | 19/566 (3.4) | 13/291 (4.5) | 6/275 (2.2) |
| BMI (kg/m2), mean (SD) | 30.6 (6.1) (570/571) | 30.6 (5.8) (292/293) | 30.6 (6.4) |
| Chronic conditions, no. (%) | |||
| Cardiovascular disease/PAD | 178 (31.2) | 87 (29.7) | 91 (32.7) |
| Hypertension | 366 (64.1) | 197 (67.2) | 169 (60.8) |
| Stroke | 35 (6.1) | 15 (5.1) | 20 (7.2) |
| Lung disease | 48 (8.4) | 27 (9.2) | 21 (7.6) |
| Diabetes | 150 (26.3) | 87 (29.7) | 63 (22.7) |
| Kidney disease | 17 (3.0) | 8 (2.7) | 9 (3.2) |
| Liver disease | 36 (6.3) | 22 (7.5) | 14 (5.0) |
| Arthritis | 312 (54.6) | 161 (55.0) | 151 (54.3) |
| Parkinson’s disease | 8 (1.4) | 4 (1.4) | 4 (1.4) |
| Multiple sclerosis | 2 (0.4) | 0 | 2 (0.7) |
| Number of comorbidities, Mean (SD) | 2.0 (1.2) | 2.1 (1.2) | 2.0 (1.2) |
| Serum vitamin D (ng/mL)c | |||
| 10 to 19 ng/mL, no. (%) | 168 (29.4) | 83 (28.3) | 85 (30.6) |
| 20 to 29 ng/mL, no. (%) | 403 (70.6) | 210 (71.7) | 193 (69.4) |
| Mean (SD) | 22.0 (5.1) | 22.0 (4.9) | 22.0 (5.2) |
| Taking a personal vitamin D supplement, no. (%) | 214 (37.5) | 112 (38.2) | 102 (36.7) |
| Fell ≥1 time in prior year, no. (%) | 366 (64.1) | 191 (65.2) | 175 (63.0) |
| SPPBd total score | |||
| Mean (SD) | 8.8 (2.4) | 8.7 (2.4) | 8.9 (2.4) |
| Physical Activity Variables, Mean (SD) | |||
| TACe | 1,911,732 (573,548) | 1,821,141 (552,249) | 1,883,496 (609,331) |
| Active time/d (min)e | 388.26 (109.55) | 373.93 (110.05) | 380.32 (117.48) |
| ASTP (%)e | 26.09 (6.89) | 26.34 (7.13) | 26.56 (7.66) |
Abbreviations: IU/d = international units per day; SD = standard deviation; IQR = interquartile range; SPPB = Short Physical Performance Battery; BMI = body mass index.
Note: The burn-in cohort (participants randomized before any adjustments were made to randomization probabilities) was randomized between October 2015 and August 2, 2018.
Pooled Higher Doses denotes the combined 1000, 2000, and 4000IU/d groups.
Race was self-reported from a list of 5 categories (American Indian or Alaska Native, Asian, Black or African American, Native Hawaiian or other Pacific Islander, White); more than one race could be reported by a participant.
The range of serum vitamin D level eligible for STURDY (10–29 ng/mL) includes levels termed deficient (<20 ng/mL) or insufficient (20–29 ng/mL) by the Endocrine Society and overlaps with levels termed deficient (<12 ng/mL), inadequate (12–19ng/mL), or adequate (>=20) by the Institute of Medicine.
The Short Physical Performance Battery (SPPB) is a 3-part assessment of physical functioning: balance testing, 4-meter walk, and demonstration of ability to complete 5 chair stands (stand up from a seated position in a chair); each part is scored 0 to 4 and the total SPPB score (range 0 to 12) is the sum of the 3 subscores. Higher scores indicate better physical function.
TAC = Total Activity Counts; ASTP = Activity fragmentation defined by the active-to-sedentary transition probability; Active time/d = minutes per day spent at or above an activity threshold of 1853 counts/min.
Effects of Vitamin D Supplements on Physical Activity
The results of the linear mixed models for the pooled higher doses (≥1000 IU/d) versus control (200 IU/d) are shown in Tables 2 & Tables 3, with progressive covariate adjustment. Fitted plots for the models are shown in Figure 2. Across all models, total daily activity (TAC and time spent active) tended to decline and become more fragmented (ASTP) over time (p<0.02 for all, Table 2 for slope, Figure 2). There was no significant effect of vitamin D supplementation on any of the PA outcomes as indicated by each dose group*time interaction term (p>0.05 for all, Table 3). Sensitivity analyses for the pure 1000 IU/d group versus control (sTable 2) and for the burn-in cohort (sTable 3) also did not suggest any differences by vitamin D dose.
Figure 2.
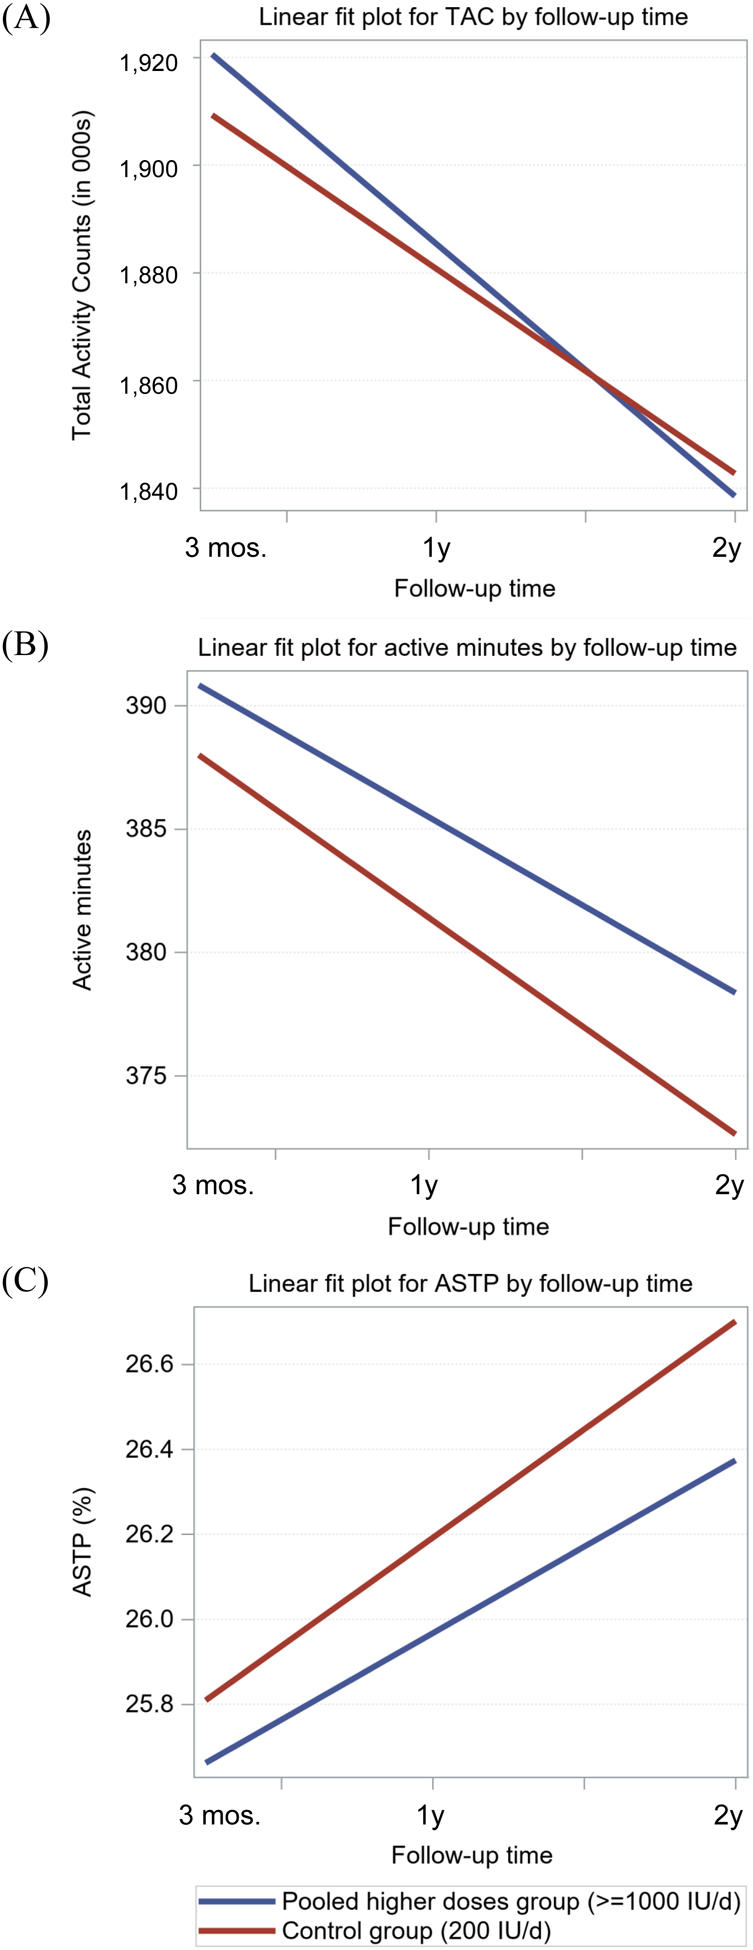
Fitted plots for linear mixed effects models comparing decline in physical activity measures over follow-up in the pooled higher doses group (≥1000 IU/d, blue line) to the control group (200 IU/d, red line). Panel (A): Total Activity Counts (TAC, in 000s), Panel (B): Active Time (minutes per day), Panel (C): Active to Sedentary Transition Probability (ASTP, %).
Association Between Baseline Serum 25(OH)D and Physical Activity
In the pooled higher doses versus control analysis (Table 3), a significant time*serum 25(OH)D interaction for active time/day and for activity fragmentation suggests that those with baseline serum 25(OH)D <20 ng/mL declined faster in active time (β=−11.4 min/day, p=0.02, sFigure 1) and became more fragmented (β=0.6%, p=0.04, sFigure 1) over time compared to those with baseline serum 25(OH)D of 20–29 ng/mL, in fully adjusted models (Model 3). Similar results were seen comparing the pure 1000 IU/d group versus control (sTable 2); those with baseline serum 25(OH)D <20 ng/mL declined faster in TAC (β=−57,937 counts/day, p=0.03) and active minutes (β=−15.1 min/day, p=0.008), and had faster increases in activity fragmentation (β=0.8%, p=0.03) over time (Model 3). Similar trends were seen in the burn-in cohort (sTable 3), although results were less defined due to a smaller sample size. Three-way interactions between time, baseline serum 25(OH)D, and dose group were not significant and removed from all models.
Discussion
Among low functioning older adults at risk for falls, physical activity declined over up to 24-months of follow-up. Decline was greater among those with baseline serum 25(OH)D < 20 ng/mL compared to serum 25(OH)D of 20–29 ng/mL. Supplementation with vitamin D3 did not attenuate this decline. These results are consistent with the main STURDY trial findings of no effect of vitamin D3 supplementation on falls or gait speed,17 and suggest that alternative interventions to supplementation alone are needed to curb declines in physical activity and functioning in older adults with low or deficient 25(OH)D.
Interest in the association between vitamin D and health has persisted over the past decade, mainly due to the high prevalence of vitamin D deficiency in the United States. In the 2014–2015 NHANES cycle, approximately 25% of the US population was estimated to be vitamin D deficient (<30 nmol/L), with lower rates of deficiency or insufficiency among persons who used supplements or had higher dietary intake of vitamin D.24 Multiple observational studies have linked low vitamin D status with reduced levels of physical activity and poor health outcomes, yet the results of numerous interventions have proved null for all-cause mortality, fractures, incidence of diabetes, cardiovascular events and cancer, falls, depression, and physical function.17,25–28 The current results confirm previous observational evidence linking low serum vitamin D (<30 ng/mL) with lower daily physical activity12 and expand on these results by demonstrating a faster rate of decline over time among those with 25(OH)D <20 ng/mL. Importantly, these results suggest low serum vitamin D may reflect a state of physiologic decline that confers a high risk of multiple adverse health outcomes. Unfortunately, the current study also suggests daily vitamin D supplementation does not attenuate this decline, and adds to the growing body of literature showing no benefits of daily supplementation for those with asymptomatic low 25(OH)D.26
Physical activity is a central component of functional independence that is essential to maintaining quality of life and healthy longevity with aging. In the current study, mean total activity and time spent active per day were 1,911,732 counts and 388 minutes (6.5 hours), respectively, suggesting a high proportion of the day (≥17.5 hours) was spent in sedentary behaviors or asleep. Although normative data for longitudinal changes in objectively measured physical activity are not well-established, cross-sectional data suggest a 1.3% drop in daily physical activity for each one year higher of age from mid-to-late life in well-functioning older adults.22 The current results suggest a mean overall annual decline in TAC of 2.3%, with a steeper 3.5% annual decline among those with 25(OH)D <20 ng/mL at baseline. Further, analysis of activity patterns using activity fragmentation, or ASTP, suggest that daily activity is also more “broken up” into shorter bouts with a higher probability of transitioning into a sedentary state. Previous work has linked such patterns to poorer physical and cognitive health15,21, as well as a greater risk of frailty29 and mortality.16 Given that physical activity is extremely important to health and longevity in this vulnerable population, exploring other methods to enhance and maintain physical activity are warranted.
Strengths of the STURDY trial include its diverse population, high adherence and follow-up rates, enrollment of a low functioning population with low serum vitamin D levels, and objective measurement of physical activity across multiple time points. There are also limitations. First, because enrollment criteria required all participants to be low or deficient in 25(OH)D, the control group received 200IU/d of vitamin D3, not a placebo. Thus, we are unable to state whether participants would have declined more or less if they received no vitamin D. Second, persons taking up to 1000IU/d of vitamin D supplements were allowed to enroll, provided they met the low 25(OH)D requirement. Third, participants were aged 70 and older and at elevated risk for falls, and therefore, results may not be generalizable to other populations. Fourth, although physical activity was a prespecified outcome, it was not a primary or secondary outcome of the trial; however, it was rigorously assessed using accelerometry. Finally, the response-adaptive design assigned fewer participants to the 2000 and 4000IU/d groups as evidence of higher fall rates emerged in these two groups, lessening the power to detect potential longitudinal differences in physical activity at these higher doses.
Conclusion
We found no effects on physical activity from vitamin D supplementation at doses of 1000IU/d or higher compared with 200IU/d. Further, the results of this study do not support use of vitamin D supplements as a means to increase physical activity in older adults with clinically low serum 25(OH)D. More research is needed to understand the complex association of low or deficient serum 25(OH)D with poor or declining health, and potential therapeutic solutions. Importantly, when combined with other major trials with null results, these results suggest that low serum 25(OH)D reflects a state of physiologic decline that confers a high risk of multiple adverse health outcomes, making it a potential global marker of poor health for which supplementation provides little if any benefit.
Supplementary Material
sFigure 1. Fitted plots for linear mixed effects models comparing decline in physical activity measures over follow-up in the pooled higher doses group (≥1000 IU/d) to the control group (200 IU/d) by baseline serum vitamin D level (10–19 ng/mL (blue line) vs. 20–29 ng/mL (red line)). Panel (A): Total Activity Counts (TAC, in 000s), Panel (B): Active Time (minutes per day), Panel (C): Active to Sedentary Transition Probability (ASTP, %).
sTable 1. Characteristics of STURDY accelerometer participants at enrollment by serum 25(OH)D level (n=571).
sTable 2. Linear mixed models of physical activity comparing the pure 1000 IU/d group versus the 200 IU/d group
sTable 3. Linear mixed models of physical activity comparing four dose group groups in the burn-in cohort (n=357).
Key points:
Low serum 25-hydroxyvitamin [25(OH)D] is associated with low daily physical activity in older adults.
Low physical activity may hasten the onset of frailty and disability and increase risk of falls, but whether supplementation with vitamin D3 improves physical activity in older adults is unknown.
Decline in physical activity over up to 24-months of follow-up was greater among those with serum 25(OH)D <20 ng/mL compared to serum 25(OH)D of 20–29 ng/mL; Vitamin D supplementation did not attenuate this decline.
Why does this paper matter?
Alternative interventions to supplementation alone are needed to curb declines in physical activity in older adults with low or deficient 25(OH)D.
ACKNOWLEDGEMENTS
We thank all the participants of STURDY for their contributions to the trial. Members of the STURDY Collaborative Research Group are as follows:
Johns Hopkins University Centers
Welch Center for Prevention, Epidemiology and Clinical Research: Lawrence J. Appel, MD, MPH (chair); Nicole Cronin, MA; Stephen P. Juraschek, MD, PhD; Scott McClure, MS; Christine M. Mitchell, ScM; Timothy B. Plante, MD, MHS.
Center on Aging and Health: Rita R. Kalyani, MD, MHS; David L. Roth, PhD; Jennifer A. Schrack, PhD; Sarah L. Szanton, PhD; Jacek K. Urbanek, PhD; Jeremy Walston, MD; Amal A. Wanigatunga, PhD, MPH.
STURDY Data Coordinating Center: Sheriza N. Baksh, PhD; Amanda L. Blackford, ScM; Shumon Chattopadhyay, MSE; Lea T. Drye, PhD; John Dodge; Cathleen Ewing; Sana Haider, BS; Stephanie C. Holland, BS; Rosetta Jackson; Andrea Lears, BS; Curtis Meinert, PhD; David M. Shade, JD; Michael Smith, BS; Alice L. Sternberg, ScM; James Tonascia, PhD; Mark L. Van Natta, MHS; Annette Wagoner.
Clinical Field Centers, Johns Hopkins University
George W. Comstock Center for Public Health Research and Prevention: Erin D. Michos, MD, MHS (Site PI); J. Denise Bennett; Pamela Bowers; Josef Coresh, MD, PhD; Patricia Crowley, MS; Tammy Crunkleton; Briana Dick, BA; Rebecca Evans, RN; Mary Godwin; Lynne Hammann; Deborah Hawks; Karen Horning; Erika Hull; Brandi Mills; Melissa Minotti, MPH; Leann Raley; Amanda Reed, MS; Rhonda Reeder, RN; Cassie Reid; Melissa Shuda; Adria Spikes; Rhonda Stouffer; Kelly Weicht.
ProHealth Clinical Research Unit: Edgar R. Miller III, MD, PhD (Site PI); Caroline Abbas; Bernellyn Carey, BS; Jeanne Charleston, RN; Syree Davis; Naomi DeRoche-Brown; Debra Gayles; Sherlina Holland, MPH; Ina Glenn-Smith; Duane Johnson; Mia Johnson; Eva Keyes; Kristen McArthur; Danielle Santiago; Chanchai Sapun; Valerie Sneed; Lee Swartz, MBA; Letitia Thomas.
Clinical Core Research Laboratory, University of Maryland School of Medicine:
Robert H. Christenson, PhD; Show-Hong Duh, PhD; Heather Rebuck.
Data and Safety Monitoring Board (DSMB):
Clifford Rosen, MD (chair, Maine Medical Center Research Institute); Thomas Cook, PhD (University of Wisconsin); Pamela Duncan, PhD (Wake Forest Baptist Health); Karen E. Hansen, MD, MS (2016-2019, University of Wisconsin); Anne Kenny, MD (2014-2016, University of Connecticut); Sue Shapses, PhD, RD (Rutgers University).
National Institute on Aging (NIA):
Judy Hannah, PhD; Sergei Romashkan, MD.
Office of Dietary Supplements (ODS):
Cindy D. Davis, PhD; Christopher T. Sempos, PhD
Consultants:
Jack M. Guralnik, MD, PhD (University of Maryland School of Medicine); J.C. Gallagher, MD (Creighton University School of Medicine).
Conflict of Interest
Authors report NIH/NIA grant funding supporting their work and additional relevant NIH support as described in the Funding section.
FUNDING SOURCES
STURDY was funded by the National Institute on Aging (U01AG047837) with support from the Office of Dietary Supplements, the Mid-Atlantic Nutrition Obesity Research Center (P30DK072488), and the Johns Hopkins Institute for Clinical and Translation Research (UL1TR003098). Dr. Juraschek was supported by a National Institute of Diabetes and Digestive and Kidney Diseases training grant (T32DK007732) and a National Heart, Lung, and Blood Institute career development award (K23HL135273). The content is solely the responsibility of the authors and does not necessarily represent the official views of the National Institutes of Health. This paper is subject to the NIH Public Access Policy.
SPONSOR’S ROLE
The funding sources for this study played no role in the design or conduct of the study; collection, management, analysis, and interpretation of the data; and preparation, review, or approval of the manuscript.
References
- 1.Pojednic RM, Ceglia L. The emerging biomolecular role of vitamin D in skeletal muscle. Exercise and sport sciences reviews. 2014;42(2):76–81. doi: 10.1249/JES.0000000000000013 [doi] [DOI] [PMC free article] [PubMed] [Google Scholar]
- 2.Bischoff-Ferrari HA, Dietrich T, Orav EJ, et al. Higher 25-hydroxyvitamin D concentrations are associated with better lower-extremity function in both active and inactive persons aged > or =60 y. The American Journal of Clinical Nutrition. 2004;80(3):752–758. doi:80/3/752 [pii] [DOI] [PubMed] [Google Scholar]
- 3.Wicherts IS, Schoor NM van, Boeke AJ, et al. Vitamin D status predicts physical performance and its decline in older persons. The Journal of clinical endocrinology and metabolism. 2007;92(6):2058–2065. doi:jc.2006–1525 [pii] [DOI] [PubMed] [Google Scholar]
- 4.Birrell F, Francis RM. Invited Commentary: Physical Activity and Vitamin D. American Journal of Epidemiology. 2008;168:587. [Google Scholar]
- 5.Klenk J, Rapp K, Denkinger M, et al. Objectively measured physical activity and vitamin D status in older people from Germany. Journal of epidemiology and community health. Published online January 6, 2015. doi:jech-2014–204632 [pii] [DOI] [PubMed] [Google Scholar]
- 6.Manini TM, Everhart JE, Patel KV, et al. Activity energy expenditure and mobility limitation in older adults: differential associations by sex. American Journal of Epidemiology. 2009;169(12):1507–1516. doi: 10.1093/aje/kwp069; 10.1093/aje/kwp069 [DOI] [PMC free article] [PubMed] [Google Scholar]
- 7.Pfeifer M, Begerow B, Minne HW. Vitamin D and muscle function. Osteoporosis international : a journal established as result of cooperation between the European Foundation for Osteoporosis and the National Osteoporosis Foundation of the USA. 2002;13(3):187–194. doi: 10.1007/s001980200012 [doi] [DOI] [PubMed] [Google Scholar]
- 8.Scragg R, Jr CAC. Frequency of leisure-time physical activity and serum 25-hydroxyvitamin D levels in the US population: results from the Third National Health and Nutrition Examination Survey. American Journal of Epidemiology. 2008;168(6):91. doi: 10.1093/aje/kwn163 [doi] [DOI] [PMC free article] [PubMed] [Google Scholar]
- 9.Bell NH, Godsen RN, Henry DP, Shary J, Epstein S. The effects of muscle-building exercise on vitamin D and mineral metabolism. Journal of bone and mineral research : the official journal of the American Society for Bone and Mineral Research. 1988;3(4):369–373. doi: 10.1002/jbmr.5650030402 [doi] [DOI] [PubMed] [Google Scholar]
- 10.Scott D, Blizzard L, Fell J, Ding C, Winzenberg T, Jones G. A prospective study of the associations between 25-hydroxy-vitamin D, sarcopenia progression and physical activity in older adults. Clinical endocrinology. 2010;73(5):581–587. doi: 10.1111/j.1365-2265.2010.03858.x [doi] [DOI] [PubMed] [Google Scholar]
- 11.Schrack JA, Cooper R, Koster A, et al. Assessing Daily Physical Activity in Older Adults: Unraveling the Complexity of Monitors, Measures, and Methods. The journals of gerontologySeries A, Biological sciences and medical sciences. Published online March 8, 2016. doi:glw026 [pii] [DOI] [PMC free article] [PubMed] [Google Scholar]
- 12.Wanner M, Richard A, Martin B, Linseisen J, Rohrmann S. Associations between objective and self-reported physical activity and vitamin D serum levels in the US population. Cancer Causes Control. 2015;26(6):881–891. doi: 10.1007/s10552-015-0563-y [DOI] [PubMed] [Google Scholar]
- 13.Ginde AA, Blatchford P, Breese K, et al. High-Dose Monthly Vitamin D for Prevention of Acute Respiratory Infection in Older Long-Term Care Residents: A Randomized Clinical Trial. J Am Geriatr Soc. 2017;65(3):496–503. doi: 10.1111/jgs.14679 [DOI] [PMC free article] [PubMed] [Google Scholar]
- 14.Sanders KM, Stuart AL, Williamson EJ, et al. Annual high-dose oral vitamin D and falls and fractures in older women: a randomized controlled trial. Jama. 2010;303(18):1815–1822. doi: 10.1001/jama.2010.594 [doi] [DOI] [PubMed] [Google Scholar]
- 15.Schrack JA, Kuo PL, Wanigatunga AA, et al. Active-to-Sedentary Behavior Transitions, Fatigability, and Physical Functioning in Older Adults. J Gerontol A Biol Sci Med Sci. Published online October 24, 2018. doi: 10.1093/gerona/gly243 [DOI] [PMC free article] [PubMed] [Google Scholar]
- 16.Wanigatunga AA, Di J, Zipunnikov V, et al. Association of Total Daily Physical Activity and Fragmented Physical Activity With Mortality in Older Adults. JAMA Netw Open. 2019;2(10):e1912352. doi: 10.1001/jamanetworkopen.2019.12352 [DOI] [PMC free article] [PubMed] [Google Scholar]
- 17.Appel LJ, Michos ED, Mitchell CM, et al. The Effects of Four Doses of Vitamin D Supplements on Falls in Older Adults : A Response-Adaptive, Randomized Clinical Trial. Ann Intern Med. 2021;174(2):145–156. doi: 10.7326/M20-3812 [DOI] [PMC free article] [PubMed] [Google Scholar]
- 18.Michos ED, Mitchell CM, Miller ER, et al. Rationale and design of the Study To Understand Fall Reduction and Vitamin D in You (STURDY): A randomized clinical trial of Vitamin D supplement doses for the prevention of falls in older adults. Contemp Clin Trials. 2018;73:111–122. doi: 10.1016/j.cct.2018.08.004 [DOI] [PMC free article] [PubMed] [Google Scholar]
- 19.Holick MF, Binkley NC, Bischoff-Ferrari HA, et al. Evaluation, Treatment, and Prevention of Vitamin D Deficiency: an Endocrine Society Clinical Practice Guideline. The Journal of Clinical Endocrinology & Metabolism. 2011;96(7):1911–1930. doi: 10.1210/jc.2011-0385 [DOI] [PubMed] [Google Scholar]
- 20.Choi L, Ward SC, Schnelle JF, Buchowski MS. Assessment of wear/nonwear time classification algorithms for triaxial accelerometer. Medicine and science in sports and exercise. 2012;44(10):2009–2016. doi: 10.1249/MSS.0b013e318258cb36 [doi] [DOI] [PMC free article] [PubMed] [Google Scholar]
- 21.Wanigatunga AA, Wang H, An Y, et al. Association between brain volumes and patterns of physical activity in community-dwelling older adults. J Gerontol A Biol Sci Med Sci. Published online November 24, 2020. doi: 10.1093/gerona/glaa294 [DOI] [PMC free article] [PubMed] [Google Scholar]
- 22.Schrack JA, Zipunnikov V, Goldsmith J, et al. Assessing the “Physical Cliff”: Detailed Quantification of Age-Related Differences in Daily Patterns of Physical Activity. The journals of gerontologySeries A, Biological sciences and medical sciences. Published online December 14, 2013. doi: 10.1093/gerona/glt199 [DOI] [PMC free article] [PubMed] [Google Scholar]
- 23.Koster A, Shiroma EJ, Caserotti P, et al. Comparison of Sedentary Estimates between activPAL and Hip- and Wrist-Worn ActiGraph. Med Sci Sports Exerc. 2016;48(8):1514–1522. doi: 10.1249/MSS.0000000000000924 [DOI] [PMC free article] [PubMed] [Google Scholar]
- 24.Herrick KA, Storandt RJ, Afful J, et al. Vitamin D status in the United States, 2011–2014. Am J Clin Nutr. 2019;110(1):150–157. doi: 10.1093/ajcn/nqz037 [DOI] [PMC free article] [PubMed] [Google Scholar]
- 25.Kahwati LC, LeBlanc E, Weber RP, et al. Screening for Vitamin D Deficiency in Adults: Updated Evidence Report and Systematic Review for the US Preventive Services Task Force. JAMA. 2021;325(14):1443. doi: 10.1001/jama.2020.26498 [DOI] [PubMed] [Google Scholar]
- 26.US Preventive Services Task Force, Krist AH, Davidson KW, et al. Screening for Vitamin D Deficiency in Adults: US Preventive Services Task Force Recommendation Statement. JAMA. 2021;325(14):1436. doi: 10.1001/jama.2021.3069 [DOI] [PubMed] [Google Scholar]
- 27.Pludowski P, Holick MF, Pilz S, et al. Vitamin D effects on musculoskeletal health, immunity, autoimmunity, cardiovascular disease, cancer, fertility, pregnancy, dementia and mortality—A review of recent evidence. Autoimmunity Reviews. 2013;12(10):976–989. doi: 10.1016/j.autrev.2013.02.004 [DOI] [PubMed] [Google Scholar]
- 28.Guralnik JM, Sternberg AL, Mitchell CM, et al. Effects of Vitamin D on Physical Function: Results from the STURDY Trial. J Gerontol A Biol Sci Med Sci. Published online December 20, 2021:glab379. doi: 10.1093/gerona/glab379 [DOI] [PMC free article] [PubMed] [Google Scholar]
- 29.Wanigatunga AA, Cai Y, Urbanek JK, et al. Objectively measured patterns of daily physical activity and phenotypic frailty. J Gerontol A Biol Sci Med Sci. Published online September 25, 2021:glab278. doi: 10.1093/gerona/glab278 [DOI] [PMC free article] [PubMed] [Google Scholar]
Associated Data
This section collects any data citations, data availability statements, or supplementary materials included in this article.
Supplementary Materials
sFigure 1. Fitted plots for linear mixed effects models comparing decline in physical activity measures over follow-up in the pooled higher doses group (≥1000 IU/d) to the control group (200 IU/d) by baseline serum vitamin D level (10–19 ng/mL (blue line) vs. 20–29 ng/mL (red line)). Panel (A): Total Activity Counts (TAC, in 000s), Panel (B): Active Time (minutes per day), Panel (C): Active to Sedentary Transition Probability (ASTP, %).
sTable 1. Characteristics of STURDY accelerometer participants at enrollment by serum 25(OH)D level (n=571).
sTable 2. Linear mixed models of physical activity comparing the pure 1000 IU/d group versus the 200 IU/d group
sTable 3. Linear mixed models of physical activity comparing four dose group groups in the burn-in cohort (n=357).