

Abstract
Objective:
This study assessed contributing factors associated with dental Adverse Events (AEs).
Methods:
Seven EHR-based triggers were deployed identifying potential AEs at two dental institutions. From 4,106 flagged charts, two reviewers examined 439 charts selected randomly to identify and classify AEs using our dental AE type and severity classification systems. Based on information captured in the EHR, we analyzed harmful AEs to assess potential contributing factors; harmful AEs were defined as those that resulted in temporary moderate to severe harm, required hospitalization, or resulted in permanent moderate to severe harm. We classified potential contributing factors according to 1) who was involved (Person), 2) what were they doing (Tasks), 3) what tools/technologies were they using (Tools/technologies), 4) where did the event take place (Environment), 5) what organizational conditions contributed to the event? (Organization), 6) Patient (including parents), and 7) professional-professional collaboration. A blinded panel of dental experts conducted a second review to confirm the presence of an AE.
Results:
59 cases had ≥ 1 harmful AE. Pain occurred most frequently (27.1%), followed by nerve injury (16.9%), hard tissue injury (15.2%), and soft tissue injury (15.2%). 40% of the cases were classified as “temporary not moderate to severe harm”. Person (training, supervision, and fatigue) was the most common contributing factor (31.5%), followed by Patient (non-compliance, unsafe practices at home, low health literacy) (17.1%), and Professional-professional collaboration (15.3%).
Conclusions:
Pain was the most common harmful AE identified. Person, patient, and professional-professional collaboration were the most frequently assessed factors associated with harmful AEs.
Keywords: EHR, Dentistry, Adverse Event, Patient Safety, Contributing Factors, Root Cause Analysis, Human Factors, System Engineering, Systems Engineering Initiative for Patient Safety
Introduction
In the course of everyday treatment, some patients are inadvertently harmed and may suffer an adverse event (AE) as a result of their dental visit, such as serious lacerations, sublingual thrombosis and other injuries associated with high-speed handpieces1 as reported in the FDA MAUDE (Manufacturer and User Facility Device Experience) database2 and the literature.3 Other reported harms that may occur in the dental office include aspiration4 and edema due to sodium hypochlorite extrusion.5 Deaths associated with dental treatment have been documented in case reports3 and in the FDA MAUDE database.2 We report an analysis of potential contributing factors to such dental AEs, by adapting frequently used root cause analysis methodologies.
At the turn of the 21st century, the National Academy of Medicine’s (NAM),6 formerly the Institute of Medicine (IOM), Committee on Quality of Health Care in America released two reports that stressed the importance of reform of the U.S. healthcare system with regard to safety.7, 8 The Committee’s fourth overarching recommendation focuses at the delivery level and advocates for making AEs visible, preventing AEs, and mitigating the effects of AEs.7 A good way to understand the occurrence and causes of dental AEs in real practice and to develop empirically-based interventions to minimize their occurrence and to ensure that patients receive the safest oral healthcare possible is through the implementation of a dental Patient Safety Initiative (PSI)9, 10 (Figure 1).
Figure 1:

Elements of the Patient Safety Initiative (AHRQ, 2003)
We started our patient safety journey by addressing the first element of the PSI, “Determining Threats to Patient Safety.” We assessed the safety culture within the dental office through the use of the MOSOPS instrument;11, 12 developed trigger tools, adapted from the Institute for Healthcare Improvement (IHI)’s global trigger tools,13, 14 to document dental AEs;15–17 explored recorded dental AEs;3, 18, 19 and created the first dental classification scheme and dental AE repository that can help organize and link dental AEs.20, 21 We discovered many instances of serious AEs following surgical dental procedures including an adjacent tooth inadvertently being dislodged, a patient being found to be non-responsive to verbal cues and transferred to the ER, and lip numbness due to nerve injury lasting weeks. In contrast to what dental providers were inclined to believe,20 our data show unexpected post-surgical pain, hard tissue injury (e.g. tooth perforation) and soft tissue injury (e.g. lacerations) to be the most common types of dental AEs.15–17 Having successfully identified types of harm, in this study, we move on to explore the causes of harm that occur within the dental office so that evidence-based safety practices can be established and better implemented in the future.22
Root Cause Analysis (RCA) can be defined as a systematic and structured method used for retrospective analysis of AEs. Utilized in high reliability industries such as aerospace, aviation and nuclear power, RCA’s purpose is to facilitate learning from an undesired outcome.23 This method seeks “root causes” beyond surface symptoms. It looks for variations in practice, performance or system issues that have led to the unexpected and undesired outcome.23, 24 Root Cause Analysis systematically helps us understand WHAT, HOW and WHY the undesired outcome or incident happened. As a collection of methods and tools, RCA helps us understand the relationship between the different factors at play leading to an AE. RCA can be broadly classified into inductive and deductive methods.25 Both types of methods are complementary and are dependent on the abundance of data available and the focus of the investigation. RCA is evidence-based and considers relevant literature. It promotes a culture of patient safety and shifts the mindset from a possible blame culture to learning from undesired outcomes.26
We adapted RCA to address a large barrier to performing RCAs in practice: the extensive time and resource requirements.27 In particular, traditional RCA processes rely on extensive information gathering immediately after an AE such as interviews with people involved and workplace inspections, we set forth to develop a process to use only information captured in Electronic Health Record (EHR) systems. EHRs contain rich information that may also be useful to assess the factors associated with dental AEs. Our EHR-based RCA or eRCA approach is guided by the Systems Engineering Initiative for Patient Safety (SEIPS) framework, which has been used to understand the sociotechnical work system (people, tasks, tools/technologies, physical environment, and organization) and its work processes which shape the outcomes.
In this study, we identified and learned from past adverse events through chart reviews. The aim was to assess contributing factors associated with commonly occurring AEs at two large academic institutions using EHR-based triggers and a novel EHR-based RCA methodology guided by the SEIPS framework.
Materials and Methods
Figure 2 shows an overview of the methods. Semi-automated triggers were deployed to detect probable AEs from the EHR at two large academic institutions during 2019. The AEs were reviewed to assess the potential contributing factors associated with these events based on information captured in the EHR. This study protocol was reviewed and approved by the Institutional Review Boards of both institutions.
Figure 2:
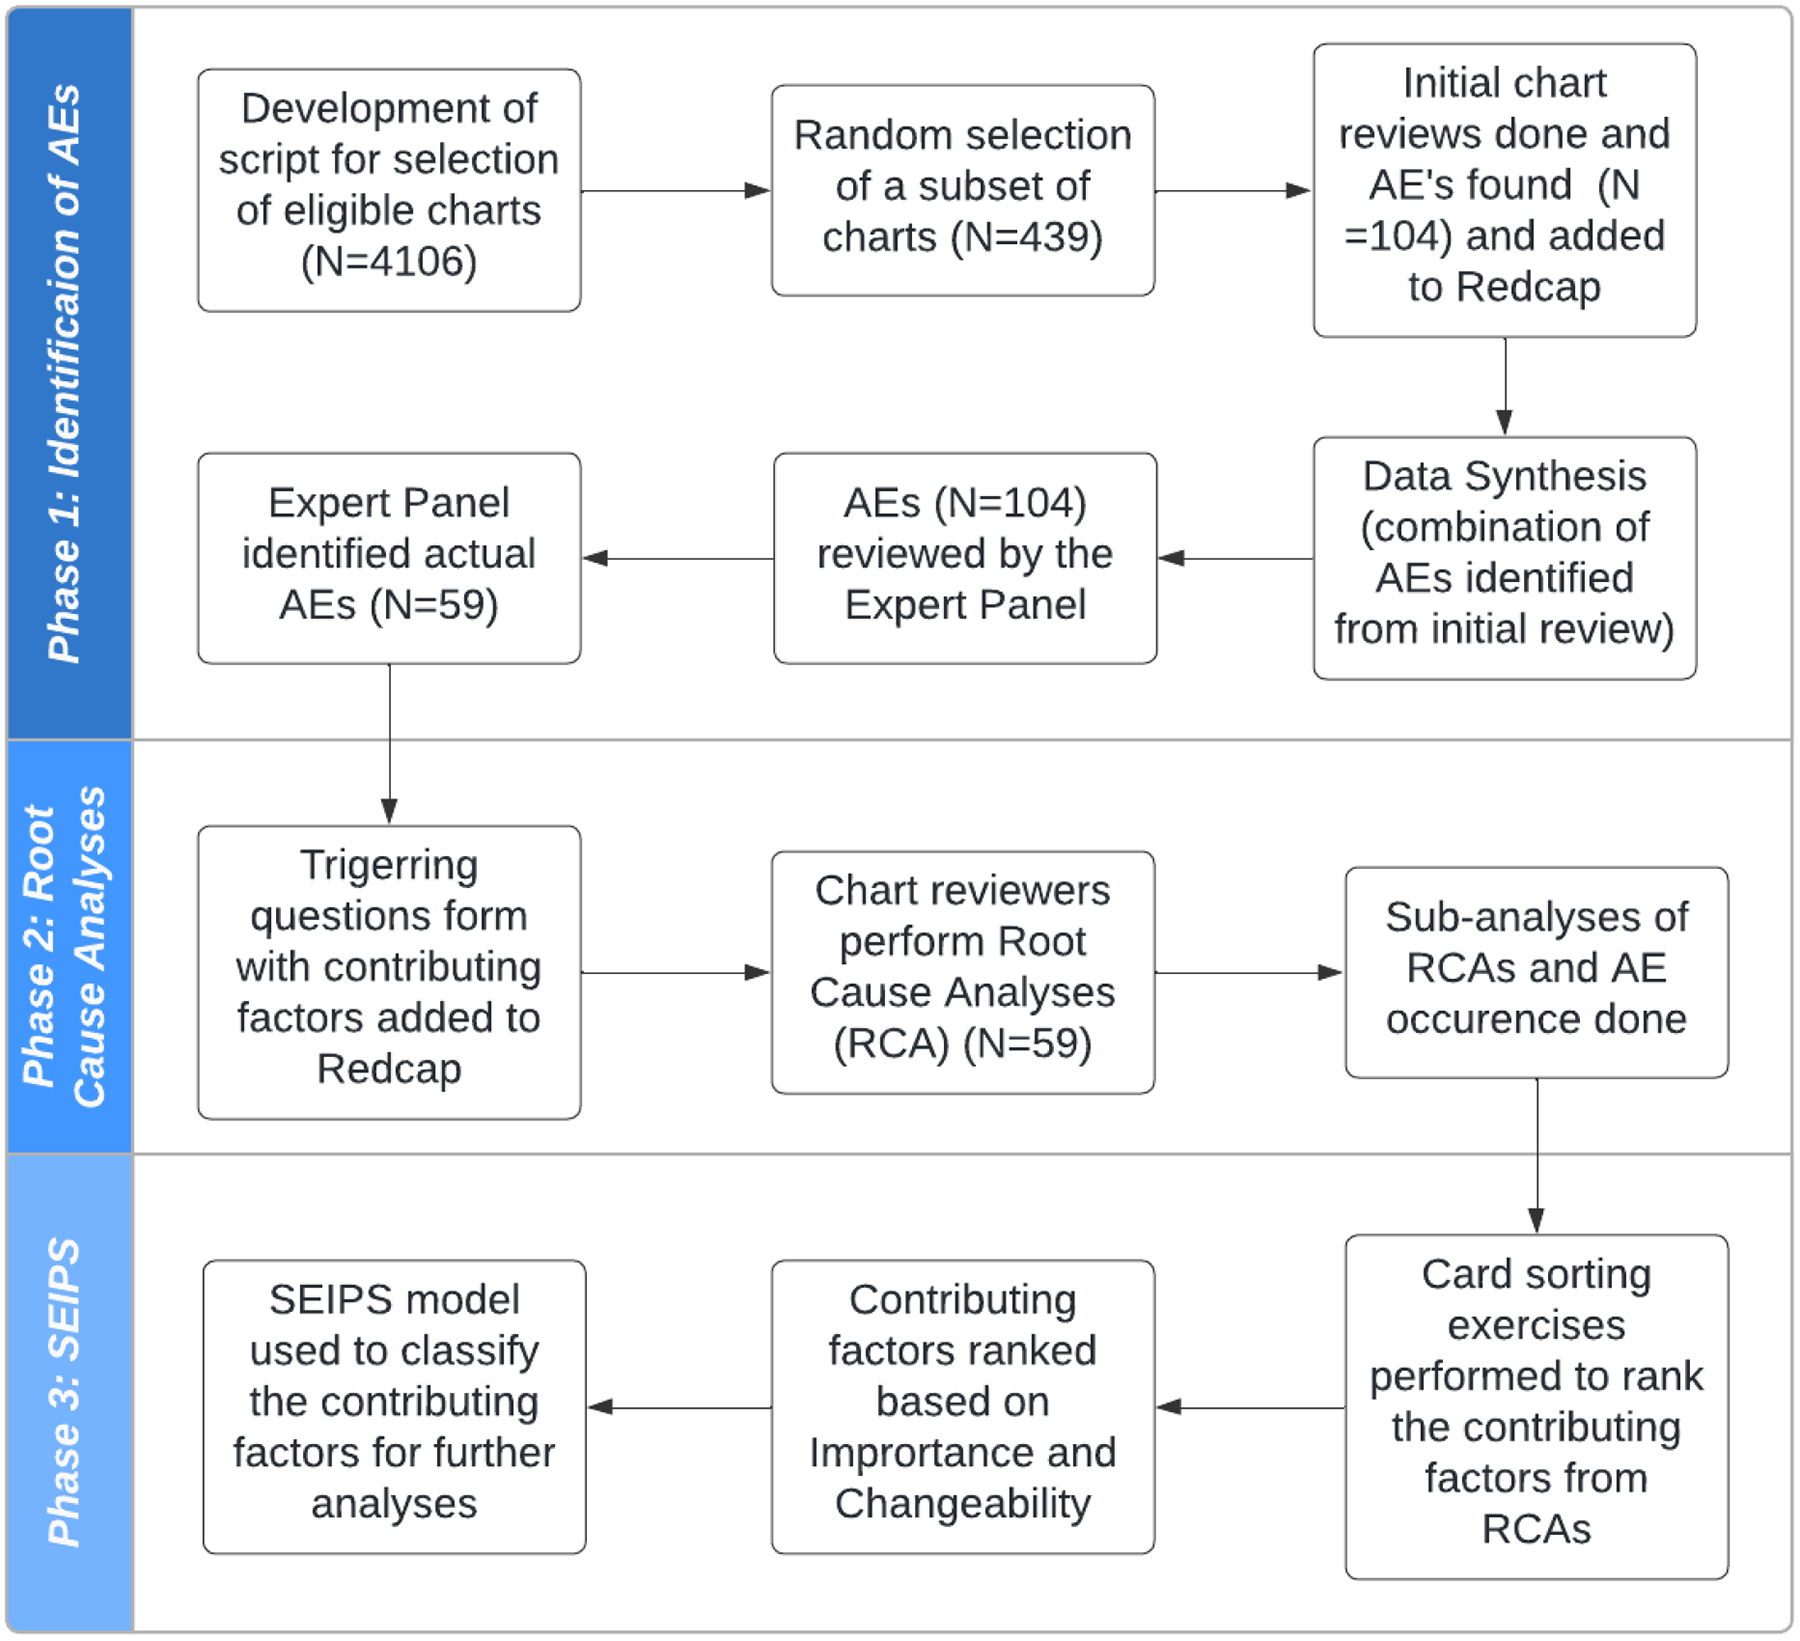
Overview of the method
Study sites and subjects
Both clinical sites treat a diverse population and include private faculty practices, specialty clinics, as well as predoctoral dental student clinics. In 2019, these sites treated over 59,380 unique patients. Dental providers include practitioners in the areas of general practice, dental hygiene, endodontics, imaging, oral pathology, oral surgery, orthodontics, pediatric dentistry, periodontics, and prosthodontics. Both sites are a primary source of quality oral health care for low-income families, the traditionally underserved, and patients with special needs and/or medical comorbidities.
We targeted our research in the following clinics at each institution: 1) Faculty Practice, 2) Oral Surgery, 3) Endodontics, 4) Advanced Education/General Dentistry, 5) Periodontics, 6) Prosthodontics, 7) Orthodontics, 8) Pediatric Dentistry, and 9) predoctoral dental student. We used seven previous validated triggers to flag the EHR (axiUm, Vancouver, Canada) across all clinics at each institution with common words that could indicate probable AEs.15–17
Identifying AEs through semi-automated triggers
A total of 8 research assistants with dental knowledge were trained and calibrated to conduct in-depth chart reviews. Two research assistants reviewed each case, flagging the case if it was considered a true positive flag AE, classifying the event in severity, and assigning an applicable AE category as described previously.21 In the first review, research assistants handled charts from their home institutions. Next, an expert panel consisting of senior dental faculty/co-investigators serving multiple institutions discussed each case that was flagged with a probable AE(s) to validate the AE(s) and confirm the type and severity classification.
Assessing factors contributing to AEs
We used a multiple-step process derived from several resources,2, 28–31 to assess the potential contributing factors associated with these events based on the information captured in the EHR.
First, we assessed if the individual chart in the EHR contained sufficient information for analysis. Minimal information included Patient ID, Gender, Year of Birth, Trigger date, Category of AE, Severity grade, Medical Alerts, Medical history and periodontal status, radiographic evidence, and event summary/description. Next, preliminary information was gathered about the AE and a summary was outlined. Then, an as-is timeline was created for the event showing the sequence of events in chronological order. Following this, a second timeline was created depicting the optimal or expected sequence of events for the handling of that specific condition. The expected sequence of events was not judgmental but rather evidence-based using references from the literature. A rationale was provided as to why the expected sequence of events would have been beneficial.
We then used a set of triggering questions adapted from the Institute of Healthcare Improvement (IHI) Triggering Questions for RCA2 tool used in the medical field.32 We named this our EHR-based RCA or eRCA. The questionnaire consisted of 31 possible factors that could have served as potential issues or safety concerns contributing to the AE. The questionnaire was separated into three parts based on the sequence of dental treatment: 1) Pre-procedure contained 10 possible contributing factors associated with patient selection and tasks the provider could have taken into consideration when preparing for dental treatment (i.e., timeliness of patient assessment, clarity of treatment plan, adequacy of plans for managing risk); 2) Procedure and Immediate Post included 16 possible contributing factors relating to the provider’s ability to carry out the actual procedure (i.e., Level of provider’s expertise, communication between front line team members, accommodations made for deviations from the intended treatment plan); and 3) Post-Procedure contained 5 possible contributing factors relating to the adequacy of post-operative follow-up (i.e., Patient’s adherence to post-op instructions, Patient’s response to treatment, Adequacy of post-procedure follow-up care provided by team).
The final assessment consisted of screening for 10 factors inspired by the SEIPS model: Organization, Persons, Tasks, Tools and Technology, Environment, External environment, Professional-Patient collaboration, Professional-Professional collaboration, Patient factors, and Other. A preventability score (5-point scale ranging from “Not Preventable” to “Preventable” or “Not Classifiable”) was determined. Four of the categories were taken from a previous study,33 and we deemed it necessary to add the 5th category: “not classifiable”. Using the comprehensive review of the chart, we then determined whether a case was preventable. For example, a case of a patient who had a complicated medical history with delayed healing; could the AE of bleeding have been prevented? Research assistants presented each case to an expert panel who made a final assessment of the likely contributing factors that led to the AE(s). The expert panel identified potential gaps in care and discussed what could have been done to prevent that AE in the future.
Figure 3 shows a summary diagram listing potential causes considering the different components for the sample case (Figure 4) described. For our selected set of AEs, similar analyses were generated.
Figure 3:
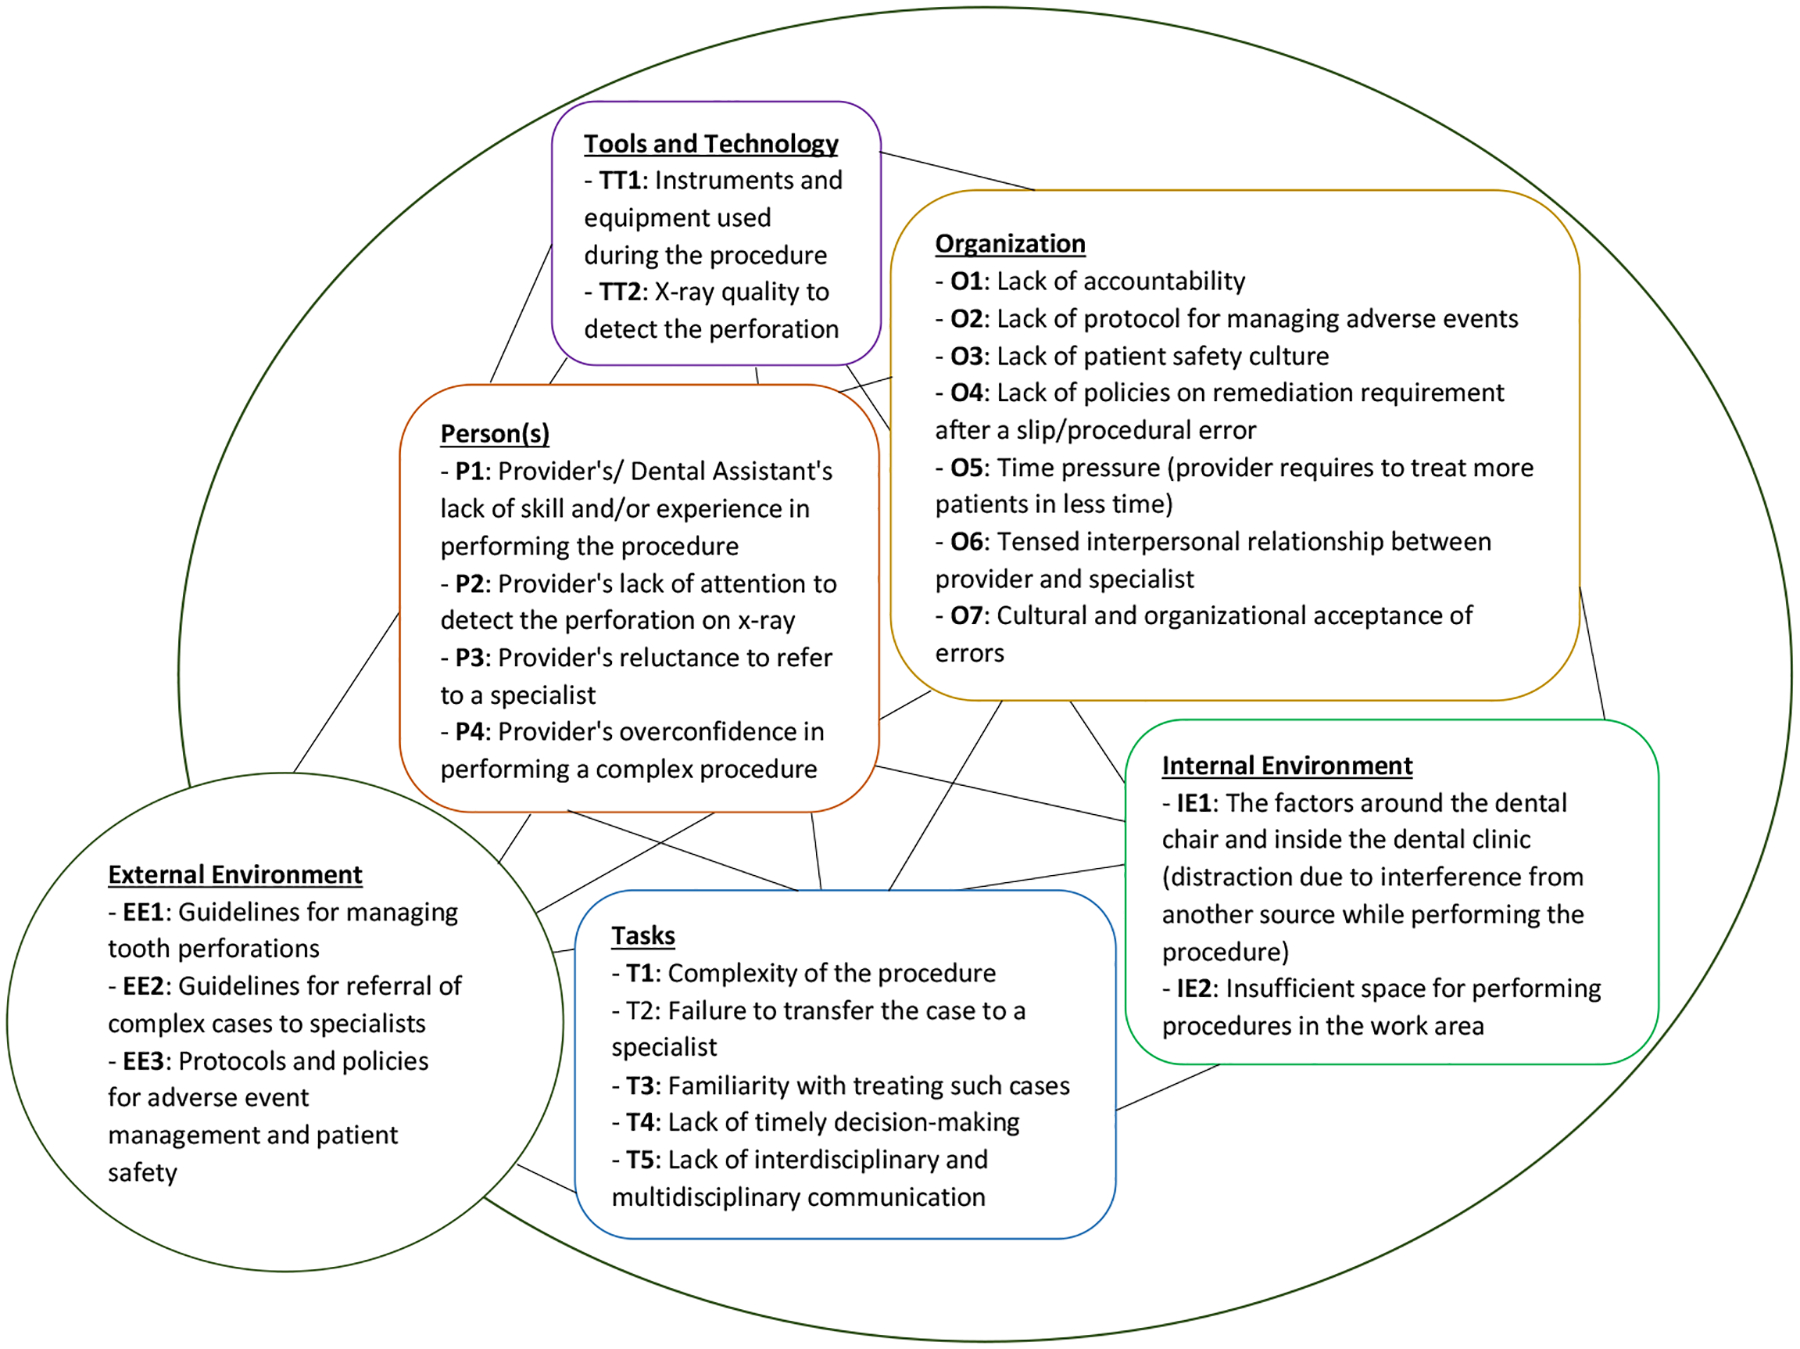
Contributing factors associated with tooth perforation
Figure 4:
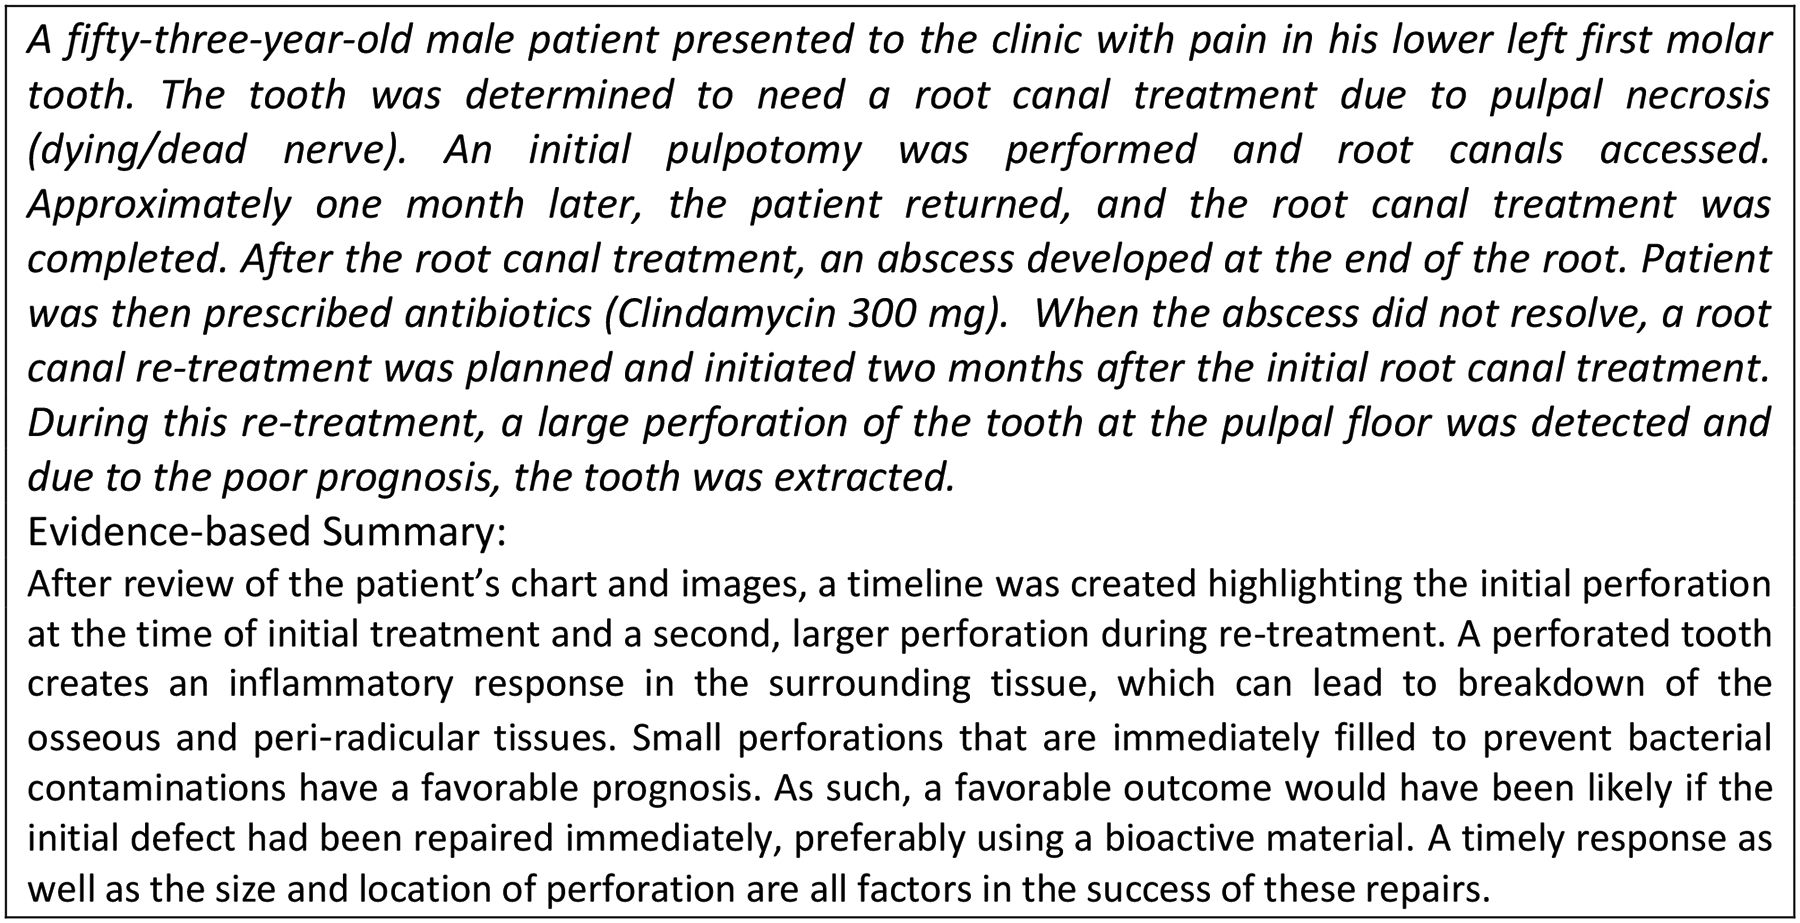
Sample AE for identifying contributing factors using the SEIPS model
Sample size
To estimate the projected number of triggered charts needed to review in the current study, we used the sample size formula for proportions and these pertinent initial values derived from our pilot data.34 Given the PPV for a specific trigger in the pilot, a significance level of α=0.05 with z-value of 1.96, a standard margin for error of d=0.05 for each trigger, and the estimated triggered population (UCSF: 2,184, UTH: 1,922), we estimated that 439 (UCSF: 221, UTH: 218) dental charts would be reviewed.34, 35
Data analysis
Data from REDCap36 was collated to determine the most frequent AE classification and severity. Among the 59 actual AEs, descriptive statistics (frequency and percentage) was calculated for each type of AEs based on location, severity of the AEs, contributing factors associated with the AEs, and preventability of the AEs.
Results
Identification of AEs
4,106 EHR-based triggered charts included 1,922 charts from site 1 and 2,184 charts from site 2 in 2019. Gender distribution was 53.2% male, 45.6% female, 0.1% other, 0.1% transgender, and 1% unknown. The average age was 50.5 years. A sample of 439 cases was randomly selected from these charts, including 218 cases at site 1 and 221 cases at site 2. Among the reviewed charts, 104 probable AEs were found of which 59 were verified as actual AEs by the expert panel. The AEs were categorized into type and severity. Out of 59 AEs across two sites, the highest occurring AE was pain (27.1%), followed by nerve injury (16.9%), hard tissue damage (15.2%), and soft tissue injury (15.2%) (Table 1).
Table 1:
Types of AEs based on location at two academic institutions
| Types of AEs based on location | Site 1 & Site 2 combined | ||||
|---|---|---|---|---|---|
| Predoc N (%) |
Residency clinic N (%) |
Faculty Practice N (%) |
External N (%) |
Total N (%) |
|
| Allergy/Toxicity/Foreign Body response | 0 (0) | 0 (0) | 0 (0) | 1 (9.1) | 1 (1.7) |
| Aspiration/Ingestion of Foreign Body | 0 (0) | 0 (0) | 0 (0) | 0 (0) | 0 (0) |
| Infections | 0 (0) | 3 (9.1) | 1 (50) | 1 (9.1) | 5 (8.5) |
| W-SPPs (Wrong-Site or Wrong-Procedure or Wrong-Patient) | 1 (7.7) | 0 (0) | 0 (0) | 1 (9.1) | 2 (3.4) |
| Bleeding | 1 (7.7) | 3 (9.1) | 0 (0) | 1 (9.1) | 5 (8.4) |
| Pain | 6 (46.1) | 8 | 1 (50) | 1 (9.1) | 16 (27.1) |
| Hard tissue injury | 2 (15.4) | 6 (18.2) | 0 (0) | 1 (9.1) | 9 (15.3) |
| Soft tissue injury | 2 (15.4) | 2 (6.1) | 0 (0) | 5 (45.4) | 9 (15.3) |
| Nerve injury | 1 (7.7) | 9 (27.4) | 0 (0) | 0 (0) | 10 (16.9) |
| Other systemic harm | 0 (0) | 0 (0) | 0 (0) | 0 (0) | 0 (0) |
| Other oro-facial harm | 0 (0) | 2 (6.1) | 0 (0) | 0 (0) | 2 (3.4) |
| Other harm | 0 (0) | 0 (0) | 0 (0) | 0 (0) | 0 (0) |
| TOTAL | 13 | 33 | 2 | 11 | 59 |
Among 59 cases, residency clinics had the most AEs (55.9%), followed by predoctoral dental student clinics (22%). 18.6% of AEs were identified from external clinics where the AE was discovered at Site 1 or Site 2 but did not originate there. Lastly, 3.4% of AEs were identified in the faculty practices (3.4%). Nerve injury occurred most frequently in the residency clinics (27.4%), while pain was the most frequent AE in the pre-doctoral clinics (46.1%), and soft tissue injury was the major AE in the external clinics (45.4%) (Table 1). At site 1, 72.2% of the AEs occurred in residency clinics, 22.2% in the predoctoral dental student clinics, 2.8% in faculty practice, and 2.8% in external clinics locations. At site 2, 43.5% of the AEs occurred externally, 30.4% in residency clinics, 21.7% in pred-doctoral clinics, and 4.3% in faculty practice clinics.
Based on the AE type, the most recorded AE severity included “temporary not moderate to severe harm” (E1) and “temporary moderate to severe harm” (E2). Pain represented 26.7% of the cases, followed by Nerve injury in 15% of cases (Table 2). For “permanent not moderate to severe harm” (G1) and “permanent moderate to severe harm” (G2), the most recorded AE severity was Hard tissue damage in 13.3% of the cases, followed by Soft tissue injury/inflammation and other oro-facial harm across both sites. For each site, most AEs were classified at site 1 as E1 (47.5%), E2 (25%), G1 (12.5%), “permanent moderate to severe harm” (G2) in 10% of the cases, and multiple severities (5%) and at site 2 as E2 (51.9%), E1 (25.9%), and “permanent not moderate to severe harm” (G1) in 22.2% of the cases. We found the greatest number of cases (18 cases) categorized under E1 at site 1 and 11 cases categorized under E2 at site 2.
Table 2:
Types of AEs based on severity and preventability across 2 academic institutions
| AE categories | Severity* | Preventability | ||||
|---|---|---|---|---|---|---|
| E1, E2 | G1, G2 | F, H, I | AE preventable | AE not preventable | Not classifiable | |
| Allergy/Toxicity/Foreign Body response | 1 (1.7%) | 0 (0.0%) | 0 (0.0%) | 1 (1.8%) | 0 (0.0%) | 0 (0.0%) |
| Aspiration/Ingestion of Foreign Body | 0 (0.0%) | 0 (0.0%) | 0 (0.0%) | 0 (0.0%) | 0 (0.0%) | 0 (0.0%) |
| Infections | 5 (8.3%) | 1 (1.7%) | 0 (0.0%) | 5 (8.9%) | 0 (0.0%) | 0 (0.0%) |
| W-SPPs (Wrong-Site or Wrong-Procedure or Wrong-Patient) | 1 (1.7%) | 1 (1.7%) | 0 (0.0%) | 2 (3.6%) | 0 (0.0%) | 0 (0.0%) |
| Bleeding | 5 (8.3%) | 0 (0.0%) | 0 (0.0%) | 5 (8.9%) | 0 (0.0%) | 0 (0.0%) |
| Pain | 16 (26.7%) | 0 (0.0%) | 0 (0.0%) | 12 (21.4%) | 2 (3.6%) | 1 (1.8%) |
| Hard tissue damage | 1 (1.7%) | 8 (13.3%) | 0 (0.0%) | 7 (12.5%) | 2 (3.6%) | 0 (0.0%) |
| Soft tissue injury/Inflammation | 7 (11.7%) | 2 (3.3%) | 0 (0.0%) | 5 (8.9%) | 2 (3.6%) | 0 (0.0%) |
| Nerve injury | 9 (15.0%) | 1 (1.7%) | 0 (0.0%) | 7 (12.5%) | 3 (5.4%) | 0 (0.0%) |
| Other systemic harm | 0 (0.0%) | 0 (0.0%) | 0 (0.0%) | 0 (0.0%) | 0 (0.0%) | 0 (0.0%) |
| Other oro-facial harm | 0 (0.0%) | 2 (3.3%) | 0 (0.0%) | 1 (1.8%) | 0 (0.0%) | 1 (1.8%) |
| Other harm | 0 (0.0%) | 0 (0.0%) | 0 (0.0%) | 0 (0.0%) | 0 (0.0%) | 0 (0.0%) |
Severity:
E1 (Temporary NOT moderate to severe harm)
E2 (Temporary moderate to severe harm)
F (Transfer to ER)
G1 (Permanent NOT moderate to severe harm)
G2 (Permanent moderate to severe harm)
H (Harm required intervention to sustain life)
I (Death)
According to the expert panel, 21.4% of the Pain cases were “preventable” and “probably preventable” across both sites, followed by Nerve injury and Hard tissue damage representing 12.5% of cases in each category. Only 5.4% of the total Nerve injury cases were “not preventable” and “probably not preventable”. 32.1% of the AEs were “preventable” and 48.2% of the cases were “probably preventable” in the future. 16.1% of the cases were either “probably not preventable” or “not preventable”. Only 3.6% of the cases could not be classified for preventability (Table 2).
Assessed factors contributing to AEs
The most common contributing factor across both sites was “Person” (training, supervision, and fatigue) (Site 1: 34.4%, Site 2: 28%), followed by “Patient-factors” (non-compliance, unsafe practices at home, health literacy) (Site 1: 16.4%, Site 2: 18.0%), and professional-professional collaboration (Site 1: 14.8%, Site 2: 16.0%). The least common contributing factor was Environment (lighting, power supplies, noise, interruptions) across both the sites (Figure 5). We conducted a subgroup analysis on the 12 AEs with the most frequently occurring type, “Pain.” “Person” was the most common contributing factor, followed by “Patient-factors”.
Figure 5:
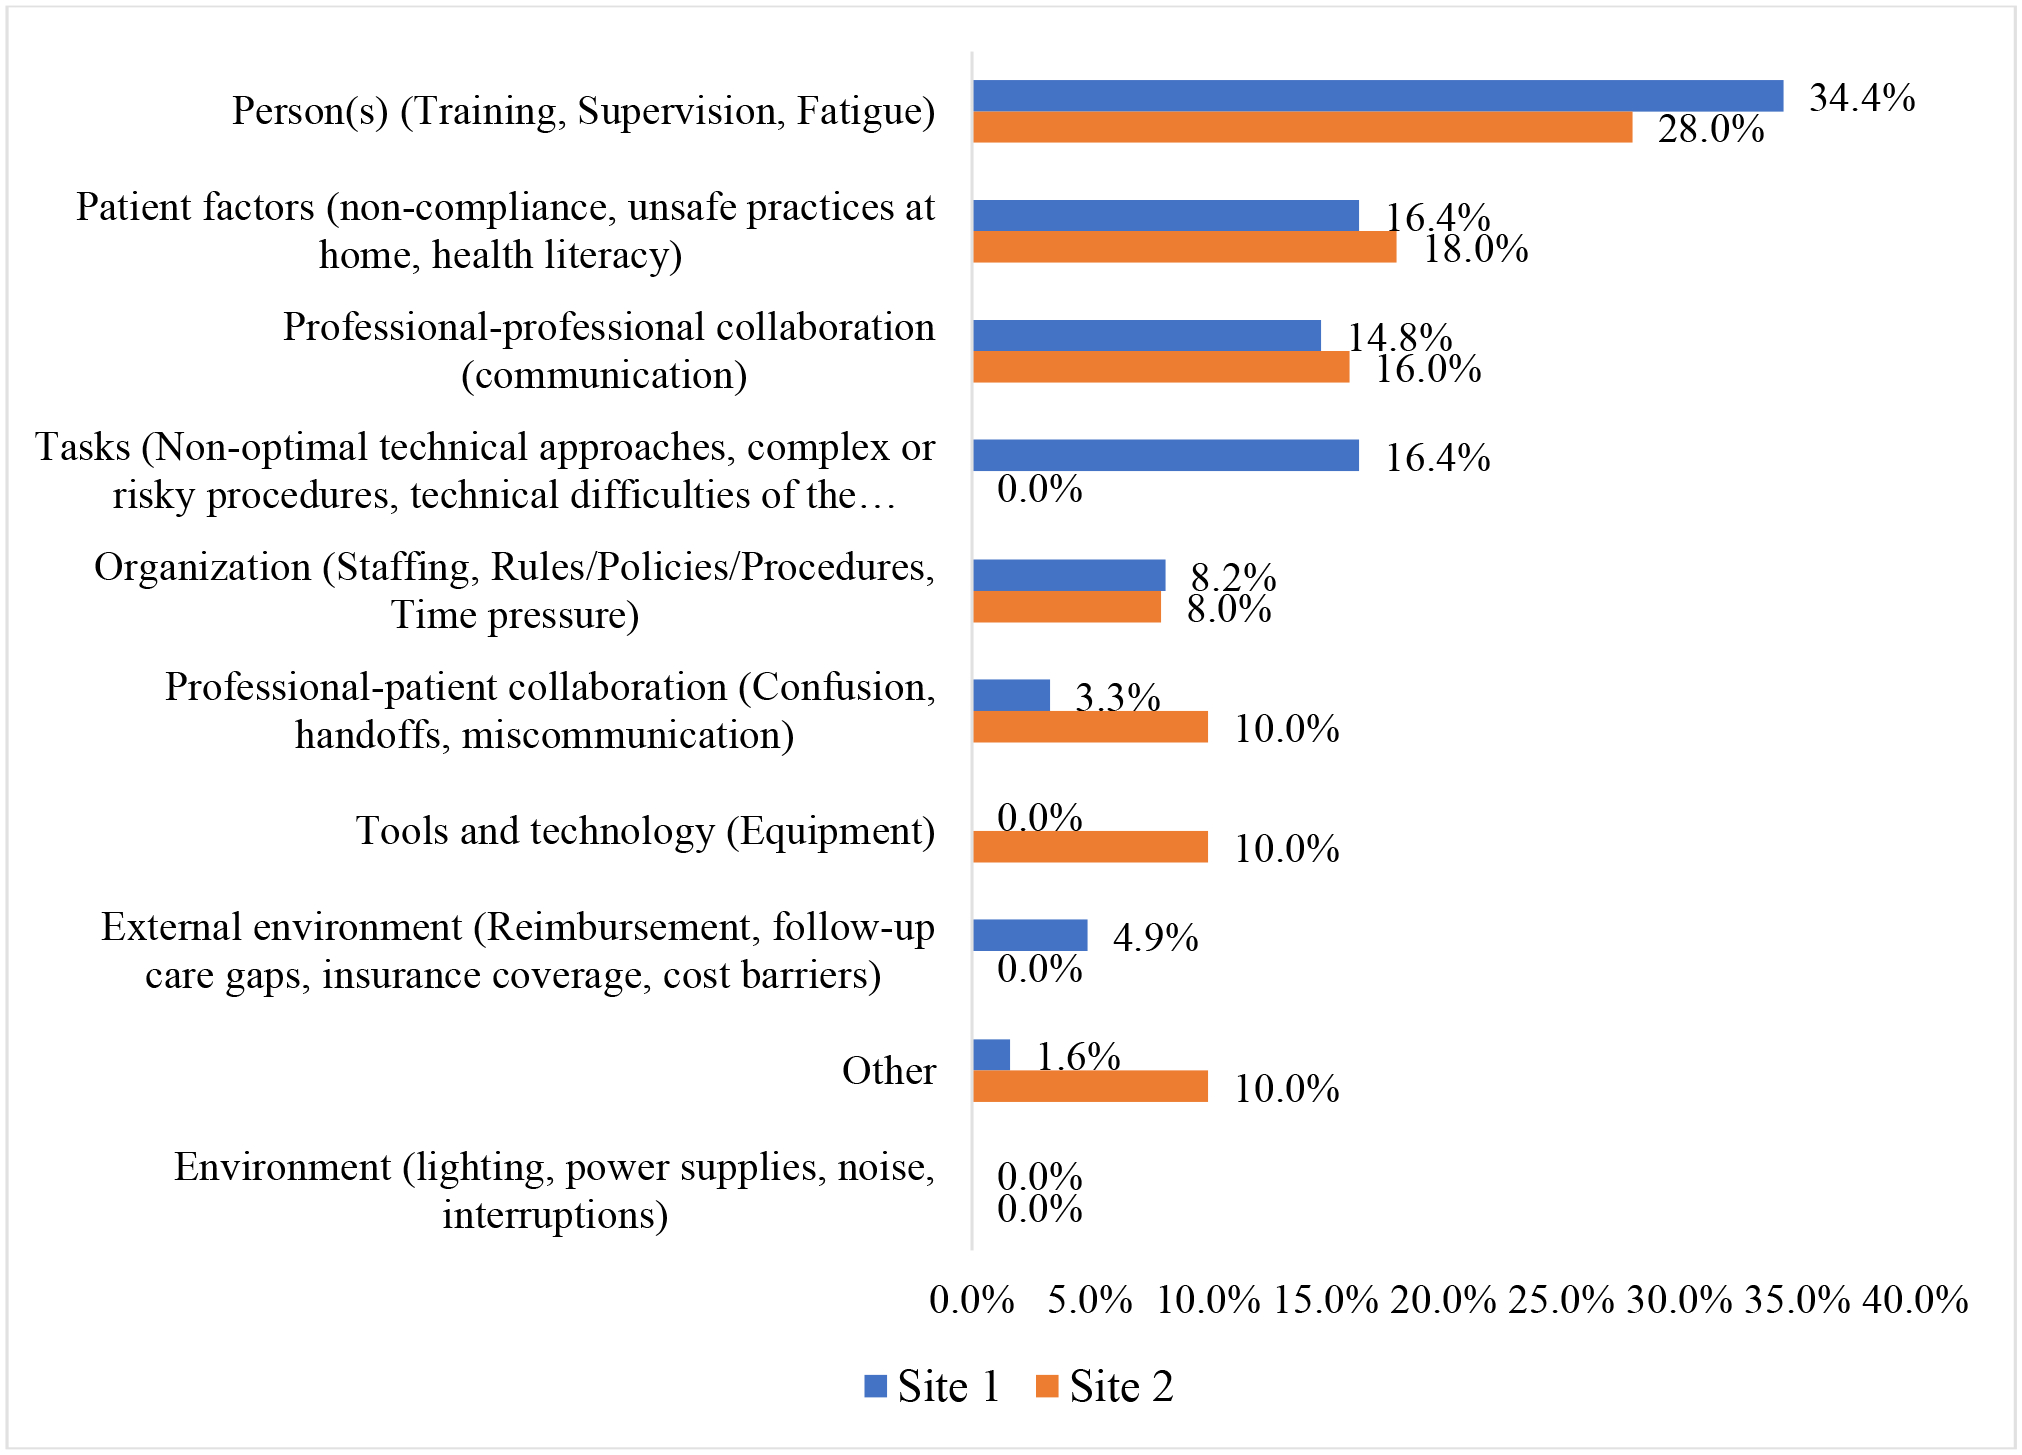
Contributing factors associated with AEs across 2 academic institutions
By phases of dental care, clarity of treatment plan, quality of the patients’ needs assessed prior to treatment, and timeliness of treatment provided were common factors during pre-procedure across both the sites. Level of provider’s expertise, level of supervision provided, training of front-line providers, the necessity of the procedure, and adequacy of post-op instructions were most commonly identified factors during the procedure. Adequacy of post-procedure follow-up care provided by the team, adequacy of post AE follow-up provided by the team, and patient adherence to post-op instructions, were commonly identified issues during the post-procedure phase.
Discussion
This study found a wide range of AEs with “Pain” as the most frequent AE type and Temporary, not moderate to severe harm (E1) was the most frequent AE severity classification. “Person” (training, supervision, and fatigue) was assessed as the most common contributing factor, presenting in about one third of the identified AEs. Most importantly, we can actually prevent the vast majority of dental office based-originating AEs as more than 80% of the identified AEs were preventable or probably preventable.
Determining pain as an AE can be challenging because it is usually associated with many dental procedures and varies greatly depending on the procedure and several patient factors. To reduce misclassification due to subjective assessment of pain, we further developed the Pain guidelines at the start of this project further clarifying when post-procedure pain would rise to the level of an AE. We also brought together a calibrated expert panel consisting of senior dental faculty/co-investigators to confirm the type and severity classification.21 40% of the AEs in this study were classified as E1 (temporary, not moderate to severe harm), and 35% as E2 (temporary, moderate to severe harm). Because AEs in dentistry seem to be less catastrophic, it is reasonable to expect that most dental AEs will likely fit into either E1 or E2 categories.
Patient safety research in dentistry has been largely unexplored,37 and the analysis of AEs and contributing factors have been rarely reported in the dental literature. Although the identification and assessment of AEs is the first important step for improving patient safety,38, 39 clinical dentistry has neither developed a comprehensive nor a standardized system for reporting AEs.21, 37 Our previous studies showed the feasibility of using EHR-based triggers to identify and classify dental AEs from the patient records.15, 21 Our dental AE type and severity classifications helped us organize different types of AEs that the patient may encounter during the treatment. In this study, we proceeded to assess various contributing factors of the AEs, using data documented in the EHR, to determine the people involved, the technology used, the organizational factors, the processes followed, the procedures performed, the dental practice environment and the outcomes achieved. This holistic assessment is a crucial step for learning underlying system failures and creating and disseminating recommendations for systems changes in future.40
An RCA is initiated when a patient suffers harm in association with dental treatment. Examples of dental AEs that require RCA are the extraction of a wrong tooth, a patient needing a bronchoscopy due to aspiration of a crown, and perforation of a tooth during an endodontic procedure.20 AEs that may be suitable for RCA can be identified through patient feedback, direct observation by the provider or staff, reviewing patient notes or incident reports.41, 42 Priority should be given to the occurrences that resulted in harm but it is also worth considering investigating “near misses” or incidents that resulted in minor harm (nicking of an adjacent tooth during restorative tooth preparation) or temporary harm (paresthesia after tooth extraction that lasted for two weeks). Near misses are incidents that could have resulted in harm but did not, either by pure luck or by timely intervention. However, “near misses” are incidents that could, if repeated, cause harm and may be a source for external investigations.43 A large barrier for performing RCAs is the extensive time requirement.27 Information captured in EHR can potentially provide information on contributing factors. Our eRCA approach demonstrated that RCA classifications (contributing factors, timelines etc.) can be performed using EHR data. The reduction in face-to-face interviews and manual data collection provides potential savings in time and resources. By using principles of human engineering and engaging the system, we have effectively addressed some of these barriers. We believe that our pragmatic analysis protocol was able to identify some underlying (system) issues for many cases of harm and may be used to supplement RCA process that include observations and interviews of key individuals involved in the event.
In this study, we demonstrated the feasibility and importance of assessing contributing factors that may have led to dental AEs across two institutions based on EHR information. What we did is innovative, by combining a trigger method, and analyzing all events, versus traditional RCA which tends to work on one event at a time. As such, this protocol may be used differently than a traditional RCA, e.g., periodically, targeting a service line, a specific type of AEs, etc., as such use is not possible with traditional RCA.
In order to become a learning organization,44 we must understand our environment and learn from safety events so that we can take actions that eliminate threats to patient safety. This project is an important first step towards our long-range goal to build a sustainable dental learning health system focused on providing patients with safe and effective oral healthcare by advancing the dental patient safety initiative.45
Limitations
The strength of this study is a systematic and system-based approach to identifying AEs and assessing their contributing factors in the dental clinic. This approach is innovative for the dental setting and will become even more feasible as dentistry shifts from small private practice setting to large group practice models.46 As such, generalization is currently not possible. Additionally, patient safety research in the dental setting is still immature as most current work is descriptive. It is also difficult to generalize from existing studies because of differences in underlying definitions, varying methodological approaches, and differing patient populations. Because this study was a retrospective review of dental charts to identify contributing factors of the AEs, the information from the EHR was limited to classifying an AE and understanding system factors involved in several cases. Lastly, some AEs could fit into multiple categories. By restricting the researchers to classifying AEs into only one category for reporting purposes, it may not fully capture the nature and extent of the harm.
Conclusions
We leveraged data collected in the EHR to help measure Adverse Events (AEs) and used a rapid, pragmatic protocol adapted from Root Cause Analysis (RCA) to help elucidate why they occurred. We also used both the SEIPS and the IHI Model for Improvement as guiding frameworks. “Pain” was the highest occurring AE and “Person” (training, supervision, and fatigue), and “Patient” (non-compliance, unsafe practices at home, health literacy), were the contributing factors associated with most AEs. Our results show that the vast majority of AEs that occur in dentistry are preventable. An understanding of contributing factors presents us with a unique opportunity to ensure dental care is safe for our patients.
Acknowledgement
Source of Funding: This study received funding from U.S. Department of Health and Human Services, Agency for Healthcare Research and Quality (AHRQ), grant #: R18 HS027268-01.
Footnotes
Declaration of Conflict of Interest
The authors declare that there is no conflict of interest.
References
- 1.Dhanda J, Thomas M, Kheraj A. High speed laceration. Br Dent J 2008;204(7):352. [DOI] [PubMed] [Google Scholar]
- 2.Hebballi NB, Ramoni R, Kalenderian E, et al. The dangers of dental devices as reported in the Food and Drug Administration Manufacturer and User Facility Device Experience Database. The Journal of the American Dental Association;146(2):102–10. [DOI] [PMC free article] [PubMed] [Google Scholar]
- 3.Obadan E, Ramoni RB, Kalenderian E. Lessons Learned from Dental Patient Safety Case Reports. Journal of the American Dental Association 2015;146(5):318–26. [DOI] [PMC free article] [PubMed] [Google Scholar]
- 4.Weiman MM, Weiman DS, Lingle DM, Brosnan KM, Santora TA. Removal of an aspirated gold crown utilizing the laparoscopic biopsy forceps: a case report. Quintessence Int 1995;26(3):211–3. [PubMed] [Google Scholar]
- 5.Spencer HR, Ike V, Brennan PA. Review: the use of sodium hypochlorite in endodontics--potential complications and their management. Br Dent J 2007;202(9):555–9. [DOI] [PubMed] [Google Scholar]
- 6.National Academy of Science National Academy of Medicine Washington, DC: 2022. “https://nam.edu/about-the-nam/“. Accessed 5/26/2022.
- 7.Institute of Medicine. To Err is Human: Building a Safer Healthcare System. Washington, D.C.: National Academy Press; 2000. [Google Scholar]
- 8.Institute of Medicine. Crossing the Quality Chasm. A New Health System for the 21st Century Washington: National Academy Press; 2001. [PubMed] [Google Scholar]
- 9.World Alliance for Patient Safety. WHO Draft Guidelines For Adverse Event Reporting and Learning Systems - From Information to Action. Geneva, Switzerland: World Health Organization; 2005. [Google Scholar]
- 10.Farley DO, Battles JB. Evaluation of the AHRQ patient safety initiative: framework and approach. Health Serv Res 2009;44(2 Pt 2):628–45. [DOI] [PMC free article] [PubMed] [Google Scholar]
- 11.Ramoni R, Walji MF, Tavares A, et al. Open wide: looking into the safety culture of dental school clinics. J Dent Educ 2014;78(5):745–56. [PubMed] [Google Scholar]
- 12.Yansane A, Lee JH, Hebballi N, et al. Assessing the Patient Safety Culture in Dentistry. JDR Clin Trans Res 2020;5(4):399–408. [DOI] [PubMed] [Google Scholar]
- 13.Classen DC, Lloyd RC, Provost L, Griffin FA, Resar R. Development and Evaluation of the Institute for Healthcare Improvement Global Trigger Tool. Journal of Patient Safety 2008;4(3):169–77. [Google Scholar]
- 14.Resar R, Rozich J, Classen D. Methodology and rationale for the measurement of harm with trigger tools. Quality and Safety in Health Care 2003;12(suppl 2):ii39–ii45. [DOI] [PMC free article] [PubMed] [Google Scholar]
- 15.Kalenderian E, Walji MF, Tavares A, Ramoni RB. An adverse event trigger tool in dentistry: a new methodology for measuring harm in the dental office. J Am Dent Assoc 2013;144(7):808–14. [DOI] [PubMed] [Google Scholar]
- 16.Kalenderian E, Obadan-Udoh E, Yansane A, et al. Feasibility of Electronic Health Record-Based Triggers in Detecting Dental Adverse Events. Appl Clin Inform 2018;9(3):646–53. [DOI] [PMC free article] [PubMed] [Google Scholar]
- 17.Walji MF, Yansane A, Hebballi NB, et al. Finding Dental Harm to Patients through Electronic Health Record-Based Triggers. JDR Clin Trans Res 2020;5(3):271–77. [DOI] [PMC free article] [PubMed] [Google Scholar]
- 18.Obadan E, Kalenderian E, Ramoni RB. CASE REPORTS HAILED. The Journal of the American Dental Association 2014;145(9):912–14. [DOI] [PubMed] [Google Scholar]
- 19.Hebballi NB, Ramoni R, Kalenderian E, et al. The dangers of dental devices as reported in the Food and Drug Administration Manufacturer and User Facility Device Experience Database. J Am Dent Assoc 2015;146(2):102–10. [DOI] [PMC free article] [PubMed] [Google Scholar]
- 20.Maramaldi P, Walji MF, White J, et al. How dental team members describe adverse events. The Journal of the American Dental Association 2016;147(10):803–11. [DOI] [PMC free article] [PubMed] [Google Scholar]
- 21.Kalenderian E, Obadan-Udoh E, Maramaldi P, et al. Classifying Adverse Events in the Dental Office. J Patient Saf 2021;17(6):e540–e56. [DOI] [PMC free article] [PubMed] [Google Scholar]
- 22.Yansane A, Walji MF, Kalenderian E. Introducing Safety in Dentistry: Perspectives and Directions. Journal of the California Dental Association 2019;47(7):433–37. [Google Scholar]
- 23.Wu AW, Lipshutz AM, Pronovost PJ. EFfectiveness and efficiency of root cause analysis in medicine. JAMA 2008;299(6):685–87. [DOI] [PubMed] [Google Scholar]
- 24.Commission. TJ. Root Cause Analysis in Healthcare: Tools and Techniques. Fifth Edition. 2015. [Google Scholar]
- 25.Vesely WE, Goldberg FF, Roberts NH, Haasl DF. Fault tree handbook: Systems and Reliability Research, Office of Nuclear Regulatory Research, U.S. Nuclear Regulatory Commission, Washington, D.C.; 1981. [Google Scholar]
- 26.Charles R, Hood B, Derosier JM, et al. How to perform a root cause analysis for workup and future prevention of medical errors: a review. Patient Safety in Surgery 2016;10(1):20. [DOI] [PMC free article] [PubMed] [Google Scholar]
- 27.Taitz J, Genn K, Brooks V, et al. System-wide learning from root cause analysis: a report from the New South Wales Root Cause Analysis Review Committee. Qual Saf Health Care 2010. [DOI] [PubMed] [Google Scholar]
- 28.VA National Center for Patient Safety (NCPS). Root Cause Analysis (RCA) Step-By-Step Guide. Root Cause Analysis Tools: US Department of Veterans Affairs (VA); 2015.
- 29.VA National Center for Patient Safety Root Cause Analysis (RCA) Tools. US Department of Veterans Affairs; 2015. “http://www.patientsafety.va.gov/docs/joe/rca_tools_2_15.pdf”. Accessed October 2016. [Google Scholar]
- 30.National Patient Safety Foundation (NPSF). RCA2: Improving Root Cause Analyses and Actions to Prevent Harm. Boston, MA; 2016. [Google Scholar]
- 31.O’Leary S, McCarthy D Rapid Root Cause Investigation (rRCI). Pharmachem Ireland Presentation 2010. “http://www.pharmachemskillnet.ie/index.cfm/page/presentations?twfId=9&download=true“. Accessed October 2016.
- 32.Institute for Healthcare Improvement Triggering Questions for RCA. 2020. “http://www.ihi.org/education/IHIOpenSchool/Courses/Documents/TriggeringQuestions_RCA2.pdf”. Accessed 5/19 2022.
- 33.Dubois RW, Brook RH. Preventable deaths: who, how often, and why? Ann Intern Med 1988;109(7):582–9. [DOI] [PubMed] [Google Scholar]
- 34.Cochran WG. Sampling Techniques. 3rd ed: John Wiley & Sons; 1977. [Google Scholar]
- 35.Naing L, Winn T, Rusli B. Practical issues in calculating the sample size for prevalence studies. Archives of orofacial Sciences 2006;1(1):9–14. [Google Scholar]
- 36.Harris PA, Taylor R, Thielke R, et al. Research electronic data capture (REDCap)—a metadata-driven methodology and workflow process for providing translational research informatics support. Journal of biomedical informatics 2009;42(2):377–81. [DOI] [PMC free article] [PubMed] [Google Scholar]
- 37.Yamalik N, Perea Perez B. Patient safety and dentistry: what do we need to know? Fundamentals of patient safety, the safety culture and implementation of patient safety measures in dental practice. Int Dent J 2012;62:189–96. [DOI] [PMC free article] [PubMed] [Google Scholar]
- 38.Niland JC, Stiller T, Neat J, et al. Improving patient safety via automated laboratory-based adverse event grading. Journal of the American Medical Informatics Association : JAMIA 2012;19(1):111–15. [DOI] [PMC free article] [PubMed] [Google Scholar]
- 39.Agency for Healthcare Research and Quality (AHRQ). Chapter 3. AHRQ’s Patient Safety Initiative: Breadth and Depth for Sustainable Improvements. Rockville, MD; 2003. [Google Scholar]
- 40.World Alliance for Patient Safety WHO Draft Guidelines for Adverse Event Reporting and Learning Systems. From Information to Action. Geneva, Switzerland: WHO Press; 2005. “http://www.who.int/patientsafety/events/05/Reporting_Guidelines.pdf?ua=1”. April 17, 2015. [Google Scholar]
- 41.Rafter N, Hickey A, Condell S, et al. Adverse events in healthcare: learning from mistakes. QJM: An International Journal of Medicine 2015;108(4):273–77. [DOI] [PubMed] [Google Scholar]
- 42.Forster AJ, Worthington JR, Hawken S, et al. Using prospective clinical surveillance to identify adverse events in hospital. BMJ Quality & Safety 2011;20(9):756–63. [DOI] [PMC free article] [PubMed] [Google Scholar]
- 43.CMS. Guidance for Performing Root Cause Analysis (RCA) with Performance Improvement Projects (PIPs). Retrieved December 07,2017.
- 44.Friedman C, Rubin J, Brown J, et al. Toward a science of learning systems: a research agenda for the high-functioning Learning Health System. J Am Med Inform Assoc 2015;22(1):43–50. [DOI] [PMC free article] [PubMed] [Google Scholar]
- 45.Agency for Healthcare Research and Quality. AHRQ’s Patient Safety Initiative: Building Foundations, Reducing Risk: Interim Report to the Senate Committee on Appropriations. Rockville, MD; 2003. [Google Scholar]
- 46.Vujicic M, Israelson H, Antoon J, et al. A profession in transition. The Journal of the American Dental Association;145(2):118–21. [DOI] [PubMed] [Google Scholar]