

Abstract
Hydrogen bonding is a key molecular interaction in biological processes, drug delivery, and catalysis. This report describes a high throughput UV-Vis spectroscopic method to measure hydrogen bonding capacity using a pyrazinone sensor. This colormetric sensor reversibly binds to a hydrogen bond donor, resulting in a blue shift as additional equivalents of donor are added. Titration with excess equivalents of donor is used to determine the binding coefficient, ln(Keq). Over 100 titrations were performed for a variety of biologically relevant compounds. This data enabled development a multiple linear regression model that is capable of predicting 95% of ln(Keq) values within 1 unit, allowing for the estimation of hydrogen bonding affinity from a single measurement. To show the effectiveness of the single point measurements, hydrogen bond strengths were obtained for a set of carboxylic acid bioisosteres. The values from the single point measurements were validated with full titrations.
Keywords: Bioisoteres, Colorimetry, Colorimetric sensors, Hydrogen bonding, Organocatalysts
Graphical Abstract
A high throughput UV-Vis method to measure hydrogen bonding capacity is disclosed using over 100 compounds of biological and catalytic relevance. A multiple linear regression model enables estimation of hydrogen bonding affinity from a single measurement using ~ 2 mg of analyte that was showcased with a set of carboxylic acid bioisosteres.
Introduction
Modern medicinal chemistry relies heavily upon the collection, analysis, and interpretation of a variety of physicochemical parameters to predict in vivo properties of compounds of interest, such as absorption, distribution, metabolism, and excretion (ADME). Common measurements include acidity (pKa), lipophilicity (logP and logD7.4), permeability (e.g., Caco-2, PAMPA), plasma protein binding, as well as solubility and chemical stability in different aqueous buffers. Of these many parameters, hydrogen bonding ability lacks an accessible method for the high throughput estimation despite its critical role in intermolecular interactions with aqueous media and in biological systems. Although pKa is an accurate measurement of ionization tendencies, correlation with hydrogen bond donating ability is quite low.[1,2] Thus, there has been interest in developing more representative methods of assessing hydrogen bond donating ability, especially that of weaker donors often found in biologically active organic compounds.
Significant work on quantification of hydrogen bond donating ability has come from Abraham et al. through calorimetric titrations with N-methyl-2-pyrrolidone (NMP) in in 1,1,1-trichloroethane (TCE) and chloroform.[2–5] Unfortunately, to obtain accurate data, other sources of heat release must be accounted for and excluded from final calculations, including the heat of dissolution of NMP in the solvent and heat of formation of dimer of the hydrogen bond donor in solution, if dimers at the concentrations used.
Methods to experimentally quantify hydrogen bond strengths with 31P NMR have been reported recently. Hilt and coworkers identified tri-n-butylphosphine oxide as a 31P NMR probe. Complexation with a hydrogen-bonding donor results in a downfield shift of the phosphorous peak.[6] This method was expanded by Franz et al. using triethylphosphine oxide (TEPO) as the 31P NMR probe.[7] This method effectively estimates hydrogen bond strengths for different classes of compounds including phenols, alcohols, benzoic acids, ureas, phosphoric acids, and boronic acids. The method, however, does require access to specialized equipment, namely a 31P NMR.
Using the experimental data previously obtained by Abraham et al., a computational method for the estimation of hydrogen bond acidity has been developed.[1] Vα(r) is the minimum electrostatic potential calculated at a distance, r, between the donor hydrogen and the atom to which it is bonded. While this method is computationally inexpensive, it does not account for explicit solvation, dimers, intramolecular complexation, or other effects encountered in many systems.
Schafer et al. developed a method for quantifying hydrogen bond strength based on interaction coordinates (HBSBIC) where the system is simplified to a three-atom fragment and the electron density is calculated using a MP2 method.[8] Le Questel et al. described a DFT method that uses quantum electrostatic parameters to calculate hydrogen bond strengths of hydroxyl groups in different molecules.[9] While the results correlate well to experimentally determined hydrogen bond acidities, the model is limited to hydroxy group calculations and did not account for interactions with the solvent.
The pKa slide rule was created to predict the strength of a hydrogen bond between a donor and acceptor pair based on their respective pKa values in water.[10] The pKa slide rule is limited to hydrogen bonding donors and acceptors dissolved in aqueous media with a pH between 0 and 14. While a quick and simple tool for the estimation of hydrogen bond strength, the correlation of pKa values with hydrogen bonding ability is not uniformly reliable (see below).
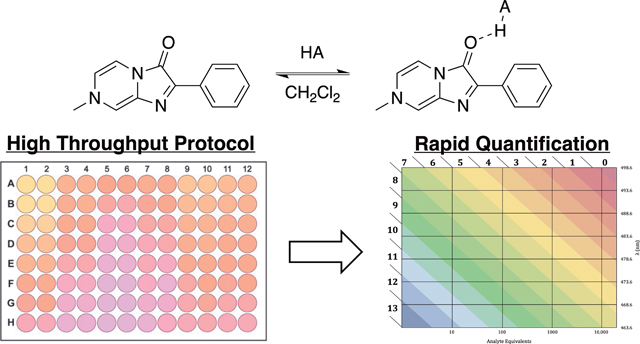
Our group has developed a simple method to assess hydrogen bond strengths.[11,12] A pyrazinone sensor, now commercially available,[13] is employed that undergoes a colorimetric change upon hydrogen bonding with an H-donor. The degree of the shift of λmax shift corresponds to hydrogen bond ability which provides an endpoint that can be assessed easily by broadly available UV/Vis spectrometers (Figure 3).
Figure 3.

Hydrogen bond donors in rapid equilibrium with the pyrazinone sensor results in a blue shift in the UV/Vis region.
In this report, a high throughput method utilizing the sensor is developed to assess a broad range of hydrogen bond donors with a particular focus on weaker hydrogen bond donors of relevance in biological systems and pharmaceutical development, which are typically difficult to measure. Such measurements have previously provided insight into the discrepancies in permeability between carboxylic acid group and its frequently used tetrazole bioisostere (93).[14] Further, new fitting of the larger resultant data set allows introduction of a simple and efficient procedure for assessment of relative hydrogen bond donating abilities through much simpler single point measurements.
Results and Discussion
Method Development
The strength of a hydrogen bond donor can be determined from both a titration with the pyrazinone sensor or by the endpoint λmax shift obtained upon saturation of the sensor. Without donor, the λmax of the sensor is 498.6 nm in dichloromethane. The addition of donor results in a blue shift in the sensor that continues until the sensor is saturated with donor. A plot of equivalents of hydrogen bond donor vs the maximum wavelength thus produces a sigmoidal curve as shown in Figure 2 for 2-iodobenzoic acid. While other more polar solvents like acetonitrile could be used for these measurements, the wavelength shifts were much smaller leading to poorer resolution of hydrogen bonding capacity and greater errors.
Figure 2.

Sample titration of hydrogen bond donor 2-iodobenzoic acid 13 with pyrazinone sensor.
Previous work published by our group has described titration of numerous hydrogen bond donors with the sensor using a single quartz cuvette with a UV/Vis spectrometer.[11] Specifically, the pyrazinone sensor was dissolved in dichloromethane and increasing equivalents (x) of a compound of interest were added with a spectroscopic measurement after each addition. The resultant data was fit to eq 1 where M is the midpoint of the titration (i.e., number of equivalents of hydrogen bonding agent where 50% of the sensor is bound) to determine the wavelength (λsat), or wavelength shift (Δλmax), which is representative of the stabilization energy afforded by the hydrogen bonding interaction.
| (1) |
From the above data, Keq values for binding of the sensor to the hydrogen bonding agent were determined using eq 2. A plot of ln(Keq) versus the wavelength shift in energy terms (1/λsat – 1/ λo) reveals a correlation indicating that the wavelength upon saturation of the sensor (λsat) can be used to assess hydrogen bonding strengths.
| (2) |
An alternate protocol has been developed here using microplate readers, which are widely available in industry and academia. Using plates, up to 96 titration points can be read in about five minutes. To increase throughput and ease of use, the previously reported sensor titration procedure was implemented in 96-well plate format. A 10 mM stock solution of the sensor S was prepared in CH2Cl2. This stock solution was diluted 1:100 in CH2Cl2 to create a working sensor solution (100 μM S). Stock solutions of the compounds to be titrated were prepared by dissolution in a volume of CH2Cl2 corresponding to the largest number of equivalents to be tested (e.g. 10 mM = 100 equiv). To the top row of a glass coated 96-well plate was added 200 μL compound stock solution. 100 μL CH2Cl2 was added to rows B-H. The compound stock solution was serially diluted to generate wells with 100 μL of compound solution. Then, 100 μL of the working sensor solution was added to each well (Final Sensor Concentration= 50 μM).
The absorbance of each well was measured from 450 nm to 550 nm in 1 nm steps. Regardless of the exact titration method employed, the initial sensor concentration can also be verified using the previously calculated extinction coefficient (e = 1.52 × 104 cm−1M−1 M−1) for the sensor in dichloromethane.[11]
To analyze the data collected with the well plate method, the absorbances of a plate containing a CH2Cl2 blank were subtracted from measured titration absorbances. To reduce the impact of noise, λmax was determined by fitting the recorded absorbances to a parabolic curve. Equivalents were graphed against λ and fit to a sigmoidal curve to determine the M and minimum wavelength (λsat) (eq 1). The Keq values were determined using eq 2.
To validate the method, eleven previously published titrations were replicated using the 96-well plate protocol (Figure 4). While the UV/Vis spectrometer used for the 96-well plate protocol had lower resolution than the spectrometer used for the cuvette assay (1 nm vs. 0.2 nm step), the simultaneous measurement of replicates confirms the accuracy of the measurement. A paired t-test of the ln(Keq) values from each protocol found no significant difference between the two procedures (p= 0.5003). The method was further validated by comparison with 31P NMR experiments (Figure S1A),[7] and logKHA data formulated by Abraham from IR, NMR, and calorimetry measurements (Figure S1B).[15]
Figure 4.

Comparison plots of ln(Keq) versus observed wavelength shift for cuvette and well plate methods.
Data Collection
Applications of the sensor in the field of medicinal chemistry can be found in the area of acid bioisosteres. Carboxylic acids are mostly dissociated at physiological pH and, as a result, are often unable to diffuse across biological membranes. The replacement of the negatively ionizable functional group with a comparatively weaker acid surrogate, neutral at physiological pH, provides a validated strategy to identify biologically active derivatives with enhanced permeability. The hydrogen bonding of solutes, however, is also known to play an important role in determining the passive diffusion across biological membranes.[16] Thus, quantification of the hydrogen bonding ability of carboxylic acid bioisosteres may be a valuable dimension to consider in structure-property relationship studies. Indeed, matched molecular pair (MMP) analysis of a series of 3-phenylpropanoic acid in which the carboxylic acid was replaced with different bioisosteres revealed that such replacements may differentially impact pKa and hydrogen bonding capabilities. Herein, sixty-five new titrations of weak hydrogen bond donors found in biologically active molecules have been added to data from titrations previously collected by our group and by Kass et al.[11,17–19]
The compounds surveyed include various acids, phenols, alcohols, linear and cyclic dicarbonyls, amides and ureas, thioamides and thioureas, sulfamides, heterocycles, and ammonium salts. The limitations of pKa values as a readout for hydrogen bonding capacity can be seen in a plot of reported pKa values for several compounds versus the ln(Keq) value measured with our sensor. As shown in Figure 5A, there is no correlation.[12,14,20] Clearly, alternative methods are needed quantify hydrogen bond strengths.
Figure 5.

A) Comparison plots of pKa versus ln(Keq) for compounds where pKa data is available. B) Comparison plots of para-Hammett parameters with ln(Keq) values for para-substituted phenols 24–32.
Figure 6 lists the measured ln(Keq) values arranged by functional group. Notably, two of the most acidic carboxylic acid bioisosteres are phosphonic acids like 1 [pKa1(H2O) ≈ 2] and phosphinic acids like 2 [pKa(H2O) ≈ 2].[21] While the phosphonic acid (lnKeq = 6.47) supports stronger hydrogen bonds than comparable carboxylic acids (lnKeq ≈ 4), the phosphinic acid (lnKeq = 2.70) is >1 order of magnitude weaker.
Figure 6.

Structures and ln(Keq) values for hydrogen bond donors titrated with the pyrazinone sensor color coded by functional group. aPreviously published titrations from the Kozlowski group.11 bTitrations performed by Kass et al.18,20,21
Substituent groups have a dramatic effect on hydrogen bonding ability, with the addition of strong electron withdrawing groups generally leading to stronger hydrogen bonds. This trend is readily apparent in the over four orders of magnitude between the hydrogen bonding ability of acetic acid 3 vs trifluoroacetic acid 4 (Figure 6). Other alkylcarboxylic acids such as ibuprofen (5) and naproxen (6) have values similar to acetic acid. a-Alkoxy acids (7–8) would generate stronger hydrogen bonds than acetic acid. Exploration of the electronic effects of different substituent groups in benzoic acids 9–17 revealed increasing hydrogen bonding ability as the substituents become more electron withdrawing. In line with expectations, 4-methoxybenzoic acid (10) with a donor group is slightly weaker (<1 order of magnitude) compared to benzoic acid (9). However, the isomer, 2-methoxybenzoic acid (11) is far weaker (almost 3 orders of magnitude) which is consistent with an intramolecular hydrogen bond, with the 2-methoxy group compromising th ability of 11 to act as an intermolecular hydrogen bond donor.[22] Compound 18 with three different hydrogen bond donors exhibted a stronger interaction with the sensor which may arise from two groups (phenol and carboxylic acid) chelating the sensor.
Boronic acids (19–21), which were shown to effectively act as organocatalysts via hydrogen bonding,[23] were also analyzed. Interestingly, boronic acids 19 and 20 were slightly poorer hydrogen bond donors with our sensor than the analogous benzoic acids 9 and 11. Though the pKa values of boronic acids are greater than those of carboxylic acids, the poor hydrogen bonding may be due to the formation of trimeric species. Alternatively, other modes of binding may be present to our sensor including coordination to the Lewis acidic boron centers as noted by Franz.[7] Hydroxamic acids 22–23 were more potent hydrogen bonding agents than the corresponding carboxylic acids.
In the group of moderately strong hydrogen bond donors, the majority of the phenols examined rank similarly to carboxylic acids which agrees with previous work by Abraham and Kenny that indicates common hydrogen bonding ability between phenols and unactivated carboxylic acids despite their six orders of magnitude difference in acidity.[1,4] This further supports the idea that hydrogen bonding in structurally similar compounds cannot be determined by simply looking at pKa values. A strong correlation could be seen between the ln(Keq) values for phenols 24–32 and sp,[24] and the large r value of 2.7 indicates that electronic effects of the substituents have a strong effect on hydrogen bond strength (Figure 5B). Varying the sterics of phenols 24–47 also had a substantial effect on hydrogen bonding, with bulkier di- and trisubstituted phenols 38–40 showing the weakest hydrogen bonding ability (compare to isoelectronic analog 41). The 2-benzylthiophenol 35 exhibited particularly weak hydrogen bond which can be accounted for through three factors working in concert: mild electron donor effect, intramolecular hydrogen bond, ortho-steric effect. The additive effects of substituents largely follow from the combined steric and electronic effects as seen in 41–47 with the pentafluorophenol 47 being a particularly strong hydrogen bond donor. Greater delocalization of the phenolic negative charge renders naphthol compounds 48–50 as slightly stronger hydrogen bond donors.
Most other alcohols (52–57) titrated were weak hydrogen bond donors as was water 51. One notable exception to this trend was hexafluoroisopropanol 55, an alcohol known to possess a strong hydrogen bonding ability.[25] Linear enol tautomers 58–62 are weaker donors than alcohols in spite of an isolated enol OH being relatively acidic (pKa ~ 11).[26] Cyclic enol tautomers 63 and 64 were much stronger hydrogen bond donors. The ability of linear enols to form intramolecular hydrogen bonds,[27] which cannot occur in cyclic enols, accounts for this trend.
The hydrogen bonding ability of amides is even weaker than that of alcohols as seen with 69 and 70. Succinimide 67 was somewhat more potent than the corresponding amides 69–70 and comparable to other nitrogen heterocycles incorporating two electron withdrawing carbonyl groups (77, 86). Isoxazole 68 was also comparable to carboxylic acids. Ureas (72–75) with electron withdrawing substituents can coordinate to the sensor via two hydrogen bonds and are potent hydrogen bond donors; the number of electron withdrawing groups correlates directly with the hydrogen bonding effectiveness.
Imide 77 with two electron withdrawing carbonyls would be expected to be a stronger hydrogen bond donor than amides (e.g. 69–70) although the effect of the second carbonyl is modest. Formation of hydrogen bonded dimers may account for this lower affinity. Isoelectronic compound 76 has one fewer carbonyl for aggregation and is a far more potent hydrogen bond donor. Interestingly, carbamate 65 with a less acidic hydrogen is a more effective hydrogen bond donor than the corresponding amides 69 and 70. Hydroxamic ester 66 is similar to an amide.
Thio-analogs display an interesting set of trends. Thioamides 78 and 79 are slightly stronger than amides 69 and 70. This may be explained by the greater acidity of the thioamide analogs and is consistent with literature in the area.[28,29] The parent thiourea 81 undergoes slightly stronger hydrogen bonding with the sensor compared to monodentate amides and thioamides. Thioureas have been proposed to engage in stronger hydrogen bonds than ureas based on the same acidity arguments as used for thioamides.[30] In our measurements, thiourea 80 is a slightly stronger hydrogen bond donor than urea 71, consistent with this reasoning. However, thioureas containing 3,5-bistrifluorophenyl groups were found to be weaker hydrogen bond donors than the corresponding ureas (compare 82–84 to 73–75).
Calculations reveal a possible genesis for this trend (see Supporting Information). In accord with the above measurements and literature trends, the computed binding energies [M06–2X/6–311++G(d,p)//M06–2X/6–31G(d)] indicate complexation of formaldehyde with thiourea 80 is more favorable than with urea 71. On the other hand, formaldehyde forms a stronger adduct to urea 75 vs thiourea 84. NCI plots reveal a stronger hydrogen bond between the neighboring arene C-H and the carbonyl oxygen vs the thiocarbonyl sulfur. This interaction polarizes the urea resulting in stronger hydrogen bonds from the urea NH groups.
Further compounds containing sulfur and acidic N–H bonds were examined (86–90). Thiocarbamate 86 is a slightly stronger hydrogen bond donor than carbamate 77, although there are additional structural changes between the two. However, thiadiazole 85 generates stronger hydrogen bonds relative to the oxa analog 76. Phosphorothioic triamide 87 with three N–H bonds generates a potent hydrogen bonding interaction stronger than even n-butylphosphonic acid 1 and comparable to trifluoroacetic acid 4. Sulfonamides 88–89 are slightly strong than amides and thioamides. Sulfuric diamide 90 lies in a similar range as the corresponding urea 75 and thiourea 84.
To provide useful data for drug-like structures, various nitrogen containing heterocycles were titrated. Incorporation of additional nitrogen atoms into the heterocycles 91–95 resulted in stronger hydrogen bonding culminating in triazole 94 which is comparable to most carboxylic acids and tetrazole 95 which is stronger than most carboxylic acids. Previously reported titrations of ammonium salts 96–110 are among the strongest hydrogen bond donors reported by titration with the sensor.[11,18,31,32] Addition of a positive charge to a pyridine gives rise to strongly polarizing groups that can profoundly alter the polarity of O–H and N–H bonds. For example, the introduction of one pyridinium substituent can be as effective as two bistrifluoromethylarenes (84 vs 105–108).
Tetrazole 95 is of special interest because it is one of the most used carboxylic acid bio-isosteres. In this case, significant differences in PAMPA permeability values between 95 and the corresponding acid 111 were noted despite the compounds possessing similar pKa values and lipophilicity as quantified by logD7.4 values.[14] Unexpectedly, the tetrazole was found to be much less permeable than the carboxylic acid. It was hypothesized that this difference in permeability stems from the hydrogen bonding abilities of each compound rather than their individual acidities or lipophilicities. A compound with stronger hydrogen bonding interaction to its environment would be less energetically favored in the hydrophobic lipid environment as permeation requires the breaking of these energetically favored hydrogen bond interactions. We found the tetrazole to have a much higher Keq and wavelength shift than the carboxylic acid group, at least within the scope of the interaction with amide carbonyl acceptors, lending support to this reasoning. Although this clear difference in hydrogen bonding ability may be the reason behind variations in permeability, it is important to consider the properties of the conjugate base formed when dealing with acidic species.
Model Development
We then set out to develop an easy-to-use method to estimate hydrogen bonding efficiency from one measurement with our commercially available sensor, a minimal amount of analyte, and common UV-Vis spectrometers. A three-dimensional surface representing all previous titrations performed can be fit to equation 1 which also reproduces the linear relationship between the 1/λsat and ln(Keq) (Figure 7A). A two-dimensional projection of this model is illustrated in Figure 7B, where the x-axis represents the equivalents of analyte added when the concentration of the sensor is 50 μM, the y-axis illustrates the wavelenght shift observed for the sensor, and the colored bands show the ln(Keq) value. The general form of the model (eq 3), however, can use any sensor concentration that the user employs.
Figure 7.

A) Three-dimensional surface derived from equations 1, 2, and S3. B) Two dimensional projection of Figure 7A with equivalents of analyte when concentration of sensor is 50 μM. Points show how ln(Keq) can be estimated from a single measurement.
This model indicates that λsat or ln(Keq) can be obtained for a compound from measurement of λ at a given concentration. For example, point 1 in Figure 7B occurs at 2.5 equivalents of analyte (with sensor at 50 μM) and l at 492.4 nm, which corresponds to a ln(Keq) value of 7.83. All the results in the same band correspond to ln(Keq) values near 8. Thus, use of a greater number of equivalents as in the case for point 2 (90 equivalents) result in a greater wavelength shift (474.8 nm) while giving rise to a simlar ln(Keq) value of 8.15. The predictive ability of the model is strongest when the l shift is highest, so use of a larger excess of the analyte to sensor is recommended. Typically, 1000 equivalents of analyte give good results unless the hydrogen bonding ability is very weak, in which case the use of 10,000 equivalents is recommended.
To facilitate the estimation of ln(Keq) from the measurement of a single point, a multiple linear regression was performed. This simple multiple linear regression model (eq 3), can successfully predict 95% of ln(Keq) values within one unit using λ and the concentrations of the analyte [A] and the sensor [S].
| (3) |
As seen in Figure 8, the lnKeq values from the above equation display a high degree of correlation with those obtained from titrations, with an intercept approaching zero and a slope of approximately one. Leave-one-out (LOO) and k-fold cross validations and external validation (see SI) suggest a robust model capable of predicting ln(Keq) values from one UV-Vis measurement of one mixture of analyte and sensor.
Figure 8.

Predicted v. experimental ln(Keq) values.
Predicting Hydrogen Bonding Ability
To demonstrate the efficacy of the model, the wavelength shift at one analyte concentration was measured for a variety of carboxylic acid bioisosteres, and several trends emerged (Figure 9A). The rows of Figure 9A contain the same hydrogen bond donor (OH vs NH2 vs NHSO2Me vs NHSO2NMe2 vs NHSO2Ph) while the first column contains the parent carbonyl and the remaining columns different carbonyl isosteres. Across every row, carbonyl analogs were consistently the strongest hydrogen bond donors. Oxetane and thietane analogs were 1–2 orders of magnitude weaker than their carbonyl counter parts. Oxidation to the thietane oxide and thietane dioxide analogs restored some hydrogen bonding affinity. Hydrogen bonding affinity generally increased down the columns with PhSO2NH > Me2NSO2NH > MeSO2NH > NH2 > OH. The strongest isostere measured was analog 131 containing carbonyl and electron withdrawing groups. Oxetane and thietane analogs (112 and 113, respectively) were the weakest hydrogen bond donors in this group. Thietane dioxide analog 135 was not soluble in CH2Cl2 at relevant concentrations
Figure 9.

Carboxylic acid bioisosteres and predicted ln(Keq) values based on the multilinear regression model.
The results of these single point measurements were validated by full titration for compounds 111–115, 121, and 126. As seen in Figure 9B, the single point predictions are highly correlated to the experimental titration ln(Keq) values. The advent of the single point measurement allows small quantities (~2 mg) of analyte to be rapidly assayed in small volumes (200 μL).
Conclusion
Accurate assessments of hydrogen bonding affinity can be made using a streamlined well plate method, allowing rapid titration of a molecule with the sensor in small volume. Over 100 molecules of biological relevance were titrated and provide an overview of general hydrogen bonding trends for functional groups that are used broadly in pharmaceutical development. The resultant values were also used to derive a formula that models the relationship between binding affinity and wavelength shift to estimate the ln(Keq) value of a molecule based on a single measurement with the sensor. This method has allowed us to estimate the hydrogen bonding affinity of molecules that have poor solubility in dichloromethane (cannot be titrated to endpoint) and molecules that cannot be obtained in large quantities. The effectiveness of the single point formula was validated using several previously synthesized carboxylic acid bioisosteres. This streamlined procedure thus allows for rapid quantification of hydrogen bonding acidity by a single measurement using broadly available UV-Vis spectrometers.
Experimental Section
Cuvette Method:
An oven-dried 10 mL volumetric flask was charged with sensor S (10.0 mg, 4.44×10⁻² mmol) and diluted with CH2Cl2. A 2.22×10⁻⁵ M stock solution was prepared by transferring 50 μL of this initial solution to a separate 10 mL volumetric flask and diluting with CH2Cl2. For each UV titration experiment, 500 μL of this stock sensor solution was transferred to the UV cuvette. To a Spectrosil Quartz Starna cell 2×10 mm, 0.50 mL of the 2.22×10⁻⁵ M sensor stock solution was added, and the level of the solution was marked. Aliquots of the compound stock solution were sequentially added, and the initial 0.5 mL volume was maintained by evaporation under an argon balloon to the demarcated line. UV spectra were obtained using a JASCO FT/IR-480 Plus from 550 nm – 450 nm. The spectrum was measured after each addition and the λmax was recorded. Aliquots of the catalyst stock solution were added until the λmax did not change further. Adapted from reference 11.
Well Plate Method:
A 2 mM stock solution was prepared by the dilution of sensor S with CH2Cl2. In a similar manner, analyte stock solutions (5 mM to 1 M) were prepared. Using a multi-channel pipette, 200 μL of analyte stock solution was added to rows A and B of a glass coated, flat-bottom 96-well plate. To rows C-H was added 100 μL CH2Cl2. Beginning in row B, six two-fold dilutions were made. From row B, 100 μL of solution was aspirated, which was then dispensed into row C. This process was repeated down the plate. Ultimately, 100 μL was removed from row H and discarded. An additional 100 μL CH2Cl2 was dispensed in rows B-H (total volume= 200 μL). Prior to insertion into the plate reader, 5 μL of sensor stock solution was added to each well. UV spectra were obtained using a Tecan Infinite M1000 microplate reader from 550 nm – 450 nm. Data was collected in duplicate. The λmax was determined by fitting the absorbance data for each well to a parabolic curve.
Single Point Method:
A 500 μM stock solution was prepared by the dilution of sensor S with CH2Cl2. In a similar manner, 2 mM analyte stock solutions were prepared. To a well of a glass coated, flat-bottom 96-well plate was added 100 μL of the analyte stock solution followed by 80 μL CH2Cl2 and 20 μL of sensor stock solution. UV spectra were obtained using a Tecan Infinite M1000 microplate reader from 550 nm – 450 nm. Data was collected in duplicate. The λmax was determined by fitting the absorbance data for each well to a parabolic curve.
Sources of materials, benchmarking against other methods, model derivation, model validation, tabular data, and titration data can be found in the Supporting Information.
Supplementary Material
Figure 1.

Examples of organic sensors used for hydrogen bond strength determination.
Acknowledgements
M.C.K. thanks the NIH (R35 GM131902) for financial support. Partial instrumentation support was provided by the NIH (3R01GM118510-03S1, 3R01GM087605-06S1) as well as the Vagelos Institute for Energy Science and Technology. We are grateful to the Kass group (University of Minnesota) for sharing the raw data from their previous UV-Vis titrations and the Chenoweth group (University of Pennsylvania) for allowing us access to their UV-Vis spectrometer. H.F.R. thanks the NSF for a GRFP fellowship (1650114).
References
- [1].Kenny PW, J. Chem. Inf. Model 2009, 49, 1234–1244. [DOI] [PubMed] [Google Scholar]
- [2].Abraham MH, Duce PP, Morris JJ, Taylor PJ, Hydrogen Bonding Part 2.-Equilibrium Constants and Enthalpies of Complexation for 72 Monomeric Hydrogen-Bond Acids with N-Methylpyrrolidinone in 1,1,1-Trichloroethane, 1987. [Google Scholar]
- [3].Abraham MH, Duce PP, V Prior D, Barratt DG, Morris JJ, Taylor PJ, J. Chem. Soc. Perkin Trans. 2 1989, 2, 1355–1375. [Google Scholar]
- [4].Abraham MH, Duce PP, Schulz RA, Morris JJ, Taylor PJ, Barratt DG, Hydrogen Bonding Part 1.-Equilibrium Constants and Enthalpies of Complexation for Monomeric Carboxylic Acids with N-Methylpyrrolidinone in 1,1,1-Trichloroethane, 1986. [Google Scholar]
- [5].Abraham MR, Duce PP, Grellier PL, Prior DV, Morris JJ, Taylor PJ, Tetrahedron Lett. 1988, 29, 1587–1590. [Google Scholar]
- [6].Nödling AR, Jakab G, Schreiner PR, Hilt G, Eur. J. Org. Chem. 2014, 2014, 6394–6398. [Google Scholar]
- [7].Diemoz KM, Franz AK, J. Org. Chem. 2018, 84, 1126–1138. [DOI] [PubMed] [Google Scholar]
- [8].Kumar Pandey S, Manogaran D, Manogaran S, Schaefer III HF, J. Phys. Chem. A 2017, 121, 6090–6103. [DOI] [PubMed] [Google Scholar]
- [9].Graton J, Besseau F, Brossard A-M, Charpentier E, Deroche A, Le Questel J-Y, J. Phys. Chem. A 2013, 117, 13184–13193. [DOI] [PubMed] [Google Scholar]
- [10].Gilli P, Pretto L, Bertolasi V, Gilli G, Acc. Chem. Res. 2008, 42, 33–44. [DOI] [PubMed] [Google Scholar]
- [11].Walvoord RR, Huynh PNH, Kozlowski MC, J. Am. Chem. Soc. 2014, 136, 16055–16065. [DOI] [PMC free article] [PubMed] [Google Scholar]
- [12].Huynh PNH, Walvoord RR, Kozlowski MC, J. Am. Chem. Soc. 2012, 134, 15621–15623. [DOI] [PMC free article] [PubMed] [Google Scholar]
- [13].7-Methyl-2-Phenylimidazo[1,2-a]Pyrazin3(7H)-One; No MSDS. 912018; Aldrich: St. Louis, MO. October 11, 2020. [Google Scholar]
- [14].Lassalas P, Gay B, Lasfargeas C, James MJ, Tran V, Vijayendran KG, Brunden KR, Kozlowski MC, Thomas CJ, Smith III AB, et al. , J. Med. Chem. 2016, 59, 3183–3203. [DOI] [PMC free article] [PubMed] [Google Scholar]
- [15].Abraham MH, Grellier PL, Prior DV, Duce PP, Morris JJ, Taylor PJ, J. Chem. Soc. Perkin Trans. 2 1989, 699. [Google Scholar]
- [16].Goodwin JT, Conradi RA, Ho NFH, Burton PS, J. Med. Chem. 2001, 44, 3721–3729. [DOI] [PubMed] [Google Scholar]
- [17].Riegel GF, Kass SR, J. Org. Chem. 2020, 85, 6017–6026. [DOI] [PubMed] [Google Scholar]
- [18].Fan Y, Payne C, Kass SR, J. Org. Chem. 2018, 83, 10855–10863. [DOI] [PubMed] [Google Scholar]
- [19].Payne C, Kass SR, 2020, DOI 10.1002/poc.4069. [DOI] [Google Scholar]
- [20].Bordwell FG, Acc. Chem. Res. 1988, 21, 456–463. [Google Scholar]
- [21].I. M. (Izaak M. Kolthoff, P. J. Elving, 1959.
- [22].Jaccard G, Carrupt P-A, Lauterwein J, Magn. Reson. Chem. 1988, 26, 239–244. [Google Scholar]
- [23].Wang J, Zhang Y, ACS Catal. 2016, 6, 4871–4876. [Google Scholar]
- [24].Hansch C, Leo A, Taft RW, Chem. Rev. 1991, 91, 165–195. [Google Scholar]
- [25].Purcell KF, Stikeleather JA, Brunk SD, J. Mol. Spectrosc. 1969, 32, 202–213. [Google Scholar]
- [26].Chiang Y, Kresge AJ, Tang YS, Wirz J, J. Am. Chem. Soc. 1984, 106, 460–462. [Google Scholar]
- [27].Yoshida Z, Ogoshi H, Tokumitsu T, Tetrahedron 1970, 26, 5691–5697. [Google Scholar]
- [28].Lee H-J, Choi Y-S, Lee K-B, Park J, Yoon C-J, J. Phys. Chem. A 2002, 106, 7010–7017. [Google Scholar]
- [29].Senthilkumar L, Ghanty TK, Ghosh SK, 2005, DOI 10.1021/jp052304j. [DOI] [Google Scholar]
- [30].Zheng W, Fu Y, Liu L, Guo Q, Acta Physico-Chimica Sin. 2007, 23, 1018–1024. [Google Scholar]
- [31].Riegel GF, Kass SR, J. Org. Chem. 2020, 85, 6017–6026. [DOI] [PubMed] [Google Scholar]
- [32].Payne C, Kass SR, J. Phys. Org. Chem. 2020, 33, DOI 10.1002/poc.4069. [DOI] [Google Scholar]
Associated Data
This section collects any data citations, data availability statements, or supplementary materials included in this article.