

Abstract
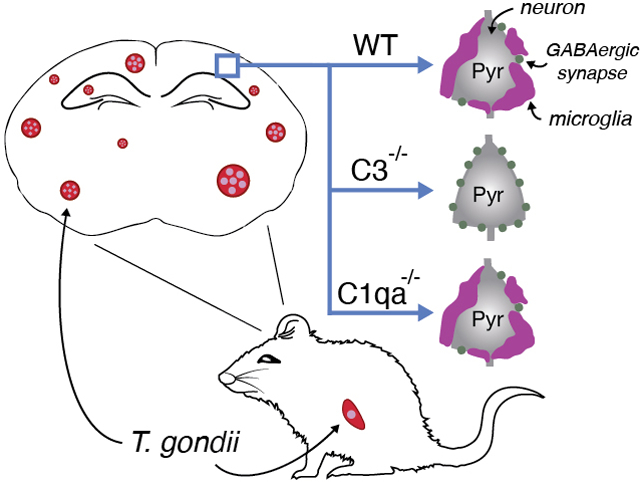
The apicomplexan parasite Toxoplasma gondii has developed mechanisms to establish a central nervous system infection in virtually all warm blooded animals. Acute T. gondii infection can cause neuroinflammation, encephalitis, and seizures. Meanwhile, studies in humans, non-human primates, and rodents have linked chronic T. gondii infection with altered behavior and increased risk for neuropsychiatric disorders, including schizophrenia. These observations and associations raise questions about how this parasitic infection may alter neural circuits. We previously demonstrated that T. gondii infection triggers the loss of inhibitory perisomatic synapses, a type of synapse whose dysfunction or loss has been linked to neurological and neuropsychiatric disorders. We showed that phagocytic cells (including microglia and infiltrating monocytes) contribute to the loss of these inhibitory synapses. Here, we show that these phagocytic cells specifically ensheath excitatory pyramidal neurons, leading to the preferential loss of perisomatic synapses on these neurons and not those on cortical interneurons. Moreover, we show that infection induces an increased expression of the complement C3 gene, including by populations of these excitatory neurons. Infecting C3-deficient mice with T. gondii revealed that C3 is required for the loss of perisomatic inhibitory synapses. Interestingly, loss of C1q did not prevent the loss of perisomatic synapses following infection. Together, these findings provide evidence that T. gondii induces changes in excitatory pyramidal neurons that trigger selective removal of inhibitory perisomatic synapses and provide a role for a non-classical complement pathway in the remodeling of inhibitory circuits in the infected brain.
Keywords: Toxoplasma gondii, complement, inhibitory synapse, microglia, pyramidal neuron, parvalbumin interneuron
Graphical Abstract
Infection with Toxoplasma gondii is associated with altered behavior and increased vulnerability to developing neuropsychiatric disorders. We previously showed that long-term T. gondii infection leads to seizures and the loss of inhibitory perisomatic synapses in mice Here, we show that infection leads to preferential ensheathment of excitatory neurons by microglia. Analysis in targeted mouse mutants revealed that complement C3, but not C1q, is required for the phagocytosis of inhibitory perisomatic synapses by microglia following infection. This suggests a role for the alternative complement pathway in T. gondii -induced changes in inhibitory neural circuits in mouse neocortex.
INTRODUCTION
The central nervous system (CNS) is protected by a vascular blood-brain barrier that prevents pathogens from entering the brain. However, in some cases, select pathogens have evolved mechanisms to traverse this barrier and invade the CNS. The apicomplexan parasite, Toxoplasma gondii, is one such pathogen that enters the brain and can establish a long-lasting CNS infection in almost all warm-blooded animals, including humans (Dubey, 2009, Montoya and Liesenfield, 2004). In fact, it is estimated that over 30% of the global human population are chronically infected with Toxoplasma (Flegr et al., 2014, Pappas, Roussos, and Falagas, 2009). Although there are several ways in which humans come into contact with T. gondii, we most commonly become infected by ingestion of raw or undercooked meat contaminated by T. gondii tissue cysts or by consumption of vegetables and water that have T. gondii oocysts shed from the feline definitive host (Hajimohammadi et al., 2022, Jones and Dubey, 2005, Dabritz et al., 2007). Upon oral ingestion, T. gondii cysts and oocysts rupture and transform into tachyzoites, the form of the parasite that rapidly grows and disseminates throughout the host (Montoya and Liesenfield, 2004). This acute phase of the infection is characterized by a severe inflammatory response. Subsequently, the tachyzoite form of the parasite invades cells, differentiates into bradyzoites, and forms intracellular cysts. While these cysts can persist long-term in the host cell, they can also reactivate. If reactivation occurs in an immunocompetent individual the tachyzoites that emerge will activate a cellular immune response that rapidly and efficiently controls the acute infection. In the absence of such an immune response in an immunocompromised individual, or if the immune response is too robust, disease will ensue. In such cases, the brain is the most commonly affected tissue, with patients developing life-threatening seizures, toxoplasmic encephalitis (TE) and other neurological sequelae (Wong and Remington, 1993, Suzuki and Remington, 1993, Montoya and Liesenfeld, 2004).
Although tachyzoites can invade any nucleated cell, in the brain, they preferentially infect neurons where they transform into cyst-encased bradyzoites that are protected from immune-clearance. (Dubey, 2009, Melzer et al., 2010, Cabral et al., 2016, McConkey et al., 2013, Sims et al., 1989). In addition to the neurological sequelae described above during TE, a substantial body of evidence suggests that chronic T. gondii infection (in the absence of inflammation or TE), can alter behavior in infected hosts (Berdoy et al., 2000, Beste et al., 2014, Vyas et al., 2007). Moreover, dozens of studies including a large-scale retrospective study of over 80,000 individuals, indicate a significant association between T. gondii infection and an increased risk for developing neuropsychiatric disorders, including schizophrenia (Burgdorf et al., 2019, Dickerson et al., 2014, 2017, 2018, Kano et al., 2020, Wang et al., 2019, Xiao et al., 2018). How either acute or chronic T. gondii infections impact neural circuits and lead to behavioral, neurological, or psychiatric alterations remains unclear.
Rodent models of T. gondii infection are beginning to shed light on the impact that this parasite has on neural circuits by demonstrating that infection leads to spontaneous seizure development and an increased susceptibility to drug-induced seizures (Brooks et al., 2015, David et al., 2016). In these models, T. gondii infection also leads to changes in neurotransmitter synthesis and release (Alsaady et al., 2019, Gatkowska et al., 2016, Martin et al., 2015, Skallova et al., 2006) and altered neural circuits (Brooks et al., 2015, Ihara et al., 2016, Lang et al., Parlog et al., 2015). This is especially true for the inhibitory neurotransmitter, gamma-aminobutyric acid (GABA), and GABAergic circuits in the telencephalon (including the hippocampus and cerebral cortex). T. gondii is able to modulate the synthesis of GABA by upregulating expression of GABA synthesis enzymes, GAD65 and GAD67, and downregulating GABA-T, the enzyme responsible for breaking down GABA (Fuks et al., 2012, Bhandage et al., 2020). Additionally, T. gondii infection not only leads to an altered distribution of GAD67 (Brooks et al., 2015) but it also leads to the loss of perisomatic GABAergic synapses in both the hippocampus and cerebral cortex (Carrillo et al., 2020), two regions that the parasite has tropism for (Berenreiterová et al., 2011).
Our prior studies indicate that the loss of inhibitory perisomatic synapses following T. gondii infection involves the activation of phagocytic cells, which in the infected brain, include both activated microglia and macrophages derived from infiltrating monocytes (Glausen et al., 2021). These phagocytic cells enseheath neuronal somata and subsequently phagocytose perisomatic inhibitory synapses in the T. gondii-infected neocortex (Carrillo et al., 2020). Yet, whether perisomatic inhibitory synapse loss is an indiscriminate process or specific to cell types, and the mechanism underlying synapse loss has remained unclear. Here, we sought to address these two important questions. Our results show that these phagocytic cells do in fact preferentially ensheath the somata of excitatory pyramidal neurons in neocortex and that these excitatory neurons differentially express complement C3 following T. gondii-infection. Loss of C3, but not C1qa, prevents the loss of perisomatic inhibitory synapses following infection and substantially reduced neuronal ensheathment, suggesting the necessity of nonclassical complement pathways in parasite-mediated synapse loss.
MATERIALS AND METHODS
Animals
C57/BL6 mice (JAX #000664; RRID:IMSR_JAX:0000664), C3−/− mice (JAX #029661, genetic background: C57BL/6J; RRID:IMSR_JAX:029661), C1qa−/− mice (JAX #031675, genetic background: C57BL/6J; RRID:IMSR_JAX:031675); CX3R1-GFP mice (JAX #005582, genetic background: C57BL/6J; RRID:IMSR_JAX:005582) were obtained from Jackson Laboratory. PV-Cre-YFP mice were generated from crossing Parv-Cre mice (JAX #008069, genetic background: C57BL/6J; RRID:IMSR_JAX:008069) with Thy1-stop-yfp15 mice (JAX #005630, genetic background: C57BL/6J; RRID:IMSR_JAX:005630) for several generations. All mice were genotyped before infection and experimentation (C3 genotyping primers: Comm: ATCTTGAGTGCACCAAGCC, Wt: GGTTGCAGCAGTCTATGAAGG, Mut: GCCAGAGGCCACTTGTGTAG; C1qa genotyping primers: F: TGCATCCTGCCATCTCCT, R: GAAAGTGCTTAAAGAAACCACTG; CX3CR1 genotyping primers: Comm: CCCAGACACTCGTTGTCCTT, Wt: GTCTTCACGTTCGGTCTGCT, Mut: CTCCCCCTGAACCTGAAAC ; GFP genotyping primers: F: AAGTTCATCTGCACCACCG, R: TCCTTGAAGAAGATCGTGCG; Cre genotyping primers: F: CGTACTGACGGTGGGAGAAT, R: TGCATGATCTCCGGTATTGA; YFP genotyping primers: F: AAGTTCATCTGCACCACCG, R: TCCTTGAAGAAGATGGTGCG). All primers were purchased from Integrated DNA Technologies. Both sexes were used for all experiments. Prior to infection, mice were housed in the same ABSL-1 temperature-controlled room with a 12 hr dark/light cycle and ad libitum access to food and water. Upon infection, mice were moved to an ABSL-2 room with similar temperature-control, 12 hr dark/light cycle, and they continued to have ad libitum access to food and water, supplemented with wet food. Experiments were performed in compliance with National Institute of Health (NIH) guidelines and protocols were approved by both the Institutional Animal Care and Use Committee (IACUC) and Institutional Biosafety Committee (IBC) at Virginia Tech (IACUC#s 20–056, 21–085, 21–130 and IBC# 21–071). Unless otherwise stated, n = number of animals and age-matched mock or ME49-infected wild-type or transgenic mice were used where multiple animals were compared. Sample size was estimated based on prior experiments using similar approaches in infected mice (Brooks et al. 2015; Carrillo et al. 2020). This study was not pre-registered, and no blinding or randomization was performed. In total, 56 mice were used in these studies. No animals used in the experiments described were excluded from the analyses performed.
Parasite infections
As previously described, age-matched male and female mice (~8 weeks of age) were infected with the Type II ME49-RFP (red fluorescent protein-tagged) strain of T. gondii (Brooks et al., 2015, Carrillo et al., 2020). The total number of T. gondii cysts within 20μl of infected brain homogenate was determined by fluorescence microscopy. Mice were interperitoneally infected with either 2 ME49-RFP cysts in PBS or PBS alone as controls. For time course experiments, brains were collected after 7 days, 12 days, 21 days, and 30 days of infection. For long-term infection, brains were collected 30 days following infection.
Tissue Preparation
Tissue was prepared as previously described (Su et al., 2010). Briefly, a lethal dose of tribromoethanol (Avertin; at a concentration of 12.5 ug/ml) was administered. Avertin was prepared by mixing 2.5g of tribromoethanol in 5mL of 2-methyl-2-butanol and 200 mL of distilled water (pH 7.4). This solution was filtered through a 0.2μm Millipore filter, was stored in the dark at 4°C, and was used within two weeks of preparation. Once Avertin was administered via intraperitoneal injection, mice were perfused with 10 mL of DEPC-treated 1x PBS followed by DEPC-treated 4% PFA pH 7.4. Brains were kept overnight at 4°C in 4% DEPC-PFA and then transferred to 30% DEPC-sucrose for at least 4 days. Fixed brains were embedded in Tissue Freezing Medium (Electron Microscopy Sciences), frozen overnight, and coronally sectioned on a Leica CM1850 cryostat at 16μm thickness. Prepared tissue slides were kept in −20°C for later IHC and ISH experiments.
Immunohistochemistry (IHC)
Tissue slides were air-dried at room temperature for 15 minutes. Slides were incubated in IHC blocking buffer (2.5% bovine serum albumin, 5% normal goat serum, 0.1% Triton-X in PBS) for 1 hour. Primary antibodies were diluted in blocking buffer as follows: GAD67 (Millipore MAB5406; RRID:AB_2223041; 1:1000); IBA1 (Wako, Richmond, VA; 019–19741; RRID:AB_839504; 1:700); CD68 (Abcam Cambridge, UK; AB53444; RRID:AB_869007; 1:1000); CTIP2 (Abcam, AB18465; RRID:AB_2064130; 1:500); CALB (Swant, CB-38a; RRIR:AB_10000340; 1:1000); SST (Millipore, MAB354; RRID:AB2255365; 1:200); GFP (Thermo Fisher Scientific, Waltham, MAA-11122; RRID:AB_221569; 1:200). Tissue slides were incubated in diluted primary antibody at 4°C for a minimum of 15 hrs. After removal of primary antibody, slides were washed in 1x PBS for an hour, followed by incubation with fluorophore-conjugated secondary antibodies diluted IHC blocking buffer at 1:1000 for 1 hour room temperature. Lastly, after several washes in 1x PBS, tissue sections were either stained with 4’,6-diamidino-2-phenylindole (DAPI) or with NeuroTrace 640/660. NeuroTrace staining was performed as follows: First, slides were incubated in 0.1% Triton-X in PBS for 10 minutes, washed in 1x PBS twice for 5 minutes each, incubated in NeuroTrace (diluted 1:250 in PBS (Thermo Fisher, N21483)) for 35 minutes in room temperature, washed in 0.1% Triton-X in PBS for 10 minutes, and two final washes in 1x PBS. Stained tissued sections were mounted using VectaShield (Vector Laboratories, RRID:AB_2336789).
Riboprobe production
All riboprobes were generated as described (Su et al. 2010; Monavarfeshani et al., 2018). pCMV-SPORT6 plasmids carrying C3 (cat # 5134713), Syt1 (cat # 5363062), and Npnt (cat # 5149204) were obtained from Horizon Discovery (previously GE Dharmacon). Gad1 cDNA, C1qa cDNA, and Vglut1 cDNA were generated and amplified as previously described (Monavarfeshani et al., 2018). The following primers were used: Gad1 primers (F: TGTGCCCAAACTGGTCCT; R:TGGCCGATGATTCTGGTT); C1qa primers (F: ATGGGGCTCCAGGAAATC; R: AGTCCTCAGTGCCCTCCC); Vglut1 primers (F: CAGAGCCGGAGGAGATGA; R: TTCCCTCAGAAACGCTGG) all obtained from Integrated DNA Technologies, Coraville, IL. cDNAs were generated using Superscript II Reverse Transcriptase First Strand cDNA Synthesis kit (#18064014, Invitrogen) according to the manufacturer manual, amplified by PCR using primers designed for the above gene fragments, gel purified, and then cloned into a pGEM-T Easy Vector using pGEM-T Easy Vector kit, (#A1360, Promega) according to the kit manual. Anti-sense riboprobes against target genes were synthesized from 5 μg linearized plasmids using digoxigenin-(DIG) or fluorescein-labeled uridylyltransferase (UTP) (#11685619910, #11277073910, Roche, Mannheim, Germany) and the MAXIscript in vitro Transcription Kit (#AM1312, Ambion) according to the kit manual. 5 μg of riboprobe (20 μl) were hydrolyzed into ~0.5 kb fragments by adding 80 μl of water, 4 μl of NaHCO3 (1 M), 6 μl Na2CO3 (1 M) and incubating the mixture in 60°C. RNA fragments were finally precipitated in ethanol and resuspended in RNAase-free water. Custom-made riboprobes will be made available upon reasonable request.
In situ hybridization (ISH)
ISH was performed using the in-house generated riboprobes on fixed tissue, prepared with DEPC-treated reagents as described above. Tissue sections on slides were fixed in 4% DEPC-PFA for 10 minutes at room temperature, washed with 1x DEPC-PBS, and incubated with proteinase K solution ( 1ug/mL in 50 mM Tris pH 7.5, 5 mM EDTA) for 10 minutes at room temperature. Slides were then washed with 1x DEPC-PBS, incubated in 4% DEPC-PFA for 5 minutes at room temperature, and incubated in acetylation solution (0.25% acetic anhydride, 20 mM hydrochloric acid and 1.33% triethanolamine) for 10 minutes at room temperature. To permeabilize the tissue, slides were incubated in 1% triton in DEPC-PBS for 30 minutes room temperature. To block endogenous peroxidase, slides were incubated in 0.3% hydrogen peroxide in DEPC-PBS for 30 minutes at room temperature, followed by DEPC-PBS washes. Tissue sections were equilibrated in hybridization solution (40 mL of prehybridization solution, 1.6 mL of 5 mg/mL, and 25 mg Roche yeast RNA #10109223001) for 1 hour at room temperature. Riboprobes were denatured for 10 minutes at 80°C, applied to tissue sections, cover slipped, and incubated overnight at 65°C (probes were denatured for 10 minutes at 80°C). On day 2, coverslips were removed by slide incubation in 2x saline-sodium citrate solution for 5 min in 65°C, and slides underwent several 45 minute-long washes at 65°C, with a final wash at room temperature, followed by rinsing with 0.2x saline-sodium citrate solution in tris-buffered saline (TBS) at room temperature. Slides were incubated in ISH blocking buffer (10% lamb serum 0.2% Roche blocking reagent in TBS) for 1 hour at room temperature and then incubated overnight at 4°C in HRP-conjugated anti-Diogoxigenin or anti- Fluorescein antibodies (anti-Diogoxigenin-POD - Millipore Sigma, Cat#11207733910, RRID:AB_514500, 1:2000; anti-Fluorescein-POD - Millipore Sigma, Cat#11426346910, RRID:AB_840257, 1:3000). On day three, riboprobes were identified using a Tyramide Signal Amplification (TSA) system (#NEL75300 1KT, PerkinElmer). For double riboprobe ISH, the first riboprobe antibody was quenched by incubation in 2% hydrogen peroxide in TBS for 1 hour and 15 minutes at room temperature. After washing with TBS, slides were incubated in ISH blocking buffer for 1 hour at room temperature and incubated overnight at 4°C in the second HRP-conjugated anti-DIG or anti-FL antibody. On day four, the second riboprobe was identified with the TSA system and then washed with TBS. For IHC following ISH, slides were incubated in IHC blocking buffer and IHC was performed as described above.
Imaging and quantification
Images were acquired with a Zeiss LSM700 confocal microscope. Representative images shown in figures are of a maximum intensity projection, unless otherwise noted. Analyses were performed with single optical section images, as described below for each type of analysis.
Quantification of cell density (Vglut1+, Gad1+, PV-Cre-YFP+, IBA1+):
For assessment of cell numbers in cortical layer V, images were obtained using 40x magnification (20× 2 zoom). Counts were performed manually. The “Count Tool” function in Adobe Photoshop (Adobe Inc., version: 21.1.2) was used to keep track of cell counts and colocalized counts. Layer IV – VI cell counts were obtained from 20x images. Cell counts are normalized by the ROI area described as μm2.
Cell type ensheathment analysis:
Excitatory and inhibitory cell types were labeled either by immunohistochemistry (CTIP2, SST, CALB) or by use of a transgenic reporter (PV-Cre-YFP; details in ‘Animals’ section). Tissue was co-stained with NeuroTrace for visualization of the entire neuronal soma (except for PV-Cre-YFP). Images were taken at 40x magnification to capture only cortical layer V at 1μm intervals. Cells of interest were identified by colocalization of cell type marker with NeuroTrace, and the % somata coverage by IBA1+ cell was calculated by length of IBA1+ cell or process contact neuronal soma (μm) / neuronal soma perimeter (μm) for each optical section where the cell’s NeuroTrace signal was visible. Length and perimeter measurements were taken with ImageJ. % soma coverage calculations on individual optical sections were averaged to obtain % soma coverage for each cell. Data is shown as quantification of biological replicates (mean of all cells from each animal) and plotted as individual cell data points to show distribution across all animals.
Inhibitory perisomatic synapse analysis:
Cells were labeled transgenically (PV-Cre-YFP) or by NeuroTrace. Inhibitory perisomatic synapses were identified with GAD67 immunolabeling. Images were taken at 40x magnification to capture only cortical layer V at 0.5μm intervals. The number of GAD67+ puncta contacting the perimeter of NeuroTrace-labeled neuronal soma were counted manually and normalized to the neuronal soma perimeter (measured by ImageJ) at each optical section. Calculations from optical sections were averaged to obtain a single calculation of the number of GAD67+ puncta / 10μm perimeter of neuronal soma. Data is shown as quantification of biological replicates (mean of all cells from each animal) and plotted as individual cell data points to show distribution across all animals.
Colocalization analysis:
All ISH colocalization (Syt1 and C3, Syt1 and C1qa, Npnt and C3, Gad1 and C3, Npnt and Vglut1, Npnt and Gad1) was determined by single optical image sections. The “Count Tool” function in Adobe Photoshop was used to keep track of cell counts and colocalized counts.
IBA1 masked analysis (C1qa and CD68):
IBA1+ cells were masked using the ‘threshold’ and ‘analyze particles’ functions in ImageJ. The masks were superimposed to either the CD68 channel, or the C1qa channel and the mean signal intensity was calculated within the masks, and outside the masks (by inverting the ROI).
Quantifications and statistics
All analyses were performed with at least 3–4 biological replicates per genotype and condition. Both sexes were used in the quantification. No data or animals were excluded. No sex-specific differences were observed with the number of animals used. Statistical analyses (Student’s t-test or one-way ANOVA with Sidak’s correction for multiple comparisons as indicated in figure legends) were performed using GraphPad Prism (version 8.0; RRID: SCR_002798). P < 0.5 values were considered to be significantly different (P values included in figure legends). Data points represent biological replicates or individual cells analyzed as described in figure legends and are plotted as ± SEM or mean, respectively.
Quantitative Real Time PCR (qPCR)
RNA was extracted and purified using the Aurum Total RNA Fatty and Fibrous Tissue kit (Bio-Rad #: 7326870) according to the manufacturer’s protocol. Purified RNA was used to generate cDNA using the Superscript II Reverse Transcriptase First Strand cDNA Synthesis kit (Invitrogen), which was then used as a template. For quantifying relative mRNA expression levels, qPCR was performed on a CFX Connect Real Time System (Bio-Rad) using the iTaq SYBRGreen Supermix (Bio-Rad #: 1725124) according to the manufacturer’s protocol. The following cycling conditions were used with 12.5 ng of cDNA: 95°C for 30seconds, 42 cycles of amplification at 95°C for 10 seconds and 60°C for 30 seconds, and a melting curve analysis. Relative mRNA quantities were determined using the ΔΔ-CT method. A minimum of three biological replicates, each ran in triplicate, were processed for each gene of interest. The following primers were used: Hprt1-F: TCAGTCAACGGGGGACATAAA, Hprt1-R: AGTTGCCCATCTTTCATCACTG; C1qa-F: AACTTGGCAGTGTCCTCACTG, C1qa-R: GTCTCCATGGTGTCCCTGC; C3-F: TATGGGACCAGCTTCAGGT, C3-R: TGGGAGTAATGATGGAATACATGGG. C3 and C1qa expression levels were normalized to control, Hprt1 and are shown as fold-change relative to mock-infected levels.
RESULTS
Differential ensheathment of cortical neurons by IBA1+ phagocytes in parasite-infected neocortex
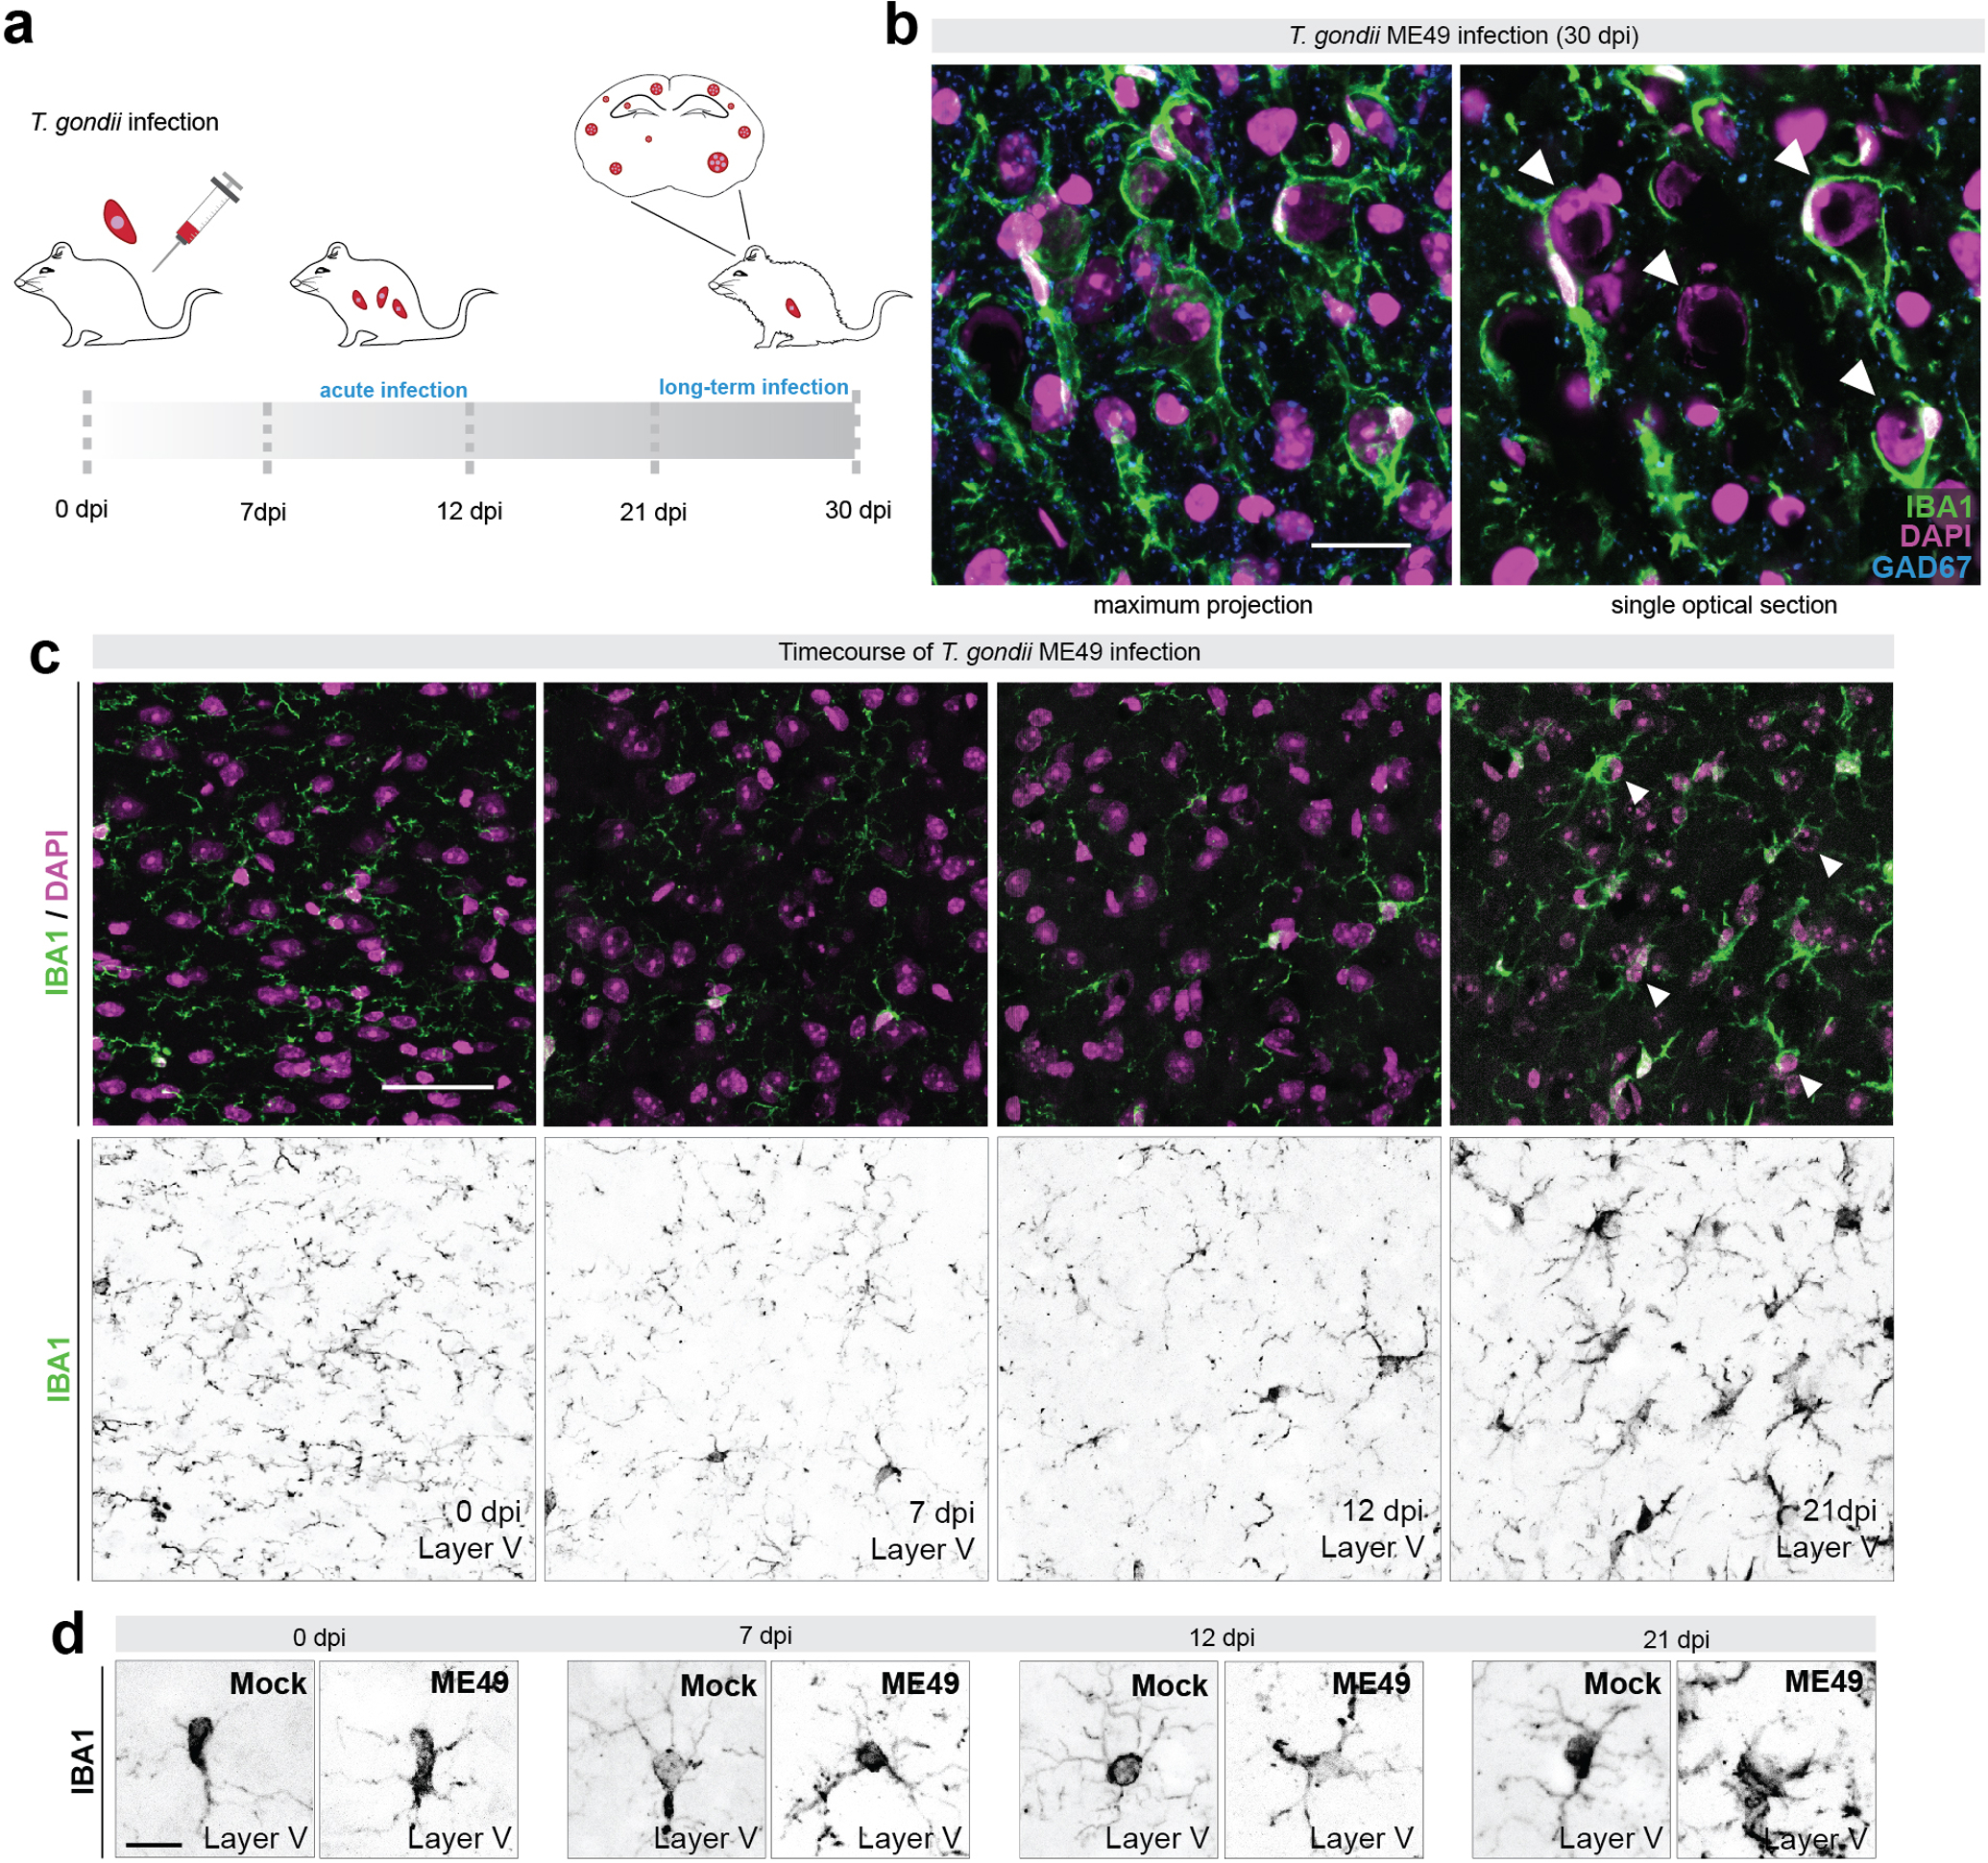
We previously discovered that long-term infection with type II ME49 Toxoplasma gondii (≥ 30 days post infection; Figure 1A) results in the development of seizures and the loss of perisomatic inhibitory synapses in several regions of the mouse telencephalon, including in stratum pyramidalis of the hippocampus and layer V of the cerebral cortex (Carrillo et al., 2020, Brooks et al., 2015). The loss of perisomatic synapses was widespread and did not appear to occur only in brain regions directly adjacent to RFP-labeled parasite cysts (which sparsely populate these brain regions: Carrillo et al. 2020; Brooks et al. 2015). However, the loss of these GABAergic synapses did co-occur with the ensheathment of neuronal cell bodies by IBA1+ phagocytic cells (which likely includes both resident microglia and macrophages-derived from peripheral monocytes that infiltrate the brain during infection) (Carrillo et al., 2020). The ensheathment of neuronal somata by IBA1+ cells in the telencephalon of infected mice is dramatic and noteworthy for at least 3 reasons: 1) neuronal ensheathment and perisomatic synapse loss was widespread throughout the telencephalon at 4 weeks post-infection, temporally coinciding with Toxoplasma cyst formation within parasite-infected brains (Carrillo et al., 2020); 2) some neurons appeared to be almost entirely ensheathed by IBA1+ cells (Figure 1B; arrows); and 3) not all neurons appeared to be ensheathed (Figure 1B). This led to a number of questions: When do phagocytic cells ensheath neurons following infection? What types of neurons are ensheathed? And what mechanisms drive neuronal ensheathment and perisomatic synapse loss? Here, we have addressed these important questions.
Figure 1.
Inhibitory synapse loss and microglial targeting of neuronal somata begins weeks after infection
(a) Schematic representation of fluorescently labeled Toxoplasma gondii (ME49) infection following intraperitoneal injection in adult C57BL/6J mice. An acute infection occurs in the first days post infection (dpi) and parasite cysts begin to form in the brain with long term infection. Fluorescently labeled cysts and tachyzoites were used to validate brain infection (Carrillo et al. 2020).
(b) Immunostaining (IHC) of IBA1+ phagocytes and GAD67+ inhibitory synapses in layer V of neocortex of ME49-infected (30 dpi) mice. Single optical section is shown to highlight cells ensheathed by IBA1+ cells (arrows).
(c) IHC for IBA1 and DAPI in layer V of cortex at 0 dpi, 7 dpi, 12 dpi, and 21 dpi infection. Arrows depict ensheathed cells at 21 dpi.
(d) IHC of IBA1+ phagocytes in layer V of neocortex of Mock- and ME49-infected mice. High magnification images show depicting phagocyte morphological changes.
Scale bars in B: 20 μm, in C: 40 μm, and in D: 10 μm
First, we addressed the timing of neuronal ensheathment by phagocytic cells by assessing the distribution of IBA1+ cells in the neocortex each week after infection. We show that phagocytes begin to target neurons between 12 and 21 days post infection (dpi), with significant ensheathment of neuronal somata observed at 21 dpi (Figure 1C). Importantly, RFP-labeled tachyzoites and cysts were present in brains of ME49-infected mice beginning at 12 dpi, when IBA1+ phagocyte morphological changes were first detected (Figure 1D).
Although all cortical layers appeared impacted by T.gondii infection, we next sought to address whether there was any specificity in terms of which cell types were targeted and ensheathed by IBA1+ phagocytes following infection. We focused much of our attention on layer V of neocortex of infected mice, where neurons ensheathed by IBA1+ cells appeared pyramidal in morphology (Figure 1B). This observation suggested to us that excitatory neurons may be preferentially targeted by these phagocytes. To determine if this was indeed the case, brains from infected mice were immunostained for IBA1 and a number of cell-type specific markers allowing us to differentiate between types of excitatory and inhibitory neurons. In layer V of neocortex (where we focus all of these studies), we show that COUP TF1-interacting protein 2+ (CTIP2) expressing excitatory pyramidal neurons are extensively ensheathed by phagocytes following infection (Figure 2A–C; Arlotta et al., 2005, Lodato et al., 2011). We measured the extent of the somal surface of these neurons ensheathed by IBA1+ cells and found, on average, the surface of pyramidal neurons was over 40% covered by IBA1+ cells (Figure 2B, C). Next, we used immunostaining and genetic reporter lines to assess ensheathment of GABAergic interneurons. A subset of somatostatin+ (SST), calbindin+ (CALB), and parvalbumin+ (PV) GABAergic interneurons were contacted by phagocytes in Toxoplasma-infected cortex, although this is also the case in mock-infected brains. While all 3 types of interneurons exhibited higher percentage of ensheathment in infected brains than in mock-infected brains (Figure 2D–L), the level of ensheathment remained significantly lower (~15% ensheathment per cell) compared to pyramidal neurons (Figure 2M). Since other cortical layers are impacted by this parasite, we next sought to test whether excitatory neurons in other layers were also ensheathed by phagocytic cells. To test this, we assessed ensheathment of Cut Like Homeobox 1 (Cux1)-expressing excitatory neurons and Calretinin (Calr)-expressing inhibitory neurons in layer II/III. This analysis revealed that excitatory neurons in other cortical layers were indeed preferentially ensheathed by phagocytes (Supplemental figure 1). Taken together, these analyses revealed cell- (but not layer) specificity in which neurons were preferentially targeted and ensheathed by IBA1+ phagocytes following long-term infection with Toxoplasma gondii.
Figure 2.
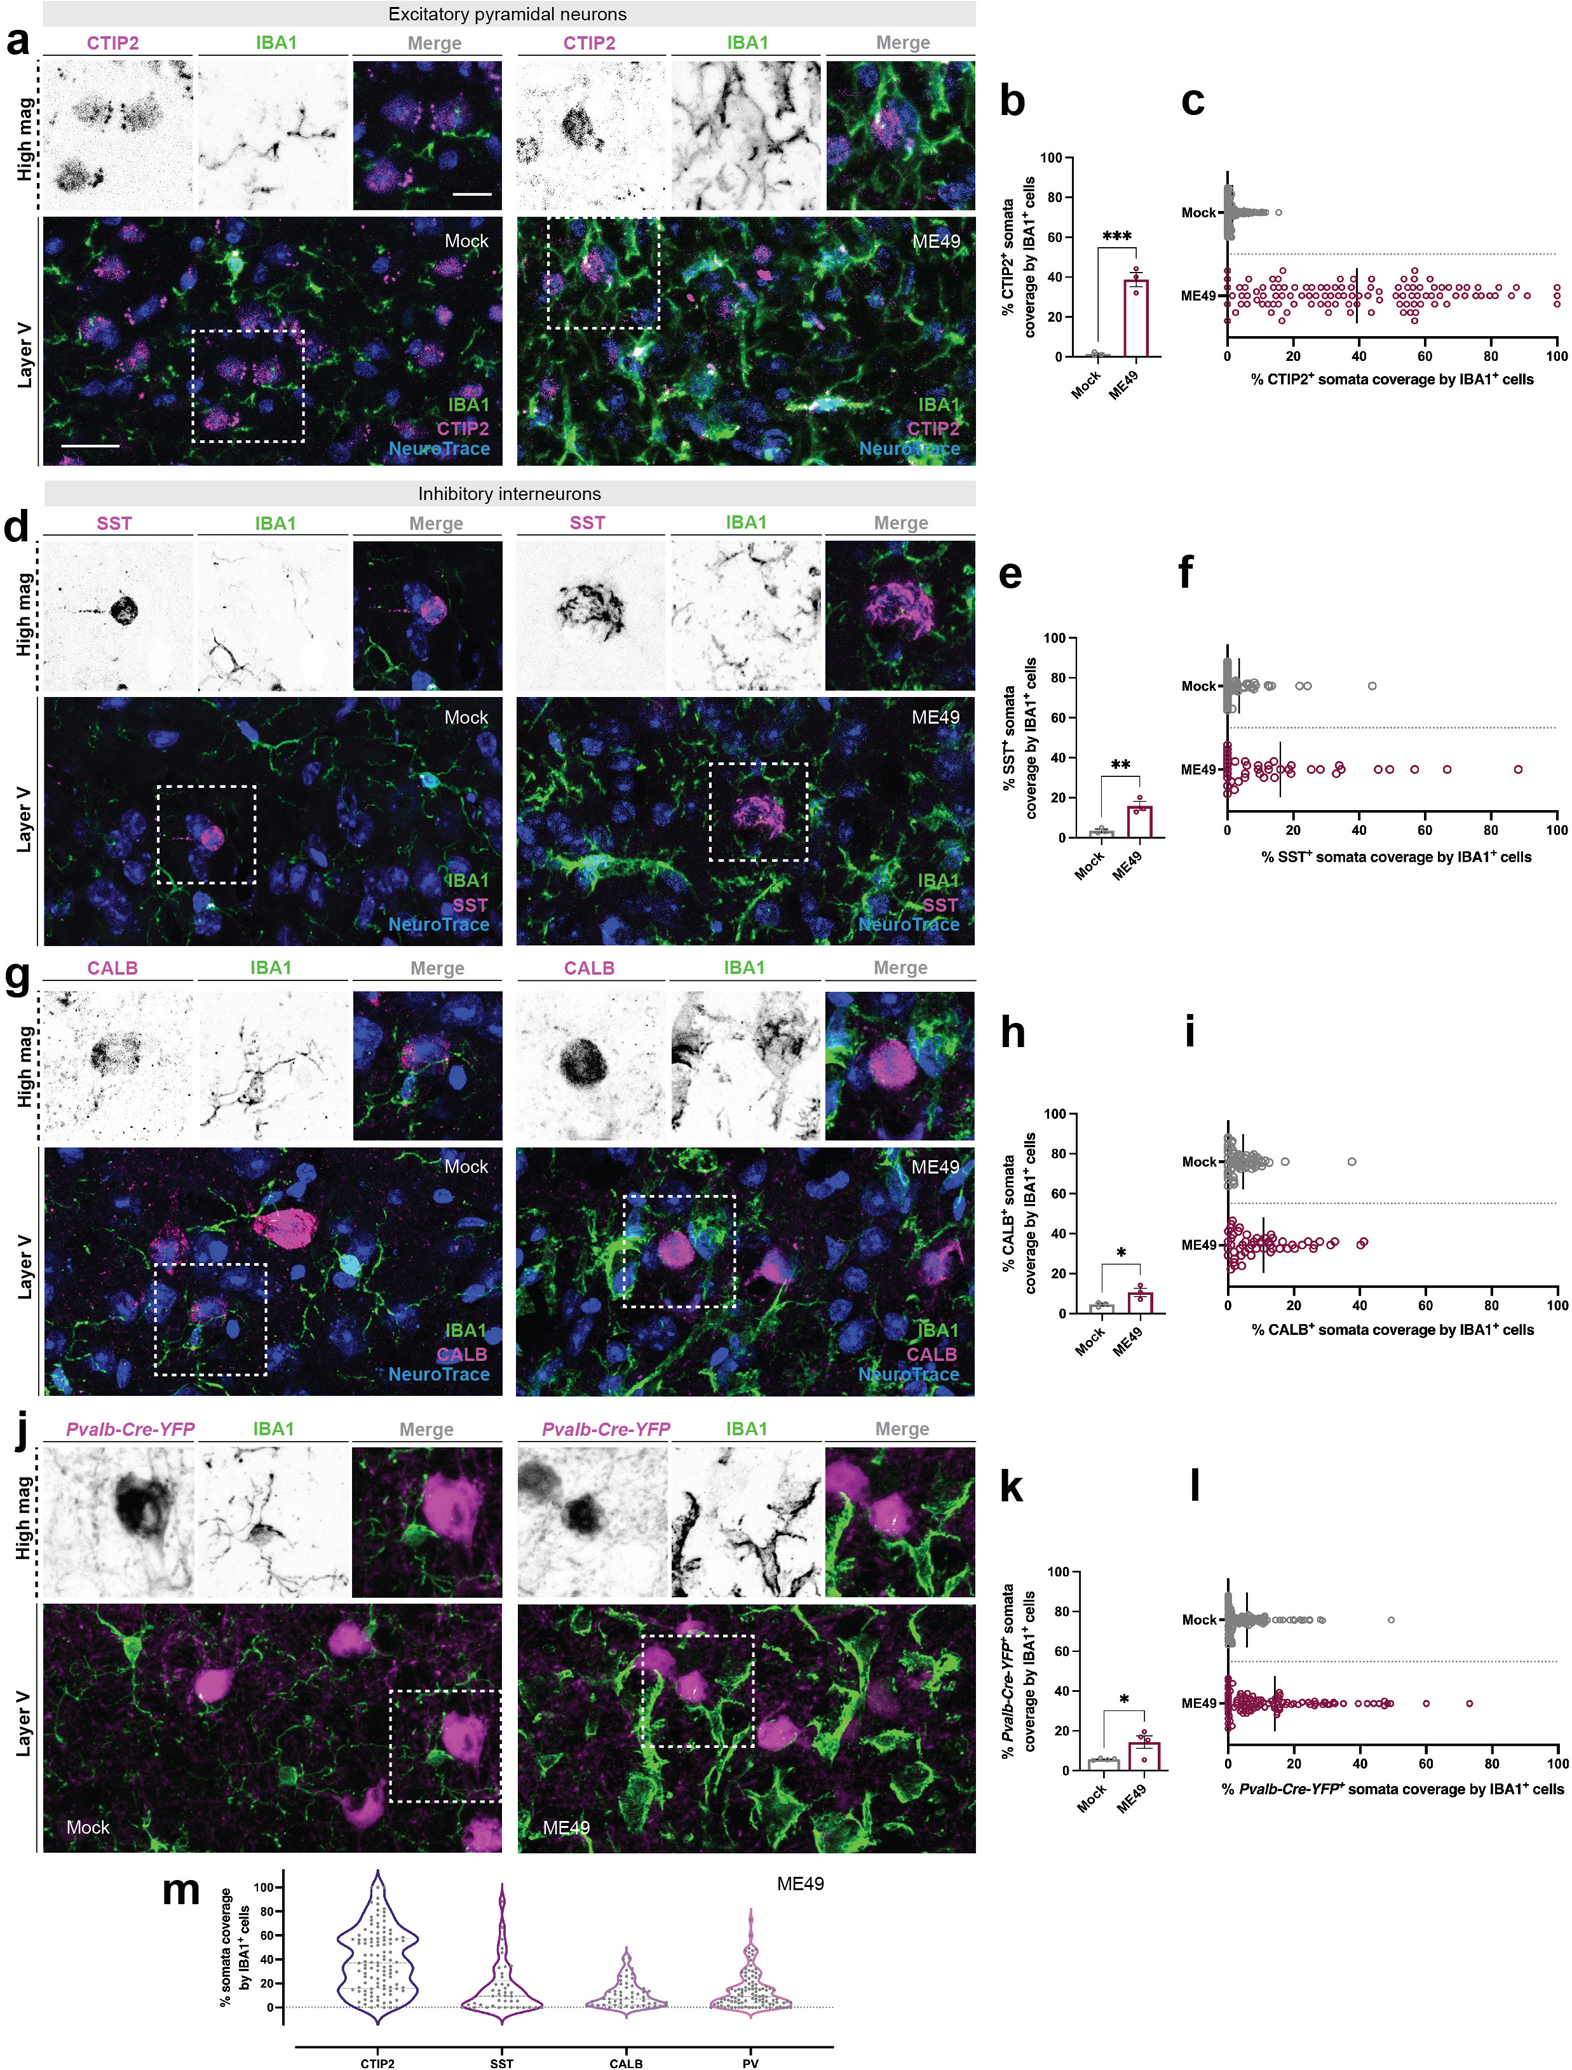
Excitatory pyramidal neurons are preferentially ensheathed by microglia
(a) Immunohistochemistry (IHC) for CTIP2 (which labels layer V neurons), NeuroTrace and IBA1 in layer V of neocortex at 30 days post infection (dpi) with Toxoplasma gondii (ME49) compared to mock-infection (Mock).
(b) Quantification of CTIP2+ NeuroTrace+ soma coverage by IBA1+ cells in mock- and ME49-infected neocortex. Each data point represents the average of one biological replicate and bars depict mean ± standard error of the mean (SEM). Asterisks (***) indicate P < 0.001 by Student’s two-tailed t-test (n=3 mice per condition). P value = 0.0003; t = 10.28; df = 4. Normality assessed by F-test (F value = 7.007, P value = 0.2398, not significant).
(c) Distribution plot of individual CTIP2+ NeuroTrace+ somata analyzed and pooled from biological replicates in (B). Bar represents mean percent somata coverage by all IBA1+ cells.
(d) IHC for SST, NeuroTrace, and IBA1 in layer V of neocortex (ME49) compared to mock-infection (Mock).
(e) Quantification of SST+ NeuroTrace+ soma coverage by IBA1+ cells in mock- and ME49-infected neocortex. Each data point represents the average of one biological replicate and bars depict mean ± SEM. Asterisks (**) indicate P < 0.01 by Student’s two-tailed t-test (n=3 mice per condition). P value = 0.0065; t = 5.202; df = 4. Normality assessed by F-test (F value = 41.22, P value = 0.0474, significant).
(f) Distribution plot of individual SST+ NeuroTrace+ somata analyzed and pooled from biological replicates in (E). Bar represents mean percent somata coverage by all IBA1+ cells.
(g) IHC for CALB, NeuroTrace, and IBA1 in layer V of neocortex (ME49) compared to mock-infection (Mock).
(h) Quantification of CALB+ NeuroTrace+ soma coverage by IBA1+ cells in mock- and ME49-infected neocortex. Each data point represents the average of one biological replicate and bars depict mean ± SEM. Asterisks (*) indicate P < 0.05 by Student’s two-tailed t-test (n=3 mice per condition). P value = 0.0479; t = 2.819; df = 4. Normality assessed by F-test (F value = 9.209, P value = 0.1959, not significant).
(i) Distribution plot of individual CALB+ NeuroTrace+ somata analyzed and pooled from biological replicates in (H). Bar represents mean percent somata coverage by all IBA1+ cells.
(j) IHC for IBA1 in Pvalb-Cre-YFP shows minimal ensheathment of PV+ inhibitory interneurons in layer V of neocortex at 30 dpi (ME49) compared to mock-infection (Mock).
(k) Quantification of Pvalb-Cre-YFP+ soma coverage by IBA1+ cells in mock- and ME49-infected neocortex. Each data point represents the average of one biological replicate and bars depict mean ± SEM. Asterisks (*) indicate P < 0.05 by Student’s two-tailed t-test (n=4 mice per condition). P value = 0.0324; t = 2.770; df = 6. Normality assessed by F-test (F value = 167.4, P value = 0.0016, significant).
(l) Distribution plot of individual Pvalb-Cre-YFP+ somata analyzed and pooled from biological replicates in (K). Bar represents mean percent somata coverage by all IBA1+ cells.
(m) Violin-plot showing the distribution of ensheathment by IBA1+ phagocytes (as a % of somal coverage) for 4 types of neocortical neurons (Data from c, f, i, l).
Scale bars in A, D, G, J: 20 μm and in A, D, G, J high magnification images: 10 μm
It is possible that certain cell types, such as GABAergic interneurons, are preferentially lost following infection, ensheathment, and synapse loss. This could lead to lower numbers of highly ensheathed GABAergic interneurons in our counts (and to alterations in GAD67 distribution (Brooks et al., 2015)). To test this possibility, we used riboprobes against Gad1 and Vglut1 to label inhibitory and excitatory neurons, respectively, by in situ hybridization (ISH). In line with our previous assessment of neuronal loss in the infected neocortex (Carrillo et al., 2020), we did not observe significant changes in the number of excitatory or inhibitory cells in layer V at 30 days post infection (Figure 3).
Figure 3.

No excitatory or inhibitory neuron loss occurs at time of perisomatic synapse loss
(a) In situ hybridization (ISH) for Vglut1 and Gad1 in layer V of mock- and Toxoplasma gondii (ME49)-infected neocortex reveals no significant decrease in the number of excitatory or inhibitory cells following infection.
(b) Quantification of Vglut1+ cell count in layer V of mock- and ME49-infected cortex. Each data point represents one biological replicate and bars depict mean ± standard error of the mean (SEM). No significant difference (ns) indicates P > 0.05 by Student’s one-tailed t-test (n=3 mice per condition). P-value = 0.1030; t = 1.508; df = 4. Normality assessed by F-test (F value = 1.518, P value = 0.7944, not significant).
(c) Quantification of Gad1+ cell count in layer V of mock- and ME49-infected cortex. Each data point represents one biological replicate and bars depict mean ± SEM. No significant difference (ns) indicates P > 0.05 by Student’s one-tailed t-test (n=3 mice per condition). P-value = 0.2249; t = 0.8367; df = 4. Normality assessed by F-test (F value = 6.778, P value = 0.2571, not significant).
Scale bar in A: 20 μm
Perisomatic inhibitory synapses are not lost from the somata of PV+ interneurons following infection
We interpret these results to suggest that pyramidal neurons most likely express or release a factor that attracts phagocytes to ensheath their somata. However, the somata of these neurons are studded with perisomatic synapses, so an alternative possibility is that phagocytes are instead attracted to these synapses following infection. In layer V, the majority of perisomatic synapses on excitatory pyramidal cells are formed by fast-spiking, PV-expressing interneurons. Importantly, however, PV+ cells also provide substantial perisomatic inhibition onto other PV+ cells (Figure 4A–B). Since PV+ interneurons are not dramatically ensheathed by IBA1+ cells following infection (Figure 2J–L), this suggests that perisomatic nerve terminals are not attracting IBA1+ cells to ensheath neuronal somata and phagocytose these nerve terminals following infection. To directly test the latter possibility, we took advantage of our genetic reporter line labeling PV cells to probe whether perisomatic synapse loss also occurred on these inhibitory PV+ interneurons. We observed no significant decrease in the number of GABAergic perisomatic synapses on PV+ interneurons (labeled by immunostaining for glutamic acid decarboxylase 67; GAD67) between mock- and ME49-infected brains (Figure 4C–E). Additionally, we quantified the number of PV+ interneurons in layer V and in the neighboring cortical layers (IV-VI) and found no change in PV+ cell numbers following infection (Figure 4F–G). Together, these results show that PV+ cells are not extensively ensheathed by IBA1+ phagocytes following infection, nor do they lose perisomatic inhibitory inputs form their somata. This suggests that post-synaptic signals arising from excitatory pyramidal cells are likely serving as cues for microglia to ensheath excitatory somata and remove inhibitory inputs.
Figure 4.

Inhibitory perisomatic synapses are not lost on PV+ interneurons
(a) Schematic illustrating PV inhibitory interneuron and excitatory pyramidal connectivity in cortical layer V.
(b) Immunohistochemistry (IHC) for GAD67 in Pvalb-Cre-YFP mice shows YFP+ inputs on both pyramidal neurons (based on morphology) and on PV interneurons. White arrowheads indicate inhibitory perisomatic synapses.
(c) IHC for GAD67 in mock- and Toxoplasma gondii (ME49)-infected (30 days post infection [dpi]) Pvalb-Cre-YFP mice.
(d) Quantification of GAD67+ synapses on YFP+ somata in mock- and ME49-infected Pvalb-Cre-YFP mice. Each data point represents one biological replicate and bars depict mean ± standard error of the mean (SEM). No significant difference (ns) indicates P > 0.05 by Student’s two-tailed t-test (n=4 mice per condition). P-value = 0.2112; t = 1.399; df = 6. Normality assessed by F-test (F value = 1.928, P value = 0.6034, not significant).
(e) Distribution plot of YFP+ somata analyzed and pooled from biological replicates in (D). Bar represents mean number of GAD67+ synapses per Pvalb-Cre-YFP+ somata in mock- or ME49-infected neocortex.
(f) Quantification of Pvalb-Cre-YFP+ cell count in layer V of mock- and ME49-infected cortex. Each data point represents one biological replicate and bars depict mean ± SEM. No significant difference (ns) indicates P > 0.05 by Student’s one-tailed t-test (n=3 mice per condition). P-value = 0.2874; t = 0.6100; df = 4. Normality assessed by F-test (F value = 2.583, P value = 0.5581, not significant).
(g) Quantification of Pvalb-Cre-YFP+ cell count in layer IV - VI of mock- and ME49-infected cortex. Each data point represents one biological replicate and bars depict mean ± SEM. No significant difference (ns) indicates P > 0.05 by Student’s one-tailed t-test (n=3 mice per condition). P-value = 0.4708; t = 0.07800; df = 4. Normality assessed by F-test (F value = 2.364, P value = 0.5945, not significant).
Scale bars in B and C: 10 μm
Differential expression of complement components following T. gondii infection
We next sought to identify what cues might be necessary for IBA1+ phagocyte ensheathment of excitatory pyramidal neurons and the targeted loss of perisomatic synapse on these neurons. Activation of the classical complement pathway has been shown to control synaptic pruning during developmental refinement, as well as in the neurodegenerating brain (Stevens et al., 2007, Cong et al., 2021, Alawieh et al., 2021, Werneburg et al., 2020, Hammond et al., 2020). Moreover, several studies report upregulation of complement components in the Toxoplasma-infected brain (Shinjyo et al., 2020, Huant et al., 2018, Xiao et al., 2016). We similarly observed significant increase of classical components C1qa and C3 in infected cortex by RT-qPCR (C1qa: mock = 1 ± 1.3 [standard deviation (SD)] fold-change; ME49 = 6.5 ± 4.2 [SD] fold change; C3: mock = 1 ± 0.95 [SD] fold change; ME49 = 267 ± 13.5 [SD] fold change; mock n = 3, ME49 n = 3 for both C1qa and C3). Based on this, we hypothesized that these complement pathway components might be involved. In the inflamed or injured brain, microglia provide a major source of C1qa mRNA, however it remains unknown which cells express C1qa and C3 in the Toxoplasma-infected brain. To determine the source of complement components in the T. gondii-infected brain, we generated riboprobes against C1qa and C3 and performed ISH. In the infected brain, C1qa mRNA expression patterns resembled phagocyte morphology. Immunolabeling for IBA1 following in situ hybridization confirmed the presence of C1qa mRNA within IBA1+ cells in both mock- and ME49-infected brains (Figure 5A). ISH against C3 mRNA similarly revealed expression by IBA1+ phagocytes in the infected brain. However, in contrast to C1qa mRNA, C3 mRNA expression was not detectable in the mock-infected brain (Figure 5B). ISH also demonstrated that the upregulation of both C3 and C1q mRNAs temporally matched the timing of cysts formation in the brain following infection and coincided with the activation of microglia in these regions (Supplemental Figure 2).
Figure 5.

Complement mRNA is differentially upregulated by immune and neuronal cells in the infected brain
(a) In situ hybridization (ISH) for C1qa and IHC for IBA1 in layer V of neocortex of mock- and Toxoplasma gondii (ME49)-infected mice.
(b) ISH for C3 and IHC for IBA1 in layer V of neocortex of mock- and ME49-infected mice.
(c) ISH for Syt1 and C1qa showed no neuronal expression of C1qa mRNA in both mock- and ME49-infected layer V.
(d) ISH for Syt1 and C3 in mock- and ME49-infected mice. Neuronal expression of C3 mRNA was detected in some neurons in ME49-infection.
(e) ISH for Npnt and C3 in mock- and ME49-infected mice. C3 mRNA was detected in some Npnt-expressing pyramidal neurons in layer V of neocortex.
(f) ISH for Gad1 and C3 show no expression of C3 mRNA by inhibitory neurons in ME49-infection.
Scale bars in A - F: 10 μm
Complement components are known to be expressed by other neural cells following infection, including both neurons and astrocytes. For this reason, we next sought to examine neuronal subtype expression for C1qa and C3 in mock- and ME49-infected brains. To accomplish this, we performed in situ hybridization for C1qa and C3 and genes expressed by all neurons (Synaptotagmin 1; Syt1), GABAergic neurons (Glutamic acid decarboxylase 1; Gad1) or layer V pyramidal neurons (Nephrenectin; Npnt) (Su et al., 2021). We failed to observe any C1qa expression by Syt1+ neurons (Figure 5C), however, we observed several instances of C3 mRNA expression by both Syt1+ and Npnt+ neurons in the ME49-infected cortex (Figure 5D, E). Importantly, we did not observe C3 expression by Gad1+ inhibitory cells (Figure 5F).
C3 is required for inhibitory perisomatic synapse loss in a non-classical pathway-dependent manner
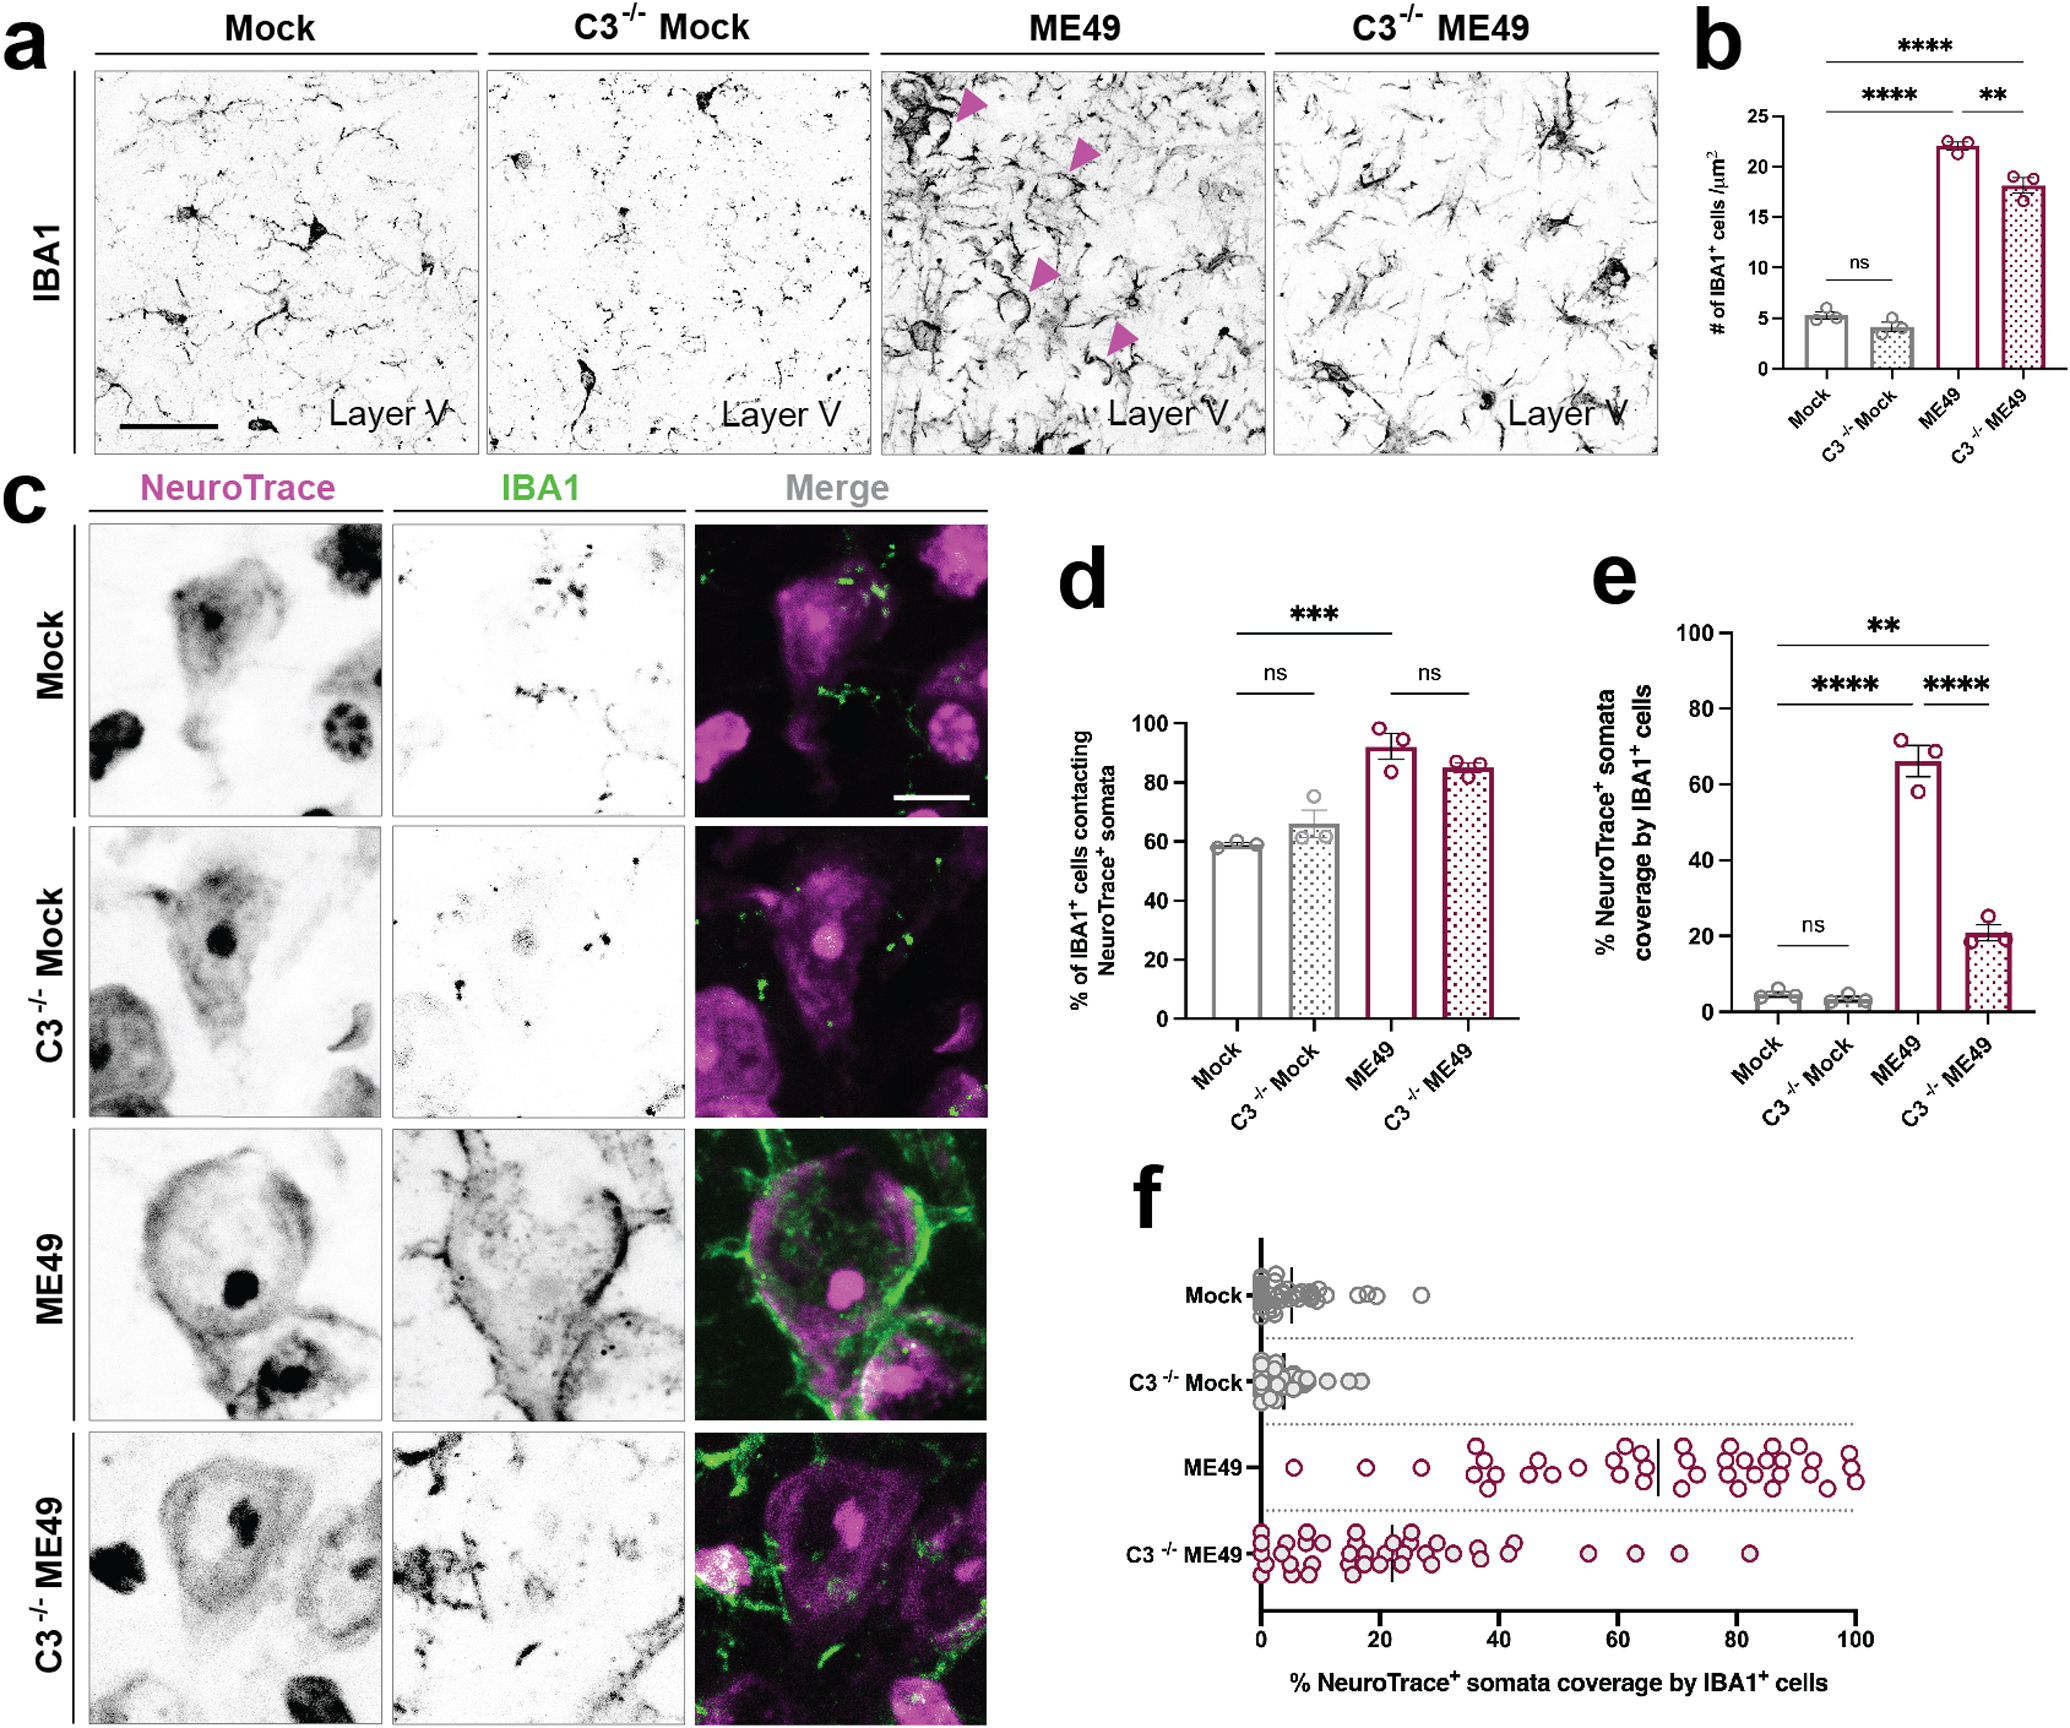
The select expression of C3 by some pyramidal neurons, but not interneurons, suggests that the complement pathway may contribute to neuronal ensheathment by IBA1+ phagocytes and perisomatic synapse loss. To test this, we assessed infection-induced IBA1+ ensheathment of neurons and perisomatic synapse loss in mice lacking C3. Following most types of infection or injury, resident microglia quickly expand in the brain, and monocytes from the periphery are recruited into the brain to aid with pathogen and debris clearance (D’Mello et al., 2009). We observe this same process following T. gondii infection in WT mice (Figure 6A, B). Interestingly, in mice that lack C3 globally, we also see an increase in the number of phagocytes following infection, however, the number is slightly but significantly less than in WT mice (Figure 6A,B). We failed to observe significant differences in the percentage of IBA1+ phagocytes that contact neurons in WT and C3−/− infected brains. However, we observed a significant decrease in neuronal ensheathment by IBA1+ cells (Figure 6C–F). In fact, loss of C3 led to ensheathment levels that quantitatively and qualitatively resembled what levels we observed on inhibitory interneurons in WT infected mice (compares Figure 2 and 6).
Figure 6.
Reduced neuronal ensheathment by IBA1+ phagocytes in the absence of complement C3
(a) Immunohistochemistry (IHC) for IBA1 in layer V of neocortex of mock-infected and Toxoplasma gondii (ME49) infected C3−/− and littermate control mice.
(b) Quantification of the number of IBA1+ cells in layer V of neocortex in C3+/+ mock-, C3−/− mock, C3+/+ ME49-, and C3−/− ME49-infected brains. Asterisks (**) indicate P < 0.01, (****) indicate P < 0.0001 by one-way ANOVA with Sidak’s multiple comparison correction (n=3 mice per condition). C3+/+ mock- vs. C3−/− mock (P value = 0.5168; df = 8); C3+/+ mock- vs. C3+/+ ME49 (P value = <0.0001; df = 8); C3+/+ mock- vs. C3−/− ME49 (P value = <0.0001; df = 8). Normality assessed by F-test (F value = 295.2, P value = 0.0001, significant).
(c) IHC for IBA1 and NeuroTrace in layer V of neocortex of C3+/+ mock-, C3−/− mock, C3+/+ ME49- and C3−/− ME49-infected mice.
(d) Quantification of the percentage of IBA1+ cells contacting NeuroTrace+ somata in cortical layer V in in C3+/+ mock-, C3−/− mock, C3+/+ ME49-. and C3−/− ME49-infected brains. Each data point represents one biological replicate and bars depict mean ± standard error of the mean (SEM). Asterisks (***) indicate P < 0.001 and (ns) indicates P > 0.05 by one-way ANOVA with Sidak’s multiple comparison correction (n=3 mice per condition). C3+/+ mock- vs. C3−/− mock (P value = 0.4712; df = 8); C3+/+ mock- vs. C3+/+ ME49 (P value = 0.0005; df = 8); C3+/+ mock- vs. C3−/− ME49 (P value = 0.0023; df = 8). Normality assessed by F-test (F value = 22.41, P value = 0.0003, significant).
(e) Quantification of the percentage of NeuroTrace+ soma coverage by IBA1+ cells in cortical layer V in C3+/+ mock-, C3−/− mock, C3+/+ ME49-. and C3−/− ME49-infected brains. Each data point represents one biological replicate and bars depict mean ± SEM. Asterisks (**) indicate P < 0.01, (****) indicate P < 0.0001 by one-way ANOVA with Sidak’s multiple comparison correction (n=3 mice per condition). C3+/+ mock- vs. C3−/− mock (P value = 0.9940; df = 8); C3+/+ mock- vs. C3+/+ ME49 (P value = <0.0001; df = 8); C3+/+ mock- vs. C3−/− ME49 (P value < 0.0001; df = 8). Normality assessed by F-test (F value = 153.9, P value < 0.0001, significant).
(f) Distribution plot of individual NeuroTrace+ somata analyzed and pooled from biological replicates in (D). Bar represents mean percent somata coverage by IBA1+ cells.
Scale bars in A: 40 μm and in C: 10 μm
Next, to determine if the reduced ensheathment of neurons in the absence of C3 resulted in less phagocytosis and loss of synapses following infection, we assessed the distribution of CD68 (a marker of phagosomes) and of inhibitory perisomatic synapses (Carrillo et al., 2020). In C3 −/− infected mutants, we saw a decrease in the distribution of CD68 immunoreactivity within layer V (Figure 7A–B). Importantly, we found that not all phagocytes showed a loss or reduction in CD68 expression. Areas of the cortex where phagocytes accumulated (perhaps denoting regions of monocyte infiltration or macrophage response to tachyzoites within the brain parenchyma), for example, still expressed high levels of CD68, suggesting that the increase in phagocytic activity in ensheathing phagocytes (but not all phagocytes) was dependent on C3 activation (Figure 7C). We next assessed the number of GABAergic inhibitory synapses and saw no significant loss of perisomatic synapses in the neocortex of infected C3 −/− mutants (Figure 7D–F). Since the number of perisomatic synapses in C3 −/− mock-infected cortex was unchanged from WT mock-infected cortex, we conclude that these findings demonstrate C3 is required for the phagocytosis of inhibitory perisomatic synapses in T. gondii infection.
Figure 7.

C3 is required for phagocytosis of inhibitory perisomatic synapses
(a) Immunohistochemistry (IHC) for IBA1 and CD68 show decreased expression by IBA1+ cells in layer V of neocortex in C3−/− mice following Toxoplasma gondii (ME49) infection compared to C3+/+ ME49-infected mice. Magenta arrowheads point to CD68 expression with IBA1+ cells. Green arrowheads point to IBA1+ cells.
(b) Quantification of CD68 immunoreactivity percentage area coverage in cortical layer V in C3+/+ mock-, C3−/− mock, C3+/+ ME49-. and C3−/− ME49-infected brains. Each data point represents one biological replicate and bars depict mean ± standard error of the mean (SEM). Asterisks (**) indicate P < 0.01, (***) indicate P < 0.001, and (ns) P > 0.05 by one-way ANOVA with Sidak’s multiple comparison correction (n=3 mice per condition). C3+/+ mock- vs. C3−/− mock (P value = 0.5269; df = 8); C3+/+ mock- vs. C3+/+ ME49 (P value = 0.0026; df = 8); C3+/+ mock- vs. C3−/− ME49 (P value = 0.6698; df = 8). Normality assessed by F-test (F value = 20.92, P value = 0.0004, significant).
(c) Distribution plot of individual IBA1+ cells analyzed and pooled from images in (B). Bar represents mean number of CD68 signal intensity within IBA1+ cells.
(d) IHC for GAD67 and NeuroTrace in layer V of neocortex of C3+/+ mock-, C3−/− mock, C3+/+ ME49-. and C3−/− ME49-infected mice.
(e) Quantification of GAD67+ synapses on NeuroTrace+ somata in cortical layer V in C3+/+ mock-, C3−/− mock, C3+/+ ME49-. and C3−/− ME49-infected brains. Each data point represents one biological replicate and bars depict mean ± SEM. Asterisks (*) indicate P < 0.05, (**) indicate P < 0.01, and (ns) P > 0.05 by one-way ANOVA with Sidak’s multiple comparison correction (n=3 mice per condition). C3+/+ mock- vs. C3−/− mock (P value = 0.9795; df = 8); C3+/+ mock- vs. C3+/+ ME49 (P value = 0.0037; df = 8); C3+/+ mock- vs. C3−/− ME49 (P value = 0.5051; df = 8). Normality assessed by F-test (F value = 11.17, P value = 0.0031, significant).
(f) Distribution plot of individual NeuroTrace+ cells analyzed and pooled from images in (E). Bar represents mean number of GAD67+ synapses on NeuroTrace+ somata.
Scale bars in A: 40 μm and in D: 10 μm
After establishing that T. gondii infection-induced synapse loss is C3-dependent, we sought to determine if this was mediated through activation of the classical pathway. A number of studies have demonstrated that synapse loss in the diseased or inflamed brain involve the classical complement pathway (Hong et al., 2016, Wang et al., 2020, Datta et al., 2020, Carvalho et al., 2019). To test this, we used targeted mouse mutants that lack C1qa, as enzymatic cleavage of this protein activates the classical pathway. We found that removal of C1qa did not significantly reduce ensheathment (Figure 8A–C) or prevent T. gondii-induced synapse loss (Figure 8D–F). Thus, the classical complement pathway is not involved in the loss of synapses in the Toxoplasma-infected brain, similar to what is seen in mouse models of neurodegeneration (Werneburg et al., 2020).
Figure 8.

Inhibitory perisomatic synapse loss following T. gondii infection is not mediated by the classical pathway of complement activation
(a) Immunohistochemistry (IHC) for IBA1 shows no reduction in microglial ensheathment of NeuroTrace+ neurons in C1qa−/− Toxoplasma gondii (ME49)-infected cortex.
(b) Quantification of percentage of NeuroTrace+ soma coverage by IBA1+ cells in cortical layer V in C1qa+/+ mock-, C1qa−/− mock, C1qa+/+ ME49-. and C1qa−/− ME49-infected brains. Each data point represents one biological replicate and bars depict mean ± standard error of the mean (SEM). Asterisks (**) indicate P < 0.01, (***) indicate P < 0.001, and (ns) P > 0.05 by one-way ANOVA with Sidak’s multiple comparison correction (n=3 mice per condition). C1qa+/+ mock- vs. C1qa−/− mock (P value = 0.9929; df = 8); C1qa+/+ mock- vs. C1qa+/+ ME49 (P value = 0.0001; df = 8); C1qa+/+ mock- vs. C1qa−/− ME49 (P value = 0.0020; df = 8). Normality assessed by F-test (F value = 32.44, P value < 0.0001, significant).
(c) Distribution plot of individual NeuroTrace+ somata analyzed and pooled from biological replicates in (B). Bar represents mean percent somata coverage by IBA1+ cells.
(d) IHC for GAD67 and NeuroTrace shows no reduction in inhibitory perisomatic synapse loss in C1qa−/− ME49 infection compared to C1qa+/+ ME49-infection.
(e) Quantification of GAD67+ synapses on NeuroTrace+ somata in cortical layer V in C1qa+/+ mock-, C1qa−/− mock, C1qa+/+ ME49-. and C1qa−/− ME49-infected brains. Each data point represents one biological replicate and bars depict mean ± SEM. Asterisks (**) indicate P < 0.01 and (ns) P > 0.05 by one-way ANOVA with Sidak’s multiple comparison correction (n=3 mice per condition). C1qa+/+ mock- vs. C1qa−/− mock (P value = 0.8738; df = 8); C1qa+/+ mock- vs. C1qa+/+ ME49 (P value = 0.0021; df = 8); C1qa+/+ mock- vs. C1qa−/− ME49 (P value = 0.9833; df = 8). Normality assessed by F-test (F value = 19.51, P value = 0.0005, significant).
(f) Distribution plot of individual NeuroTrace+ cells analyzed and pooled from images in (E). Bar represents mean number of GAD67+ synapses on NeuroTrace+ somata.
Scale bars in A and D: 10 μm
DISCUSSION
CNS infection with Toxoplasma gondii can lead to behavioral alterations, seizures, and increased risk for the development of several neuropsychiatric disorders, some, or all, of which may arise from dysfunction in GABAergic neurotransmission and circuitry. Data from our previous studies demonstrate that infection by type II ME49 T. gondii leads to the loss of GABAergic perisomatic synapses and the acquisition of spontaneous seizures (Brooks et al., 2015, Carrillo et al., 2020). Dysfunction or perturbation of these inhibitory perisomatic synapses have been linked to both seizures and neuropsychiatric disorders, such as schizophrenia (Belforte et al., 2010, Gonzalez-Burgos et al., 2011, Gonzalez-Burgos et al., 2010, Gonzalez-Burgos and Lewis, 2012, Hamm et al., 2017, Lewis et a., 2011, Mukherjee et al., 2019, Schwaller et al., 2004, Wohr et al., 2015). In the case of T. gondii infection, activated microglia and/or peripheral monocytes that infiltrate the brain following infection, ensheath neuronal somata and phagocytose a significant number of the GABAergic perisomatic synapses on these cells (Carrillo et al., 2020). Here, we discovered that the loss of GABAergic perisomatic synapses in the T. gondii-infected cerebral cortex occurs in a cell-type specific manner in that phagocytic cells preferentially ensheath excitatory pyramidal cells, leading to the loss of inhibitory perisomatic synapses on this cell type, but not on others. We further demonstrate that this process is complement-dependent but is not mediated by the classical pathway. Together, these findings highlight a new role for complement in orchestrating phagocyte cell-type specific remodeling in the T. gondii-infected brain.
Cell-type specific neuron-glia interactions in parasite-infected brain
Microglia are key regulators of neural circuitry with established roles in immunosurveillance and circuit remodeling in the central nervous system. In the developing brain, microglia eliminate excess neural precursor cells and synapses to maintain homeostasis and refine circuitry (Cunningham et al., 2013, Paolicelli et al., 2011, Li et al., 2012, Schafer et al., 2012). Upon injury or disease to the brain, microglia can temporarily or permanently remodel circuitry by employing both pathogenic and protective mechanisms (Chen et al., 2014, Chen et al., 2012, Kerschensteiner et al., 2003, Hellwig et al., 2013). At the initial stages of the infection, T. gondii infection follows a similar pattern of widespread microglial activation and increase in phagocytic cells (here, likely attributed to both microglial proliferation and monocyte recruitment from the periphery), as is commonly seen in other, but not all, types of neuroinflammation or neurodegeneration (Borges et al., 2003, Feng et al., 2019, Hagan et al., 2020). Moreover, T. gondii infection induces microglia to extensively ensheath the somata of neurons, a process first described in the peripheral central nervous system following injury to the facial nerve (Blinzinger and Kreutzberg, 1968, Shibasaki et al., 2007, Chen et al., 2014, Wan et al., 2020). Interestingly, ensheathment of neurons in models of induced epilepsy has been described as a transient process, whereby microglia temporarily displace perisomatic synapses as a response to aberrant GABAergic signaling from presynaptic nerve terminals, thus serving as a protective mechanism to the neuron (Wan et al., 2020). Furthermore, displacement of GABAergic perisomatic synapses results in an increase in synchronized neuronal activity which triggers neuronal expression of anti-apoptotic and neurotrophic molecules as neuroprotection (Chen et al., 2014). In T. gondii infection, however, we find that GABAergic perisomatic synapse loss is not a result of temporary displacement, but rather is a process where presynaptic nerve terminals are removed by phagocytosis. If widespread perisomatic synapse loss continues throughout the course of the infection, it may contribute to neuronal death seen in later stages of chronic T. gondii infection (Cabral et al., 2016, Mendez et al., 2021).
In the current study, we discovered T. gondii infection triggers microglia to specifically ensheath excitatory pyramidal neurons in neocortex and that GABAergic perisomatic synapse loss occurs on these excitatory cells. These findings are in line with other models of epilepsy that show preferential ensheathment of excitatory cortical neurons and subsequent displacement of GABAergic perisomatic synapses from these cells (Wan et al., 2020). Microglia, however, are not the only ones that preferentially interact with excitatory neurons. Recent studies assessing neurons that are injected with T. gondii proteins (but do not contain the parasite itself) shows the parasite, like microglia, also has preference for targeting excitatory neurons (Koshy et al., 2012, Mendez et al., 2021). Thus, excitatory cells could be secreting signaling molecules such as neurotrophins and neuropeptides that attract both microglia and parasites to these cells. Alternatively, phagocytes may be attracted to these cells as a response to parasite-modulation of host cell machinery or neuronal stress within T. gondii-protein-injected neurons. A third possibility is that instead of being attracted to excitatory cells, microglia are attracted to the inhibitory perisomatic synapses. Microglia express a variety of receptors for neurotransmitters, including GABA receptors, that allow them to sense neuronal activity (Pocock and Kettenmann, 2007, Krabbe et al., 2012, Seifert et al., 2011, Kuhn et al., 2004). In T. gondii infection, microglia upregulate the expression of GABA-A receptors, which aids in their migration, therefore, it is possible that perisomatic synapses could be releasing an increase in GABA that attracts phagocytes to neuronal somata (Bhandage et al., 2019, Bhandage et al., 2020). However, this is unlikely to be the case since perisomatic inhibitory synapses remain on PV inhibitory interneurons following T. gondii infection.
Differential expression of complement as a cue for microglia ensheathment of excitatory neurons leading to perisomatic synapse phagocytosis
An important discovery in these studies is that along with microglia and monocyte expression of complement components, T. gondii infection also induces the differential expression of C3 by excitatory pyramidal cells. Neuronal expression of complement is not an entirely novel concept. In animal models of Alzheimer’s, where synapse loss is an early manifestation of the neurodegenerative process via the complement pathway, neuronal expression of complement C1q has been reported and linked to synapse elimination (Selkoe 2002, Bialas and Stevens, 2013, Hong et al., 2016). Similarly, in chronic cases of multiple sclerosis, microglial clusters (although less extensive than we see in T. gondii infection), are associated with neuronal production of C3. In these studies, expression of C3 and microglial clusters only occurred after prolonged disease, and was not observed during acute disease (Michailidoi et al., 2016). In our studies, it is important to note that several instances of neuronal C3 production (by excitatory pyramidal cells only) were observed at 30 days after infection, a timepoint of long-term infection where significant perisomatic inhibitory synapse loss already occurs. This raises important questions as to the timing and duration of complement expression by neurons in the T. gondii infected brain. In vivo assessment of neuronal C3 expression throughout the course of the infection, and targeted downregulation of C3 in neurons, will be important in establishing neuronal C3 as a driver in T. gondii-induced synapse loss. Since phagocytes were also observed to upregulate expression of C3 in T. gondii infection, the role of phagocyte C3 in inducing synapse loss should also be carefully examined. This raises the possibility that excitatory pyramidal neuron expression of C3 may also be accompanied by inhibitory neuron upregulation of complement regulators as a protective mechanism against microglia secreted C3 (Zhu et al., 2020, Gonzalez, et al., 2021). Of note, T. gondii tachyzoites are able to resist complement-mediated killing by recruiting host-derived complement regulatory proteins (Factor H regulator of the alternative pathway and C4b-binding protein of the classical and lectin pathways) to the parasite’s surface and inactivate surface-bound C3 (Fuhrman and Joiner, 1989, Sikorski et al., 2020). It is possible that intracellular T. gondii cysts may employ a similar strategy to avoid complement-mediated phagocytosis or lysis of their neuronal host. Overall, our findings suggest that neurons might be playing a more significant role in initiating circuit remodeling in degeneration or prolonged inflammation and should be examined in other models of neurodegeneration and disease.
Our data suggest that C3 is required for neuronal ensheathment and phagocytosis of perisomatic inhibitory synapses, but is not required for the initial targeting of excitatory pyramidal neurons. This was surprising to us based on the role of C3 in chemoattraction (Chen et al., 2021). This begs the question, what are the chemoattractants that initiate selective microglial targeting of excitatory cells in the T. gondii-infected brain? Under pathological conditions, activated microglia will migrate towards the site of injury by detecting different classes of membrane-bound and secreted chemoattractants (Fan et al., 2017, Hu et al., 2014, Mazaheri et al., 2017). One example of these is the inhibitory neurotransmitter, GABA. In the developing cortex, secreted GABA will attract GABAB receptive microglia, and subsequently induce a transcriptional synapse remodeling program within these immune cells to trigger synapse phagocytosis (Favuzzi et al., 2021). In T. gondii infection, GABA-induced chemotaxis of microglia may account for the selective phagocytosis of inhibitory perisomatic synapses, but seems unlikely to explain selectivity for excitatory pyramidal neurons. The identification of such cell-type specific chemoattractants in T. gondii infection will require further investigation.
Supplementary Material
Acknowledgements
This work was supported by National Institute of Health grants NS105141, AI124677, and F99NS120596. We thank the LaMantia and Farris labs for generously supplying some antibodies used in these experiments. A pre-print version of this manuscript was posted to bioRxiv on 08/01/2022 (https://www.biorxiv.org/content/10.1101/2022.07.29.502023v1).
Funding information:
National Institute of Allergy and Infectious Diseases, Grant/Award Number: AI124677; National Institute of Neurological Disorders and Stroke, Grant/Award Number: NS105141 and F99NS120596.
Abbreviations:
- CALB
calbindin
- CNS
central nervous system
- CTIP2
COUP TF1-interacting protein 2
- DAPI
4’,6-diamidino-2-phenylindole
- GABA
gamma aminobutyric acid
- Gad1
glutamic acid decarboxylase 1
- GAD67
glutamic acid decarboxylase 67
- GFP
green fluorescent protein
- IBA1
Ionized calcium binding adaptor molecule 1
- IHC
immunohistochemistry
- ISH
in situ hybridization
- NPNT
nephronectin
- PV
parvalbumin
- RRID
research resource identifier
- SST
somatostatin
- Syt1
synaptotagmin 1
- TE
Toxoplasmic encephalitis
- T.gondii
Toxoplasma gondii
- YFP
yellow fluorescent protein
- Vglut1
vesicular glutamate transporter 1
Footnotes
Human subjects:
Involves human subjects:
If yes: Informed consent & ethics approval achieved:
if yes, please ensure that the info “Informed consent was achieved for all subjects, and the experiments were approved by the local ethics committee.” is included in the Methods.
Conflict of interest disclosure: The authors declare no financial and non-financial competing interests.
Data availability statement:
The data that support the findings of this study are available from the corresponding author upon reasonable request.
References
- Alawieh A, Chalhoub RM, Mallah K, Langley EF, York M, Broome H, Couch C, Adkins DA, & Tomlinson S (2021). Complement drives synaptic degeneration and progressive cognitive decline in the chronic phase after traumatic brain injury. Journal of Neuroscience, 41(8), 1830–1843. 10.1523/JNEUROSCI.1734-20.2020 [DOI] [PMC free article] [PubMed] [Google Scholar]
- Alsaady I, Tedford E, Alsaad M, Bristow G, Kohli S, Murray M, Reeves M, Vijayabaskar MS, Clapcote SJ, Wastling J, et al. (2019). Downregulation of the Central Noradrenergic System by Toxoplasma gondii Infection. Infect Immun 87. [DOI] [PMC free article] [PubMed] [Google Scholar]
- Arlotta P, Molyneaux BJ, Chen J, Inoue J, Kominami R, & MacKlis JD (2005). Neuronal subtype-specific genes that control corticospinal motor neuron development in vivo. Neuron, 45(2), 207–221. 10.1016/j.neuron.2004.12.036 [DOI] [PubMed] [Google Scholar]
- Ayata P, Badimon A, Strasburger HJ, Duff MK, Montgomery SE, Loh YHE, Ebert A, Pimenova AA, Ramirez BR, Chan AT, Sullivan JM, Purushothaman I, Scarpa JR, Goate AM, Busslinger M, Shen L, Losic B, & Schaefer A (2018). Epigenetic regulation of brain region-specific microglia clearance activity. Nature Neuroscience, 21(8), 1049–1060. 10.1038/s41593-018-0192-3 [DOI] [PMC free article] [PubMed] [Google Scholar]
- Belforte JE, Zsiros V, Sklar ER, Jiang Z, Yu G, Li Y, Quinlan EM, and Nakazawa K (2010). Postnatal NMDA receptor ablation in corticolimbic interneurons confers schizophrenia-like phenotypes. Nat Neurosci 13, 76–83. [DOI] [PMC free article] [PubMed] [Google Scholar]
- Bennett FC, Bennett ML, Yaqoob F, Mulinyawe SB, Grant GA, Hayden Gephart M, Plowey ED, & Barres BA (2018). A Combination of Ontogeny and CNS Environment Establishes Microglial Identity. Neuron, 98(6), 1170–1183.e8. 10.1016/j.neuron.2018.05.014 [DOI] [PMC free article] [PubMed] [Google Scholar]
- Berenreiterová M, Flegr J, Kuběna AA, & Němec P (2011). The distribution of Toxoplasma gondii cysts in the brain of a mouse with latent toxoplasmosis: implications for the behavioral manipulation hypothesis. PloS one, 6(12), e28925. 10.1371/journal.pone.0028925 [DOI] [PMC free article] [PubMed] [Google Scholar]
- Berdoy M, Webster JP, and Macdonald DW (2000). Fatal attraction in rats infected with Toxoplasma gondii. Proc Biol Sci 267, 1591–1594. [DOI] [PMC free article] [PubMed] [Google Scholar]
- Beste C, Getzmann S, Gajewski PD, Golka K, and Falkenstein M (2014). Latent Toxoplasma gondii infection leads to deficits in goal-directed behavior in healthy elderly. Neurobiol Aging 35, 1037–1044. [DOI] [PubMed] [Google Scholar]
- Bhandage AK, Olivera GC, Kanatani S, Thompson E, Loré K, Varas-Godoy M, & Barragan A (2020). A motogenic gabaergic system of mononuclear phagocytes facilitates dissemination of coccidian parasites. ELife, 9, 1–26. 10.7554/eLife.60528 [DOI] [PMC free article] [PubMed] [Google Scholar]
- Blanchard N, Dunay IR, Lodoen M, Barragan A, Se AB, Bhandage AK, & Kanatani S (2019). Toxoplasma-Induced Hypermigration of Primary Cortical Microglia Implicates GABAergic Signaling. Frontiers in Cellular and Infection Microbiology | Www.Frontiersin.Org, 1, 73. 10.3389/fcimb.2019.00073 [DOI] [PMC free article] [PubMed] [Google Scholar]
- Blinzinger K, and Kreutzberg G (1968). Displacement of synaptic terminals from regenerating motoneurons by microglial cells. Z Zellforsch Mikrosk Anat 85, 145–157. [DOI] [PubMed] [Google Scholar]
- Borges K, Gearing M, McDermott DL, Smith AB, Almonte AG, Wainer BH, & Dingledine R (2003). Neuronal and glial pathological changes during epileptogenesis in the mouse pilocarpine model. Experimental Neurology, 182(1), 21–34. 10.1016/S0014-4886(03)00086-4 [DOI] [PubMed] [Google Scholar]
- Brooks JM, Carrillo GL, Su J, Lindsay DS, Fox MA, and Blader IJ (2015). Toxoplasma gondii Infections Alter GABAergic Synapses and Signaling in the Central Nervous System. MBio 6, e01428–01415. [DOI] [PMC free article] [PubMed] [Google Scholar]
- Burgdorf KS, Trabjerg BB, Pedersen MG, Nissen J, Banasik K, Pedersen OB, Sorensen E, Nielsen KR, Larsen MH, Erikstrup C, et al. (2019). Large-scale study of Toxoplasma and Cytomegalovirus shows an association between infection and serious psychiatric disorders. Brain Behav Immun 79, 152–158. [DOI] [PubMed] [Google Scholar]
- Cabral CM, Tuladhar S, Dietrich HK, Nguyen E, MacDonald WR, Trivedi T, Devineni A, and Koshy AA (2016). Neurons are the Primary Target Cell for the Brain-Tropic Intracellular Parasite Toxoplasma gondii. PLoS Pathog 12, e1005447. [DOI] [PMC free article] [PubMed] [Google Scholar]
- Carvalho K, Emilie Faivre Ã, Marie Pietrowski ÃJ, Marques X, Gomez-Murcia V, Deleau A, Huin V, Hansen JN, Kozlov S, ment Danis C, Temido-Ferreira M, Coelho JE, line Mé riaux C, Eddarkaoui S, phanie Le Gras S, lanie Dumoulin M, Cellai L, Brain Bank N, Landrieu I, … Blum D (n.d.). Exacerbation of C1q dysregulation, synaptic loss and memory deficits in tau pathology linked to neuronal adenosine A 2A receptor Abbreviations: A 2A R = adenosine A 2A receptor; FTLD = frontotemporal lobar degeneration. 10.1093/brain/awz335 [DOI] [PMC free article] [PubMed] [Google Scholar]
- Carrillo GL, Ballard VA, Glausen T, Boone Z, Teamer J, Hinkson CL, Wohlfert EA, Blader IJ, & Fox MA (2020). Toxoplasma infection induces microglia-neuron contact and the loss of perisomatic inhibitory synapses. GLIA, 68(10). 10.1002/glia.23816 [DOI] [PMC free article] [PubMed] [Google Scholar]
- Chen Z, Jalabi W, Hu W, Park HJ, Gale JT, Kidd GJ, Bernatowicz R, Gossman ZC, Chen JT, Dutta R, et al. (2014). Microglial displacement of inhibitory synapses provides neuroprotection in the adult brain. Nat Commun 5, 4486. [DOI] [PMC free article] [PubMed] [Google Scholar]
- Cunningham CL, Martínez-Cerdeño V, & Noctor SC (2013). Microglia regulate the number of neural precursor cells in the developing cerebral cortex. Journal of Neuroscience, 33(10), 4216–4233. 10.1523/JNEUROSCI.3441-12.2013 [DOI] [PMC free article] [PubMed] [Google Scholar]
- Dabritz HA, Gardner IA, Miller MA, Lappin MR, Atwill ER, Packham AE, Melli AC, & Conrad PA (2007). Evaluation of two Toxoplasma gondii serologic tests used in a serosurvey of domestic cats in California. Journal of Parasitology, 93(4), 806–816. 10.1645/GE-996R.1 [DOI] [PubMed] [Google Scholar]
- Datta D, Leslie SN, Morozov YM, Duque A, Rakic P, van Dyck CH, Nairn AC, & Arnsten AFT (2020). Classical complement cascade initiating C1q protein within neurons in the aged rhesus macaque dorsolateral prefrontal cortex. Journal of Neuroinflammation, 17(1). 10.1186/s12974-019-1683-1 [DOI] [PMC free article] [PubMed] [Google Scholar]
- David CN, Frias ES, Szu JI, Vieira PA, Hubbard JA, Lovelace J, Michael M, Worth D, McGovern KE, Ethell IM, et al. (2016). GLT-1-Dependent Disruption of CNS Glutamate Homeostasis and Neuronal Function by the Protozoan Parasite Toxoplasma gondii. PLoS Pathog 12, e1005643. [DOI] [PMC free article] [PubMed] [Google Scholar]
- Dickerson F, Origoni A, Schweinfurth LAB, Stallings C, Savage CLG, Sweeney K, Katsafanas E, Wilcox HC, Khushalani S, and Yolken R (2018). Clinical and Serological Predictors of Suicide in Schizophrenia and Major Mood Disorders. J Nerv Ment Dis 206, 173–178. [DOI] [PubMed] [Google Scholar]
- Dickerson F, Stallings C, Origoni A, Schroeder J, Khushalani S, and Yolken R (2014). Mortality in schizophrenia: clinical and serological predictors. Schizophr Bull 40, 796–803. [DOI] [PMC free article] [PubMed] [Google Scholar]
- Dickerson F, Wilcox HC, Adamos M, Katsafanas E, Khushalani S, Origoni A, Savage C, Schweinfurth L, Stallings C, Sweeney K, et al. (2017). Suicide attempts and markers of immune response in individuals with serious mental illness. J Psychiatr Res 87, 37–43. [DOI] [PubMed] [Google Scholar]
- D’Mello C, Le T, & Swain MG (2009). Cerebral microglia recruit monocytes into the brain in response to tumor necrosis factora signaling during peripheral organ inflammation. Journal of Neuroscience, 29(7), 2089–2102. 10.1523/JNEUROSCI.3567-08.2009 [DOI] [PMC free article] [PubMed] [Google Scholar]
- Dubey JP (2009). History of the discovery of the life cycle of Toxoplasma gondii. In International Journal for Parasitology (Vol. 39, Issue 8, pp. 877–882). 10.1016/j.ijpara.2009.01.005 [DOI] [PubMed] [Google Scholar]
- Dubey JP, & Jones JL (2008). Toxoplasma gondii infection in humans and animals in the United States. In International Journal for Parasitology (Vol. 38, Issue 11, pp. 1257–1278). 10.1016/j.ijpara.2008.03.007 [DOI] [PubMed] [Google Scholar]
- Fan Y, Xie L, & Chung CY (2017). Signaling Pathways Controlling Microglia Chemotaxis. Molecules and cells, 40(3), 163–168. 10.14348/molcells.2017.0011 [DOI] [PMC free article] [PubMed] [Google Scholar]
- Favuzzi E, Huang S, Saldi GA, Binan L, Ibrahim LA, Fernández-Otero M, Cao Y, Zeine A, Sefah A, Zheng K, Xu Q, Khlestova E, Farhi SL, Bonneau R, Datta SR, Stevens B, & Fishell G (2021). GABA-receptive microglia selectively sculpt developing inhibitory circuits. Cell, 184(15), 4048–4063.e32. 10.1016/j.cell.2021.06.018 [DOI] [PMC free article] [PubMed] [Google Scholar]
- Flegr J, Prandota J, Sovičková M, & Israili ZH (n.d.). Toxoplasmosis-A Global Threat. Correlation of Latent Toxoplasmosis with Specific Disease Burden in a Set of 88 Countries. 10.1371/journal.pone.0090203 [DOI] [PMC free article] [PubMed] [Google Scholar]
- Fuhrman SA, & Joiner KA (1989). Toxoplasma gondii: mechanism of resistance to complement-mediated killing. Journal of immunology (Baltimore, Md. : 1950), 142(3), 940–947. [PubMed] [Google Scholar]
- Gatkowska J, Wieczorek M, Dziadek B, Dzitko K, and Dlugonska H (2013). Sex-dependent neurotransmitter level changes in brains of Toxoplasma gondii infected mice. Exp Parasitol 133, 1–7. [DOI] [PubMed] [Google Scholar]
- Glausen TG, Carrillo GL, Jin RM, Boyle JP, Saeij J, Wohlfert EA, Fox MA, & Blader IJ (2021). The Toxoplasma Polymorphic Effector GRA15 Mediates Seizure Induction by Modulating Interleukin-1 Signaling in the Brain. mBio, 12(3), e0133121. [DOI] [PMC free article] [PubMed] [Google Scholar]
- Gonzalez-Burgos G, Fish KN, and Lewis DA (2011). GABA neuron alterations, cortical circuit dysfunction and cognitive deficits in schizophrenia. Neural Plast 2011, 723184. [DOI] [PMC free article] [PubMed] [Google Scholar]
- Gonzalez-Burgos G, Hashimoto T, and Lewis DA (2010). Alterations of cortical GABA neurons and network oscillations in schizophrenia. Curr Psychiatry Rep 12, 335–344. [DOI] [PMC free article] [PubMed] [Google Scholar]
- Gonzalez-Burgos G, and Lewis DA (2012). NMDA receptor hypofunction, parvalbumin-positive neurons, and cortical gamma oscillations in schizophrenia. Schizophr Bull 38, 950–957. [DOI] [PMC free article] [PubMed] [Google Scholar]
- Gosselin D, Skola D, Coufal NG, Holtman IR, Schlachetzki JCM, Sajti E, Jaeger BN, O’Connor C, Fitzpatrick C, Pasillas MP, Pena M, Adair A, Gonda DD, Levy ML, Ransohoff RM, Gage FH, & Glass CK (2017). An environment-dependent transcriptional network specifies human microglia identity. Science, 356(6344), 1248–1259. 10.1126/science.aal3222 [DOI] [PMC free article] [PubMed] [Google Scholar]
- Hagan N, Kane JL, Grover D, Woodworth L, Madore C, Saleh J, Sancho J, Liu J, Li Y, Proto J, Zelic M, Mahan A, Kothe M, Scholte AA, Fitzgerald M, Gisevius B, Haghikia A, Butovsky O, & Ofengeim D (2020). CSF1R signaling is a regulator of pathogenesis in progressive MS. Cell Death and Disease, 11(10). 10.1038/s41419-020-03084-7 [DOI] [PMC free article] [PubMed] [Google Scholar]
- Hajimohammadi B, Ahmadian S, Firoozi Z, Askari M, Mohammadi M, Eslami G, Askari V, Loni E, Barzegar-Bafrouei R, & Boozhmehrani MJ (2022). A Meta-Analysis of the Prevalence of Toxoplasmosis in Livestock and Poultry Worldwide. In EcoHealth (Vol. 19, Issue 1, pp. 55–74). Springer. 10.1007/s10393-022-01575-x [DOI] [PMC free article] [PubMed] [Google Scholar]
- Hamm JP, Peterka DS, Gogos JA, and Yuste R (2017). Altered Cortical Ensembles in Mouse Models of Schizophrenia. Neuron 94, 153–167 e158. [DOI] [PMC free article] [PubMed] [Google Scholar]
- Hellwig S, Brioschi S, Dieni S, Frings L, Masuch A, Blank T, & Biber K (2016). Altered microglia morphology and higher resilience to stress-induced depression-like behavior in CX3CR1-deficient mice. Brain, Behavior, and Immunity, 55, 126–137. 10.1016/j.bbi.2015.11.008 [DOI] [PubMed] [Google Scholar]
- Hong S, Beja-Glasser VF, Nfonoyim BM, Frouin A, Li S, Ramakrishnan S, Merry KM, Shi Q, Rosenthal A, Barres BA, Lemere CA, Selkoe DJ, & Stevens B (2016). Complement and microglia mediate early synapse loss in Alzheimer mouse models. Science. 10.1126/science.aad8373 [DOI] [PMC free article] [PubMed] [Google Scholar]
- Huang W-Y, Wang Y-P, Mahmmod YS, Wang J-J, Liu T-H, Zheng Y-X, Zhou X, Zhang X-X, Yuan Z-G, Huang W-Y, Wang Y-P, Wang J-J, Liu T-H, Zheng Y-X, Zhou X, Yuan Z-G, Mahmmod YS, Zhang X-X, & Yuan -G (n.d.). A Double-Edged Sword: Complement Component 3 in Toxoplasma gondii Infection. 10.1002/pmic.201800271 [DOI] [PubMed] [Google Scholar]
- Ihara F, Nishimura M, Muroi Y, Mahmoud ME, Yokoyama N, Nagamune K, and Nishikawa Y (2016). Toxoplasma gondii Infection in Mice Impairs Long-Term Fear Memory Consolidation through Dysfunction of the Cortex and Amygdala. Infect Immun 84, 2861–2870. [DOI] [PMC free article] [PubMed] [Google Scholar]
- Kano SI, Hodgkinson CA, Jones-Brando L, Eastwood S, Ishizuka K, Niwa M, Choi EY, Chang DJ, Chen Y, Velivela SD, et al. (2018). Host-parasite interaction associated with major mental illness. Mol Psychiatry. [DOI] [PMC free article] [PubMed] [Google Scholar]
- Kerschensteiner M, Stadelmann C, Dechant G, Wekerle H, & Hohlfeld R (2003). Neurotrophic Cross-talk between the Nervous and Immune Systems: Implications for Neurological Diseases. [DOI] [PubMed]
- Koshy AA, Dietrich HK, Christian DA, Melehani JH, & Shastri AJ (2012). Toxoplasma Co-opts Host Cells It Does Not Invade. PLoS Pathog, 8(7), 1002825. 10.1371/journal.ppat.1002825 [DOI] [PMC free article] [PubMed] [Google Scholar]
- Krabbe G, Matyash V, Pannasch U, Mamer L, Boddeke HWGM, & Kettenmann H (2012). Activation of serotonin receptors promotes microglial injury-induced motility but attenuates phagocytic activity. Brain, Behavior, and Immunity, 26(3), 419–428. 10.1016/j.bbi.2011.12.002 [DOI] [PubMed] [Google Scholar]
- Kuhn SA, van Landeghem FKH, Zacharias R, Färber K, Rappert A, Pavlovic S, Hoffmann A, Nolte C, & Kettenmann H (2004). Microglia express GABAB receptors to modulate interleukin release. Molecular and Cellular Neuroscience, 25(2), 312–322. 10.1016/J.MCN.2003.10.023 [DOI] [PubMed] [Google Scholar]
- Lang D, Schott BH, van Ham M, Morton L, Kulikovskaja L, Herrera-Molina R, Pielot R, Klawonn F, Montag D, Jansch L, et al. (2018). Chronic Toxoplasma infection is associated with distinct alterations in the synaptic protein composition. J Neuroinflammation 15, 216. [DOI] [PMC free article] [PubMed] [Google Scholar]
- Lewis DA, Fish KN, Arion D, and Gonzalez-Burgos G (2011). Perisomatic inhibition and cortical circuit dysfunction in schizophrenia. Curr Opin Neurobiol 21, 866–872. [DOI] [PMC free article] [PubMed] [Google Scholar]
- Li Y, Severance EG, Viscidi RP, Yolken RH, & Xiao J (2019). Persistent Toxoplasma Infection of the Brain Induced Neurodegeneration Associated with Activation of Complement and Microglia. Infection and Immunity, 87(8), e00139–19. 10.1128/IAI.00139-19 [DOI] [PMC free article] [PubMed] [Google Scholar]
- Lodato S, Rouaux C, Quast KB, Jantrachotechatchawan C, Studer M, Hensch TK, & Arlotta P (2011). Excitatory Projection Neuron Subtypes Control the Distribution of Local Inhibitory Interneurons in the Cerebral Cortex. Neuron, 69(4), 763–779. 10.1016/j.neuron.2011.01.015 [DOI] [PMC free article] [PubMed] [Google Scholar]
- Lodge DJ, Behrens MM, & Grace AA (2009). Neurobiology of Disease A Loss of Parvalbumin-Containing Interneurons Is Associated with Diminished Oscillatory Activity in an Animal Model of Schizophrenia. 10.1523/JNEUROSCI.5419-08.2009 [DOI] [PMC free article] [PubMed] [Google Scholar]
- Marin O (2012). Interneuron dysfunction in psychiatric disorders. Nat Rev Neurosci 13, 107–120. [DOI] [PubMed] [Google Scholar]
- Martin HL, Alsaady I, Howell G, Prandovszky E, Peers C, Robinson P, and McConkey GA (2015). Effect of parasitic infection on dopamine biosynthesis in dopaminergic cells. Neuroscience 306, 50–62. [DOI] [PMC free article] [PubMed] [Google Scholar]
- Mazaheri F, Snaidero N, Kleinberger G, Madore C, Daria A, Werner G, Krasemann S, Capell A, Trümbach D, Wurst W, Brunner B, Bultmann S, Tahirovic S, Kerschensteiner M, Misgeld T, Butovsky O, & Haass C (2017). TREM2 deficiency impairs chemotaxis and microglial responses to neuronal injury. EMBO reports, 18(7), 1186–1198. 10.15252/embr.201743922 [DOI] [PMC free article] [PubMed] [Google Scholar]
- Melzer TC, Cranston HJ, Weiss LM, & Halonen SK (2010). Host Cell Preference of Toxoplasma gondii Cysts in Murine Brain: A Confocal Study. Journal of Neuroparasitology, 1, 1–6. 10.4303/jnp/n100505 [DOI] [PMC free article] [PubMed] [Google Scholar]
- Mendez OA, Machado EF, Lu J, & Koshy AA (2021). Injection with toxoplasma gondii protein affects neuron health and survival. ELife, 10. 10.7554/eLife.67681 [DOI] [PMC free article] [PubMed] [Google Scholar]
- McConkey GA, Martin HL, Bristow GC, and Webster JP (2013). Toxoplasma gondii infection and behaviour - location, location, location? J Exp Biol 216, 113–119. [DOI] [PMC free article] [PubMed] [Google Scholar]
- Michailidou I, Naessens DMP, Hametner S, Guldenaar W, Kooi EJ, Geurts JJG, Baas F, Lassmann H, & Ramaglia V (2017). Complement C3 on microglial clusters in multiple sclerosis occur in chronic but not acute disease: Implication for disease pathogenesis. GLIA, 65(2), 264–277. 10.1002/glia.23090 [DOI] [PMC free article] [PubMed] [Google Scholar]
- Montoya JG, and Liesenfeld O (2004). Toxoplasmosis. Lancet 363, 1965–1976. [DOI] [PubMed] [Google Scholar]
- Mukherjee A, Carvalho F, Eliez S, and Caroni P (2019). Long-Lasting Rescue of Network and Cognitive Dysfunction in a Genetic Schizophrenia Model. Cell 178, 1387–1402 e1314. [DOI] [PubMed] [Google Scholar]
- Paolicelli RC, Bolasco G, Pagani F, Maggi L, Scianni M, Panzanelli P, Giustetto M, Ferreira TA, Guiducci E, Dumas L, Ragozzino D, & Gross CT (2011). Synaptic pruning by microglia is necessary for normal brain development. Science, 333(6048), 1456–1458. 10.1126/science.1202529 [DOI] [PubMed] [Google Scholar]
- Pappas G, Roussos N, and Falagas ME (2009). Toxoplasmosis snapshots: global status of Toxoplasma gondii seroprevalence and implications for pregnancy and congenital toxoplasmosis. Int J Parasitol 39, 1385–1394. [DOI] [PubMed] [Google Scholar]
- Parlog A, Schluter D, and Dunay IR (2015). Toxoplasma gondii-induced neuronal alterations. Parasite Immunol 37, 159–170. [DOI] [PubMed] [Google Scholar]
- Pocock JM, & Kettenmann H (2007). Neurotransmitter receptors on microglia. In Trends in Neurosciences (Vol. 30, Issue 10, pp. 527–535). 10.1016/j.tins.2007.07.007 [DOI] [PubMed] [Google Scholar]
- Schafer DP, Lehrman EK, Kautzman AG, Koyama R, Mardinly AR, Yamasaki R, Ransohoff RM, Greenberg ME, Barres BA, and Stevens B (2012). Microglia sculpt postnatal neural circuits in an activity and complement-dependent manner. Neuron 74, 691–705. [DOI] [PMC free article] [PubMed] [Google Scholar]
- Schwaller B, Tetko IV, Tandon P, Silveira DC, Vreugdenhil M, Henzi T, Potier MC, Celio MR, and Villa AE (2004). Parvalbumin deficiency affects network properties resulting in increased susceptibility to epileptic seizures. Mol Cell Neurosci 25, 650–663. [DOI] [PubMed] [Google Scholar]
- Seifert S, Pannell M, Uckert W, Färber K, & Kettenmann H (2011). Transmitter- and hormone-activated Ca2+ responses in adult microglia/brain macrophages in situ recorded after viral transduction of a recombinant Ca2+ sensor. Cell Calcium, 49(6), 365–375. 10.1016/J.CECA.2011.03.005 [DOI] [PubMed] [Google Scholar]
- Selkoe DJ (2002). Alzheimer’s disease is a synaptic failure. Science (New York, N.Y.), 298(5594), 789–791. 10.1126/science.1074069 [DOI] [PubMed] [Google Scholar]
- Shinjyo N, Hikosaka K, Kido Y, Yoshida H, & Norose K (2021). Toxoplasma Infection Induces Sustained Up-Regulation of Complement Factor B and C5a Receptor in the Mouse Brain via Microglial Activation: Implication for the Alternative Complement Pathway Activation and Anaphylatoxin Signaling in Cerebral Toxoplasmosis. Frontiers in Immunology, 11. 10.3389/fimmu.2020.603924 [DOI] [PMC free article] [PubMed] [Google Scholar]
- Sims TA, Hay J, and Talbot IC (1989). An electron microscope and immunohistochemical study of the intracellular location of Toxoplasma tissue cysts within the brains of mice with congenital toxoplasmosis. Br J Exp Pathol 70, 317–325. [PMC free article] [PubMed] [Google Scholar]
- Sikorski PM, Commodaro AG, & Grigg ME (n.d.). A Protective and Pathogenic Role for Complement During Acute Toxoplasma gondii Infection. 10.3389/fcimb.2021.634610 [DOI] [PMC free article] [PubMed] [Google Scholar]
- Sikorski PM, Commodaro AG, & Grigg ME (2020). Toxoplasma gondii Recruits Factor H and C4b-Binding Protein to Mediate Resistance to Serum Killing and Promote Parasite Persistence in vivo. Frontiers in Immunology, 10. 10.3389/fimmu.2019.03105 [DOI] [PMC free article] [PubMed] [Google Scholar]
- Skallova A, Kodym P, Frynta D, and Flegr J (2006). The role of dopamine in Toxoplasma-induced behavioural alterations in mice: an ethological and ethopharmacological study. Parasitology 133, 525–535. [DOI] [PubMed] [Google Scholar]
- Stevens B, Allen NJ, Vazquez LE, Howell GR, Christopherson KS, Nouri N, Micheva KD, Mehalow AK, Huberman AD, Stafford B, Sher A, Litke AMM, Lambris JD, Smith SJ, John SWM, & Barres BA (2007). The Classical Complement Cascade Mediates CNS Synapse Elimination. Cell, 131(6), 1164–1178. 10.1016/j.cell.2007.10.036 [DOI] [PubMed] [Google Scholar]
- Vyas A, Kim SK, Giacomini N, Boothroyd JC, and Sapolsky RM (2007). Behavioral changes induced by Toxoplasma infection of rodents are highly specific to aversion of cat odors. Proc Natl Acad Sci U S A 104, 6442–6447. [DOI] [PMC free article] [PubMed] [Google Scholar]
- Wang C, Yue H, Hu Z, Shen Y, Ma J, Li J, Wang X-D, Wang L, Sun B, Shi P, Wang L, & Gu Y (n.d.). Microglia mediate forgetting via complement-dependent synaptic elimination. https://www.science.org [DOI] [PubMed]
- Wan Y, Feng B, You Y, Yu J, Xu C, Dai H, Trapp BD, Shi P, Chen Z, & Hu W (2020). Microglial Displacement of GABAergic Synapses Is a Protective Event during Complex Febrile Seizures. Cell Reports, 33(5). 10.1016/j.celrep.2020.108346 [DOI] [PubMed] [Google Scholar]
- Wang AW, Avramopoulos D, Lori A, Mulle J, Conneely K, Powers A, Duncan E, Almli L, Massa N, McGrath J, et al. (2019). Genome-wide association study in two populations to determine genetic variants associated with Toxoplasma gondii infection and relationship to schizophrenia risk. Prog Neuropsychopharmacol Biol Psychiatry 92, 133–147. [DOI] [PubMed] [Google Scholar]
- Werneburg S, Jung J, Kunjamma RB, Ha SK, Luciano NJ, Willis CM, Gao G, Biscola NP, Havton LA, Crocker SJ, Popko B, Reich DS, & Schafer DP (2020). Targeted Complement Inhibition at Synapses Prevents Microglial Synaptic Engulfment and Synapse Loss in Demyelinating Disease. Immunity, 52(1), 167–182.e7. 10.1016/j.immuni.2019.12.004 [DOI] [PMC free article] [PubMed] [Google Scholar]
- Wohr M, Orduz D, Gregory P, Moreno H, Khan U, Vorckel KJ, Wolfer DP, Welzl H, Gall D, Schiffmann SN, et al. (2015). Lack of parvalbumin in mice leads to behavioral deficits relevant to all human autism core symptoms and related neural morphofunctional abnormalities. Transl Psychiatry 5, e525. [DOI] [PMC free article] [PubMed] [Google Scholar]
- Wong SY, & Remington JS (1993). Biology of Toxoplasma gondii. AIDS (London, England), 7(3), 299–316. 10.1097/00002030-199303000-00001 [DOI] [PubMed] [Google Scholar]
- Xiao J, Li Y, Gressitt KL, He H, Kannan G, Schultz TL, Svezhova N, Carruthers VB, Pletnikov M. v., Yolken RH, & Severance EG (2016). Cerebral complement C1q activation in chronic Toxoplasma infection. Brain, Behavior, and Immunity. 10.1016/j.bbi.2016.04.009 [DOI] [PMC free article] [PubMed] [Google Scholar]
- Xiao J, Prandovszky E, Kannan G, Pletnikov MV, Dickerson F, Severance EG, and Yolken RH (2018). Toxoplasma gondii: Biological Parameters of the Connection to Schizophrenia. Schizophr Bull 44, 983–992. [DOI] [PMC free article] [PubMed] [Google Scholar]
Associated Data
This section collects any data citations, data availability statements, or supplementary materials included in this article.
Supplementary Materials
Data Availability Statement
The data that support the findings of this study are available from the corresponding author upon reasonable request.