Abstract
Brillouin microscopy is a technique for mechanical characterizations of biological material without contact at high 3D resolution. Here, we introduce dual line-scanning Brillouin microscopy (dLSBM) that improves acquisition speed and reduces irradiation dose by over one order of magnitude with selective illumination and single-shot analysis of hundreds of points along the incident beam axis. Using tumor spheroids, we demonstrate the ability to capture the sample response to rapid mechanical perturbations as well as the spatially-resolved evolution of the mechanical properties in growing spheroids.
Editorial Summary:
A dual line-scanning approach increases imaging speed and reduces illumination levels in Brillouin microscopy, which is demonstrated on spheroids.
The biomechanical properties and interactions of cells and tissues are critically involved in many biological functions1, 2. As a result, many techniques have been developed in the past decades to quantify the mechanical properties of biologically relevant materials3, 4. Among these, Brillouin optical microscopy has emerged as an attractive option due to its ability to probe material mechanics without contact or labels5-7. Thus, Brillouin microscopy can provide mechanical measurements when traditional methods cannot be used, for example because no physical access can be gained to the region of interest such as in tissue8, 3D microenvironments9 or microfluidic channels10.
Spontaneous Brillouin scattering arises from the interaction of light with thermal acoustic phonons resulting in scattered light11. The Brillouin frequency shift, i.e., the difference in frequency between incident and scattered light (~0.01 nm), is related to the longitudinal elastic modulus and thus gives access to the local mechanical properties of material. Despite tremendous progress in confocal Brillouin microscopy over the past fifteen years, slow acquisition speed (20-200 ms per spectrum) remains the major limiting factor towards the widespread adoption of Brillouin technology in biomedicine12. To overcome the speed limitation, stimulated Brillouin scattering has been recently proposed,13 where acoustic photons are driven by resonant pump-probe interaction so that stronger Brillouin signal is generated. However, stimulated Brillouin spectrometers have not reduced acquisition time below 20 ms in biological samples due to sub-optimal continuous wave operation and less efficient light detection. In addition, both spontaneous and stimulated Brillouin microscopy are based on point-scanning, leading to slow acquisition times and high irradiation doses due to the redundant illumination of out-of-focus voxels.
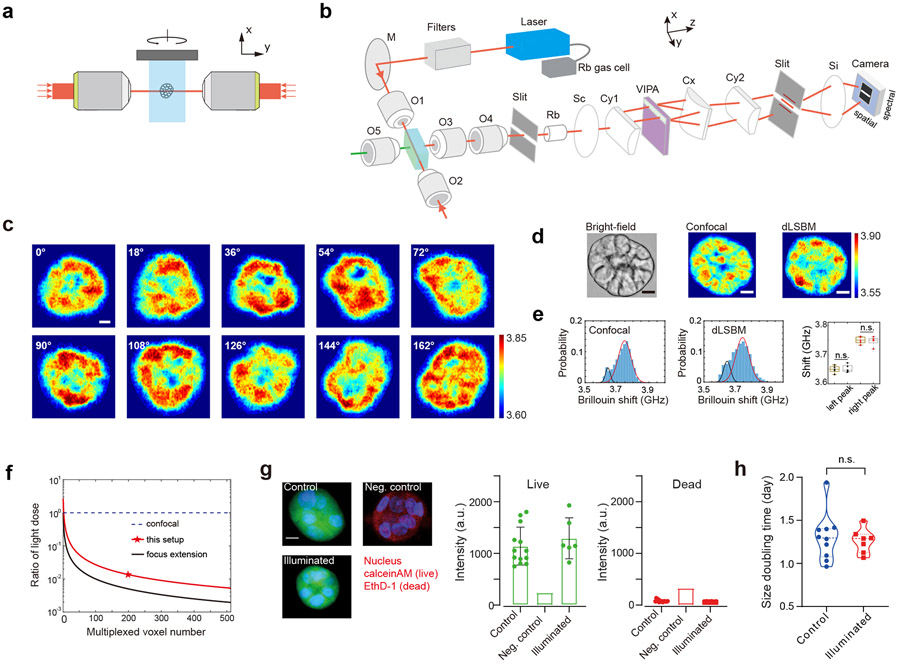
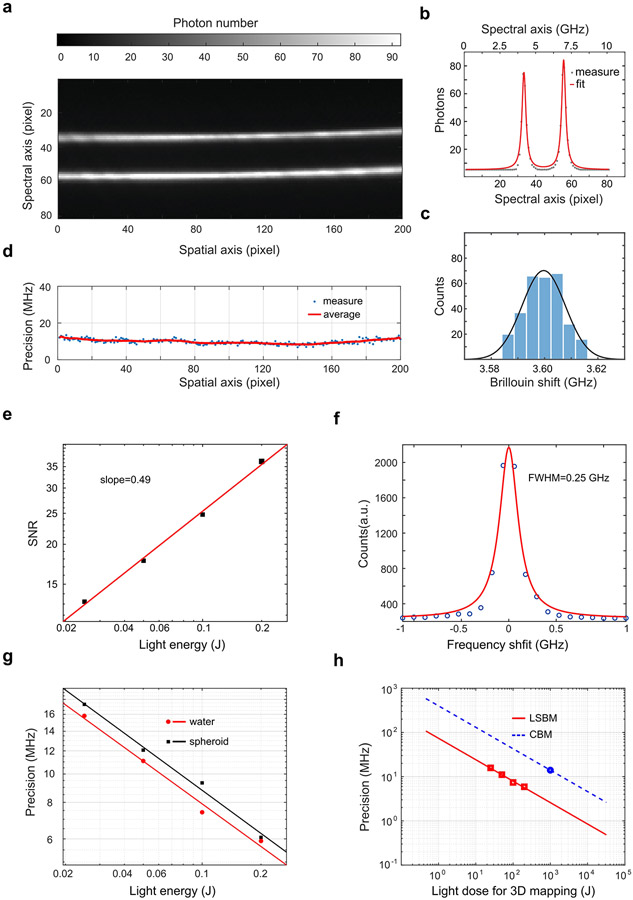
An efficient solution to the speed/photodamage challenge lies in multiplexing. For example, light-sheet fluorescence microscopy has improved acquisition speed and reduced photodamage of confocal fluorescence microscopy by selective illumination and multiplexed detection14. Here, we developed a multiplexing solution for Brillouin spectroscopy/microscopy via dual line-scanning Brillouin microscopy (dLSBM) with simultaneous imaging and single-shot spectral analysis of hundreds of points. The setup features dual-line illumination with counterpropagating beams that are sequentially switched on (Figure 1a & 1b, Extended Data Fig. 1), which enables light-efficient multiplexing along the illumination axis and orthogonal collection free of refractive-index artifacts (Supplementary note 1, Extended Data Figs. 2-3). To enable single-shot Brillouin spectral analysis of the multiple points, we used the perpendicular direction to the dispersion axis of an etalon interferometer15 for spatial multiplexing. To further minimize absorption-induced phototoxicity, we used a narrowband infrared laser and cleaned its spectrum to suppress side modes and amplified spontaneous emission (Extended Data Fig.1, Methods). Using such laser also enabled additional 40 dB rejection of non-Brillouin light with a heated Rb gas cell. Overall, the multiplexed Brillouin spectrometer reaches the required specifications for biomechanical analysis of biological samples (Extended Data Fig. 4a-4g): spectral extinction >70 dB for shot-noise operation; spectral resolution of 0.25 GHz, spectral precision of 10 MHz; and, equivalent acquisition of 1 ms per pixel in biological samples, i.e. over one order of magnitude faster than state-of-the-art spontaneous confocal or stimulated setups12, 13.
Figure 1. Design and validation of the dLSBM.
a, Schematic of dual-line illumination configuration. b, Optical setup of the instrument. The laser beam, whose frequency is locked to the absorption line of Rubidium gas, is spectrally cleaned by filters and focused into the sample from two sides. A home-built bright-field microscope (indicated by the green line and O5) is used for image guidance and alignment of laser beam, and the Brillouin signals are collected by the multiplexed spectrometer. M, mirror; O1-O5, objective lenses; Rb, Rubidium gas chamber; Sc, Si, spherical lenses; Cy1, Cy2, Cx: cylindrical lenses. VIPA: virtually imaged phased array. c, 3D Brillouin mapping of a spheroid by rotating it along x axis. Labels indicate the relative azimuth angle in y-z plane. 100×200×10 pixels were scanned, with a total acquisition time of less than 4 minutes. d, Brillouin images of the same spheroid measured by confocal Brillouin modality at 180° geometry and the dLSBM at 90° geometry. The acquisition time of each image (100×200 pixels) of dLSBM and confocal Brillouin is about 20 seconds and 16 minutes, respectively. e, Histogram distributions of the Brillouin shifts of the scanned sections by confocal Brillouin and dLSBM. Solid lines are fitting results by Gaussian profile. The locations of the left and right peak are 3.643 GHz and 3.747 GHz for confocal image and 3.646 GHz and 3.744 GHz for line-scanning image, respectively. Multiple independent spheroids (n=5) were measured, and there was no significant difference of the peak positions. Statistical significance is determined by performing two-sided two-sample t-test (left peak: p=0.7758; right peak: p=0.7303). In all boxplots, the central mark indicates the median, and the bottom and top edges indicate the 25th and 75th percentiles, respectively. The whiskers extend to the most extreme data points not considered outliers. f, Induced light dose of the dLSBM setup compared to confocal configuration for 3D Brillouin imaging. g, Live-dead assay. Control group, n=13; Illuminated group, n=6; Negative control was used for calibrating fluorescence intensity of red channel, n=1; The bar represents the mean, and the error bar represents standard deviation. h, Comparison of the proliferation rate between control (n=10) and illuminated (n=7) spheroids. n.s., not statistically significant (p=0.7180). Statistical significance is determined by performing two-sided unpaired t-test. Scale bar, 10 μm. Color bar in c and d represents Brillouin shift with a unit of GHz.
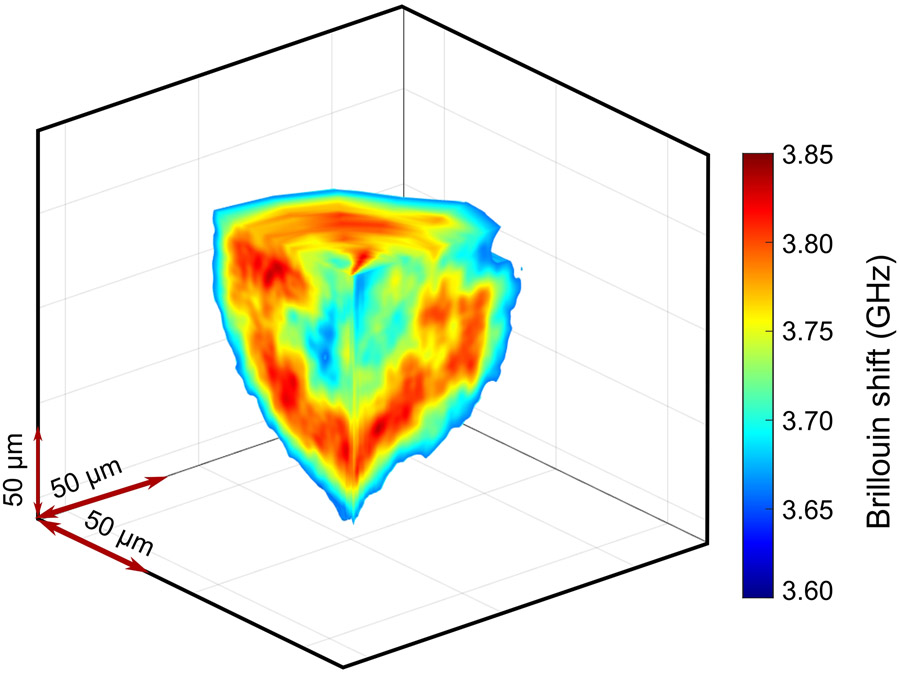
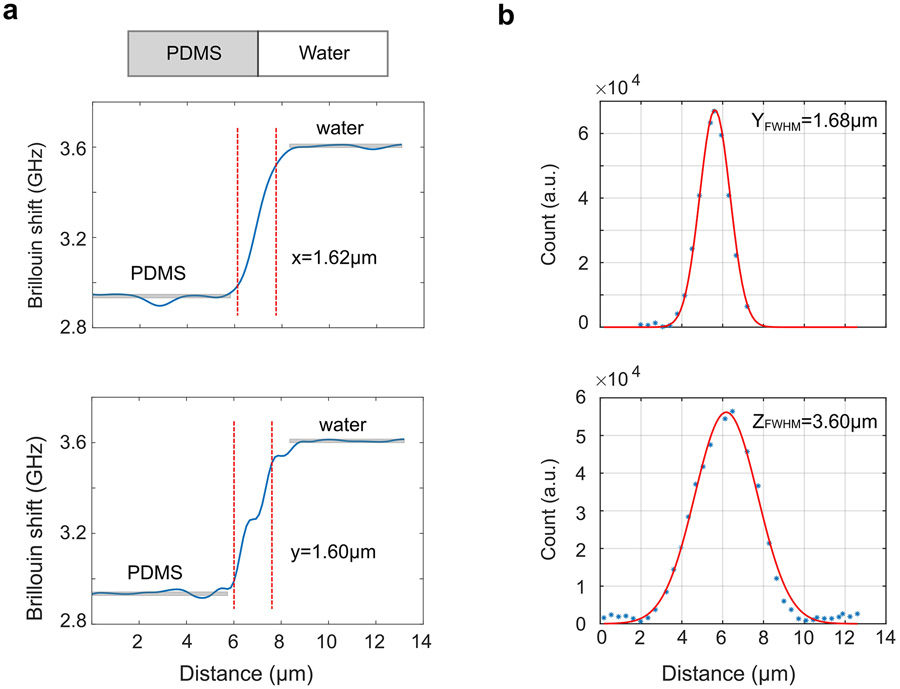
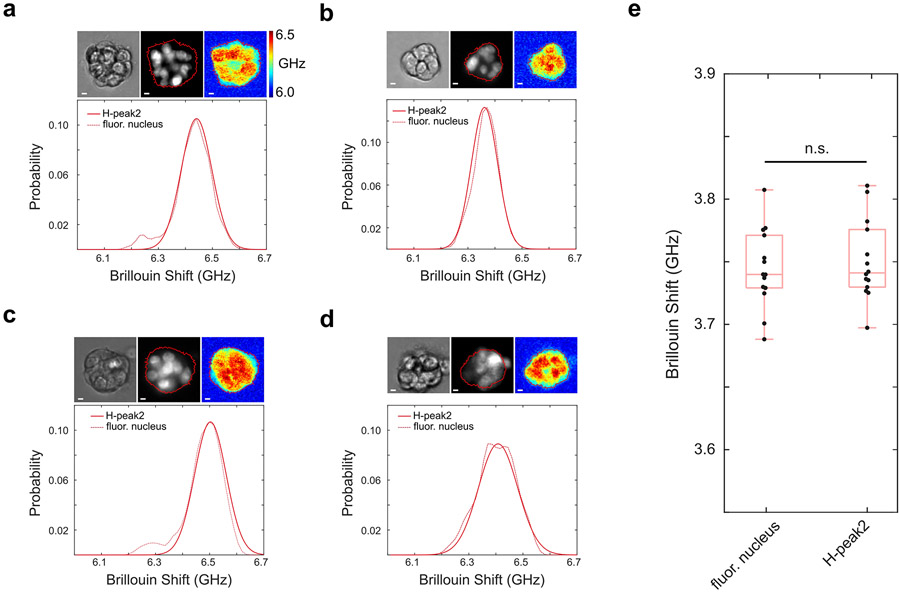
To acquire a 3D image, multiple 2D Brillouin images were taken by rotating the spheroid in the y-z plane with a total acquisition time of ~4 minutes (Figure 1c, Extended Data Fig.5). Overall, using illumination NA of 0.1 and collection NA of 0.3, the dLSBM has a spatial resolution of 1.6 μm×1.6 μm×4.0 μm (Extended Data Fig.6) and a field of view of 150 μm×150 μm×160 μm. For validation, we compared our dLSBM setup with a confocal Brillouin microscope on the same spheroid sample (Figure 1d, Extended Data Fig.7). Although the co-registration of images cannot be exact because the voxel size of dLSBM is twice smaller and the sample is manually transferred between instruments, the histogram distributions of the images indicate dLSBM captured the same mechanical features as the confocal Brillouin microscope (Figure 1e). With nuclear staining of the spheroids, we confirmed that the right peaks of the histograms were dominated by the Brillouin shift of the cell nuclei (Extended Data Fig. 8), indicating the dLSBM probes spheroid mechanics at subcellular resolution.
Since spontaneous Brillouin scattering operates in non-depleted-pump regime, and thanks to the dual-line illumination (Supplementary note 1), we could implement “on-axis” multiplexing, i.e. the illumination beam propagation axis is the multiplexing direction. This eliminates the out-of-focus redundant illumination of point-scanning or off-axis multiplexing configurations thus resulting in the total light dose being reduced to 7.4% of an equivalent confocal setup (Figure 1f, red star) for 3D imaging (Supplementary note 2, Extended Data Fig.4h). Applying focus extension techniques could further reduced light dose 5 folds (Figure 1f, black curve). Beyond avoiding photodamage (Figure 1g), dLSBM’s light dose importantly does not affect spheroids’ growth (Figure 1h, Extended Data Fig. 9), a clear demonstration of the non-perturbative nature of our configuration. In summary, dLSBM provides more than one order of magnitude improvement in both acquisition speed and light dose, thus enabling Brillouin imaging for both rapid response and long-term biomechanical studies.
Tumor organoids are a valuable field-testing sample as they represent a widespread model to study tumor etiology, progression, and drug sensitivity16 in which mechanical properties have remained elusive17. The improved acquisition speed of the dLSBM allowed us to monitor the quick mechanical response of tumor spheroids to osmotic stress18. We subjected tumor spheroids to osmotic shocks and tracked their Brillouin shift every minute (Figure 2a-2c). As expected, the Brillouin shift of the multicellular spheroids increased under hyperosmotic shock and decreased under hypoosmotic shock (Figure 2d, Extended Data Fig.10). Brillouin imaging ability also revealed that the internal mechanical heterogeneity had different response to hyperosmotic shocks, where spheroids maintained similar spatial heterogeneity as control samples compared to hypoosmotic shocks, where spheroids became spatially uniform (Figure 2e, Supplementary Fig.1): this is expected given the flatter modulus behavior with increasing hydration, but may also be exacerbated by the diminished sensitivity of Brillouin technique at high hydration levels19.
Figure 2. Mechanical response of the spheroids to external perturbations and long-term mechanical evolution.
a-c, Representative time-lapse Brillouin images of the spheroid under conditions of hyperosmotic shock (a), no shock (b), and hypoosmotic shock (c). 100×200 pixels were scanned for each image, with the acquisition speed of 20 seconds per frame. Scale bar, 10 μm. d, e, Temporal change of the averaged Brillouin shift (d) and the standard deviation (e) of spheroids in hyperosmotic shock group (n=5), control group (n=6), and hypoosmotic shock group (n=5). f, Representative Brillouin images of normal (M1) and tumor spheroid (M2) on Day 2 and Day 5. Scale bar is 10 μm. g, Brillouin shift of M1 (n=26) and M2 (n=42) on day 2 and M1 (n=59) and M2 (n=32) on day 5. Day 2 *p=5×10⁻⁵. Day 5, no significant difference (p=0.4817). Statistical significance is determined by performing two-sided two-sample t-test, and no adjustment was made. h, Young’s modulus of M1 and M2 on days 2 and 5, as measured with AFM. Data points show the mean of all repeats (n=3 independent experiments) and are represented as mean +/− S.E.M. Day 2 *p=0.0379. Day5, no significant difference (p=0.2023). Statistical significance is determined by performing two-sided unpaired t-test with all repeats. i, Standard deviation of the Brillouin shift of M1 and M2. Day 2, no significant difference (p=0.9493). Day 5 *p=0.0074. Statistical significance is determined by performing two-sided two-sample t-test, and no adjustment was made. j, Radial averages of the Brillouin shifts of normal and tumor spheroids on Day 2 and Day 5. Plot with error band represents mean ±S.E.M. Color bar represents Brillouin shift with a unit of GHz. In all boxplots, the central mark indicates the median, and the bottom and top edges indicate the 25th and 75th percentiles, respectively. The whiskers extend to the most extreme data points not considered outliers.
Recent work has revealed that tumor cells show different mechanical properties as a function of the extracellular matrix (ECM) milieu compared to that of their normal counterparts20. However, what drives this mechanical coupling across multicellular structures is less understood. This is an open question on how tumor cells adapt to mechanical environments along the metastatic cascade. Here, using spheroids derived from breast cancer isogenic cancer progression lines that mimic different stages of malignancy, we used dLSBM to compare the mechanical evolution of healthy tissue spheroids (from healthy epithelial cell line (M1: MCF10A)) with the mechanical properties of tumor-like tissue spheroids (from tumor cell line (M2: MCF10AT1k.cl2)). At single cell level, healthy mammary cells have higher modulus than the corresponding precancerous or cancerous ones21; here we asked if such relation was conserved upon spheroid growth. We measured spheroids at early (Day 2) and later (Day 5) culturing stage (Figure 2f, Supplementary Fig. 2). At day 2, tumor spheroids showed lower Brillouin shift than healthy spheroids, mirroring the single cell behavior. However, as spheroids grew, this mechanical difference vanished (Figure 2g), an observation which we validated with atomic force microscopy (AFM) (Figure 2h, Supplementary Fig. 3). Beyond average values, dLSBM enables to investigate the spatial behavior of the mechanical evolution of multicellular spheroids. We observed that the tumor spheroids showed higher mechanical heterogeneity than normal ones while growing (Figure 2i). To further understand this feature, we extracted the radial average of the Brillouin shift (Figure 2j). We found both normal and tumor spheroids had similar radial mechanical change at early stages. Instead, at later stages, the tumor population showed much steeper radial gradient than the normal spheroids, suggesting that the change in mechanical properties is driven by the core of the spheroids. Since tumor progression is often accompanied by altered tissue biomechanics, the dLSBM can serve as a unique platform to dissect the role of mechanical regulation in tumorigenesis.
In summary, we have demonstrated rapid 3D mechanical mapping of biological samples thanks to dual line-scanning Brillouin microscopy featuring simultaneous imaging and single-shot spectral analysis of hundreds of points along the optical axis. Compared with previous line-scan spectrometer design15, dLSBM has >1000-fold higher spectral extinction, ~80-fold reduced photodamage, and the laser frequency locking allows long-term stability in longitudinal biological experiment. Further improvements of our technique include focus extension of the illumination beam; inverted geometry for easier/flexible sample preparation; larger penetration depth via adaptive optics; and, the combination of dLSBM and light-sheet fluorescence microscopy. We validated the technique against confocal Brillouin microscopy verifying the equivalence of extracted information and the superior performances in terms of speed and light dose. We demonstrated dLSBM enables to detect biologically relevant mechanical changes in multicellular organisms such as tumor spheroids for both short time studies and long-term culture, limited only by the penetration depth of the illumination beam due to spheroid turbidity. Consistent with previous studies17, 22, we observed a robust stiffening behavior in the evolution of growing tumor spheroids which we validated against gold standard AFM. These capabilities show dLSBM is a promising method to study biomechanical processes in developmental biology, tissue engineering and organ-on-a-chip applications.
Methods
Brillouin light scattering
Brillouin microscope is based on the spontaneous Brillouin scattering, an optical phenomenon caused by the interaction of light and inherent acoustic phonons of the material. The scattered light experiences a frequency shift (i.e. Brillouin shift ωB) determined by the equation , where λ is laser wavelength, n and ρ are refractive index and density of the material, M ′is the longitudinal modulus, and θ is the collected scattering angle. With known laser wavelength and scattering geometry, the results measured by Brillouin microscopes with different configurations are directly comparable.
Dual line-scanning Brillouin microscope
The light source is a continuous wave tunable diode laser (DL pro, Toptica) with a central wavelength of 780.24 nm and a linewidth of less than 0.3 MHz. During operation, the laser frequency was locked to the absorption line of the Rubidium gas (Rb-85) thus can achieve long term stability for longitudinal biological study. The light source was coupled into an optical amplifier (BoosTA, Toptica) to acquire an output power as high as 3 watts. The output beam was delivered to the optical setup via an optical fiber and a collimator (PAF2A-11B, Thorlabs). The laser spectrum was cleaned by using two ultra-narrowband Bragg filters (BP-780, OptiGrate) and a Fabry-Perot (FP) etalon (Light Machinery) with a free spectrum range (FSR) of 15 GHz. The Bragg filter is very stable and needs little adjustments over long time. The FP etalon has a slow drift that requires optimization within hours. For long term stabilization, a feedback loop can be built to correct this drift in real time. The laser beam was then expanded to about 9.5 mm and sent into an objective lens (4×/0.1NA, Olympus) to create a loose beam line for illumination. For dual-line illumination, a flip mirror was used to guide the beam to create a second identical beam line that is propagating against the first one (Extended Data Fig.1). During measurement, the beams were sequentially switched on by the flip mirror. The alignment of the two beams was achieved with the help of the live side image taken by a home-built imaging system, which includes an objective lens (10×/0.25, Olympus), a tube lens (Thorlabs), and a sCMOS camera (Neo, Andor). The beam lines were superposed within a 1-cm sized cuvette (21-200-255, Fisher Scientific), which was filled with medium and used as the sample holder.
The Brillouin signals generated on the illumination beam line were collected with 90-degree geometry by a multiplexed Brillouin spectrometer (Fig.1b). To enable imaging simultaneous to spectral analysis, the etalon interferometer was in the infinity space of a 2.5× imaging system and the image of the illumination beams was formed at the same plane of the Brillouin spectra. In detail, the beam line was first imaged onto the first slit (VA100, Thorlabs) by a pair of objective lenses (20×/0.4NA, 4×/0.1NA, Olympus), which yielded the effective NA of ~0.3 for the collection path. The image of the line was then collimated by a spherical lens (f = 400 mm, Thorlabs) and coupled into the entrance window of the VIPA (virtually imaged phased array) etalon (FSR=10 GHz, Light Machinery) by a cylindrical lens (f = 200 mm, Thorlabs). After the VIPA etalon, the spectrum of the beam line was projected onto the second slit (VA100, Thorlabs) by a combination of two cylindrical lenses (f1 = 1000 mm, f2 = 400 mm, Thorlabs). The Brillouin spectral pattern was then reimaged by a doublets pair (MAP1040100-B, Thorlabs) and recorded by a EMCCD (iXon Ultra 897, Andor). To improve the spectral extinction, a 150-mm Rb gas cell (TG-ABRB-I85-Q, Precision Glassblowing) was placed between the first slit and the collimation lens and the laser frequency (780.24 nm) was locked to a Rb-85 absorption line (D2 hyperfine structure). When heated up to around 65 °C, the gas cell can provide spectral extinction of ~ 40 dB.
A customized four-dimensional stage (three translational movements and one rotational movement) was integrated with the dLSBM setup for scanning the sample. We developed a LabVIEW-based program for setup operation and data acquisition. For spheroid imaging, we used the input laser power of ~370 mW and set the exposure time of the EMCCD as 200 ms. Since 200 pixels were acquired simultaneously, the equivalent acquisition time for each pixel is 1 ms. The spectral analysis was conducted in MATLAB (R2021b). The Brillouin shift was retrieved by fitting the spectrum with Lorentzian profiles. We used standard materials including water and methanol for the calibration of the spectrometer.
For dual-line illumination imaging, the ultimate image was obtained by image fusion process using MATLAB. To do this, we adapted a procedure established in light-sheet microscopy23. For each sample, we first took two Brillouin images under single-line illumination condition. In case the images have observable distortion along illumination axis, we first used a straight line (perpendicular to illumination axis) to cut off the distortion portion. The cut-off location is determined by the overall strength of the Brillouin signal along illumination axis. Next, the two cropped distortion-free images will be merged at the same location based on the bright-field image. Alternatively, if the images do not have observable distortions, we aligned the single-illumination images based on the profile features and the bright-field image of the sample. Next, we spatially overlapped two images. For each pixel, we selected the value with larger Brillouin shift, and inserted it into a new fused data set. The final image was obtained by cropping the region of interest of the fused data set.
Characterization of dLSBM setup
To characterize the spectral performance, water at room temperature was used as standard sample unless mentioned otherwise (Extended Data Fig.4). For shot noise experiment, the laser power was about 250 mW, and the acquisition time was tuned to change the input light energy. Brillouin signals at each light energy were repeatedly recorded. The signal-to-noise ratio (SNR) was calculated by the ratio of average peak intensity and the standard deviation. The measured data was then fitted by a first-order polynomial under log-log scale. To measure the spectral resolution, the spectra of the laser line were recorded, and the full-width-of-half-maximum (FWHM) was quantified. To measure the spectral precision, the measured spectra were fitted by the Lorentzian function, and the standard deviation of the peak position was quantified. For biomedical experiments, the light dose, acquisition time, and spectral precision are tightly related. Generally, the acquisition time is determined such that the expected spectral precision is achieved while the light dose does not cause any photodamage.
To characterize the spatial resolution, we first measured the transition of the PDMS-water interface, which provides us with the lateral resolution of the setup (Extended Data Fig.6a). We then measured the Rayleigh scattering of a 0.5μm bead (TetraSpeck Microspheres, Thermo Fischer) as it was scanned across the laser beam and quantified the axial resolution as well as the lateral resolution (Extended Data Fig.6b). To prepare the sample, the bead was embedded into 1% agarose solution. The mixture was then injected into a FEP tube (Cole-Parmer). After gelation, the agarose cylinder was pushed out from one end of the tube for experiment.
To quantify the shift gradient caused by the refractive index mismatch, a PDMS sphere with a diameter of ~ 80 μm was embedded into 1% agarose and mapped by dLSBM setup (Extended Data Fig.3). The PDMS sphere was prepared by vortex-mixing method24.
Confocal Brillouin microscope (CBM)
A standard confocal Brillouin microscope with 180° scattering geometry was used for validation. The details of the instrument can be found in previous report7. Briefly, a 660-nm continuous wave laser (Torus, Laser Quantum) with ~10 mW was used as the light source. The add-on Brillouin module was integrated with a commercial inverted confocal microscope (IX81, Olympus) for conducting 2D/3D mapping. A two-stage VIPA based Brillouin spectrometer was used for acquiring Brillouin signal. The spectrometer is shot noise limited and has a spectral precision of ~10 MHz. An objective lens with NA=0.4 (LMPLFLN20×, Olympus) was used for spheroid imaging, and an EMCCD (iXon, Andor) was used for acquiring Brillouin signal with a speed of 50 ms per pixel.
Comparison between dLSBM and CBM
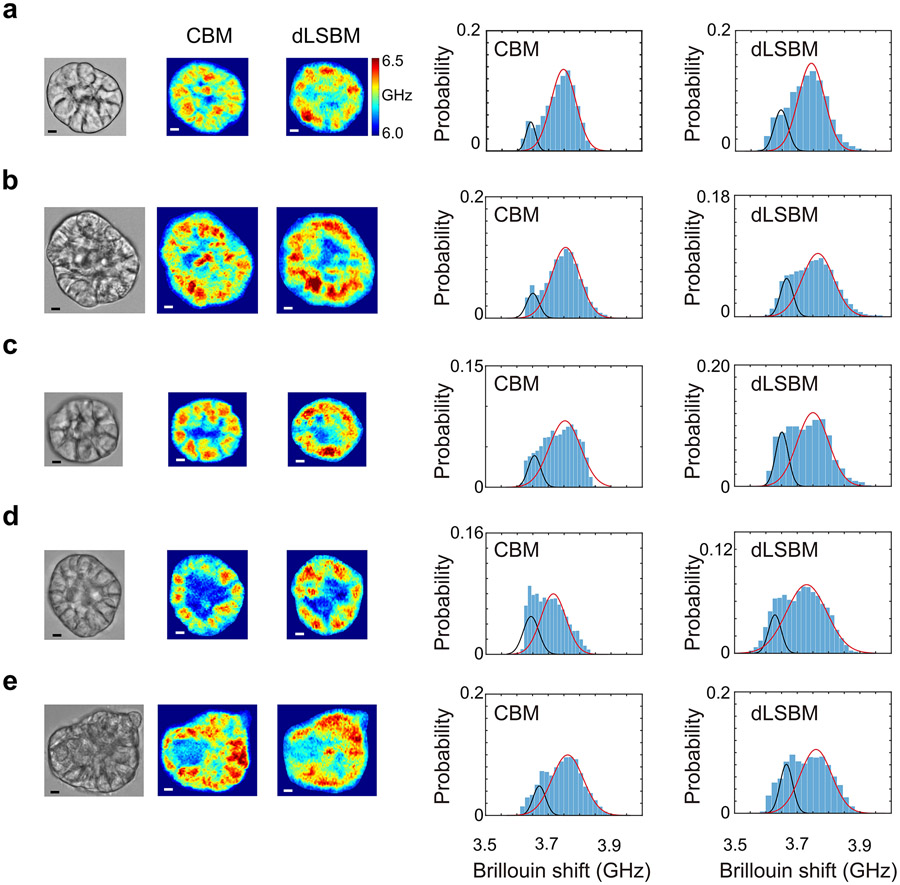
To verify that the dLSBM can capture equivalent mechanical features of the spheroid as CBM, same spheroid sample was measured by two setups (Extended Data Fig.7). Since the two setups locate in different places of the lab, the spheroid was first measured by dLSBM then transferred to CBM setup. For histogram comparison, the Brillouin shifts of all pixels for each image were plotted into a histogram. The histogram was then fitted with a linear combination of two Gaussian distributions, and the value of the fitted peak represents the average Brillouin shift of each group25.
To investigate the mechanical feature of the spheroid on subcellular level, we stained the nuclei with Hoechst 33342 (Thermo Fisher) and collected the co-registered fluorescence and Brillouin images using CBM setup. We then extracted the Brillouin shift of the nucleus region and compared it with the histogram plot based on only Brillouin shift (described above).
Cell culture
MCF10A (M1) and MCF10AT1k.cl2 (M2) cells were received from the Barbara Ann Karmanos Cancer Institute (Detroit, MI, USA). They were cultured according to the supplier protocol, and early passages were cryopreserved and thawed as needed. All cells used were passage number <15. Cells were cultured in T25 flasks at 37°C, 5% CO2, in complete medium consisting of DMEM/F12 (11330-032, Thermo Fisher Scientific), 5% horse serum (16050-122, Thermo Fisher Scientific), 5 ng/ml EGF (AF-100-15-1MG, Peprotech), 0.5 mg/ml Hydrocortisone (H0888-1G, Sigma-Aldrich), 100 ng/ml Cholera toxin (C8052-2mg, Sigma-Aldrich), 10 μg/ml insulin (I1882-100MG, Sigma-Aldrich) and 1x penicillin/streptomycin solution (15070-063, Thermo Fisher Scientific). Cells were passaged at around 80% confluency using 0.05% trypsin (25-052-Cl, Corning) for 5 min. After treatment with trypsin cells were centrifuged at 150g for 5 min, resuspended in fresh medium, and seeded in a new T25 flask. Cell medium was changed every 2-3 days.
Spheroid morphogenesis assay in 3D on-top Matrigel culture
Previously established protocols to form acinus-like spheroids of M1 and M2 cells in 3D on-top culture were followed26-27. Spheroids were cultured in 2-well glass bottom imaging slides (Ibidi, 80287). 200 μl of ice-cold Matrigel (Corning, 356231) was added to a well of an imaging slide that was previously chilled on ice. After spreading the Matrigel evenly on the bottom of the well with a pipette tip, the slide was placed in the incubator for 30 min for the layer of Matrigel to solidify. Cells were harvested with trypsin from the flask as described above. After centrifugation, the supernatant was aspirated, fresh medium was added, and cells were mixed thoroughly with a pipette to ensure single cell suspension. Next, cells were counted using a hemocytometer. 20,000 cells were carefully mixed in 500 μl of the assay medium. Assay medium is identical to the complete medium with the exception that it contains only 2% horse serum. After that, 500 μl of the cell solution was added on top of the Matrigel layer in a well of a 2-well slide. The slide was placed in the incubator for 30 min to allow the cells to settle on top of the Matrigel layer. After that, 500 μl of assay medium containing 10% Matrigel was carefully pipetted on top of the cells in the well. This yields a final concentration of 5% Matrigel in assay medium. Acinus-like spheroids will form by day 5 of growth. The medium in the well was changed every 2 days by carefully aspirating the medium and replacing it with 1 ml solution of 5% Matrigel in assay medium.
Sample preparation for Brillouin imaging
Spheroid sample was collected from the culture dish by gently dislodging the spheroids from the Matrigel in the well with a pipette tip and transferring them to an Eppendorf tube with a pipette. After 5-10 seconds centrifuging with tabletop centrifuge (VWR, Mini Centrifuge), most of the supernatant was removed, and the remaining spheroids at the bottom of the Eppendorf tube were resuspended into 100 μL 1% agarose phosphate buffer saline (PBS) solution which was previously warmed to ~37°C. The solution was carefully pipetted a few times to allow an even distribution of the spheroids. The solution was then injected into a FEP tube with an internal diameter of 1/16 inches (Cole-Parmer). After allowing 5 min for agarose gelation at room temperature, the agarose gel cylinder which contains embedded spheroids was partially pushed out from the tubing using a pipette tip. For dLSBM experiment, the tubing was mounted onto the 4D stage, and the gel cylinder was immersed into the PBS solution of the cuvette. For confocal Brillouin experiment, the tubing along with the gel cylinder was placed into a glass bottom petri dish containing PBS solution.
To perform the osmotic shock experiments, we replaced the medium in the cuvette with a hyperosmotic solution (500 mM sucrose), or hypoosmotic solution (25% PBS, 75% dH2O). We immersed the spheroids embedded in the agarose gel directly into the solution and proceeded to acquire a time series of Brillouin shift maps.
Photodamage experiment
On day 0, cells were seeded in 2-well slides with 500 μm grid on the bottom (Ibidi) as described above. On day 2, the spheroids in the well (without dislodging them) were placed on the microscope stage, and individual spheroids and their locations on the annotated 500 μm grid were recorded. We illuminated the spheroids with 780 nm light, 370 mW, for 5 minutes (considering the typical illumination time is about 3 minutes for 3D mapping), using the same objective which was used to create the illumination beam in the Brillouin line scan experiments (4×/0.1 NA, Olympus).
To estimate cell viability at the end of the experiment, all spheroids in the well were stained with 2 μM calcein AM, and 5 μM Ethidium Homodimer-1 (Live/Dead Viability/Cytotoxicity kit, ThermoFisher Scientific) in PBS for 45 min. Sample was then washed with PBS and imaged using the confocal microscope (Olympus FV3000) with a 10×/0.4 NA objective (UPLSAPO10X2, Olympus). Calcein AM fluorescence was observed in the green channel (488 nm excitation, 500-540 nm emission), and Ethidium Homodimer was observed in the red channel (514 nm excitation, 590-690 nm emission). Negative control was used to calibrate the fluorescence intensity of red channel. To prepare the sample of dead spheroid, we removed the medium and added −20° C methanol for 15 min. The sample was then stained and imaged in the same way as described above. We collected z-stacks (1.4 μm pixel size in x-y plane, 3.9 μm step in z direction) for each sample. Maximum intensity projection image of each spheroid was outlined in the green channel and average fluorescence intensity of the outlined region was calculated for both green and red channels with image processing software Fiji.
To estimate the rate of spheroid growth, we tracked spheroids based on their location on the 500 μm annotated grid. We recorded 10×/0.1 NA brightfield images of the illuminated and control spheroids on each day until day 5. Projected area of the spheroid was manually selected in Fiji. The area versus day data was fitted using an exponential growth model A = A0ekt (Prism 8, GraphPad) where A is the spheroid projected area, A0 is the initial area, k is the growth rate and t is time in days. The doubling time was calculated as ln(2)/k. Difference between doubling times of illuminated and control spheroids was tested using unpaired, two-tailed, t-test with Welch’s correction. (Prism 8, GraphPad).
Cell and spheroid stiffness measurement using AFM
Cell and spheroid stiffness was measured using the NanoWizard 4a AFM (JPK Instruments). AFM cantilever with 5 μm diameter round tip was used for indentation (CP-qp-CONT-Au-B, Nano and More). The spring constant of the cantilevers was calibrated using the thermal noise method while they were immersed in the cell medium in the dish. For single cell measurement, cells suspended in 2 ml of assay medium were added to the glass bottom dish (FluoroDish, World Precision Instruments) and allowed 2 minutes to settle on the glass bottom. Tip was centered on the cell body and each cell was indented with the maximum force setpoint of 5 nN and with approaching speed of 2μm/s across the height range of 5 μm. The measurement was repeated 9 times in the same location and each indentation curve was recorded. For spheroid measurements on day 5 of growth, the spheroids were physically detached from the Matrigel bottom layer in the well with a pipette tip and transferred to an Eppendorf tube. They were centrifuged for 5-10 seconds using the tabletop centrifuge, and supernatant which may contain chunks of Matrigel was removed. Spheroids were then carefully resuspended in 2 ml of assay medium and added to a glass bottom dish. After they were allowed 2 minutes to settle, AFM tip was centered on each spheroid and indented 9 times in the same location with the maximum force setpoint of 25 nN, with approaching speed of 2 μm/s across the height range of 15 μm. The height of spheroids was measured by approaching the AFM tip to the top of the spheroid using a 1 nN setpoint and recording the tip height. For each spheroid, we also recorded the tip height after approaching the glass bottom near the same spheroid. The AFM indentation curves were analyzed using the JPK data processing software. Indentation curves were fitted using the Hertz/Sneddon model on the 75% of the curve, assuming the Poisson ratio of 0.5 and a spherical indenter with a diameter of 5 μm. For each cell or spheroid, Young’s moduli from all 9 indentation measurements were averaged. At least 5 cells or spheroids were measured in each condition, and each experiment was repeated 3 times. Statistical differences were tested using unpaired, two-tailed, t-test with Welch’s correction. (Prism 8, GraphPad).
Further information on research design is available in the Nature Portfolio Reporting Summary linked to this article.
Extended Data
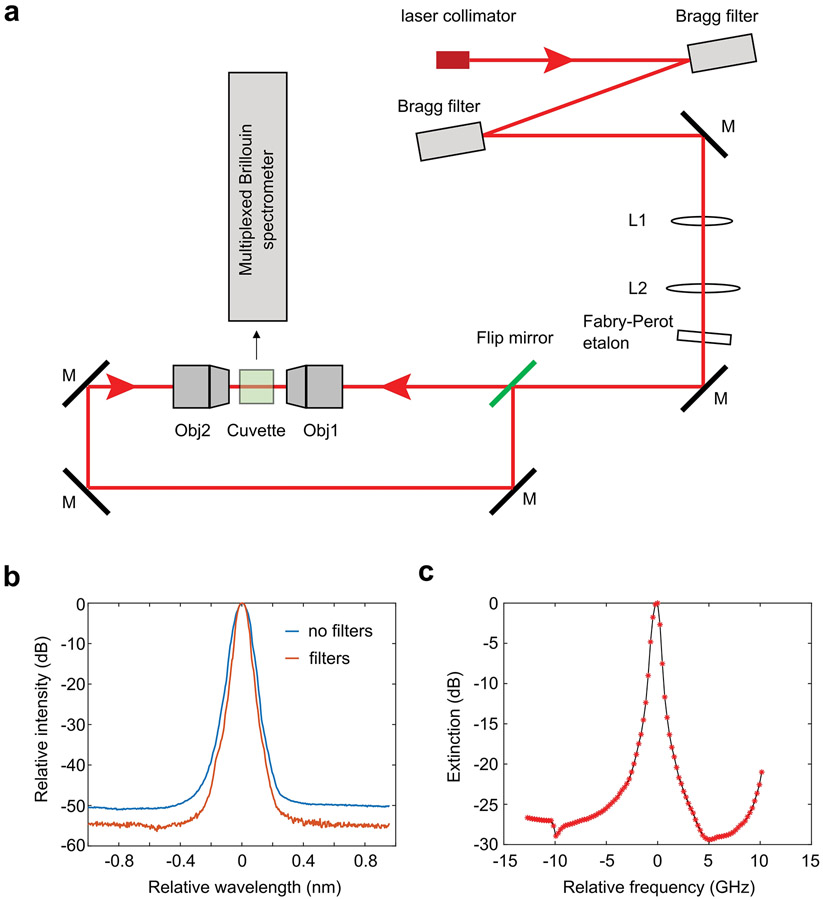
Extended Data Fig.1.
Detailed schematic of the illumination beam. a, M, mirror; L1-L2, spherical lens with focal length of 20 mm and 80 mm, respectively; Obj1-Obj2, objective lenses (4x/0.1NA). b, The noise floor of the laser light is reduced by about 5 dB after passing through two Bragg filters. c, Extinction spectrum of the Fabry-Perot etalon used in the setup. For frequency component that is about 3.6 GHz (Brillouin shift of water) away from the laser frequency, the etalon can provide about 26 dB suppression. The value of zero in b and c represents the wavelength and frequency of the laser light, respectively.
Extended Data Fig.2.
Dual-line illumination. Brillouin image sections (left panels) and the averaged profile (right panels) along illumination direction of left-line illumination (a), right-line illumination (b), and combined dual-line illumination (c). The red arrow indicates the illumination direction of the beam line. Scale bar, 10 μm. The color bar represents the Brillouin shift with the unit of GHz. The center and error band represents the mean value +/− SD.
Extended Data Fig.3.
Brillouin shift gradient caused by the mismatch of refractive index. a, Brillouin image of a PDMS sphere immersed in 1% agarose gel. Arrow indicates the propagation of illumination beam. Black dished line indicates the location of interest for b. Scale bar is 10 μm. b, Shift profile across the PDMS sphere shows the gradient along illumination direction. c, Theoretical calculation model. ‘A’ represent an arbitrary point on the illumination axis, θ is the actual scattering angle collected by the spectrometer at 90° geometry, and α is the azimuthal angle of the sphere. d, The shift gradients of the calculation and the experiment agree with each other.
Extended Data Fig.4.
Characterization of Brillouin spectrometer. a, Exemplary raw Brillouin spectrum of DI water acquired by the spectrometer of the dLSBM setup with single-line illumination. b, Brillouin shift is extracted by fitting the spectrum of a single pixel with a Lorentzian function. Peaks represent the Stokes and anti-Stokes components of the Brillouin frequency. c, Representative histogram distribution of the estimated Brillouin shift of the same point after repeated acquisition (n=300). The solid line is fitting result by Gaussian profile. The standard deviation of the estimated Brillouin shift is 8 MHz. d, Spectral precision of all points on illumination axis. The average is 9.8 MHz. e, Signal-to-noise (SNR) ratio against light energy of dLSBM spectrometer for water sample. The fitted line with a slope of ~ 0.5 under log-log scale indicates the spectrometer is operating under shot-noise limited condition. f, The spectral resolution is measured to be 0.25 GHz. Circles are measured data, and solid line is Lorentzian fit. g, Spectral precision against light energy of the dLSBM spectrometer in water and spheroid sample, suggesting the spectrometer is shot noise limited in both conditions. h, Comparison of dLSBM and confocal Brillouin microscopy (CBM) regarding the spectral precision against total light dose for 3D mapping of 100×200×10 pixels. water is used as sample. The data point of CBM is adapted from reference [28], and the dash line indicates the shot noise limited operation.
Extended Data Fig.5.
Brillouin image reconstruction of the 3D mapping of a spheroid
Extended Data Fig.6.
Characterization of the spatial resolution of the dLSBM setup. a, Brillouin measurement across the interface of PDMS and water. b, Measurement of Rayleigh scattering from a 0.5 μm bead.
Extended Data Fig.7.
Comparison of dLSBM and CBM. a-e, five independent spheroids measured by dLSBM (NA=0.3) and CBM (NA=0.4). Scale bar is 5 μm. For each spheroid, the Brillouin shifts of all pixels from the image was plotted into a histogram. The histogram was then fitted by a combination of two Gaussian distributions.
Extended Data Fig.8.
Analysis of subcellular mechanical information of spheroids. a-d, Co-registered fluorescence and Brillouin images of four representative spheroids. Each sub figure shows the bright field image, fluorescence image of the nuclei, and the Brillouin image acquired by the CBM, respectively. Red line in the image outlines the profile of the spheroid. The plots of ‘H-peak 2’ is the right peak extracted from the curve fitting of the Brillouin shift histogram. The plots of ‘fluor. nucleus’ represents Brillouin shift of the nucleus region. e, Results of all the spheroid samples (n=14). The perfect overlap of the ‘H-peak 2’ and ‘fluor. nucleus’ confirms the dLSBM can acquire the mechanical information of the nucleus based on the histogram plot of Fig. 1e. n.s.: not statistically significant. Statistical significance is determined by performing two-sided two-sample t-test, and no adjustment was made. In all boxplots, the central mark indicates the median, and the bottom and top edges indicate the 25th and 75th percentiles, respectively. The whiskers extend to the most extreme data points not considered outliers.
Extended Data Fig.9.
Effect of light illumination on the viability and growth rate of the spheroids. a, Fluorescent images of the spheroids in control and illuminated groups. Live cells fluoresce in green (Calcein-AM) and dead cells fluoresce in red (EthD-1). b, Growth rate of the spheroids is not affected by laser illumination. The upper panel is the representative time-lapse image of a spheroid that is illuminated on Day 2. The points in the lower panel represent the area of spheroids over time. Black curves are best fit for exponential growth. Control group (n=10), Illuminated group (n=7).
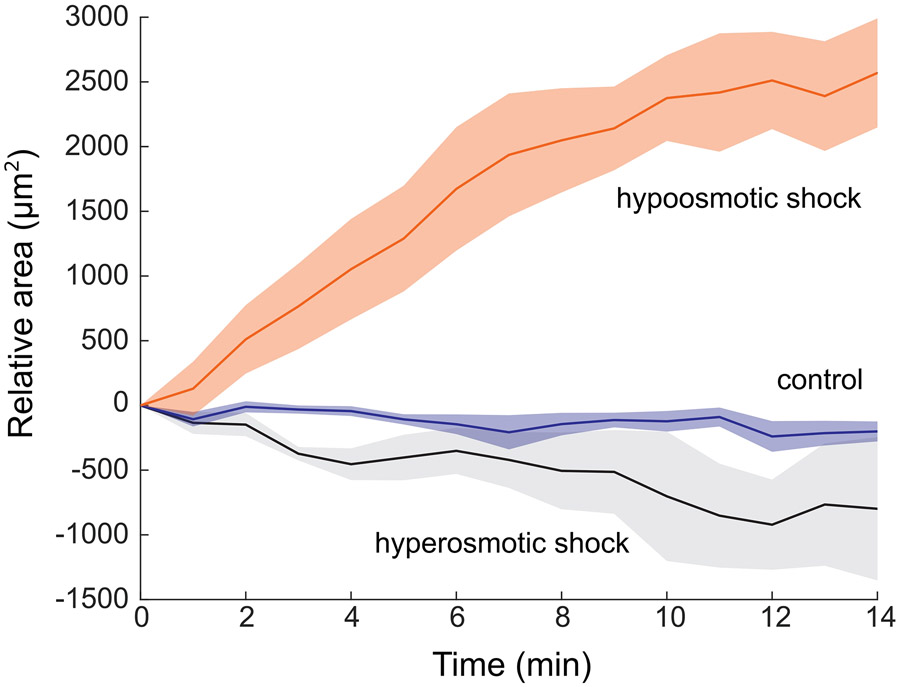
Extended Data Fig.10.
Temporal change of the projection area of the spheroids under osmotic shock. Hyperosmotic shock (n=5), no shock (n=6), and hypoosmotic shock (n=5). Error bound indicates ± s.e.m.
Supplementary Material
Acknowledgments
We thank Dr. Giulia Zanini for help with photodamage experiment and Dr.Jiangsheng Xu and Dr. Shawn He for preparing PDMS sphere. This work was supported by National Science Foundation (DBI-1942003, CMMI-1929412) to G.S., the National Institutes of Health (R21CA258008 to G.S., R01EY028666 to G.S., R01HD095520 to G.S., K25HD097288 to J.Z.), the Intramural Research Program of the National Cancer Institute to K.T., the American Cancer Society Institutional Research Grant (1816016) to J.Z., and Wayne State University Research Grant to J.Z..
Footnotes
Competing interests
J.Z., M.N and G.S. are inventors of patents related to the Brillouin technology. G.S. is a consultant for Intelon Optics. The other authors declare no competing interests.
Data availability
The authors declare that all data supporting the findings of this study are available within the paper and its Supplementary note files. Source Data are provided with this paper.
Code availability
The MATLAB codes for spectrum analysis and image fusion are provided as Supplementary software under MIT license.
References
- 1.Wang N, Tytell JD & Ingber DE Mechanotransduction at a distance: mechanically coupling the extracellular matrix with the nucleus. Nature reviews Molecular cell biology 10, 75–82 (2009). [DOI] [PubMed] [Google Scholar]
- 2.Miller CJ & Davidson LA The interplay between cell signalling and mechanics in developmental processes. Nature Reviews Genetics 14, 733–744 (2013). [DOI] [PMC free article] [PubMed] [Google Scholar]
- 3.Bao G & Suresh S Cell and molecular mechanics of biological materials. Nature materials 2, 715–725 (2003). [DOI] [PubMed] [Google Scholar]
- 4.Kennedy BF, Wijesinghe P & Sampson DD The emergence of optical elastography in biomedicine. Nature Photonics 11, 215–221 (2017). [Google Scholar]
- 5.Scarcelli G. et al. Noncontact three-dimensional mapping of intracellular hydromechanical properties by Brillouin microscopy. Nature methods 12, 1132–1134 (2015). [DOI] [PMC free article] [PubMed] [Google Scholar]
- 6.Prevedel R, Diz-Muñoz A, Ruocco G & Antonacci G Brillouin microscopy: an emerging tool for mechanobiology. Nature methods 16, 969–977 (2019). [DOI] [PubMed] [Google Scholar]
- 7.Zhang J & Scarcelli G Mapping mechanical properties of biological materials via an add-on Brillouin module to confocal microscopes. Nature protocols 16, 1251–1275 (2021). [DOI] [PMC free article] [PubMed] [Google Scholar]
- 8.Gouveia RM et al. Assessment of corneal substrate biomechanics and its effect on epithelial stem cell maintenance and differentiation. Nature communications 10, 1496 (2019). [DOI] [PMC free article] [PubMed] [Google Scholar]
- 9.Margueritat J. et al. High-frequency mechanical properties of tumors measured by Brillouin light scattering. Physical review letters 122, 018101 (2019). [DOI] [PubMed] [Google Scholar]
- 10.Wisniewski EO et al. Dorsoventral polarity directs cell responses to migration track geometries. Science advances 6, eaba6505 (2020). [DOI] [PMC free article] [PubMed] [Google Scholar]
- 11.Dil JG Brillouin scattering in condensed matter. Reports on Progress in Physics 45, 285–334 (1982). [Google Scholar]
- 12.Antonacci G. et al. Recent progress and current opinions in Brillouin microscopy for life science applications. Biophysical Reviews 12, 615–624 (2020). [DOI] [PMC free article] [PubMed] [Google Scholar]
- 13.Remer I, Shaashoua R, Shemesh N, Ben-Zvi A & Bilenca A High-sensitivity and high-specificity biomechanical imaging by stimulated Brillouin scattering microscopy. Nature Methods 17, 913–916 (2020). [DOI] [PubMed] [Google Scholar]
- 14.Huisken J, Swoger J, Del Bene F, Wittbrodt J & Stelzer EH Optical sectioning deep inside live embryos by selective plane illumination microscopy. Science 305, 1007–1009 (2004). [DOI] [PubMed] [Google Scholar]
- 15.Zhang J, Fiore A, Yun S-H, Kim H & Scarcelli G Line-scanning Brillouin microscopy for rapid non-invasive mechanical imaging. Scientific reports 6, 35398 (2016). [DOI] [PMC free article] [PubMed] [Google Scholar]
- 16.Tanner K & Gottesman MM Beyond 3D culture models of cancer. Sci Transl Med 7, 283ps289 (2015). [DOI] [PMC free article] [PubMed] [Google Scholar]
- 17.Han YL et al. Cell swelling, softening and invasion in a three-dimensional breast cancer model. Nature physics 16, 101–108 (2020). [DOI] [PMC free article] [PubMed] [Google Scholar]
- 18.Zhou E. et al. Universal behavior of the osmotically compressed cell and its analogy to the colloidal glass transition. Proceedings of the National Academy of Sciences 106, 10632–10637 (2009). [DOI] [PMC free article] [PubMed] [Google Scholar]
- 19.Scarcelli G & Yun SH Reply to ‘Water content, not stiffness, dominates Brillouin spectroscopy measurements in hydrated materials’. Nature methods 15, 562 (2018). [DOI] [PubMed] [Google Scholar]
- 20.Taubenberger AV et al. 3D microenvironment stiffness regulates tumor spheroid growth and mechanics via p21 and ROCK. Advanced Biosystems 3, 1900128 (2019). [DOI] [PubMed] [Google Scholar]
- 21.Cross SE, Jin Y-S, Rao J & Gimzewski JK Nanomechanical analysis of cells from cancer patients. Nature nanotechnology 2, 780 (2007). [DOI] [PubMed] [Google Scholar]
- 22.Mahajan V. et al. Mapping tumor spheroid mechanics in dependence of 3D microenvironment stiffness and degradability by Brillouin microscopy. Cancers 13, 5549 (2021). [DOI] [PMC free article] [PubMed] [Google Scholar]
Methods-only references
- 23.Huisken J. et al. Optical sectioning deep inside live embryos by selective plane illumination microscopy. Science 305, 1007–1009 (2004). [DOI] [PubMed] [Google Scholar]
- 24.Schlüßler R. et al. Correlative all-optical quantification of mass density and mechanics of subcellular compartments with fluorescence specificity eLife 11, e68490 (2022). [DOI] [PMC free article] [PubMed] [Google Scholar]
- 25.Zhang J, Nou X, Kim H & Scarcelli G Brillouin flow cytometry for label-free mechanical phenotyping of the nucleus. Lab on a chip 17, 663–670 (2017). [DOI] [PMC free article] [PubMed] [Google Scholar]
- 26.Lee GY, Kenny PA, Lee EH & Bissell MJ Three-dimensional culture models of normal and malignant breast epithelial cells. Nature Methods 4, 359–365, doi: 10.1038/nmeth1015 (2007). [DOI] [PMC free article] [PubMed] [Google Scholar]
- 27.Debnath J, Muthuswamy SK & Brugge JS Morphogenesis and oncogenesis of MCF10A mammary epithelial acini grown in three-dimensional basement membrane cultures. Methods 30, 256–268, doi: 10.1016/S1046-2023(03)00032-X (2003). [DOI] [PubMed] [Google Scholar]
- 28.Schlüßler R. et al. Mechanical mapping of spinal cord growth and repair in living zebrafish larvae by brillouin imaging. Biophysical journal 115, 911–923 (2018). [DOI] [PMC free article] [PubMed] [Google Scholar]
Associated Data
This section collects any data citations, data availability statements, or supplementary materials included in this article.
Supplementary Materials
Data Availability Statement
The authors declare that all data supporting the findings of this study are available within the paper and its Supplementary note files. Source Data are provided with this paper.
The MATLAB codes for spectrum analysis and image fusion are provided as Supplementary software under MIT license.


