

Abstract
BACKGROUND & AIMS:
Most patients in the immunotolerant (IT) phase of chronic hepatitis B (CHB) transition to the immune active (IA-hepatitis B surface antigen [HBeAg]+) phase by early adulthood. We examined characteristics of adults in the IT vs IA-HBeAg+ phase and rate of transition from IT to other phases of CHB, with a focus on those ≥40 years.
METHODS:
Demographic, clinical, and virologic characteristics of participants in the Hepatitis B Research Network adult cohort study with IT CHB (alanine aminotransferase ≤1.5 × upper limit of normal, hepatitis B virus DNA >107 IU/mL) were compared by age category, and to those with IA-HBeAg+ CHB in cross-sectional analysis. This study received institutional review board approval at all participating centers.
RESULTS:
Of 107 adult IT participants, 52 (48%) were <30, 33 (31%) were 30 to 39, and 22 (21%) were ≥40 years old (maximum, 71 years). Among IT groups, the proportion born in Asia and duration of CHB were greater in older IT groups, but virologic and liver disease characteristics were similar. Compared with IA-HBeAg+ participants (n = 192), IT participants were younger, fewer were men, more were Asian, and platelets, qHBsAg, and qHBeAg levels were higher. Similar differences were observed when comparisons were made with the ≥40 years IT group. Among IT participants, 60 (56%) transitioned during 206 person-years of follow-up. The phase transition rate per 100 person-years was highest in the <30 years group (33.0 [95% confidence interval [CI], 23.4–46.7]) vs the 30 to 39 years group (24.8 [95% CI, 15.6–39.4]) and ≥40 group (27.4 [95% CI, 14.8–50.9]), but 95% CIs overlapped.
CONCLUSIONS:
In a large North American population, over 50% of adults in the IT phase of CHB were ≥30 years and 20% were ≥40 years old, but older IT patients had similar characteristics and rates of transition as younger IT patients.
Keywords: Chronic HBV Infection, Immune Active, Immunotolerant (IT), Phase Transition
Chronic hepatitis B (CHB) is a dynamic condition that transitions through phases of disease activity. The first phase of CHB, often referred to as the immunotolerant (IT) phase or chronic hepatitis B infection, is characterized by hepatitis B e antigen (HBeAg)-positivity and high hepatitis B virus (HBV) DNA levels, but normal or near-normal transaminase levels and minimal or no inflammatory activity or fibrosis on liver biopsy.1 The IT phase is typically observed in children and young adults who acquired the infection early in life. Although the duration of the IT phase is highly variable, most patients transition to the HBeAg-positive (HBeAg+) immune active (IA-HBeAg+) phase characterized by elevated alanine aminotransferase (ALT) and liver inflammation by late adolescence or early adulthood. However, some patients remain in the IT phase until much later in life.
Current international guidelines generally do not recommend treating patients in the IT phase due to the lack of effective therapy and the relatively benign short-term course of disease. However, the associations of HBeAg-positivity, high levels of HBV DNA, and older age with a higher risk of hepatocellular carcinoma (HCC)2,3 have led to recommendations to consider treating older IT patients, despite lack of clear evidence that treatment during the IT phase alters the risk of HCC and other outcomes. Specifically, the American Association for the Study of Liver Disease (AASLD),4 European Association for the Study of the Liver (EASL),5 and Asian Pacific Association for the Study of the Liver (APASL)6 clinical practice guidelines recommend consideration of treatment for IT patients above 30 (EASL)5, 35 (APASL)6 or 40 (AASLD)4 years, respectively.
Characterization of older individuals in the IT phase may improve understanding of the natural history of infection and guide management. We sought to characterize adults in the IT phase with cross-sectional comparisons across age groups, as well as between adults in the IT and IA-HBeAg+ phases. We hypothesized that older individuals in the IT phase would be distinct from younger IT patients, possibly more closely resembling those in the IA phase, with lower HBV DNA levels and low-grade chronic inflammation.7 Using longitudinal data, we also characterized transitions from the IT phase and identified factors associated with these transitions.
Methods
Participants
The Hepatitis B Research Network (HBRN) is a National Institutes of Health-funded clinical research network with 21 adult clinical sites throughout the United States and in Toronto, Canada, that enrolled hepatitis B surface antigen (HBsAg)-positive adult (≥18 years old) patients without human immunodeficiency virus infection who were not currently on antiviral therapy into a prospective cohort study between 2012 and 2017.8 Participants underwent initial evaluation and then returned for follow-up assessments at weeks 12 and 24, and then every 24 weeks. Treatment decisions were made at the discretion of the primary treating physicans, with participants remaining in the cohort during standard-of-care treatment. Participants enrolled in HBRN clinical trials were censored at the time of study entry. The study protocols were approved by the institutional review boards of participating institutions and participants provided written, informed consent.
Participants with acute HBV or with hepatitis C virus or hepatitis D virus coinfection were excluded. Participants meeting the criteria for IT or IA-HBeAg+ CHB (described below) were included.
To be included in the IT cohort, a participant had to have at least one IT period, defined as 2 or more consecutive assessments (>12 weeks apart) in which the IT phase definition (described below) was met, with allowance for a single missed study assessment or use of HBV therapy between IT determinations (eg, IT phase definition met at week 24 and 72 but week 48 assessment missed). The rationale for requiring 2 or more consecutive assessments was to ensure the cohort included participants who were truly in the IT phase and not in the IA-HBeAg+ phase with fluctuating ALT. Among HBeAg+ participants who never met the IT period definition throughout follow-up, those who had an IA-HBeAg+ period, defined as either 2 or more consecutive assessments in which the IA phase definition (described below) was met, with allowance for a single missed assessment between IA determinations, or a single assessment in which the IA phase definition was met followed by initiation of HBV therapy, were included in the IA-HBeAg+ cohort. The first assessment in either the first IT or IA period was used for cross-sectional analysis, and among the IT cohort designated as the baseline for longituidanl analysis.
CHB Phase Definitions
At every assessment, CHB phase was determined among HBsAg+ participants not on HBV therapy. The IT CHB phase required HBeAg-positivity, with HBV DNA ≥107 IU/mL and ALT ≤1.5 × upper limit of normal (ULN), standardized as 30 U/L for men and 20 U/L for women. The IA-HBeAg+ CHB phase required HBeAg-positivity, HBV DNA ≥105 IU/mL and ALT >1.5 × ULN. Those who were HBeAg+ without meeting either the IT or IA definition were categorized as being in an indeterminant HBeAg+ phase. IA-HBeAg-negative was defined by HBeAg negativity, HBV DNA >104 IU/mL and ALT >1.5 × ULN; inactive carrier by HBeAg-negativity, HBV DNA ≤104 IU/mL and ALT ≥1.5 × ULN; and Indeterminant HBeAg-negative if neither IA nor inactive carrier criteria were met.
Measures
Demographic (sex, age, self-reported race, continent of birth, presumed mode of HBV transmission, estimated duration of infection), clinical (body mass index, liver enzymes, platelets, aspartate aminotransferase [AST] to platelet ratio index [APRI], history of cirrhosis, HBV therapy) and virologic (HBsAg, HBeAg, and HBV DNA levels, HBV genotype, presence of precure [PC]/basal core promoter [BCP] mutations) characteristics were recorded. Age was categorized as 18 to 29, 30 to <40, and ≥40 years and APRI as <0.5, 0.5 to 1.5, and >1.5.9
Quantitative HBeAg and HBsAg (Roche Elecsys) assays were performed at the HBRN central virology laboratory at the University of Washington, with lower limits of detection of 0.3 IU/mL for HBeAg and 0.05 IU/mL for HBsAg. HBV DNA testing was performed centrally by real-time polymerase chain reaction (COBAS Ampliprep/COBAS TaqMan Test, v.2.0; Roche Molecular Diagnostics, Branchburg, NJ) with a lower limit of quantification of 20 IU/mL and a lower limit of detection of 10 IU/mL.
HBV genotyping and PC and BCP determination were performed at the Molecular Epidemiology and Bioinformatics Laboratory in the Division of Viral Hepatitis at the Centers for Disease Control and Prevention using mass spectrometry as previously described.10,11
Statistical Analysis
Cross sectional.
Among the IT cohort, trends across age groups (18–29, 30–<40, and ≥40 years) in demographic, clinical and virologic, characteristics were evaluated with the Johnkeere-Terpstra trend test for continuous variables, the Cochran-Armitage trend test for binary variables and Kendall’s Tau b for ordinal variables. The χ2 or Fisher’s exact test was used to test for differences in categorical variables with ≥3 categories. The same characteristics of the IT cohort, and the subgroup ≥40 years, were compared with the IA-HBeAg+ cohort, with the Wilcoxon Rank Sum test for continuous variables, the χ2 or Fisher exact test for categorical variables and Cochran-Armitage trend test for ordinal variables.
Longitudinal.
Among the IT cohort, heat maps, overall and stratified by age group, were created to show patterns of CHB phase stability and transitions, and HBV therapy use over time from study entry through the end of follow-up.
Phase transition rate from IT was estimated by dividing the number of participants with a phase transition by the number of person-years of observation. Follow-up was censored the day after (1) first non-IT phase determination, (2) HBV therapy initiation as part of clinical care (excluding short-term therapy use within an IT period), (3) clinical trial enrollment, or (4) IT phase determination followed by 60 or more weeks without a study assessment, whichever came first. Phase transition rate was calculated overall, by sex, age group, continent of birth, genotype (B vs C), and BCP mutation. Cox proportional hazards models were used to report unadjusted hazard ratios (HRs) and 95% confidence intervals (CIs) of phase transition by these factors plus baseline ALT (×ULN), qHBsAg (log10IU/mL), qHBeAg (log10IU/mL), and HBV DNA (log10IU/mL). A single multivariable model was built considering all variables with P < .20; variables in the model with P > .10 were removed using backward elimination. Analyses were conducted using SAS, version 9.4 (SAS Institute Inc, Cary NC, 2000).
Results
Participant flow is shown in Figure 1. Among the IT cohort (n = 107), 52 (48%) were under 30 years, 33 (31%) were 30 to 39 years, and 22 (21%) were 40 years and older (range, 40 to 71 years). Characteristics of the IT cohort by age group are reported in Table 1. A higher percentage of older vs younger IT participants were born in Asia (69% under 30, 93% in 30–39, and 86% in >40 years of age; P = .03) and had genotype C (42%, 56%, and 62%, respectively; P = .052). Older IT participants had a longer estimated duration of infection (median: 23, 34, and 47 years, respectively; P < .001), likely due to older age, as the proportion with presumed vertical transmission was similar across age groups. Laboratory parameters were similar across IT age groups, however older vs younger IT participants had lower median albumin (median, 4.4, 4.3, and 4.2 g/dL, respectively; P = .02), and there appeared to be a trend toward lower platelets (median, 235, 221, and 215 × 103/mm3; P = .11) in older vs younger IT participants. There were no significant trends in viral characteristics (qHBsAg, qHBeAg, HBV DNA, genotype, and PC/BCP mutations) across IT age groups.
Figure 1.
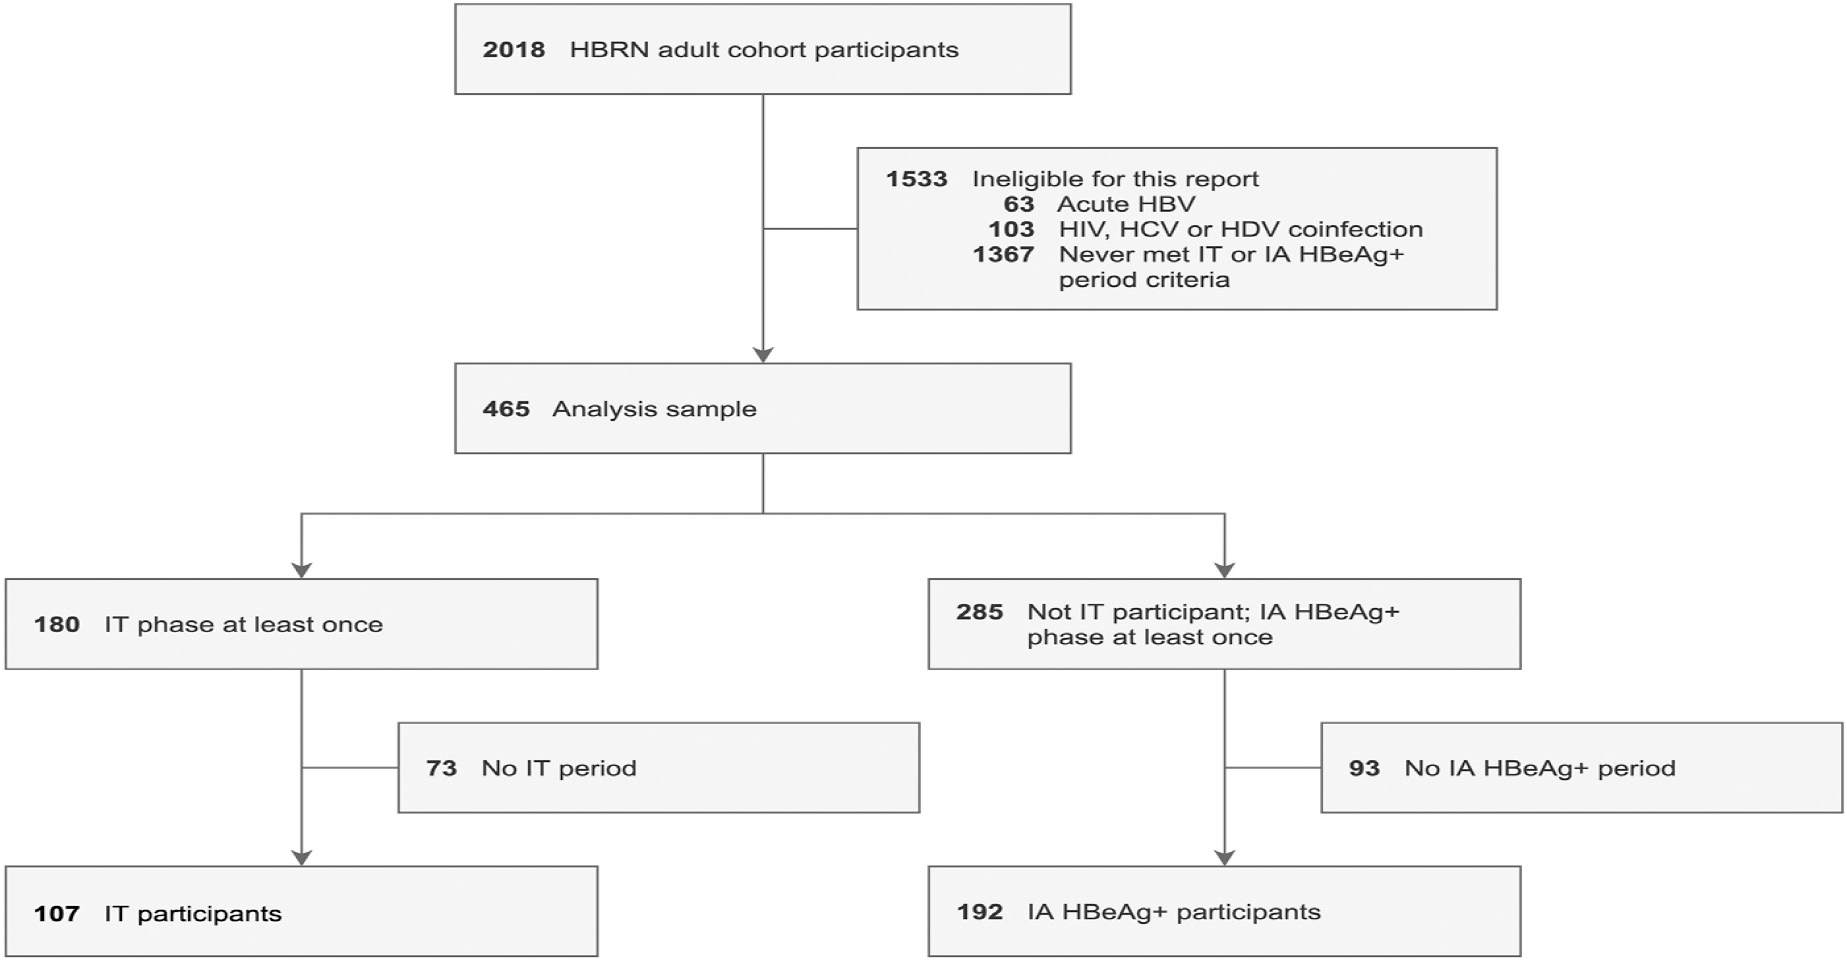
Patient flow. Participant flow from HBRN adult cohort study entry to inclusion in the IT analysis (N = 299). HDV, Hepatitis D virus; HIV, human immunodeficiency virus
Table 1.
Characteristics of Adults With CHB in the IT Phase, by Age Group, and Overall, vs Adults in the HBeAg+ IA Phase
| Variable | <30 (n = 52), n (%) | IT by age, y 30 to <40 (n = 33), n (%) | ≥40 (n = 22), n (%) | P age trend | IT (n = 107), n (%) | IA (n = 192), n (%) | P IT vs IA | P ≥40 IT vs IA |
|---|---|---|---|---|---|---|---|---|
|
| ||||||||
| Sex | .45 | .04 | .96 | |||||
| Male | 19 (36.5) | 11 (33.3) | 11 (50.0) | 41 (38.3) | 97 (50.5) | |||
| Female | 33 (63.5) | 22 (66.7) | 11 (50.0) | 66 (61.7) | 95 (49.5) | |||
| Race | n = 51 | .57 | n = 106 | n = 191 | < .001 | .20 | ||
| Asian | 49 (96.1) | 32 (97.0) | 20 (90.9) | 101 (95.3) | 152 (79.6) | |||
| Non-Asian | 2 (3.9) | 1 (3.0) | 2 (9.1) | 5 (4.7) | 39 (20.4) | |||
| Continent of birth | .03 | n = 186 | .27 | .23 | ||||
| Asia | 36 (69.2) | 31 (93.9) | 19 (86.4) | 86 (80.4) | 139 (74.7) | |||
| Other | 16 (30.8) | 2 (6.1) | 3 (13.6) | 21 (19.6) | 47 (25.3) | |||
| BMI, kg/m2 | n = 49 | n = 28 | n = 19 | .31 | n = 97 | n = 174 | .07 | .98 |
| Median (IQR) | 23.1 (19.9–24.9) | 22.2 (20.6–25.6) | 23.6 (22.3–25.9) | 23.3 (20.2–25.7) | 23.8 (21.1–26.8) | |||
| Presumed mode of transmission | n = 48 | n = 25 | n = 16 | .26 | n = 89 | n = 141 | .26 | .65 |
| Vertical | 40 (83.3) | 16 (64.0) | 12 (75.0) | 68 (76.4) | 98 (69.5) | |||
| Horizontal | 8 (16.7) | 9 (36.0) | 4 (25.0) | 21 (23.6) | 43 (30.5) | |||
| Estimated duration of infection | n = 47 | n = 27 | n = 15 | < .001 | n = 89 | n = 140 | .39 | < .001 |
| Median (IQR) | 23.0 (20.0–25.9) | 34.1 (30.0–37.0) | 47.0 (41.8–52.0) | 26.0 (22.0–36.9) | 29.0 (22.0–39.0) | |||
| Estimated duration of infection among those with horizontal transmission | n = 6 | n = 7 | n = 2 | .08 | n = 15 | n = 28 | .18 | .51 |
| Median (IQR) | 19.0 (16.0–22.7) | 31.0 (21.5–37.0) | 30.0 (12.0–48.0) | 22.7 (16.0–34.0) | 18.0 (10.0–30.8) | |||
| ALT × ULN | .95 | < .001 | < .001 | |||||
| Median (IQR) | 1.1 (0.8–1.3) | 1.1 (0.8–1.3) | 1.1 (0.9–1.3) | 1.1 (0.8–1.3) | 3.1 (2.1–4.8) | |||
| ALT, U/L | .67 | < .001 | < .001 | |||||
| Median (IQR) | 24 (18–30) | 24 (19–29) | 24 (19–37) | 24 (19–30) | 76.5 (52–118.5) | |||
| AST, U/L | .63 | n = 188 | < .001 | < .001 | ||||
| Median (IQR) | 23 (19.5–25) | 22 (21 –24) | 23 (20–29) | 22 (20–26) | 48 (36–70.5) | |||
| Alkaline phosphatase, U/L | n = 51 | n = 30 | n = 20 | .34 | n = 101 | n = 182 | < .001 | .32 |
| Median (IQR) | 67 (59–79) | 61.5 (53–67) | 72 (50–92.5) | 64 (55–77) | 73.5 (60–91) | |||
| Total bilirubin, mg/dL | n = 32 | .38 | n = 106 | n = 188 | .90 | .15 | ||
| Median (IQR) | 0.6 (0.4–1.0) | 0.6 (0.4–0.9) | 0.7 (0.6–0.9) | 0.6 (0.4–0.9) | 0.6 (0.5–0.8) | |||
| Albumin, g/dL | n = 32 | n = 20 | .02 | n = 104 | n = 182 | .02 | .34 | |
| Median (IQR) | 4.4 (4.2–4.6) | 4.3 (4.2–4.5) | 4.2 (3.9–4.3) | 4.3 (4.1–4.5) | 4.2 (3.9–4.4) | |||
| Platelets, × 103/mm3 | n = 48 | n = 30 | n = 15 | .11 | n = 93 | n = 167 | .002 | .46 |
| Median (IQR) | 235 (205–266) | 221 (172–252) | 215 (171–266) | 228 (195–266) | 202 (167–243) | |||
| APRI | n=48 | n=30 | n=15 | 0.27 | n=93 | n=165 | <.001 | <.001 |
| <0.5 | 46 (95.8) | 28 (93.3) | 13 (86.7) | 87 (93.5) | 55 (33.3) | |||
| 0.5–1.5 | 1 (2.1) | 2 (6.7) | 2 (13.3) | 5 (5.4) | 83 (50.3) | |||
| >1.5 | 1 (2.1) | 0 (0.0) | 0 (0.0) | 1 (1.1) | 27 (16.4) | |||
| HBsAg (log10 IU/mL) | n = 47 | n = 24 | n = 15 | .34 | n = 87 | n = 163 | < .001 | .02 |
| Median (IQR) | 4.7 (4.5–4.9) | 4.7 (4.4–5.0) | 4.8 (4.6–5.0) | 4.8 (4.5–4.9) | 4.3 (3.7–4.7) | |||
| HBeAg, log10 IU/mL | n = 51 | n = 31 | .43 | n = 104 | n = 176 | < .001 | < .001 | |
| Median (IQR) | 3.3 (3.2–3.4) | 3.4 (3.2–3.5) | 3.4 (3.1–3.5) | 3.3 (3.2–3.4) | 2.9 (1.9–3.3) | |||
| HBV DNA, log10 IU/mL | n = 51 | n = 31 | .84 | n = 104 | n = 187 | < .001 | .004 | |
| Median (IQR) | 8.3 (8.1–8.5) | 8.3 (8.1–8.6) | 8.3 (8.1–8.4) | 8.3 (8.1–8.5) | 8.0 (7.0–8.3) | |||
| HBV genotype | n = 32 | n = 21 | .052 | n = 105 | n = 187 | < .001 | .29 | |
| B | 28 (53.8) | 12 (37.5) | 6 (28.6) | 46 (43.8) | 54 (28.9) | |||
| C | 22 (42.3) | 18 (56.3) | 13 (61.9) | 53 (50.5) | 89 (47.6) | |||
| Otherc | 2 (3.8) | 2 (6.3) | 2 (9.5) | 6 (5.7) | 44 (23.5) | |||
| PC mutation (G1896A) | n = 44 | n = 29 | n = 17 | .99 | n = 90 | n = 144 | .19 | .66 |
| Wild type | 42 (95.5) | 28 (96.6) | 16 (94.1) | 86 (95.6) | 131 (91.0) | |||
| Any mutation | 2 (4.5) | 1 (3.4) | 1 (5.9) | 4 (4.4) | 13 (9.0) | |||
| Any BCP mutation (A1762T orG1764A) | n = 42 | n = 29 | n = 15 | .99 | n = 86 | n = 135 | < .001 | .02 |
| Wild type | 35 (83.3) | 23 (79.3) | 13 (86.7) | 71 (82.6) | 76 (56.3) | |||
| Any mutation | 7 (16.7) | 6 (20.7) | 2 (13.3) | 15 (17.4) | 59 (43.7) | |||
Abbreviations: ALT, Alanine transaminase; APRI, AST-platelet-ratio index; AST, aspartate aminotransferase; BCP, basal core promoter; BMI, body mass index; CHB, chronic hepatitis B virus; DNA, deoxyribonucleic acid; HBV, hepatitis B virus; HBRN, Hepatitis B Research Network; HBeAg, hepatitis B e antigen; HIV, human immunodeficiency virus; HBsAg, hepatitis B surface antigen; IA, immune active; IQR, interquartile range; IT, immunotolerant; PC, pre-core; ULN, upper limit of normal.
Compared with the IA-HBeAg+ cohort (n = 192), the IT cohort (n = 107) was younger (median age, 30 vs 36 years; P < .001), a smaller percentage were men (38% vs 51%; P = .04), and a higher percentage were Asian (95% vs 80%; P < .0001). Based on phase definition, IT participants had lower median ALT than IA-HBeAg+ participants (24 vs 77 U/L; P < .001). They also had lower median AST (22 vs 48 U/L; P < .001), alkaline phosphatase (64 vs 74 U/L; P < .001), and APRI (0.3 vs 0.6; P < .001), and higher median albumin (4.3 vs 4.2 mg/dL; P = .02) and platelets (225 vs 202 × 103/mm3; P = .002). qHBsAg (4.8 vs 4.3 log10 IU/mL; P < .001), qHBeAg (3.3 vs 2.9 log10 IU/mL; P < .001), and HBV DNA (8.3 vs 8.0 log10 IU/mL; P < .001) levels were also higher in the IT vs IA-HBeAg+ groups. The genotype distribution differed (eg, Genotype A: 2% IT vs 17% IA-HBeAg+ CHB; P < .001), and fewer IT vs IA-HBeAg+ participants had PC mutation (4% vs 9%; P = .19) and BCP mutation (17% vs 44%; P < .001). No IT participants had a history of cirrhosis versus 0.5% (n = 1) of the IA-HBeAg+ cohort (P = .99).
To address the hypothesis that older adults in the IT phase would be more like those in the IA-HBeAg+ phase than younger adults in the IT phase, comparisons between IT participants who were ≥40 years old (n = 22) and the full IA-HBeAg+ cohort were performed (Table 1). Several characteristics that differed between participants in the overall IT vs IA-HBeAg+ phase (ie, sex, race, alkaline phosphatase, albumin, platelets), were no longer significantly different between the oldest IT group (≥40 years) and the IA HBeAg+ group (Table 1; last column); however, statistical power to detect potentially meaningful differences was low due to the small sample size of the older IT group.
Clinically relevant outcomes were uncommon in the HBRN cohort as a whole.12 No HCCs, liver transplants or HBV-related deaths were reported in the IT cohort during follow-up (median, 234 weeks; range, 25–245 weeks); there was one death, not associated with HBV.
CHB Phases and HBV Antiviral Therapy Use Over Time Among the IT Cohort
Figure 2 shows CHB phase, HBV therapy use, and clinical trial participation in the IT cohort (n = 107) over time. Participants’ first IT period, which started prior to study enrollment in 67% (n = 72) of the IT cohort, was a median duration of 74 weeks during study participation (range, 20–384 weeks). Following participants’ first IT period, 55% (n = 59) transitioned to IA-HBeAg+, 3% (n = 3) to indeterminant HBeAg+, and 1% (n = 1) to inactive carrier. Six participants (6%) started HBV therapy, 9 (8%) enrolled in a clinical trial, and 29 (27%) remained in the IT phase through the end of follow-up. Status at end of follow-up is summarized in Supplementary Table 1. Among participants who started HBV therapy for clinial care during (n = 9) or immediately following (n = 6) an IT period, 60% (n = 9) were pregnant (HBV therapy duration median, 95 days; range, 59–128 days). The reason for HBV therapy in the other 6 participants, all of whom stayed on treatment until end of follow-up, is unknown; none cleared HBeAg or HBsAg (Supplementary Table 2).
Figure 2.
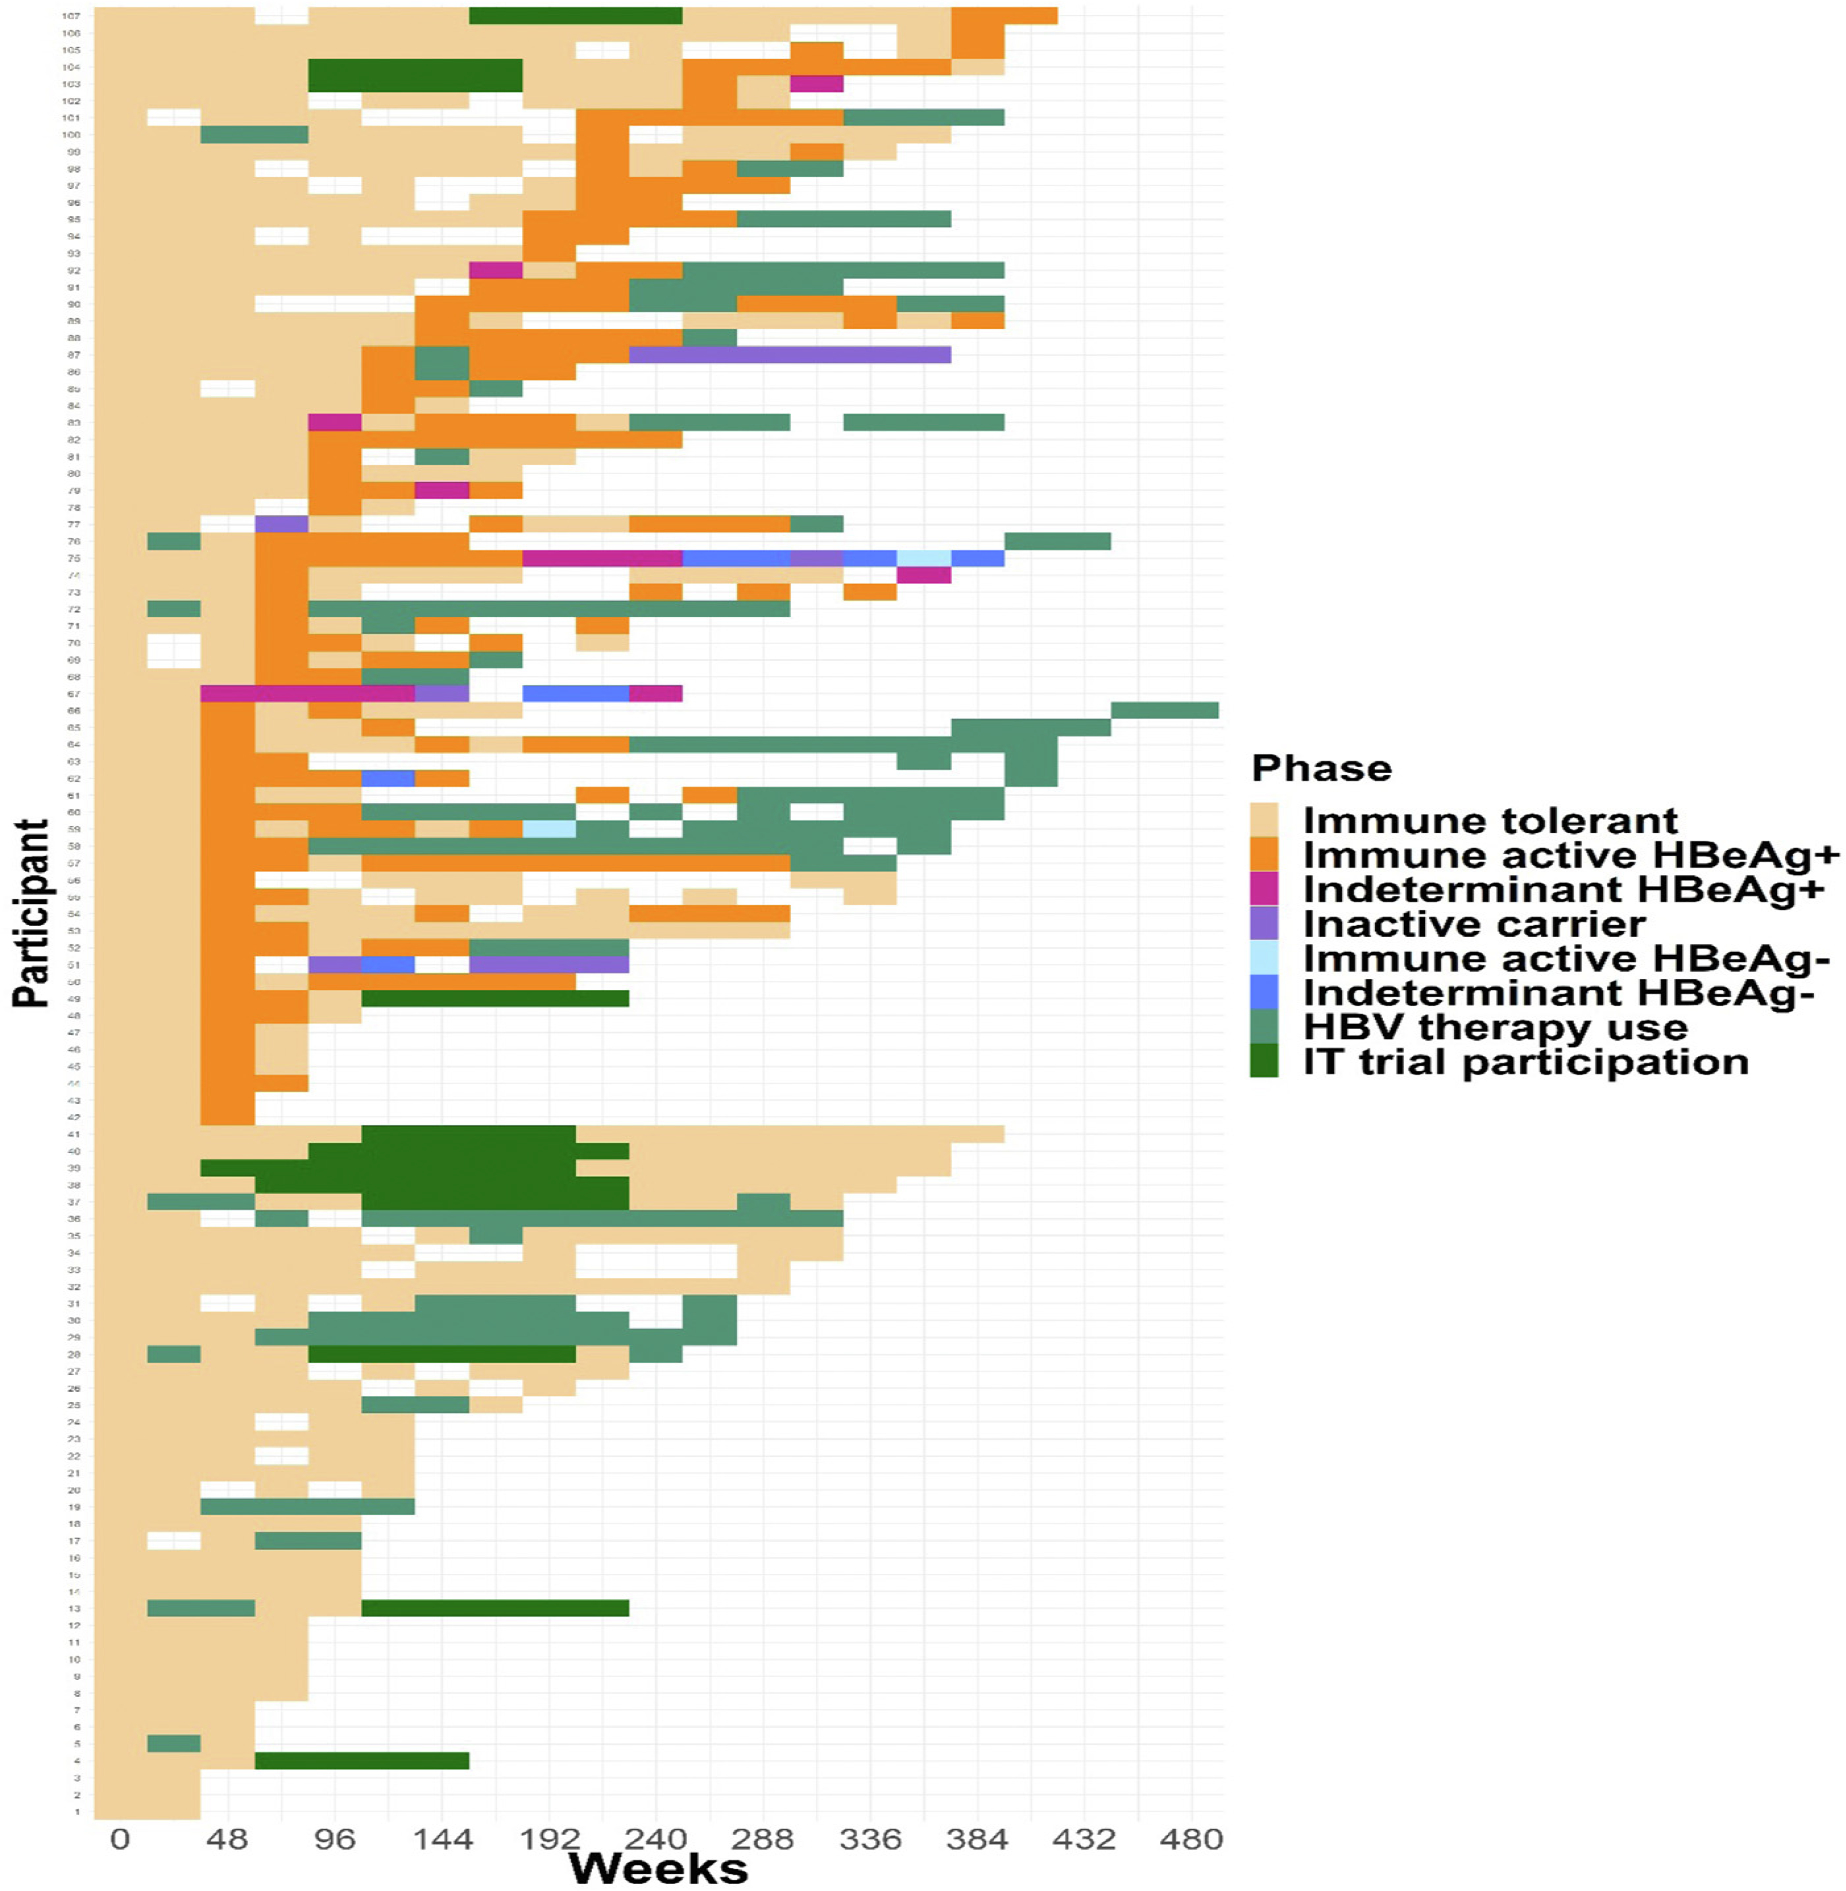
Heat map of CHB phases over time among the IT cohort (N = 107). Transitions from the IT phase to other CHB phases are shown over time for each participant. Follow-up time is shown from the first sustained period in the IT phase for each participant until the end of follow-up.
Age group-specific heat maps are provided in Supplementary Figure 1. There was not an age trend in treatment initiation among the IT cohort (<30 years: 35% [n = 18], 30 to <40 years: 58% [n = 19], ≥40 years: 23% [n = 5]; P = .81).
Phase Transitions
Among the IT cohort, 60 participants had a phase transition during 206 person-year follow-up, a rate of 29.1 (95% CI, 22.6–37.5) per 100 person-years. The phase transition rate per 100 person-years (29.1; 95% CI, 22.6–37.5, overall) was lower in the 30 to 39 year group (24.8; 95% CI, 15.6–39.4) and ≥40 year group (27.4; 95% CI, 14.8–50.9) vs the <30 year group (33.0; 95% CI, 23.4–46.7), but 95% CIs overlapped. Among participants in the IT cohort who transitioned, the percentage who transitioned to IA HBeAg+ was 97% (n = 31), 94% (n = 17), and 80% (n = 8) in 18 to 30, 30 to <40 and ≥40 year olds, respectively. Phase transition rates appeared lower in females (26.0; 95% CI, 18.6–36.1) vs males (35.1; 95% CI, 23.8–52.0), but again, 95% CI overlapped and no other clinical or demographic factors were associated with phase transition (Supplementary Table 3). Higher baseline ALT (HR:1.18 (1.06, 1.32) per 1x ULN, p=.003) and lower qHBsAg (HR:2.34 (1.29, 4.26) per log10 IU/mL, p=.005) and lower qHBeAg (HR:3.06 (1.65, 5.69) per log10 IU/mL, p<.001) were associated with transition from the IT phase. On multivariable analysis, only higher baseline ALT (HR, 1.19; 95% CI, 1.05–1.34; P = .006) and lower qHBsAg levels (HR, 2.73; 95% CI, 1.44–5.17; P = .002), were significantly associated with transition out of the IT phase (Supplementary Table 4).
Discussion
Among the large HBRN adult cohort study, we identified 107 participants who ever met criteria for having a period in the IT phase (ie, remained in IT phase for >20 weeks), 22 (21%) of whom were at least 40 years old. The older IT group was largely similar to the younger IT groups. As expected, IT participants had less active liver disease than IA-HBeAg+ participants. Although some of the differences between the IT group and IA-HBeAg+ were not statistically significant when the comparison was limited to the older IT subgroup, the lack of significance more likely reflects the small number of older IT participants rather than an imminent transition to active IA disease. In fact, the lowest rate of transitioning out of the IT phase was observed in the oldest IT group.
The association of HBeAg-positivity, high levels of HBV DNA, and increasing age with a higher risk of HCC in previous studies led AASLD, EASL, and APASL to recommend consideration of treatment of older IT patients.4–6 Kim et al reported that, in a large Korean cohort, untreated patients in the IT phase had a higher rate of HCC and death than treated patients in the IA phase of disease.13 They found that in addition to IT disease, age, male sex, and lower HBV DNA and platelet counts were associated with HCC risk, suggesting silent progression of liver disease despite meeting IT criteria or that those transitioning from the IT phase were at higher risk of outcomes. Additionally, previous studies have shown that patients with late (age ≥40 years) HBeAg seroconversion have a higher risk of cirrhosis and HCC.14 Our finding that older IT participants did not appear to be imminently transitioning out of the IT phase may support recommendations to consider treatment in older IT patients; however; no events were reported in our IT cohort over a median follow-up of 234 weeks. A total of 15 participants were started on HBV therapy during or immediately following an IT period, the majority due to pregnancy. Only one was at least 40 years old. Given the absence of data on the effectiveness of HBV therapy to reduce HCC risk in IT patients, the decision to initiate HBV therapy in an older IT patient should be individualized.
Some of the controversy around management of patients in the IT phase relates to phase definitions. There is not universal agreement on the HBV DNA or ALT thresholds that define the IT phase. We used a threshold of HBV DNA above 107 IU/mL and ALT below 1.5 × ULN in line with the HBRN IT treatment trials.15,16 With ULN of 20 U/L for women and 30 U/L for men, our use of 1.5 × ULN was in line with most studies that have used a threshold of 40 U/L to define the IT phase. Lee and colleagues found that HBV DNA levels above 107 IU/mL were associated with a low risk of transition to IA disease and a very low risk of HCC in long-term follow-up.17 These and other authors have argued that studies reporting negative outcomes in IT patients were often including individuals with declining HBV DNA levels who were transitioning to early IA disease.17,18 Indeed, in the Korean study by Kim et al, lower HBV DNA levels were associated with a higher risk of HCC among untreated IT patients.13 We found that lower qHBsAg and qHBeAg levels, as well as higher ALT levels, were associated with transition out of the IT phase, whereas age and HBV DNA levels were not, although statistical power was limited by our sample size. Although, on average, those who transitioned had higher ALT and lower qHBsAg/HBeAg levels prior to transition compared with those who did not transition during follow-up, their values were within the ranges that define the IT phase, making it difficult to use these markers to predict transition and signal the potential need for intervention, such as antiviral therapy.
Why some individuals remain in the IT phase until an advanced age is poorly understood. From the viral perspective, deep sequencing revealed that variants, particularly in the BCP, PC, and PreS regions, were more common in older than in younger IT patients. Higher viral diversity was associated with older age, as were lower levels of qHBeAg, qHBsAg, and HBV DNA, possibly indicating transition to IA-HBeAg+ disease.19 We found that a higher proportion of IT participants in the ≥40 years age group had PC or BCP mutations, yet they were not more likely to transition to IA-HBeAg-negative phases. Aging is associated with immune senescence with ineffective pathogen-specific responses and low-grade inflammatory responses.20,21 Furthermore, CHB is associated with global and HBV-specific T cell dysfunction regardless of clinical IT or IA phases.22 Highly multiplexed imaging mass cytometry analysis of liver tissues from HBeAg+ CHB patients showed significantly lower hepatic adaptive and innate immune infiltrates in adults and children in the IT compared with the IA phase, with an age-associated increase in innate immune subsets.23 Progressive fibrosis has also been reported to develop in at least some patients meeting the criteria for IT phase, particularly among those who are older.24,25 Further immunological and virological characterization of older IT patients would be valuable to better understand if the delay in transition is virally or host-driven.
The following limitations should be considered. The number of older IT participants was limited. Whether 40 is the appropriate age threshold to define ‘older IT’ is unknown, but results were similar when we examined those above age 30, 35, or 50 years (data not shown). The age 40 threshold is also in line with AASLD guidelines that recommend consideration of treatment for older IT patients.4 We used a standard HBV DNA and ALT threshold to define the IT phase, but our main results were robust to sensitivity analysis using lower HBV DNA and ALT thresholds previously defined by the HBRN26 (data not shown). No clinically relevant outcomes occurred during follow-up in the IT cohort; however, 39% of participants initiated HBV treatment, which may have averted adverse outcomes. Additionally, follow-up duration was limited.
In summary, in a large North American cohort, we found that older adults (≥40 years) in the IT phase of CHB are not clinically or virologically distinct from younger adults in the IT phase. Transition to IA disease was relatively common, occurring in ~30% per year, but was not more frequent in the older patients. Additional studies of older IT patients would be helpful to better understand the virological and immunologic basis for persistent high viremia without overt hepatocellular injury to potentially guide optimal management of this challenging group of patients.
Supplementary Material
What You Need to Know.
Background
Those in the immunotolerant (IT) phase of chronic hepatitis B virus infection typically transition to immune active phase of disease by in early adulthood. Characteristics of those who remain in the IT phase beyond age 40 are not well understood.
Findings
Patients who remain in the IT phase were not clinically or virologically distinct from younger adults in the IT phase. Transition to the immune active phase was common but was no more frequent among the older than younger IT patients.
Implications for Patient Care
Prior studies have shown that patients who remain in the IT phase are at high risk of active disease and liver cancer. Our observation that transition to immune active disease was not imminent in older IT patients would support the recommendation of international guidelines to consider treatment in older IT patients.
Funding
The Hepatitis B Research Network (HBRN) was funded as a Cooperative Agreement between the National Institute of Diabetes and Digestive and Kidney Diseases (NIDDK) and the following investigators Lewis R. Roberts, MB, ChB, PhD (U01-DK082843), Anna Suk-Fong Lok, MD (U01-DK082863), Steven H. Belle, PhD, MScHyg (U01-DK082864), Kyong-Mi Chang, MD (U01-DK082866), Michael W. Fried, MD (U01-DK082867), Adrian M. Di Bisceglie, MD (U01-DK082871), William M. Lee, MD (U01-DK082872), Harry L. A. Janssen, MD, PhD (U01-DK082874), Daryl T-Y Lau, MD, MPH (U01-DK082919), Richard K. Sterling, MD, MSc (U01-DK082923), Steven-Huy B. Han, MD (U01-DK082927), Robert C. Carithers, MD (U01-DK082943), Mandana Khalili, MD (U01-DK082944), an interagency agreement with NIDDK: Lilia M. Ganova-Raeva, PhD (A-DK-3002–001) and support from the intramural program, NIDDK, National Institutes for Health (NIH): Marc G. Ghany, MD. Additional funding to support this study was provided to Kyong-Mi Chang, MD, the Immunology Center (NIH/NIDDK Center of Molecular Studies in Digestive and Liver Diseases P30DK50306, NIH Public Health Service Research Grant M01-RR00040), Richard K. Sterling, MD, MSc (UL1TR000058, NCATS (National Center for Advancing Translational Sciences, NIH), Mandana Khalili, MD (CTSA Grant Number UL1TR000004), Michael W. Fried, MD (CTSA Grant Number UL1TR001111), and Anna Suk-Fong Lok (CTSA Grant Number UL1RR024986 and U54TR001959.) Additional support was provided by Gilead Sciences, Inc. and Roche Molecular Systems through Cooperative Research and Development Agreements (CRADAs) with the NIDDK.
Abbreviations used in this paper:
- AASLD
American Association for the Study of Liver Disease
- ALT
alanine aminotransferase
- APASL
Asian Pacific Association for the Study of the Liver
- APRI
AST to platelet ratio index
- AST
aspartate aminotransferase
- BCP
basal core promoter
- CHB
chronic hepatitis B
- EASL
European Association for the Study of the Liver
- HBeAg
hepatitis B e antigen
- HBRN
Hepatitis B Research Network
- HBsAg
hepatitis B surface antigen
- HBV
hepatitis B virus
- HCC
hepatocellular carcinoma
- IA
immune active
- IT
immunotolerant
- PC
precure
- ULN
upper limit of normal
Footnotes
Conflicts of interest
These authors disclose the following: Jordan J. Feld reports research support from Enanta, Gilead, and Janssen; and consultant for Abbvie, Antios, Arbutus, Enanta, Gilead, GSK, Janssen, and Vir Biotechnology. Wendy C. King reports research support from Abbvie. Kyong-Mi Chang reports Advisory Committee for Arbutus Inc. Norah Terrault reports research support from Gilead Sciences, GSK, and Roche Genentech; consulting for Exigo, Saol Therapeutics and Moderna. Robert P. Perrillo reports research support from Dynavax and served as a consultant for Assembly Biosiences. Mandana Khalili reports research support from Gilead Sciences Inc and consults for Gilead Sciences. Harry LA Janssen reports consultant fees and/or grant support from BMS, AbbVie, Gilead Sciences, Novartis, Roche, Janssen, Arbutus and VIR. Anna S. Lok reports grants from Bristol Myers Squibb, Gilead Sciences, and TARGET, and served as consultant/advisor for Arbutus, Clear B, Enanta, Enochian, Gilead Sciences, GlaxoSmithKline, GNI, Janssen, and TARGET. The remaining authors disclose no conflicts.
CRediT Authorship Contributions
JJF: Study concept, study design, analysis, initial draft of manuscript, editing of final manuscrpt.
WCK: Study design, statistical analysis, editing of initial and subsequent drafts.
MGG: Data analysis, editing of initial and subsequent drafts.
KMC: Data analysis, editing of initial and subsequent drafts.
NT: data analysis, editing of initial and subsequent drafts.
RPP: Data analysis, editing of initial and subsequent drafts.
MK: Data analysis, editing of initial and subsequent drafts.
ASH: Statistical analysis, editing of initial and subsequent drafts.
HLAJ: Data analysis, editing of initial and subsequent drafts.
ASL: Study concept, study design, analysis, editing of initial and subsequent drafts.
Supplementary Material
Note: To access the supplementary material accompanying this article, visit the online version of Clinical Gastroenterology and Hepatology at www.cghjournal.org, and at https://doi.org/10.1016/j.cgh.2022.06.015.
References
- 1.Feld JJ, Heathcote EJ. Hepatitis B e antigen-positive chronic hepatitis B: natural history and treatment. Semin Liver Dis 2006;26:116–129. [DOI] [PubMed] [Google Scholar]
- 2.Yang HI, Yuen MF, Chan HL, et al. REACH-B Working Group. Risk estimation for hepatocellular carcinoma in chronic hepatitis B (REACH-B): development and validation of a predictive score. Lancet Oncol 2011;12:568–574. [DOI] [PubMed] [Google Scholar]
- 3.Chen CJ, Yang HI, Su J, et al. REVEAL-HBV Study Group. Risk of hepatocellular carcinoma across a biological gradient of serum hepatitis B virus DNA level. JAMA 2006;295:65–73. [DOI] [PubMed] [Google Scholar]
- 4.Terrault NA, Lok ASF, McMahon BJ, et al. Update on prevention, diagnosis, and treatment of chronic hepatitis B: AASLD 2018 hepatitis B guidance. Hepatology 2018;67:1560–1599. [DOI] [PMC free article] [PubMed] [Google Scholar]
- 5.European Association for the Study of the Liver. EASL 2017 Clinical Practice Guidelines on the management of hepatitis B virus infection. J Hepatol 08 2017;67:370–398. [DOI] [PubMed] [Google Scholar]
- 6.Sarin SK, Kumar M, Lau GK, et al. Asian-Pacific clinical practice guidelines on the management of hepatitis B: a 2015 update. Hepatol Int 2016;10:1–98. [DOI] [PMC free article] [PubMed] [Google Scholar]
- 7.Barkaway A, Rolas L, Joulia R, et al. Age-related changes in the local milieu of inflamed tissues cause aberrant neutrophil trafficking and subsequent remote organ damage. Immunity 2021;54:1494–1510.e7. [DOI] [PMC free article] [PubMed] [Google Scholar]
- 8.Ghany MG, Perrillo R, Li R, et al. Hepatitis B Research Network. Characteristics of adults in the hepatitis B research network in North America reflect their country of origin and hepatitis B virus genotype. Clin Gastroenterol Hepatol 2015;13:183–192. [DOI] [PMC free article] [PubMed] [Google Scholar]
- 9.WebMD. What Is the APRI Score? Available at: https://www.webmd.com/hepatitis/what-is-apri-score. Accessed June 15, 2020.
- 10.Ganova-Raeva L, Ramachandran S, Honisch C, Forbi JC, Zhai X, Khudyakov Y. Robust hepatitis B virus genotyping by mass spectrometry. Comparative Study Evaluation Studies. J Clin Microbiol 2010;48:4161–4168. [DOI] [PMC free article] [PubMed] [Google Scholar]
- 11.Lau DTY, Ganova-Raeva L, Wang J, et al.Hepatitis B Research Network. Precore and basal core promoter hepatitis B virus (HBV) variants are present from a young age and differ across HBV genotypes. Hepatology 2021;73:1637–1651. [DOI] [PMC free article] [PubMed] [Google Scholar]
- 12.Lok AS, Perrillo R, Lalama CM, et al. Hepatitis B Research Network (HBRN). Low incidence of adverse outcomes in adults with chronic hepatitis B virus infection in the era of antiviral therapy. Hepatology 2021;73:2124–2140. [DOI] [PMC free article] [PubMed] [Google Scholar]
- 13.Kim GA, Lim YS, Han S, et al. High risk of hepatocellular carcinoma and death in patients with immune-tolerant-phase chronic hepatitis B. Gut 2018;67:945–952. [DOI] [PubMed] [Google Scholar]
- 14.Chen YC, Chu CM, Liaw YF. Age-specific prognosis following spontaneous hepatitis B e antigen seroconversion in chronic hepatitis B. Hepatology 2010;51:435–444. [DOI] [PubMed] [Google Scholar]
- 15.Feld JJ, Terrault NA, Lin HHS, et al. Hepatitis B Research Network. Entecavir and peginterferon alfa-2a in adults with hepatitis B e antigen-positive immune-tolerant chronic hepatitis B Virus infection. Hepatology 2019;69:2338–2348. [DOI] [PMC free article] [PubMed] [Google Scholar]
- 16.Rosenthal P, Ling SC, Belle SH, et al. Hepatitis B Research Network (HBRN). Combination of entecavir/peginterferon alfa-2a in children with hepatitis B e antigen-positive immune tolerant chronic hepatitis B virus infection. Hepatology 2019;69:2326–2337. [DOI] [PMC free article] [PubMed] [Google Scholar]
- 17.Lee HA, Lee HW, Kim IH, et al. Extremely low risk of hepatocellular carcinoma development in patients with chronic hepatitis B in immune-tolerant phase. Aliment Pharmacol Ther 2020;52:196–204. [DOI] [PubMed] [Google Scholar]
- 18.Lee HW, Kim SU, Baatarkhuu O, et al. Comparison between chronic hepatitis B patients with untreated immune-tolerant phase vs. those with virological response by antivirals. Sci Rep 2019;9:2508. [DOI] [PMC free article] [PubMed] [Google Scholar]
- 19.Yuen L, Revill PA, Rosenberg G, et al. HBV variants are common in the ‘immune-tolerant’ phase of chronic hepatitis B. J Viral Hepat 2020;27:1061–1070. [DOI] [PubMed] [Google Scholar]
- 20.Nikolich-Žugich J The twilight of immunity: emerging concepts in aging of the immune system. Nat Immunol 2018;19:10–19. [DOI] [PubMed] [Google Scholar]
- 21.Barbé-Tuana F, Funchal G, Schmitz CRR, et al. The interplay between immunosenescence and age-related diseases. Semin Immunopathol 2020;42:545–557. [DOI] [PMC free article] [PubMed] [Google Scholar]
- 22.Park JJ, Wong DK, Wahed AS, et al. Hepatitis B Research Network. Hepatitis B virus–specific and global T-cell dysfunction in chronic hepatitis B. Gastroenterology 2016;150:684–695. e5. [DOI] [PMC free article] [PubMed] [Google Scholar]
- 23.Traum D, Wang YJ, Schwarz KB, et al. Highly multiplexed 2-dimensional imaging mass cytometry analysis of HBV-infected liver. JCI Insight 2021;6:e146883. [DOI] [PMC free article] [PubMed] [Google Scholar]
- 24.Wong GL, Chan HL, Yu Z, et al. Liver fibrosis progression in chronic hepatitis B patients positive for hepatitis B e antigen: a prospective cohort study with paired transient elastography examination. J Gastroenterol Hepatol 2013;28:1762–1769. [DOI] [PubMed] [Google Scholar]
- 25.Wang CC, Lim LY, Deubner H, et al. Factors predictive of significant hepatic fibrosis in adults with chronic hepatitis B and normal serum ALT. J Clin Gastroenterol 2008;42:820–826. [DOI] [PubMed] [Google Scholar]
- 26.Di Bisceglie AM, Lombardero M, Teckman J, et al. Hepatitis B Research Network (HBRN). Determination of hepatitis B phenotype using biochemical and serological markers. J Viral Hepat 2017;24:320–329. [DOI] [PMC free article] [PubMed] [Google Scholar]
Associated Data
This section collects any data citations, data availability statements, or supplementary materials included in this article.