

Abstract
Purpose
Glioblastoma (GBM) is the most common type of adult brain tumor with extremely poor survival. Cystathionine-gamma lyase (CTH) is one of the main Hydrogen Sulfide (H2S) producing enzymes and its expression contributes to tumorigenesis and angiogenesis but its role in glioblastoma development remains poorly understood.
Methods
and Principal Results: An established allogenic immunocompetent in vivo GBM model was used in C57BL/6J WT and CTH KO mice where the tumor volume and tumor microvessel density were blindly measured by stereological analysis. Tumor macrophage and stemness markers were measured by blinded immunohistochemistry. Mouse and human GBM cell lines were used for cell-based analyses. In human gliomas, the CTH expression was analyzed by bioinformatic analysis on different databases.
In vivo, the genetic ablation of CTH in the host led to a significant reduction of the tumor volume and the protumorigenic and stemness transcription factor sex determining region Y-box 2 (SOX2). The tumor microvessel density (indicative of angiogenesis) and the expression levels of peritumoral macrophages showed no significant changes between the two genotypes. Bioinformatic analysis in human glioma tumors revealed that higher CTH expression is positively correlated to SOX2 expression and associated with worse overall survival in all grades of gliomas. Patients not responding to temozolomide have also higher CTH expression. In mouse or human GBM cells, pharmacological inhibition (PAG) or CTH knockdown (siRNA) attenuates GBM cell proliferation, migration and stem cell formation frequency.
Major Conclusions
Inhibition of CTH could be a new promising target against glioblastoma formation.
Keywords: Cystathionine gamma-lyase (CTH), Glioblastoma stem cells (GSC), Brain blood vessels, Sex determining region Y-Box 2 (SOX2)
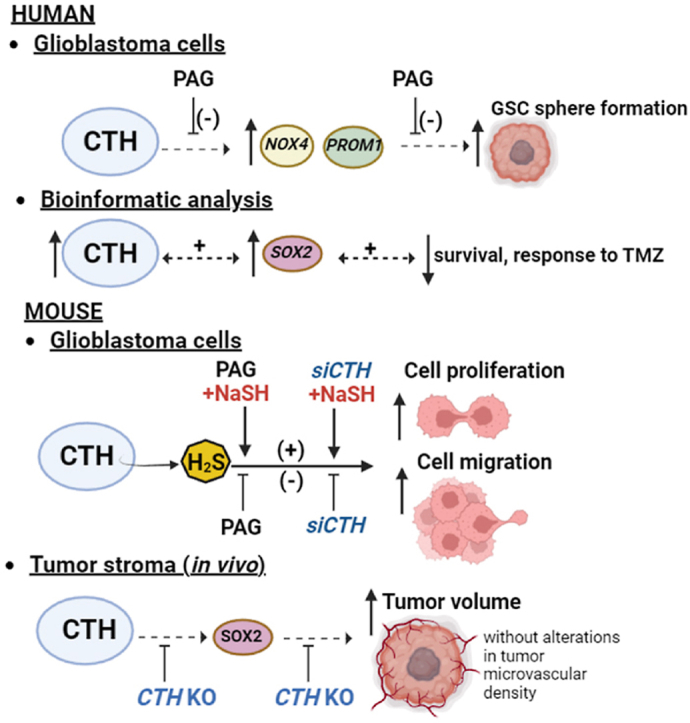
Graphical abstract
Overview of the proposed mechanisms by which CTH might regulate glioblastoma formation. Pharmacological (PAG) inhibition of CTH on human glioblastoma cells results to lower Glioblastoma Stem Cell (GSC) formation and lower mRNA expression of stem cell markers (i.e, PROM1, NOX4). Bioinformatic analysis reveals also higher CTH expression in human GBM, which is associated with worse overall survival, non-response to temozolomide (TMZ) and higher expression of the GSC marker SOX2. Inhibition of CTH in mouse GBM cells with a brain-permeable pharmacological inhibitor (PAG) or knockdown with siRNA (siCTH) results in lower GBM cell proliferation and migration by an H2S-dependent mechanism, since the effects of CTH inhibition are attenuated by the H2S donor, NaSH. CTH expression in the tumor stroma/microenvironment plays a crucial role for glioblastoma formation and triggers the expression of the GSC marker SOX2 without affecting the tumoral vascular network. CTH KO mice with GBM have significantly lower tumor volume, tumoral SOX2 expression and no alteration in the levels of tumoral vascular density compared to WT mice with GBM. The figure was created by using the Biorender software https://biorender.com/.
Highlights
-
•
CTH inhibition in the tumor host attenuates glioblastoma.
-
•
CTH is upregulated in human gliomas and associated with worse overall survival.
-
•
CTH inhibition lowers GBM cell proliferation, migration and stem cell formation.
Abbreviations
- bFGF
basic Fibroblast Growth Factor
- BSA
Bovine Serum Albumin
- CD133 or PROM1
Cluster of Differentiation antigen 133 or Prominin-1
- CD31 or PECAM1
Cluster of Differentiation antigen 31 or Platelet And Endothelial Cell Adhesion Molecule 1
- CD34
Cluster of Differentiation antigen 34 (Sialomucin)
- CD44
Cluster of Differentiation antigen 44 (homing-associated cell adhesion molecule)
- cDNA
complementary Deoxyribonucleic acid
- CLDN5
Claudin-5
- CGGA
Chinese Glioblastoma Genome Atlas
- CTH
Cystathionine-gamma lyase
- CTH KO
cystathionine-gamma lyase knockout
- DMSO
Dimethyl sulfoxide
- EGF
Epidermal Growth Factor
- ELDA
Extreme Limiting Dilution Analysis
- GBM
Glioblastoma
- GSC
Glioblastoma Stem Cells
- GSH
Glutathione
- GTEx
Genotype-Tissue Expression
- H&E
Hematoxylin&Eosin
- H2O2
Hydrogen Peroxide
- H2S
Hydrogen Sulfide
- IDH-1
Isocitrate dehydrogenase-1
- IHC
Immunohistochemistry
- MAC-2
Galectin-3
- NADPH
Nicotinamide Adenine Dinucleotide Phosphate
- NES
Nestin
- NOX4
NADPH oxidase 4
- OS
Overall Survival
- PAG
l-propargylglycine
- PBS
Phosphate Buffered Saline
- PFA
Paraformaldehyde
- qPCR
quantitative Polymerase Chain Reaction
- RFU
Relative Fluorescence Unit
- RNA
Ribonucleic acid
- RNA-seq
RNA sequencing
- ROC
Receiver Operating Characteristic
- ROS
Reactive Oxygen Species
- SOX2, 4
Sex determining region Y-box-2, -4
- TAMs
Tumor Associated Macrophages
- TCGA
The Cancer Genome Atlas
- TGF-β1
Transforming growth factor-beta 1
- WT
wildtype
1. Introduction
Glioblastoma (GBM) is the most prevalent and aggressive primary brain tumor in adults with a median overall survival of 15 months. GBM tumors are characterized by high invasiveness, inflammation, increased microvascular density and endothelial cell proliferation [1]. The main current therapeutic approaches against GBM is surgical resection of the tumor followed by chemotherapy (mostly temozolomide) and/or radiotherapy [2]. More recently, and based on the importance of the tumor vasculature for the progression of glioblastoma formation [3], some anti-angiogenic treatments have also been used such as bevacizumab, which however showed no increase in overall survival (OS) but improved the progression-free survival [2,4]. Despite the advances in the current diagnostics and therapeutics GBM remains the most deadly and aggressive type of brain tumor with a 5-year survival of less than 5% [5]. Therefore, identifying new molecular players involved in glioblastoma formation is imperative in order to improve the odds of survival and the quality of life of these patients.
Cystathionine-gamma lyase (CTH) is one of the main enzymes involved in the production of the gasotransmitter hydrogen sulfide (H2S) in the body by using cystathionine and cysteine as substrates [6]. This enzyme is part of the so-called transsulfuration pathway that contributes significantly to the pools of the important antioxidant molecule glutathione (GSH) in the brain [7]. CTH-derived H2S has been shown to be an important endogenous inducer of angiogenesis in the whole body, including the brain [8,9]. Moreover, CTH can promote tumorigenesis via supporting angiogenesis mechanisms in other cancer types such as breast or prostate cancer [10,11]. Whether CTH is able of supporting angiogenesis-related mechanisms during glioblastoma formation remains unknown. A recent study analyzing the impact of antioxidant GSH in specific subtypes of gliomas, indicated the importance of CTH as precursor enzyme for high GSH synthesis in astrocytoma cells [12]. This study relied on xenografts in immunocompromised mice and did not examine the importance of the tumoral vascular network or more generally, the role of CTH in the tumor stroma cells of glioblastoma.
Investigating the role of CTH in the tumoral stroma alone, using immunocompetent mice, and comparing it with the role of CTH in isolated GBM cells, would therefore give us a deeper understanding about the role of this enzyme in GBM. Such an approach would also allow us to understand if targeting CTH in the tumoral stroma, the GBM cells or both could have any therapeutic potential.
Our results show that CTH expressed in the tumor microenvironment supports glioblastoma formation without affecting the tumoral microvascular density. We also show that CTH is highly expressed in human GBM tumors and correlates with worse overall survival and non-response to temozolomide but not with anti-angiogenesis treatments. Finally, CTH knockdown (siRNA) or pharmacological inhibition of CTH with a brain permeable drug on isolated GBM cells results in lower GBM cell proliferation, migration and stem cell formation.
Therefore, the use of CTH-specific blood brain barrier permeable pharmacological or molecular inhibitors could have a therapeutic potential against GBM.
2. Materials and Methods
2.1. Cell culture
The patient-derived glioblastoma U3031MG, U3017MG, U3034MG cells were acquired and authenticated by the Human Glioblastoma Cell Culture resource (www.hgcc.se) at the Dept. of Immunology, Genetics and Pathology, Uppsala University, Uppsala, Sweden, using whole genome sequencing [13]. The mouse GL261 GBM cells were a gift by Prof. Anna Dimberg (Uppsala University, Sweden). The cells were cultured as previously described [14,15], details of the protocols are given in the Supplement.
2.2. Cell culture treatments
Cells were treated under the following conditions: I) ‘Control’ were treated with ‘vehicle’ (0.1% bovine serum albumin (BSA)/4 mM HCl solvent for Transforming growth factor-beta 1 (TGF-β1) and/or 0.1% DMSO (solvent for PAG), II) ‘PAG’ were treated with the CTH pharmacological inhibitor PAG (l-propargylglycine, Sigma, 600 μΜ, tock in DMSO, final DMSO concentration in the cell culture 0.1%) III) ‘TGF-β’ were treated with recombinant mouse TGF-β1 (PeproTech EC Ltd, London, UK, 5 ng/ml final concentration, stock solution 5 μg/ml in 0.1% BSA/4 mM HCl). PAG was always administered 30 min before the addition of TGF-β1 or the vehicle in case of ‘control’. All treatments were performed on full (non-starvation) media.
2.3. siRNA transfection and treatment protocol
All reagents for the siRNA transfection experiments in mouse GL261 glioblastoma cells were purchased by Thermofischer (Invitrogen) as follows: siRNA for CTH purchased under the commercial name ‘CTH siRNA (mouse), siRNA ID 173374, size 5 nmol, Cat. No. AM16708’, siRNA for Control (scrambled siRNA) under the commercial name ‘Silencer™ Select Negative Control No. 1 siRNA, size 5 nmol, Cat. No: 4390843’, Opti-MEM® I Reduced Serum Medium, (Cat. No. 31985-062) and Lipofectamine RNAiMAX (Cat. No. 13778030). The protocol of reverse siRNA transfection (transfection at the moment of cell plating) by using Lipofectamine in Opti-MEM® I Reduced Serum Medium was performed according to the manufacturer's (Invitrogen) instructions. The cells were plated in media supplemented with normal FBS (10%) but without antibiotics. After performing some trial experiments, we concluded that the optimal final siRNA transfection concentration that led to a stable (∼70%) downregulation of CTH was 30 nM and this concentration was used for all the subsequent cell proliferation and cell migration assays.
2.4. Sphere formation assay (ELDA assay)
Briefly, the human GBM U3017MG and U3034MG cells were seeded in Corning, Costar, Ultra-Low attachment 96-well plates (Corning Incorporated, Corning, NY, USA) performing a serial dilution from 100 to 3 cells in 6 replicates for each dilution and experimental condition in a volume of 100 μl N2B27 medium. Cells were incubated for 9 days with vehicle (DMSO 0.1%) or PAG (600 μΜ); then, the wells with neurospheres >50 μm were scored as positive and the actual number of spheres in each well was counted. The neurospheres were visualized using a phase-contrast Axiovert 40 CFL microscope (Carl-Zeiss, Oberkochen, Germany). The data were processed by the R package Extreme Limiting Dilution Analysis (ELDA) program [16].
2.5. Scratch assay
Scratch assays were performed as previously described with some slight modifications [17]. Scratch assays were performed by performing scratches in a form of a ‘cross’ (one horizontal and one vertical scratch with a sterile 200 μl tip) as previously described [17]. The cells were visualized and photographed with the ImageXpress® Pico Automated Cell Imaging System at 0, 6 and 24 h after scratching. At 24 h the wounds were completely closed and therefore the comparison of the 0 to 6 h-time points was used for the analysis. The % of scratching area and the number of migrating cells was counted for each time point on Image-J by two independent researchers and at the end the % of wound closure and % of cell migration respectively was calculated.
2.6. MTS cell viability and cell proliferation assays
The % of cell viability and cell proliferation was monitored in a spectrophotometer following the manufacturer’s protocol (Promega, Biotech AB, Nacka, Sweden). For cell viability, the cells were plated in 96-well plates at confluent concentrations (104 cells/well for mouse GBM cells and 3x10³ cells/well for human GBM cells) whereas for the cell proliferation assays the mouse glioblastoma cells were plated in sub-confluent concentrations (2.5 × 10³ cells/well). After allowing 1 day for cell attachment, the cell treatments were performed as explained above and the cell viability was assessed 48 h after the treatments were added whereas the cell proliferation 24 h after. Further details of the protocol are given in the Supplement.
2.7. Cell proliferation by manual cell counting and trypan blue staining
Mouse GL261 glioblastoma cells were plated in 6-well plates in sub-confluent concentrations (3.8 × 10⁴ cells/well) and were treated the following day for 24 h. The cells in each well were then harvested and counted as follows: removal of medium, washing 2 × with DPBS, trypsinization (80 μl/well) and addition of 220 μl of full (10% FBS) media (final volume 300 μl), transfer of cells to new Eppendorf tubes on ice and addition of filtered trypan blue dye (10% final concentration), cell counting on a hematocytometer and calculation of the total alive and dead cell number. The level of cell death did not differ significantly among the different tested experimental conditions and was on average 8.54% ± 0.98. The cell proliferation was calculated based on the total number of alive cells for each experimental condition and at the end it was expressed as % of the ‘Control’ treated cells. The cell counting was performed by two independent researchers to minimize bias and the average of the two was used for the final analysis.
2.8. RNA extraction, cDNA synthesis and Real Time PCR
Real Time PCR was performed on total cellular extracted RNA and reverse transcribed cDNA with a SYBR green-based detection method. The details of the protocol and the primer sequences are given in the Supplemental section of Materials and Methods and in the Supplemental Table 1.
2.9. Orthotopic GL261 mouse glioma model
The orthotopic GL261 glioblastoma model was performed with some slight modifications as described in the Supplement [15].
2.10. Stereology analysis of tumor volume, % of tumor area, tumor microvessel density
Blinded stereologic measurements were done as previously described [[18], [19], [20]] with some appropriate modifications for the brain tissue. The details of the protocol are given in the Supplement.
2.11. Immunohistochemistry (IHC) analysis
Slices were stained with antibodies specific for SOX2 (Millipore, Cat No AB5603), MAC-2 (Cedarlane Laboratories, Burlington, Canada, Cat No CL8942AP) and CD34 (Abcam, Cat No ab8158) following standard IHC protocols as described previously [[21], [22], [23]]. Details of the protocol are given in the Supplement.
2.12. Bioinformatic analysis
The Cancer Genome Atlas (TCGA) and Genotype-Tissue Expression (GTEx) datasets were used to assess the expression of CTH in GBM compared to normal brain tissue using GEPIA2 (http://gepia2.cancer-pku.cn) [24]. The cBioPortal for Cancer Genomics [25] was used to retrieve RNA-seq data from GBM patients and gene coexpression analyses of CTH with other genes of interest. Correlation of gene expression with treatment response to temozolomide and angiogenesis inhibitors in GBM patients was conducted using the database from ROC Plotter (https://www.rocplot.org/gbm) as previously described [26,27]. GBM patients were categorized as responders or non-responders, according to the survival status at 16 months post-surgery, and gene expression was compared with the Mann-Whitney U test. Additionally, the Chinese Glioma Genoma Atlas (CGGA) was used to retrieve mRNA microarray and RNA-seq data of GBM patients and generate survival Kaplan-Meier plots as previously described [28].
2.13. Statistical analysis
The cell culture, in vivo stereology and immunohistochemistry, data were analyzed by using Excel and GraphPad Prism 9.0 software. Unpaired Student’s t-test was used for comparison between two groups, comparisons between three groups were performed by ordinary one-way ANOVA followed by Bonferroni’s multiple comparisons test, and comparisons between three groups over time were performed by two-way ANOVA followed by Bonferroni’s multiple comparisons test. All statistical tests were two-sided, and P values smaller than 0.05 were considered statistically significant. SEM was indicated as an error bar in all the figures.
3. Results
3.1. Genetic ablation of CTH in the mouse host is sufficient for attenuating glioblastoma formation
Intracranial injection of mouse GBM GL261 cells expressing CTH (Supplemental Fig. 1) according to a well-established orthotopic immunocompetent mouse GBM model (Fig. 1A) led to substantially smaller tumors in CTH KO relative to WT mice. Details regarding the technical reliability of the surgeries and the number of the mice that developed visible by IHC tumors 3 weeks post-operation, are given in the Supplemental Table 2.
Fig. 1.

Genetic ablation of CTH significantly attenuates glioblastoma formation in immunocompetent mice. A. Overview of the in vivo experimental protocol. B. Representative macroscopic images of a WT and a CTH KO mouse 21 days after the stereotactic injection of the mouse GL261 GBM cells. C. Table comparing the number of operated vs tumor-bearing mice at the termination day in WT vs CTH KO mice. D. Representative microscopic images of a WT and CTH KO mouse GBM tumor after H&E staining, E. % of tumor area compared to the total brain area and the exact tumor volume in mm3 as calculated by stereology analysis for all operated mice (N = 8/group). Area as calculated by stereology analysis (N = 8/group). F. % of tumor area compared to the total brain area and the exact tumor volume in mm3 as calculated by stereology analysis for all the tumor-bearing mice (N = 8/group for WT and N = 3/group for CTH KO). Area as calculated by stereology analysis. *p<0.05, **p<0.01, ***p< 0.001, unpaired Student’s t-test.
The differences in the tumor size were even seen macroscopically at the point of termination with the WT mice bearing obviously larger GBM tumors (Fig. 1B). As shown in Fig. 1C, all the operated WT mice developed visible tumors 21 days after the surgery whereas only 3 out of 8 CTH KO developed tumors under the same period. Indicative histology photographs from a WT and a CTH KO bearing tumors are shown in Fig. 1D.
The % of tumor area and tumor volume (mm3) was analyzed by blinded stereology in all the operated WT and CTH KO mice and showed substantially smaller tumors in the CTH KO mice both in terms of % tumor area and tumor volume (Fig. 1E).
The % of tumor area and the volume was also calculated by blinded stereology solely on the WT and CTH KO that developed tumors and we reached similar statistical conclusions indicating a significant reduction of the % tumor area and tumor volume in the CTH KO (Fig. 1F).
As a complementary measure, the % of tumor area and tumor volume were also measured by blinded microscopy, revealing similar/comparable to stereology findings (Supplemental Fig. 2 and Supplemental Table 3).
3.2. Genetic ablation of CTH in the mouse host does not lead to significantly altered levels of tumor microvascular density
We used again, the blinded golden-standard method of stereological analysis and WT and CTH KO tumors were stained for CD34, a known endothelial cell marker which depicts nicely and reliably the microvascular network [29]. As shown in Fig. 2A and 2B the two genotypes had absolutely similar levels of tumor microvascular density indicating similar networks of blood vessels and degree of angiogenesis.
Fig. 2.

Genetic ablation of CTH is associated with lower tumoral SOX2 (GSC marker) expression but does not affect the tumoral microvascular density (CD34) or macrophage levels (MAC-2). A. Tumor microvessel density (μm of vessels/μm3 of tumor GBM tissue) in WT and CTH KO as calculated by stereology analysis (N = 8/group for WT, N = 3/group for CTH KO). B. Representative microscopic images depicting the tumor microvascular tree of a WT and a CTH KO mouse (hematoxylin/blue stains more intensely the tumor cells, CD34/endothelial cell marker in brown). C. Tumor SOX2 expression in WT and CTH KO mice as calculated by blinded microscopy analysis (N = 8/group for WT, N = 3/group for CTH KO). D. Representative microscopic images depicting the tumoral SOX2 expression of a WT and a CTH KO mouse (hematoxylin/blue stains more intensely the tumor cells, SOX2/GSC marker in brown). E. Tumoral MAC-2 expression in WT and CTH KO mice as calculated by blinded microscopy (N = 5/group for WT, N = 3/group for CTH KO). F. Representative microscopic images depicting the tumoral MAC-2 expression of a WT and a CTH KO mouse (hematoxylin/blue stains more intensely the tumor cells, MAC-2/general macrophage marker in brown). *p < 0.05, unpaired Student’s t-test. (For interpretation of the references to colour in this figure legend, the reader is referred to the Web version of this article.)
3.3. Genetic ablation of CTH in the mouse host leads to lower tumor SOX2 expression
Our IHC data and analysis of the same brain slices as the ones used above, but analyzed this time with blinded microscopy showed that CTH KO mice have a significantly lower tumoral SOX2 expression compared to WT bearing tumors (Fig. 2C and 2D).
3.4. Genetic ablation of CTH does not affect the number of tumor-associated macrophages (TAMs)
MAC-2 (Galectin-3) was used as a general pan-macrophage marker [30] and IHC analysis was performed by blinded microscopy, using WT and CTH KO-derived tumors. Our results showed no significant differences on tumoral MAC-2 expression between the two genotypes (Fig. 2E and 2F).
3.5. CTH is overexpressed in human GBM and correlates positively with SOX2 expression but not with EC markers
Based on bioinformatic analysis on ‘The Cancer Genome Atlas’, TCGA, we found a significant upregulation of CTH mRNA expression in all grades of human gliomas compared to healthy/non-tumoral brain tissue (Fig. 3A). Our database analysis on RNAseq from TCGA database also revealed a significant positive correlation between CTH and the GSC marker SOX2 (mRNA expression) in human GBM (Fig. 3B). However, there was no positive correlation between CTH and the mRNA levels of the well-established EC marker PECAM1/CD31 (Fig. 3C). Finally, there was no correlation between CTH and the mRNA levels of other well-established GSC markers such as NES, PROM1 or CD44 (Supplemental Figs. 3A–C) or the EC marker CLDN5 (Supplemental Fig. 3D).
Fig. 3.

Higher CTH expression in human gliomas is associated with worse overall survival, higher SOX2 expression and non-response to temozolomide but is not positively correlated with the expression of endothelial cell markers or response to anti-angiogenic treatments. A.CTH mRNA (TCGA database) expression is significantly enhanced in human GBM tumors (T) compared to healthy/non-GBM (N) brain tissue. B.CTH mRNA expression is positively correlated with SOX2 mRNA expression. C.CTH mRNA expression in GBM tumors is not positively associated with the mRNA expression of the endothelial cell marker PECAM1. D. GBM patients with higher tumor CTH mRNA expression levels have significantly lower survival probability in all grade primary gliomas compared to GBM patients with lower CTHmRNA expression (CGGA atlas). E, F: Higher CTH mRNA expression is significantly associated with non-response to temozolomide (E) but not with anti-angiogenesis inhibitors (F): bevacizumab, thalidomide, vandetanib, vatalanib. The Cancer Genome Atlas (TCGA) and Genotype-Tissue Expression (GTEx) datasets were used to assess the expression of CTH in GBM compared to normal brain tissue using GEPIA2 (http://gepia2.cancer-pku.cn) (panel A). The cBioPortal for Cancer Genomics was used to retrieve RNA-seq data from GBM patients and gene coexpression analyses of CTH with other genes of interest. batch normalized from Illumina HiSeq_RNASeqV2, blue dots: non-mutated CTH, yellow dots: mutated CTH, white dots: CTH not profiled for mutation (panels B, C). The Chinese Glioma Genoma Atlas (CGGA) was used to retrieve mRNA microarray and RNA-seq data of GBM patients and generate survival Kaplan-Meier plot (panel D). Correlation of gene expression with treatment response to temozolomide and angiogenesis inhibitors in GBM patients was conducted using the database from ROC Plotter (https://www.rocplot.org/gbm). GBM patients were categorized as responders or non-responders, according to the survival status at 16 months’ post-surgery, and gene expression was compared with the Mann-Whitney U test. (For interpretation of the references to colour in this figure legend, the reader is referred to the Web version of this article.)
3.6. CTH overexpression is associated with worse overall survival in primary gliomas
By analyzing the CTH mRNA expression profile on the CGGA database, we found that higher CTH expression is correlated with significantly worse survival probability in all primary gliomas of different grades (Fig. 3D). Moreover, high CTH expression led to a clear trend with almost acceptable significance (P-value: 0.056) for lower survival probability in recurrent gliomas of all grades (Supplemental Fig. 3E).
3.7. Non-responders to temozolomide (TMZ) have higher CTH expression
In order to further evaluate the clinical relevance and the pharmacological potential of our findings, we used the www.rocplot.org database, which is capable to link gene expression and response to therapy using transcriptome-level data of human GBM. Our analyses revealed that higher CTH mRNA expression in human GBM correlates significantly with non-response to temozolomide (Fig. 3E), which is the most commonly used current chemotherapy against GBM [31].
3.8. CTH expression does not differ between responders and non-responders to angiogenesis inhibitors
Our analysis revealed that the higher CTH expression did not correlate significantly to non-responder patients who received approved anti-angiogenic treatments such as bevacizumab, thalidomide, vandetanib and vatalanib (Fig. 3F).
3.9. Pharmacological inhibition of CTH leads to lower stem cell frequency and expression of stem cell markers on human GBM cells
As shown in Fig. 4A–C, the treatment with a non-cytotoxic PAG concentration (600 μΜ) was able to significantly reduce the stem cell frequency on two different human GBM cell lines. At the molecular level, we tested the mRNA expression of the stem cell markers PROM1 and NOX4 and we found a significant downregulation upon CTH inhibition (Fig. 4D–F). Interestingly, direct pharmacological inhibition of CTH on mouse and human GBM cells does not alter the expression levels of the GSC marker SOX2 (Supplemental Fig. 4).
Fig. 4.

A brain permeable pharmacological inhibitor of CTH attenuates the formation of human glioblastoma stem cells (GSC) and the expression of GSC markers. A, B. The brain permeable CTH pharmacological inhibitor PAG (600 μΜ, 8 days) attenuated significantly the stem cell frequency formation of human GSC in two different human glioblastoma lines (U3017MG and U3034MG) as accessed by ELDA, N = 6/group, C. 1/Estimated cell frequency in numerical values for the Control- and PAG-treated cells of panels A and B. D, E: mRNA expression levels of the GSC marker PROM1 in two different human glioblastoma lines (U3017MG, U3031MG). N = 2/group (average of 2 biological replicates) F: mRNA expression levels of the GSC marker NOX4 in human glioblastoma cells (U3031MG), N = 2/group (average of 2 biological replicates). *p < 0.05, **p<0.01, unpaired Student’s t-test.
3.10. Pharmacological (PAG) CTH inhibition or CTH knockdown (siRNA) leads to lower mouse GBM cell proliferation and migration via an H2S-dependent mechanism
Pharmacological inhibition of CTH with PAG led to significantly lower cell proliferation, an effect partially or fully reversed by the H2S donor, NaSH (Fig. 5A–B). At the same time, various concentrations of PAG did not have any major cytotoxic effect as tested in different mouse and human GBM cell lines (Supplemental Fig. 5). Administration of the H2S donor, NaSH alone (without PAG) did not have any major cytotoxic effect either (Supplemental Fig. 6A), whereas it had at the same time a mild attenuating effect on cell proliferation (Supplemental Fig. 6B).
Fig. 5.

Pharmacological inhibition (PAG) or CTH knockdown (siRNA) attenuates mouse GBM cell proliferation and migration via an H2S-dependent mechanism. A, B: % of cell proliferation of Control (0.1% DMSO, 24 h), PAG (600 μΜ, 24 h) and PAG (600 μΜ, 24 h)+NaSH (150 μΜ, 24 h) treated cells as assessed by the MTS assay (A) and by Trypan Blue staining and counting of the total alive cell number (B). N = 6/group for (A) and N = 4/group for (B). C: Wound closure over time (% of closure area of 0 vs 6 h) for Control (0.1% DMSO, 6 h), PAG (600 μΜ, 6 h) and PAG (600 μΜ, 6 h)+NaSH (150 μΜ, 6 h) treated cells. N = 3/group D: % of migrating cells (migrating cells into the ‘cross/scratch’ area from 0 vs 6 h) for Control (0.1% DMSO, 6 h), PAG (600 μΜ, 6 h) and PAG (600 μΜ, 6 h)+NaSH (150 μΜ, 6 h) treated cells. N = 6/group E: Representative microscopic images at the 6h time point for Control (0.1% DMSO), PAG (600 μΜ) and PAG (600 μΜ)+NaSH (150 μΜ) treated cells. The black drawn line in the middle depicts the remaining cell-free area 6 h after scratching. F:CTH mRNA expression for siControl (treated with scrambled ‘Control’ siRNA, 30 nM, 24 h) and siCTH (treated with siRNA for CTH, 30 nM, 24 h), N = 2 biological replicates/group. G: % of cell proliferation of siControl (scrambled ‘Control’ siRNA, 30 nM, 24 h), siCTH (siRNA for CTH, 30 nM), and siCTH (siRNA for CTH, 30 nM)+NaSH (150 μΜ, 24 h) treated cells as assessed by the MTS assay, N = 12/group H: Wound closure over time (% of closure area of 0 vs 6 h after scratching) for siControl (scrambled ‘Control’ siRNA, 30 nM), siCTH (siRNA for CTH, 30 nM) and siCTH (siRNA for CTH, 30 nM)+NaSH (150 μΜ) treated cells. N = 3/group I: % of migrating cells (migrating cells into the ‘cross/scratch’ area from 0 vs 6 h after scratching) for siControl (scrambled ‘Control’ siRNA, 30 nM), siCTH (siRNA for CTH, 30 nM) and siCTH (siRNA for CTH, 30 nM)+NaSH (150 μΜ) treated cells. N = 6/group. J: Representative microscopic images at the 6 h time point for siControl (scrambled ‘Control’ siRNA, 30 nM), siCTH (siRNA for CTH, 30 nM) and siCTH (siRNA for CTH, 30 nM)+NaSH (150 μΜ) treated cells. The black drawn line in the middle depicts the remaining cell-free area 6 h after scratching. Comparisons between 3 groups in panels A, B, D, G and I were performed by one-way ANOVA followed by Bonferroni’s multiple comparisons test. Comparisons between 3 groups over time (panels C, H) were performed by two-way ANOVA followed by Bonferroni’s multiple comparisons test. Comparisons between 2 groups (panel F) was performed by unpaired Student’s t-test. Special notes: PAG was added 30 min prior any other treatment. Cells were transfected with siRNA at the moment of plating (reverse transfection) and therefore were treated with the respective siRNA for at least 24h before the addition of any other reagent (i.e NaSH, TGF-β). For the cell migration assays (panels C, D, E, H, I, J) all the cells received an equal amount of the cell migration-promoting factor TGF-β1 (5 ng/ml). (For interpretation of the references to colour in this figure legend, the reader is referred to the Web version of this article.)
TGF-β is known as a strong stimulator of GBM cell migration and invasiveness [32]. As shown in the Supplemental Fig. 7A, our findings confirmed previous results and showed that TGF-β promoted GBM cell migration, an effect reversed by PAG. Moreover, PAG attenuated the TGF-β induced mediated H2O2 production/NOX4 activity (Supplemental Fig. 7B), which is a known stimulator of cell migration and invasiveness [33].
In order to further expand on these findings and investigate if the effects of CTH are H2S-dependent, we measured the levels of wound closure and cell migration by performing scratch assays in the presence of PAG ± NaSH. As shown in Fig. 5C–E, PAG significantly hindered the TGF-β induced cell migration, an effect partially reversed by the H2S donor, NaSH.
Lastly, siRNA against the mouse CTH mRNA was used and cell proliferation and migration were measured. Administration of 30 nM siRNA against CTH (indicated as siCTH) downregulated significantly the CTH mRNA expression at about ∼70% (Fig. 5F) and this concentration was used for subsequent cell proliferation and migration assays. As shown in Fig. 5G, siCTH significantly reduced the cell proliferation levels, an effect reversed by the H2S donor, NaSH. Moreover, siCTH attenuates significantly the TGF-β induced cell migration, an effect fully reversed by the H2S donor, NaSH (Fig. 5H–J).
4. Discussion
Elevated levels of H2S by biosynthetic routes such as the enzymes CTH, CBS or 3-MST seem to play an important role in supporting tumorigenesis [34]. In relation to glioblastoma formation, CBS overexpression seems to attenuate rather than supporting gliomagenesis. A study published in 2014 [35] showed that decreased expression of CBS promotes gliomagenesis. Therefore, it is rather the activation and not the inhibition of CBS that could potentially play an anti-tumoral effect in glioblastoma. Moreover, Silver et al., 2021 showed that High Fat Diet predisposes mice for formulating more aggressive GBM tumors partially because of lower CBS expression [36]. On the contrary, a study published last year showed that 3-MST expressed in the glioblastoma cells supports gliomagenesis and therefore 3-MST inhibition could have a potential promising therapeutic effect against glioblastoma [37].
A study published last year showed that CTH is upregulated in IDH-1 mutant astrocytomas and pharmacological CTH inhibition could attenuate to some extent astrocytoma growth in immunodeficient mice [12]. According to the latest (2021) WHO classification, IDH-1 mutant astrocytomas have a more favorable prognosis and cannot be longer classified as GBM [38]. The role of CTH in IDH-1 WT GBM has not been extensively investigated. In particular, the exact biological role of CTH expressed in the tumor stroma (microenvironment) vs the GBM tumor cells per se remains to a large extend unknown especially under the setting of immunocompetent mice. To the best of our knowledge, our study is the first one investigating in detail these aspects.
Targeting the GBM cells per se pharmacologically, remains up to date, a very difficult task since the GBM cells have a very aggressive phenotype [39]. Even strong cytotoxic reagents such as temozolomide (TMZ) combined with radiotherapy that target the GBM cells and prolong survival [40] are eventually to a large extent insufficient since in the majority of GBM patients there is a recurrence of tumor formation and most of the patients die within 5 years from the time of the first diagnosis [5]. Therefore, identifying new pharmacological targets in the tumor microenvironment and not only in the tumor cells per se could be a new promising therapeutic approach for the battle against GBM.
In this study, we hypothesized that inhibiting CTH in the tumor microenvironment could have potentially anti-tumoral effects since similar effects of CTH have been shown in other cancer types [34]. Moreover, we hypothesized that direct CTH inhibition on mouse and human GBM cells could have extra anti-tumoral functions, aiding and supporting the anti-tumoral effect of CTH inhibition in the tumor stroma.
Since CTH is a known inducer of angiogenesis [8] and the vascular network is known to play a crucial role in supporting glioblastoma formation [3], we wanted first to determine if the substantially smaller tumors observed in the CTH KO were also accompanied by an altered tumor microvascular network.
Analyzing the tumor microvascular density by stereological analysis is a well-established method that reveals with high accuracy and reliability the levels of tumor vasculature and when differences in the tumor microvascular density are observed, this is indicative of different levels of angiogenesis [41]. Our results indicate similar levels of tumor microvascular density between the WT and the CTH KO mice.
Therefore, despite the fact that in other cancer models [10,11], CTH has been shown to promote tumor angiogenesis, this does not seem to be the case for glioblastoma formation, at least not due to CTH expression in the tumor microenvironment, in this well-established orthotopic immunocompetent mouse GBM [15]. Future studies with the use of human GBM cells on xenografted mice will be necessary to further support our current findings and test rigorously whether CTH acts independently of angiogenesis when GBM tumors are formed by human cells. However, recent GBM xenograft studies should be interpreted cautiously since the host mice were immunodeficient [42], and the immune system is known to play a crucial role in supporting tumor angiogenesis [43].
Moreover, our bioinformatic analysis on human GBM gene expression data, further supports our in vivo findings showing that CTH expression in human GBM tumors is not associated with the expression of EC markers or with the patients’ response to anti-angiogenic treatments.
Whether CTH inhibition in the tumor cells per se but not in the stroma, could have an effect on angiogenesis, remains to be elucidated. Future pre-clinical and clinical trials will show whether pharmacological inhibitors of CTH can enhance the anti-tumoral activity of temozolomide or other chemotherapies against GBM.
Apart from the tumoral endothelium, the tumor-associated macrophages (TAMs) comprise another major component of the tumor microenvironment that supports glioblastoma formation [44]. TAMs are the dominant infiltrating immune cell population in GBM and they aid glioblastoma formation by different mechanisms, like supporting GSC formation [45] or inducing neovascularization [43]. Our results showed no significant differences on the levels of TAMs between the WT and CTH KO mice. Thus, we could hypothesize that the CTH expression in the tumor microenvironment is not primarily responsible for driving macrophage infiltration inside the glioblastoma tumors.
However, future studies are needed in order to elucidate if there are any differences in tumor macrophage subpopulations (i.e M1 and M2) or in the numbers of other immune cell types that infiltrate the tumor microenvironment, and whether CTH might be involved in such changes.
Since lower levels of tumoral angiogenesis and tumoral macrophage infiltration does not seem to be the main players driving the attenuated glioblastoma formation in the CTH KO mice, we next decided to focus on molecular players driving glioblastoma stem cell (GSC) formation. GSC formation and self-renewal is one of the major drivers of gliomagenesis that it is controlled by several autocrine and paracrine signals derived either from the tumor cells per se or from the tumor stroma [46].
SOX2 is a master transcription factor of mammalian cell pluripotency and stemness that also regulates the expression of several genes promoting self-renewal of glioblastoma stem cells (GSCs) [47]. Moreover, SOX2 has been shown to promote malignancy in GBM by regulating the plasticity and differentiation fate not only of GCSs but also of differentiated astrocytes [48].
Interestingly, bio-informatic analysis performed by us in the current study revealed a positive and significant correlation between CTH and SOX2 mRNA expression in human GBM tumors but whether this correlation is driven by the tumor microenvironment, or the tumor cells alone remained unknown. To answer this question, the tumoral SOX2 expression levels were evaluated in vivo in the CTH KO and in isolated mouse and human GBM cells where CTH was pharmacologically inhibited.
Our combined in vivo and cellular findings indicate that SOX2 tumoral protein expression is significantly downregulated in the CTH KO but remains unchanged upon direct CTH inhibition on mouse and human GBM cells.
Our findings therefore suggest that the absence of CTH in the tumor microenvironment and not in the tumor per se, is sufficient for regulating tumoral SOX2 expression. The exact cellular sources and nature of the paracrine signals leading to this outcome remain to be identified in future studies. The cellular organization of the GBM microenvironment is extremely complex with many different cell types i.e endothelial cells, macrophages, astrocytes, microglia etc, being involved [3]. In order to identify the most important cell type(s) leading to lower tumoral SOX2 levels in the CTH KO, a series of tumor microenvironment cell-specific CTH KO mice would have to be created (i.e knockout in endothelial cells, macrophages, astrocytes) which was beyond the scope of the current study.
In general, GBM patients with higher GSC gene expression profile, including SOX2, have worse prognosis and overall survival [49]. Since SOX2 overexpression is linked to worse overall survival in human GBM [49] and the expression of this protein is positively correlated to CTH expression, we next sought to investigate if CTH overexpression is linked to worse survival in humans GBM patients. Indeed, our bioinformatic analysis suggests that CTH is overexpressed in human GBM tumors and higher CTH expression is significantly correlated with lower survival probability in all grades of primary gliomas. Moreover, there was an almost significant trend in all grades of recurrent gliomas. In conclusion, our results might indicate that CTH overexpression by supporting GBM formation, leads to lower survival probability in humans.
We must however point out that correlation findings should be interpreted with caution and not as a proof-of-concept. Future detailed clinically-oriented studies are needed in order to understand the role and the expression profile of CTH in human GBM pathogenesis. An additional reason why the bioinformatic data should be interpreted with caution from the point of view of this study, is the lack of data that distinguish gene expression in the tumor cells versus the tumor stroma. Future single cell analysis in GBM will be valuable in resolving this problem and will offer better data for the evaluation of our GBM model in the CTH KO mouse.
Finally, and in order to clarify if direct CTH inhibition on the tumor cells could trigger any additional anti-tumoral effects, human and mouse GBM cells were treated with pharmacological (PAG) or molecular (siRNA) CTH inhibitors. Biological phenomena critical for glioblastoma formation, maintenance and recurrence such as cell viability, cell proliferation, cell migration and stem cell formation [[50], [51], [52]] were measured.
Our results show that the brain-permeable pharmacological inhibitor of CTH, PAG, is not a cytotoxic drug but can attenuate significantly the GBM cell proliferation and the TGF-β-induced cell migration in mouse glioblastoma cells by an H2S-dependent mechanism. Moreover, PAG can attenuate the TGF-β-induced NOX4-derived ROS which are in general known to lead to genomic instability and trigger signaling cascades promoting cell migration and invasion in cancer [53]. Indeed, a recent publication from our group indicated that NOX4 activity and expression is significantly triggered by TGF-β1 signaling in different GBM lines promoting stemness and proliferation [14].
Additionally, PAG under baseline conditions can significantly reduce the formation of glioblastoma stem cells derived from human GBM cells and downregulate the mRNA expression of genes involved in stem cell formation such as PROM1 and NOX4 [14,54,55].
5. Conclusions-importance of the study
In conclusion, the present study emphasizes the importance of CTH as a regulator of glioblastoma formation both in the tumor microenvironment and in the GBM cells per se.
So far there has not been any genetic studies using CTH KO immunocompetent mice, which would enable us to understand whether targeting CTH in the tumor microenvironment is sufficient to suppress glioblastoma formation. Our results showed markedly attenuated glioblastoma formation in immunocompetent CTH KO mice bearing CTH-expressing tumors. Therefore, CTH expressed in the tumor stroma is an important positive regulator of glioblastoma formation and targeted administration of CTH pharmacological inhibitors in the tumor stroma might reveal in the future a promising therapeutic potential.
Our findings also suggest a potential link between CTH and molecular players regulating GBM stemness acting both via cells in the tumor microenvironment, and in the tumor cells per se. Finally, CTH expressed in the mouse GBM cells is a positive regulator of cell proliferation and cell migration by H2S-dependent mechanisms. Future studies are needed in order to point out the exact cellular and molecular players in this process and the potential of CTH pharmacological or RNA-based inhibitors in the battle against glioblastoma. Our bioinformatic analysis shows that higher CTH expression occurs in patients with gliomas and is associated with lower survival probability.
Therefore, our findings open a new chapter not only towards glioblastoma treatment, but equally important, provide novel molecular tools for the prognostic analysis of this disease.
A summary of the proposed mechanism(s) is shown in the Graphical abstract.
Funding
This work was funded by the Swedish Research Council International Postdoc Grant (Vetenskapsrådet, Grant number: 2019-00534) to M.P and the Swedish Cancer Society (CAN2018/469, CAN2021/1506Pj01H) to A.M. D.F.J.K is supported by grants from the Novo Nordisk Foundation (MeRIAD consortium, 0064142), and the University of Southern Denmark.
Authorship statement
All authors have made substantial contributions to the manuscript as indicated in detail below. Moreover, all authors were involved in drafting the article or revising it critically for important intellectual content and in the final approval of the version to be submitted.
Conceptualization: M.P, A.M, A.P Methodology: M.P, I.A, D.M.R.J, O.S, A.K Investigation: M.P, I.A, D.M.R.J, O.S, K.M, Formal analysis: M.P, I.A, D.M.R.J, O.S, K.M, Writing – Original Draft: M.P, I.A, D.R.M.J, L.C, A.K, D.F.J.K, J.S, K.M, A.M, A.P, Writing – Review and Editing: M.P, D.M.R.J, L.C, A.K, A.M, A.P, Funding acquisition: M.P, A.M, D.F.J.K Resources: M.P, A.M, A.P, D.F.J.K, Supervision: A.M, A.P.
Declaration of competing interest
The authors declare no conflict of interest.
Acknowledgments
The authors thank Prof. Anna Dimberg (Uppsala University, Sweden) for donating the mouse GL261 cell line and for all the useful discussions regarding the establishment of the mouse/in vivo GBM model. Also thanks to Prof. Per Svennigsen, Assoc. Prof. Tore B. Stage, Silke Griepe Dam Nielsen, Gitte Kitlen and Kenneth Kjærgaard, (SDU, Denmark) for lending reagents or equipment or for providing feedback regarding the performance of scratch assays. We also thank Amalie Kamstrup Mogensen (SDU, Denmark), Yae Ohata (Uppsala University, Sweden) and Kalliopi Tzavlaki (Uppsala University, Sweden) for all the useful discussions and their assistance in IHC and cellular assays. The authors would also like to thank the Head (Dr. Kostomitsopoulos) and the personnel of BRFAA animal facility (EL 25 BIO 03) for their professionalism and valuable help in breeding and maintaining the animal lines used in the study.
Footnotes
Supplementary data to this article can be found online at https://doi.org/10.1016/j.redox.2023.102773.
Contributor Information
Aristidis Moustakas, Email: aris.moustakas@imbim.uu.se.
Andreas Papapetropoulos, Email: apapapet@pharm.uoa.gr.
Appendix A. Supplementary data
The following are the Supplementary data to this article:
References
- 1.Westphal M., Lamszus K. The neurobiology of gliomas: from cell biology to the development of therapeutic approaches. Nat. Rev. Neurosci. 2011;12(9):495–508. doi: 10.1038/nrn3060. [DOI] [PubMed] [Google Scholar]
- 2.Fernandes C., et al. In: Current Standards of Care in Glioblastoma Therapy. Glioblastoma, Vleeschouwer S. De., editors. 2017. Brisbane (AU) [PubMed] [Google Scholar]
- 3.Peleli M., Moustakas A., Papapetropoulos A. Endothelial-tumor cell interaction in brain and CNS malignancies. Int. J. Mol. Sci. 2020;21(19) doi: 10.3390/ijms21197371. [DOI] [PMC free article] [PubMed] [Google Scholar]
- 4.Hundsberger T., Reardon D.A., Wen P.Y. Angiogenesis inhibitors in tackling recurrent glioblastoma. Expert Rev. Anticancer Ther. 2017;17(6):507–515. doi: 10.1080/14737140.2017.1322903. [DOI] [PubMed] [Google Scholar]
- 5.Tamimi A.F., Juweid M. In: Epidemiology and Outcome of Glioblastoma. Glioblastoma, Vleeschouwer S. De., editors. 2017. Brisbane (AU) [PubMed] [Google Scholar]
- 6.Szabo C., Papapetropoulos A. International union of basic and clinical pharmacology. CII: pharmacological modulation of H2S levels: H2S donors and H2S biosynthesis inhibitors. Pharmacol. Rev. 2017;69(4):497–564. doi: 10.1124/pr.117.014050. [DOI] [PMC free article] [PubMed] [Google Scholar]
- 7.Vitvitsky V., et al. A functional transsulfuration pathway in the brain links to glutathione homeostasis. J. Biol. Chem. 2006;281(47):35785–35793. doi: 10.1074/jbc.M602799200. [DOI] [PubMed] [Google Scholar]
- 8.Papapetropoulos A., et al. Hydrogen sulfide is an endogenous stimulator of angiogenesis. Proc. Natl. Acad. Sci. U. S. A. 2009;106(51):21972–21977. doi: 10.1073/pnas.0908047106. [DOI] [PMC free article] [PubMed] [Google Scholar]
- 9.Jiang W., et al. H2S promotes developmental brain angiogenesis via the NOS/NO pathway in zebrafish. Stroke Vasc Neurol. 2021;6(2):244–251. doi: 10.1136/svn-2020-000584. [DOI] [PMC free article] [PubMed] [Google Scholar]
- 10.Wang L., et al. Cystathioninegammalyase promotes the metastasis of breast cancer via the VEGF signaling pathway. Int. J. Oncol. 2019;55(2):473–487. doi: 10.3892/ijo.2019.4823. [DOI] [PMC free article] [PubMed] [Google Scholar]
- 11.Wang Y.H., et al. Dysregulation of cystathionine gamma-lyase promotes prostate cancer progression and metastasis. EMBO Rep. 2019;20(10) doi: 10.15252/embr.201845986. [DOI] [PMC free article] [PubMed] [Google Scholar]
- 12.Cano-Galiano A., et al. Cystathionine-gamma-lyase drives antioxidant defense in cysteine-restricted IDH1-mutant astrocytomas. Neurooncol Adv. 2021;3(1):vdab057. doi: 10.1093/noajnl/vdab057. [DOI] [PMC free article] [PubMed] [Google Scholar]
- 13.Xie Y., et al. The human glioblastoma cell culture resource: validated cell models representing all molecular subtypes. EBioMedicine. 2015;2(10):1351–1363. doi: 10.1016/j.ebiom.2015.08.026. [DOI] [PMC free article] [PubMed] [Google Scholar]
- 14.Garcia-Gomez P., et al. NOX4 regulates TGFbeta-induced proliferation and self-renewal in glioblastoma stem cells. Mol. Oncol. 2022;16(9):1891–1912. doi: 10.1002/1878-0261.13200. [DOI] [PMC free article] [PubMed] [Google Scholar]
- 15.Zhang L., et al. Pleiotrophin promotes vascular abnormalization in gliomas and correlates with poor survival in patients with astrocytomas. Sci. Signal. 2015;8(406):ra125. doi: 10.1126/scisignal.aaa1690. [DOI] [PubMed] [Google Scholar]
- 16.Hu Y., Smyth G.K. ELDA: extreme limiting dilution analysis for comparing depleted and enriched populations in stem cell and other assays. J. Immunol. Methods. 2009;347(1–2):70–78. doi: 10.1016/j.jim.2009.06.008. [DOI] [PubMed] [Google Scholar]
- 17.Liang C.C., Park A.Y., Guan J.L. In vitro scratch assay: a convenient and inexpensive method for analysis of cell migration in vitro. Nat. Protoc. 2007;2(2):329–333. doi: 10.1038/nprot.2007.30. [DOI] [PubMed] [Google Scholar]
- 18.Madsen K., et al. Angiotensin II promotes development of the renal microcirculation through AT1 receptors. J. Am. Soc. Nephrol. 2010;21(3):448–459. doi: 10.1681/ASN.2009010045. [DOI] [PMC free article] [PubMed] [Google Scholar]
- 19.Gundersen H.J., et al. Some new, simple and efficient stereological methods and their use in pathological research and diagnosis. APMIS. 1988;96(5):379–394. doi: 10.1111/j.1699-0463.1988.tb05320.x. [DOI] [PubMed] [Google Scholar]
- 20.Nyengaard J.R. Stereologic methods and their application in kidney research. J. Am. Soc. Nephrol. 1999;10(5):1100–1123. doi: 10.1681/ASN.V1051100. [DOI] [PubMed] [Google Scholar]
- 21.Arora A., et al. Genetic deficiency of indoleamine 2,3-dioxygenase aggravates vascular but not liver disease in a nonalcoholic steatohepatitis and atherosclerosis comorbidity model. Int. J. Mol. Sci. 2022;23(9) doi: 10.3390/ijms23095203. [DOI] [PMC free article] [PubMed] [Google Scholar]
- 22.Tofteng S.S., et al. Increased COX-2 after ureter obstruction attenuates fibrosis and is associated with EP2 receptor upregulation in mouse and human kidney. Acta Physiol. 2022;235(4) doi: 10.1111/apha.13828. [DOI] [PMC free article] [PubMed] [Google Scholar]
- 23.Caja L., et al. The protein kinase LKB1 promotes self-renewal and blocks invasiveness in glioblastoma. J. Cell. Physiol. 2022;237(1):743–762. doi: 10.1002/jcp.30542. [DOI] [PubMed] [Google Scholar]
- 24.Tang Z., et al. GEPIA2: an enhanced web server for large-scale expression profiling and interactive analysis. Nucleic Acids Res. 2019;47(W1):W556–W560. doi: 10.1093/nar/gkz430. [DOI] [PMC free article] [PubMed] [Google Scholar]
- 25.Gao J., et al. Integrative analysis of complex cancer genomics and clinical profiles using the cBioPortal. Sci. Signal. 2013;6(269):pl1. doi: 10.1126/scisignal.2004088. [DOI] [PMC free article] [PubMed] [Google Scholar]
- 26.Fekete J.T., Gyorffy B. ROCplot.org: validating predictive biomarkers of chemotherapy/hormonal therapy/anti-HER2 therapy using transcriptomic data of 3,104 breast cancer patients. Int. J. Cancer. 2019;145(11):3140–3151. doi: 10.1002/ijc.32369. [DOI] [PubMed] [Google Scholar]
- 27.Menyhart O., Fekete J.T., Gyorffy B. Gene expression-based biomarkers designating glioblastomas resistant to multiple treatment strategies. Carcinogenesis. 2021;42(6):804–813. doi: 10.1093/carcin/bgab024. [DOI] [PMC free article] [PubMed] [Google Scholar]
- 28.Zhao Z., et al. Chinese glioma genome atlas (CGGA): a comprehensive resource with functional genomic data from Chinese glioma patients. Dev. Reprod. Biol. 2021;19(1):1–12. doi: 10.1016/j.gpb.2020.10.005. [DOI] [PMC free article] [PubMed] [Google Scholar]
- 29.Bialas M., Okon K., Czopek J. Assessing microvessel density in gastric carcinoma: a comparison of three markers. Pol. J. Pathol. 2003;54(4):249–252. [PubMed] [Google Scholar]
- 30.Sato S., Hughes R.C. Control of Mac-2 surface expression on murine macrophage cell lines. Eur. J. Immunol. 1994;24(1):216–221. doi: 10.1002/eji.1830240134. [DOI] [PubMed] [Google Scholar]
- 31.Chibbaro S., et al. Temozolomide as first-line agent in treating high-grade gliomas: phase II study. J. Neuro Oncol. 2004;67(1–2):77–81. doi: 10.1023/b:neon.0000021728.36747.93. [DOI] [PubMed] [Google Scholar]
- 32.Merzak A., et al. Control of human glioma cell growth, migration and invasion in vitro by transforming growth factor beta 1. Br. J. Cancer. 1994;70(2):199–203. doi: 10.1038/bjc.1994.280. [DOI] [PMC free article] [PubMed] [Google Scholar]
- 33.Su X., et al. NOX4-Derived ROS mediates TGF-beta1-induced metabolic reprogramming during epithelial-mesenchymal transition through the PI3K/AKT/HIF-1alpha pathway in glioblastoma. Oxid. Med. Cell. Longev. 2021;2021 doi: 10.1155/2021/5549047. [DOI] [PMC free article] [PubMed] [Google Scholar]
- 34.Szabo C. Gasotransmitters in cancer: from pathophysiology to experimental therapy. Nat. Rev. Drug Discov. 2016;15(3):185–203. doi: 10.1038/nrd.2015.1. [DOI] [PMC free article] [PubMed] [Google Scholar]
- 35.Takano N., et al. Decreased expression of cystathionine beta-synthase promotes glioma tumorigenesis. Mol. Cancer Res. 2014;12(10):1398–1406. doi: 10.1158/1541-7786.MCR-14-0184. [DOI] [PMC free article] [PubMed] [Google Scholar]
- 36.Silver D.J., et al. Severe consequences of a high-lipid diet include hydrogen sulfide dysfunction and enhanced aggression in glioblastoma. J. Clin. Invest. 2021;131(17) doi: 10.1172/JCI138276. [DOI] [PMC free article] [PubMed] [Google Scholar]
- 37.Saurty-Seerunghen M.S., et al. Glioblastoma cell motility depends on enhanced oxidative stress coupled with mobilization of a sulfurtransferase. Cell Death Dis. 2022;13(10):913. doi: 10.1038/s41419-022-05358-8. [DOI] [PMC free article] [PubMed] [Google Scholar]
- 38.Berger T.R., et al. World health organization 2021 classification of central nervous system tumors and implications for therapy for adult-type gliomas: a Review. JAMA Oncol. 2022;8(10):1493–1501. doi: 10.1001/jamaoncol.2022.2844. [DOI] [PubMed] [Google Scholar]
- 39.Shergalis A., et al. Current challenges and opportunities in treating glioblastoma. Pharmacol. Rev. 2018;70(3):412–445. doi: 10.1124/pr.117.014944. [DOI] [PMC free article] [PubMed] [Google Scholar]
- 40.Stupp R., et al. Radiotherapy plus concomitant and adjuvant temozolomide for glioblastoma. N. Engl. J. Med. 2005;352(10):987–996. doi: 10.1056/NEJMoa043330. [DOI] [PubMed] [Google Scholar]
- 41.Marien K.M., et al. Development and validation of a histological method to measure microvessel density in whole-slide images of cancer tissue. PLoS One. 2016;11(9) doi: 10.1371/journal.pone.0161496. [DOI] [PMC free article] [PubMed] [Google Scholar]
- 42.Janbazian L., Karamchandani J., Das S. Mouse models of glioblastoma: lessons learned and questions to be answered. J. Neuro Oncol. 2014;118(1):1–8. doi: 10.1007/s11060-014-1401-x. [DOI] [PubMed] [Google Scholar]
- 43.Zhu C., et al. The contribution of tumor-associated macrophages in glioma neo-angiogenesis and implications for anti-angiogenic strategies. Neuro Oncol. 2017;19(11):1435–1446. doi: 10.1093/neuonc/nox081. [DOI] [PMC free article] [PubMed] [Google Scholar]
- 44.Heidari A., Sharif P.M., Rezaei N. The association between tumor-associated macrophages and glioblastoma: a potential target for therapy. Curr. Pharmaceut. Des. 2021;27(46):4650–4662. doi: 10.2174/1381612827666210816114003. [DOI] [PubMed] [Google Scholar]
- 45.Zhang Z., et al. Transfer of MicroRNA via macrophage-derived extracellular vesicles promotes proneural-to-mesenchymal transition in glioma stem cells. Cancer Immunol Res. 2020;8(7):966–981. doi: 10.1158/2326-6066.CIR-19-0759. [DOI] [PubMed] [Google Scholar]
- 46.Heddleston J.M., et al. Glioma stem cell maintenance: the role of the microenvironment. Curr. Pharmaceut. Des. 2011;17(23):2386–2401. doi: 10.2174/138161211797249260. [DOI] [PMC free article] [PubMed] [Google Scholar]
- 47.Gangemi R.M., et al. SOX2 silencing in glioblastoma tumor-initiating cells causes stop of proliferation and loss of tumorigenicity. Stem Cell. 2009;27(1):40–48. doi: 10.1634/stemcells.2008-0493. [DOI] [PubMed] [Google Scholar]
- 48.Berezovsky A.D., et al. Sox2 promotes malignancy in glioblastoma by regulating plasticity and astrocytic differentiation. Neoplasia. 2014;16(3):193–206. doi: 10.1016/j.neo.2014.03.006. 206 e19-25. [DOI] [PMC free article] [PubMed] [Google Scholar]
- 49.Mansouri S., et al. Sox2: regulation of expression and contribution to brain tumors. CNS Oncol. 2016;5(3):159–173. doi: 10.2217/cns-2016-0001. [DOI] [PMC free article] [PubMed] [Google Scholar]
- 50.Mair D.B., Ames H.M., Li R. Mechanisms of invasion and motility of high-grade gliomas in the brain. Mol. Biol. Cell. 2018;29(21):2509–2515. doi: 10.1091/mbc.E18-02-0123. [DOI] [PMC free article] [PubMed] [Google Scholar]
- 51.Xie Q., Mittal S., Berens M.E. Targeting adaptive glioblastoma: an overview of proliferation and invasion. Neuro Oncol. 2014;16(12):1575–1584. doi: 10.1093/neuonc/nou147. [DOI] [PMC free article] [PubMed] [Google Scholar]
- 52.Lathia J.D., et al. Cancer stem cells in glioblastoma. Genes Dev. 2015;29(12):1203–1217. doi: 10.1101/gad.261982.115. [DOI] [PMC free article] [PubMed] [Google Scholar]
- 53.Schumacker P.T. Reactive oxygen species in cancer: a dance with the devil. Cancer Cell. 2015;27(2):156–157. doi: 10.1016/j.ccell.2015.01.007. [DOI] [PubMed] [Google Scholar]
- 54.Choy W., et al. CD133 as a marker for regulation and potential for targeted therapies in glioblastoma multiforme. Neurosurg Clin N Am. 2012;23(3):391–405. doi: 10.1016/j.nec.2012.04.011. [DOI] [PubMed] [Google Scholar]
- 55.Maraldi T., et al. NADPH oxidases: redox regulators of stem cell fate and function. Antioxidants. 2021;10(6) doi: 10.3390/antiox10060973. [DOI] [PMC free article] [PubMed] [Google Scholar]
Associated Data
This section collects any data citations, data availability statements, or supplementary materials included in this article.