

Abstract
Background:
There are over 700,000 hairdressers in the United States, and it is estimated that >90% are female and 31% are Black or Hispanic/Latina. Racial and ethnic minorities in this workforce may be exposed to a unique mixture of potentially hazardous chemicals from products used and services provided. However, previous biomonitoring studies of hairdressers target a narrow list of compounds and few studies have investigated exposures among minority hairdressers.
Objective:
To assess occupational chemical exposures in a sample of U.S.-based Black and Latina hairdressers serving an ethnically diverse clientele by analyzing urine specimens with a suspect screening method.
Methods:
Post-shift urine samples were collected from a sample of U.S. female hairdressers (n=23) and office workers (n=17) and analyzed via reverse-phase liquid chromatography coupled to high-resolution mass spectrometry. Detected compounds were filtered based on peak area differences between groups and matching with a suspect screening list. When possible, compound identities were confirmed with reference standards. Possible exposure sources were evaluated for detected compounds.
Results:
The developed workflow allowed for the detection of 24 compounds with median peak areas ≥2x greater among hairdressers compared to office workers. Product use categories (PUCs) and harmonized functional uses were searched for these compounds, including confirmed compounds methylparaben, ethylparaben, propylparaben, and 2-naphthol. Most product use categories were associated with “personal use” and included 11 different “hair styling and care” product types (e.g., hair conditioner, hair relaxer). Functional uses for compounds without associated PUCs included fragrance, hair and skin conditioning, hair dyeing, and UV stabilizer.
Significance:
Our suspect screening approach detected several compounds not previously reported in biomonitoring studies of hairdressers. These results will help guide future studies to improve characterization of occupational chemical exposures in this workforce and inform exposure and risk mitigation strategies to reduce potential associated work-related health disparities.
Keywords: hairdressers, occupational chemical exposure, suspect screening, high-resolution mass spectrometry, urine analysis
1. Introduction
Hairdressers utilize numerous products to perform a wide variety of services, exposing them to unique mixtures of chemicals. Specific chemical exposures can vary based on the race or ethnicity of the clientele served due to differences in products used and services provided (1,2), and several chemicals found in salon products have been linked to adverse health risks (3,4). Based on data from 2021, there are >700,000 hairdressers in the U.S., with >90% female and 31% Black or Hispanic/Latina (5). However, there is a dearth of research on occupational chemical exposures among hairdressers, especially Black and Latina hairdressers who serve an ethnically diverse clientele who use and provide specialty products and services (6).
Most prior research on chemical exposures among hairdressers focused on identifying specific compounds, including volatile organic compounds (7–9), hair dyeing agents (10–14), phthalates (15,16), or parabens (17), by directly testing products, monitoring the workplace air environment, or via biomonitoring. Compounds included in these targeted methods may be based on anticipated exposures, i.e., from product ingredient lists, but could miss other potentially relevant compounds that are not explicitly listed on labels, generated during product use (e.g., formed when heat is applied), or are unknown impurities. For example, one study analyzing hair products used by Black women found that only 16% of the compounds detected above the method’s reporting limit were listed on product ingredient labels (1).
To help fill knowledge gaps in occupational chemical exposures among hairdressers, broader chemical analyses are needed. In the present study, we implemented a liquid chromatography–high-resolution mass spectrometry (LC-HRMS) method to analyze urine specimens collected from U.S.-based Black and Hispanic/Latina hairdressers. These methods have been employed for human biomonitoring studies to assess environmental chemical exposures previously (18–20). Urine from a comparison group was analyzed to help narrow the list of detected compounds to those specific to occupational exposures of hairdressers. A suspect screening list was used to further filter detected compounds, and tentative annotations were assigned confidence levels based on available experimental data (e.g., fragmentation spectra, isotopic patterns, etc.). When possible, compound identities were confirmed with reference standards. Finally, associations between annotated compounds and product types and functional uses were compiled to help characterize possible exposure sources. These data will improve characterization of occupational chemical exposures in this workforce which can lead to better risk mitigation strategies and reduce possible work-related health disparities.
2. Materials and Methods
2.1. Chemicals and reagents
Chemical and reagent sources are provided in the Supplemental Information (SI). A working mixed-analyte quality control (QC) solution containing the compounds listed in Table S1 was prepared at 1,000 μg/L in methanol from stock solutions of the individual compounds, and a working solution of the internal standard carbamazepine-d2 was prepared at 2,500 μg/L in methanol (“internal standard solution” below). A working solution containing 4-methylumbelliferyl-β-D-glucuronide (4-MUBG) was prepared at 125 mg/L in methanol (“incubation control” below). All solutions were stored at −20 °C until analysis.
2.2. Participant recruitment and specimen collection
Detailed information on recruitment, including participant demographic information, salon characteristics, and specimen collection were previously reported for this Institutional Review Board-approved study (8,21). Briefly, a convenience sample of 23 female hairdressers was recruited from hair salons primarily serving ethnically diverse clienteles from the Maryland/Washington, D.C. metropolitan area. All participants provided written informed consent. Eleven hairdressers were recruited across salons primarily serving a Black/African-American clientele and 12 hairdressers were recruited across salons primarily serving a Latinx clientele. To serve as a comparison group, a convenience sample of 17 female office workers were recruited. Reported race/ethnicity among hairdressers were Hispanic/Latina (47.8%), non-Hispanic Black (47.8%), and other (4.4%); office workers were 41.2% Hispanic/Latina, 41.2% non-Hispanic Black, and 17.6% other. There were no statistically significant differences in the mean number of cosmetic and personal care products used for personal use, dietary consumption-related factors, or home cleaning and fragrance use between groups; however, more hairdressers reported receiving ≥2 hair salon services in the last 12 months than office workers (21).
A single urine sample was collected at the end of the working day (i.e., post-shift) from each participant. For hairdressers, specimen collection was based on participant availability, but, whenever possible, preference was given to sampling on days in which a high clientele volume was expected. Specimens were collected in phthalate-free containers, as this chemical class was of interest in our prior study (21), and transferred to the laboratory on ice where they were aliquoted into cryovials and stored at −80 °C until analysis. Participants wore powder-free gloves during specimen collection to prevent contamination.
2.3. Urine specimen preparation
Two separate urine analyses were performed in this study. First, all urine specimens were analyzed to generate the initial data set (referred to as “suspect screening analysis” below). Then, after data review and compound annotation (see below) compound identities were confirmed with reference standards (“confirmation analysis”).
2.3.1. Preparation of pooled quality control samples
A group-specific pooled QC sample (22–25) was prepared by adding a small aliquot of each hairdresser’s urine to a clean tube and thoroughly mixing, after which 250 μL was aliquoted into separate 1.5 mL microcentrifuge tubes. Pooled QC aliquots were stored at −20 °C until analysis.
2.3.2. Suspect screening analysis
Prior to sample preparation, one third of specimens from each group were randomly assigned to one of three analytical batches. For each batch, participant samples assigned to that batch and one pooled QC aliquot were thawed at room temperature. An aliquot of Milli-Q Water (MQW, 250 μL in 1.5 mL microcentrifuge tubes) previously frozen was thawed and served as an extraction blank. Additionally, two aliquots of reference urine (urine collected from one of the authors which was stored frozen in 1.5 mL microcentrifuge tubes) were thawed.
One aliquot of reference urine was fortified with 10 μL of mixed-analyte QC solution, 10 μL of the internal standard solution, and 10 μL of incubation control (henceforth referred to as the “fortified control”). Participant samples and the pooled QC were fortified with 10 μL of the internal standard solution and 20 μL methanol. The second reference urine aliquot (the “unfortified control”) and the extraction blank were each fortified with 30 μL methanol. Then, all samples were fortified with 75 μL of 1 M ammonium acetate followed by 10 μL β-glucuronidase. After, tubes were capped, vortex mixed, and incubated in a 37 °C water bath for 5 h. Following incubation, 200 μL of 1% formic acid in methanol was added to all tubes, which were then capped, vortex mixed, and centrifuged at 17,000 ×g and 4 °C for 5 min. Supernatants were transferred to amber HPLC vials.
Within each batch the injection order for participant specimens was randomized. Sequences were designed based on previously published guidelines (23). Sequences began with two solvent blank injections followed by ten injections of the unfortified control to condition the column; the extraction blank was injected partway through column conditioning to measure contaminants introduced during sample preparation (23). The fortified control and pooled QC samples were each injected twice, followed by the participant samples. The fortified control and pooled QC were each injected again after 1/3 and 2/3 of the participant samples were analyzed. After all participant samples were injected the fortified control and pooled QC were each injected two additional times (total of 6 injections each per batch) followed by an additional extraction blank injection.
2.3.3. Confirmation analysis
An aliquot of MQW and three aliquots of reference urine were thawed. To two reference urine aliquots was added 10 μL of either a low- or high-concentration spiking solution, consisting of the analytes to confirm, and 20 μL methanol. To the third reference urine aliquot (“unfortified control”) and the MQW extraction blank was added 30 μL methanol. Then, to all samples was added 10 μL MQW, 75 μL 1 M ammonium acetate, and 200 μL of 1% formic acid in methanol. Tubes were capped, vortex mixed, and centrifuged at 17,000 ×g and 4 °C for 5 min, and supernatants transferred to amber HPLC vials.
Sequences began with two solvent blank injections followed by ten injections of the unfortified control with the MQW extraction blank injected partway through. Then, the low- and high-fortified controls were injected followed by injecting the MQW extraction blank again.
2.4. Instrumental analysis
Chromatography was performed with an UltiMate 3000 RSLCnano system (Thermo Scientific) equipped with an SRD-3400 solvent degasser, NCS-3500RS pump module with column oven, and WPS-3000TPL RS autosampler. The system was controlled by Xcalibur v4.1 software (Thermo Scientific, Waltham, MA, USA). Separations were achieved with a Hypersil GOLD C18 analytical column (150 mm × 1 mm i.d., 3 μm, Thermo Scientific) with a drop-in guard column (10 mm × 1 mm i.d., 3 μm) of the same stationary phase. Aqueous mobile phase (A) was 0.3 mM ammonium fluoride and organic mobile phase (B) was acetonitrile. A gradient elution was implemented with the following time program: 5% B from 0–1 min, 5–98% B from 1–16 min, 98% B from 16–22 min, 98–5% B from 22–22.1 min, and 5% B from 22.1–30 min. The %B increase from 5–98% was performed nonlinearly by changing the “curve” parameter from 5 to 8; this resulted in a shallower slope at the beginning of the step and a steeper slope at the end. The flow rate was 0.075 mL/min, column oven temperature was 40 °C, autosampler temperature was 10 °C, and injection volume was 5 μL. These LC parameters were used for all analyses.
Analytes were detected with a Q Exactive HF high-resolution mass spectrometer (Thermo Scientific) with a heated electrospray ionization (HESI) source. Mass calibrations were performed before each batch. For suspect screening, data were acquired in Full Scan/data-dependent MS2 mode operating with polarity switching. Complete method and source settings are detailed in Table S2. HRMS data for confirmation were collected in Full Scan followed by Parallel Reaction Monitoring (PRM, for generating fragmentation spectra) with polarity switching; HESI source, Full Scan, and MS2 settings were the same as for suspect screening.
2.5. Data processing
A relevant suspect screening list was generated using the U.S. Environmental Protection Agency’s CompTox Chemical Dashboard (henceforth “the Dashboard”) (26,27). A detailed explanation of the preparation of the final suspect list is provided in the SI; briefly, MS-Ready SMILES (28) were downloaded from the Dashboard for substances contained within relevant lists by using the “Send to Batch Search” function. Data from all lists were compiled into a single spreadsheet and, using an in-house R script, MS-Ready SMILES were converted to chemical formulas for import to the data processing software.
2.5.1. Processing of suspect screening data
Quan Browser software (v4.1, Thermo Scientific) was used to manually process the fortified controls to evaluate performance (e.g., peak area and retention time variability) across analytical batches.
Fortified controls and extraction blanks (for background subtraction) were processed with Compound Discoverer (v3.2, Thermo Scientific) to evaluate default workflow parameters as previously recommended (29,30). Then, extraction blanks (n=6 total), pooled QCs (coded for QC-based peak area correction, n=18 total), and all hairdresser (n=23 total) and office worker (n=17 total) specimens across all batches were submitted together for processing. Positive and negative mode data were processed separately. Full workflow parameters are given in Table S3.
Following processing, compounds either marked as coming from background or those that did not fulfill the QC-based peak area correction criteria were automatically filtered out of the results. The remaining compounds were further filtered to only include those that had MS2 data available; had a ratio of median group peak areas >1.5, calculated as hairdressers/office workers; and had at least one match, based on mass, in the in-house suspect list.
Tentative identifications were assigned based on available data, as detailed below, and given an associated confidence level based on previously published recommendations (31). Compounds with fragmentation data were searched against mzCloud and mzVault spectral libraries, and matches with a score ≥70 (as calculated by the software) were considered tentatively identified at confidence Level 2. If a compound had multiple matches that were positional isomers the confidence of the identification was lowered to Level 3.
For compounds without spectral library matches, tentative identifications were based on in-silico fragmentation performed with MetFragWeb (32) with candidates searched within the PubChemLite database (33). A detailed description of how candidates were retrieved and scored is provided in the SI. If a compound in the top 5 results matched a compound in the suspect screening list, that compound was used as the tentative identification with confidence Level 3. In the event multiple compounds within the top 5 results had matches on the suspect list, the highest-ranking compound was used.
Compounds with low-quality fragmentation data (e.g., only a single fragment present) or that did not have a top 5 MetFrag hit within the suspect list but did have a single high confidence predicted formula (see additional details below) were assigned Level 4. Finally, compounds with the same limitations as Level 4 compounds but that had >1 confident predicted formula were assigned Level 5.
2.5.2. Confirmation analysis
Quan Browser was used to process data from the confirmation analysis. A compound was considered confirmed if the retention time and fragmentation spectra between the fortified controls and pooled QC matched, and an increase in peak area was observed between the low- and high-concentration controls. Because reference urine was used for confirmation analysis, it was possible isomers of an analyte to be confirmed would be present; therefore, an increase in peak area between the low- and high-concentration controls at the same retention time as the peak in question proved the unknown peak was the same as the fortified compound.
2.5.3. Evaluating possible exposure sources
Data from the U.S. Environmental Protection Agency’s Chemical and Products Database (CPDat) (34) associated with detected compounds was used to help identify possible exposure sources (35). The CPDat includes publicly available information on consumer product compositions and chemical functional uses, as well as product categorizations. Product Use Categories (PUCs) (36) offer a generalized description of consumer products and are presented as unique combinations of 3 hierarchical categories, with the top level representing a general product category (e.g., personal care), the middle level representing a product family (e.g., hair styling and care) and the bottom level representing a product type (e.g., hair conditioner). We searched for PUCs associated with all Level 1 compounds and for Level 2–3 compounds with a median peak area ratio ≥2. If a PUC was identified for a compound detected in our study, the associated product represents a possible exposure source. For any compounds without identified PUCs, we searched for associated Harmonized Functional Uses. Harmonized Functional Uses (37) are harmonized categorizations of the functions of chemicals (e.g., fragrance, surfactant, solvent) in consumer products as reported by manufacturers. Identifying an associated Harmonized Functional Use for a compound does not indicate its presence in a specific product type but knowing how a compound may be used in a product can still be useful for assessing possible exposure sources.
3. Results
3.1. Suspect screening method performance
Performance data for analytes fortified into reference urine are summarized in Table 1. Mass accuracies across all analytical batches were within ±2 ppm except for two low-mass analytes in negative mode: 1-naphthol (m/z 143.05024, ±2.53 ppm) and thymol (m/z 149.09718, ±2.35 ppm). During processing of the first analytical batch an instrumental error occurred before the entire batch was finished, requiring re-injection of the sequence. Data are presented below in two ways: combined across all 3 batches to demonstrate the total inter-batch variability, and across batches 2–3 only to demonstrate the decrease in inter-batch variability without batch 1 (the intra-batch CV% for batch 1 is also given). Peak area CV% were generally higher when data from all three batches were considered together (n = 18), but only six compounds had CV% >30% and only three compounds had CV% >40%. When looking at peak areas in batch 1 only (n = 6) CV% were all ≤13.7%, and when looking at batches 2 and 3 together (n = 12) peak area CV% were all ≤18.6% except for sulfamethazine (28.6%). Additionally, retention times across all batches were generally stable.
Table 1.
Performance characteristics of QC analytes fortified in a urine control. A separate urine aliquot was processed in each batch (n = 3 batches) and injected 6× throughout the batch for a total of 18 data points.
| Name | Adduct | Δmass, range, all batches (ppm) | Peak Area CV%, all batches | Peak Area CV%, batch 1 (n = 6) | Peak Area CV%, batches 2 & 3 (n = 12) | Mean Retention Time (min), all batches (CV%) |
|---|---|---|---|---|---|---|
| quinoline | [M+H]+ | −0.31 – 1.23 | 21.3 | 6.4 | 6.0 | 14.85 (1.7) |
| 6-methylcoumarin | [M+H]+ | −0.75 – 0.06 | 17.5 | 13.7 | 18.6 | 17.16 (0.3) |
| acetamiprid | [M+H]+ | −1.12 – −0.18 | 31.3 | 1.5 | 9.0 | 13.46 (0.6) |
| carbamazepine | [M+H]+ | −0.67 – 0.63 | 13.7 | 4.7 | 5.3 | 17.42 (0.1) |
| imidacloprid | [M+H]+ | −1.72 – −0.39 | 40.5 | 7.1 | 15.9 | 12.01 (0.8) |
| sulfamethazine | [M+H]+ | −1.50 – −0.64 | 94.9 | 1.1 | 28.6 | 8.99 (7.6) |
| buspirone | [M+H]+ | −1.55 – −0.54 | 6.0 | 7.1 | 5.0 | 20.24 (5.5) |
| 1-naphthol | [M-H]− | 1.96 – 2.53 | 24.7 | 4.3 | 8.1 | 18.24 (0.2) |
| thymol | [M-H]− | 2.28 – 2.35 | 22.5 | 10.5 | 11.9 | 19.47 (0.1) |
| bisphenol F | [M-H]− | 1.76 – 1.81 | 25.3 | 7.8 | 6.1 | 17.22 (0.2) |
| 2,4-D | [M-H]− | 1.14 – 1.64 | 31.9 | 4.7 | 11.4 | 8.20 (44.4) |
| bisphenol A | [M-H]− | 1.19 –1.50 | 27.5 | 6.3 | 7.5 | 18.50 (0.1) |
| bisphenol S | [M-H]− | 0.44 – 0.76 | 29.4 | 4.7 | 5.3 | 13.56 (4.8) |
| hesperetin | [M-H]− | 0.86 – 1.06 | 37.1 | 12.7 | 5.1 | 16.89 (3.3) |
| diflubenzuron | [M-H]− | 1.00 – 1.29 | 14.5 | 5.1 | 8.3 | 19.76 (0.1) |
| chloramphenicol | [M-H]− | 1.00 – 1.28 | 24.6 | 4.0 | 6.5 | 14.59 (0.6) |
| furosemide | [M-H]− | 0.88 – 1.25 | 41.4 | 6.8 | 8.3 | 9.90 (29.6) |
| boscalid | [M-H]− | 1.35 – 1.61 | 25.3 | 9.2 | 7.0 | 19.56 (0.1) |
| 2,4,6-triiodophenol | [M-H]− | 1.10 – 1.30 | 25.4 | 5.4 | 5.3 | 19.63 (3.0) |
In addition to the mixed-analyte QC solution, 4-MUBG was added to the fortified control to evaluate reproducibility of the enzymatic cleavage step across batches by monitoring peak areas of the deconjugated product, 4-methylumbelliferone (4-MUB). Peak area CV% for 4-MUB was 23.4% across all batches (4.0% in batch 1 and 6.6% across batches 2 and 3). Finally, the internal standard, which was added to all fortified control, pooled QC, and participant samples, had a peak area CV% of 22.2% when all batches were considered together (n = 76), and had a peak area CV% of 10.5% in batch 1 (n = 26) and 11.0% across batches 2 and 3 (n = 50).
3.2. Compound Discoverer workflow
The workflow detected 14 of 19 compounds from the QC solution. Furosemide was only detected in batch 1 with data from batches 2 and 3 below the minimum peak intensity threshold. Of the five compounds that were not detected at all, three (6-methylcoumarin, sulfamethazine, and 2,4-D) were present below the intensity threshold. Intensities for the other two (thymol and hesperetin) were above the threshold but were not chromatographically resolved from endogenous compounds, resulting in integrations across multiple peaks (considered here as not detected). Adjustments to peak integrations in the software were not possible because the parameters are not available to the end user.
Of the 13 QC compounds detected in data files from all 3 batches described above (furosemide excluded), the processing workflow was able to group features across all 3 batches for 10 compounds. Grouping was improved when the Maximum Shift parameter of the Align Retention Time node was changed from the default of 2 min to 1 min. For example, the peaks for diflubenzuron were not all initially grouped together, despite the actual retention time CV% being 0.1% across the 3 batches, but grouping was improved after parameter adjustment. The 3 compounds for which peaks across all batches were not grouped (buspirone, bisphenol S, and 2,4,6-triiodophenol) were among those with higher retention time CV% across all batches (Table 1), ranging from 3.0–5.5%. The RT tolerance parameter in the Group Compounds node, set to 0.5 min, was likely too low to account for the variability. However, increasing the value too high could result in closely eluting isomers being grouped together.
Predicted molecular formulas were available for 11 of 14 detected compounds in the QC mixture, and the top-ranked predicted formula was the correct formula for all 11 compounds. Three compounds had only 1 predicted formula (those with the 3 smallest molecular weights), five compounds had between 2–9 predicted formulas, and three compounds had 10 predictions (the maximum number allowed by the workflow). While the top-ranked predicted formula was the correct formula for all detected compounds in this mixture, that may not always be the case for other compounds.
The SFit%, a similarity score between the theoretical and measured isotope pattern, was automatically calculated for all predicted formulas for a given compound. The correct formula had the highest SFit% for 9 of 11 compounds. In other words, the predicted formula with the highest Sfit% was not the correct formula for 2 compounds: chloramphenicol and boscalid. The Search ChemSpider node searched all predicted formulas for a given compound and indicated whether the formula was found in the database; when formulas for chloramphenicol and boscalid were searched, the correct formula had the highest Sfit% when only looking at formulas which were found in ChemSpider. Formula ranks are based on several factors, but the software’s exact algorithm is unknown. An alternative approach to relying on the software’s calculated rank could be filtering the list of predicted formulas to only those found in a database and then choosing the one with the highest Sfit%. This method was used to assign molecular formulas for Level 4 compounds (see above).
3.3. Suspect screening and confirmation analyses
Table S4 summarizes the number of compounds initially detected by the workflow in each polarity mode, and the number of compounds remaining after filtering. After all rule-based filtering steps described above, 141 and 129 compounds remained in positive and negative mode, respectively. After a manual quality review of these compounds, 38 and 28 compounds remained in positive and negative mode, respectively (66 total). Principal component analysis was performed automatically by the processing software, and score plots for participant samples based on these filtered compounds are depicted in Figure 1; in both modes the combined variance explained by PCs 1 and 2 was ~40%.
Figure 1.

Principal component analysis score plots showing distribution of hairdressers (n=23), office worker controls (n=17), and pooled QC specimens (n=18) following filtering of compounds for positive (final n = 38 compounds) and negative (final n = 28 compounds) mode data.
The experimental data for these compounds were evaluated to assign confidence levels and the results are summarized in Table S5. Five compounds were confirmed in urine specimens (Level 1)—methylparaben, ethylparaben, propylparaben, capsaicin, and 2-naphthol—and 3 compounds (oleamide, eicosapentaenoic acid, and isoquinoline) were detected at Level 2 confidence based on spectral library matches. Most detected compounds (37/66, 56.1%) were detected with Level 3 confidence, and over half of these compounds (29/37, 78.4%) were ranked either #1 or #2 in the MetFrag analysis. Some compound names appear twice, e.g., camphor, likely indicating isomers for which the same name was assigned according to the procedure detailed above. There were 19 Level 4 compounds for which a confident molecular formula was determined but no structural determination was made due to either a low-quality fragmentation spectrum or none of the top 5 MetFrag matches were present on the suspect screening list. Finally, two Level 5 compounds were detected which had the same limitations as the Level 4 compounds, but a single confident molecular formula could not be determined.
3.4. Product use categories and harmonized functional uses
PUCs available from the CPDat were searched for confirmed compounds and for Level 2–3 compounds with median peak area ratios ≥2; there were 24 compounds for which PUC data were searched and 13 had data available. There were 131 unique PUCs associated with the 13 compounds (a single compound can be mapped to multiple PUCs). The 131 unique PUCs were distributed across 15 different general product categories, shown in Figure 2. “Personal care” contained the greatest number of unique PUCs (79/131, 60.3%), and 8 of 13 compounds (61.5%) were associated with at least one PUC within the “personal care” category. The hierarchical organization of these “personal care” PUCs is shown in the insert in Figure 2. Product families containing the most product types were “make-up and related” and “hair styling and care”. There were 11 product types observed within “hair styling and care”: hair conditioner, hair conditioner – leave in, hair conditioning treatment, hair relaxer, hair spray, hair styling, shampoo, dry shampoo, lice shampoo, shampoo – dandruff, and general (products that could not be classified into a more specific category). The detected compounds that were associated with each product type are summarized in Table 2.
Figure 2.
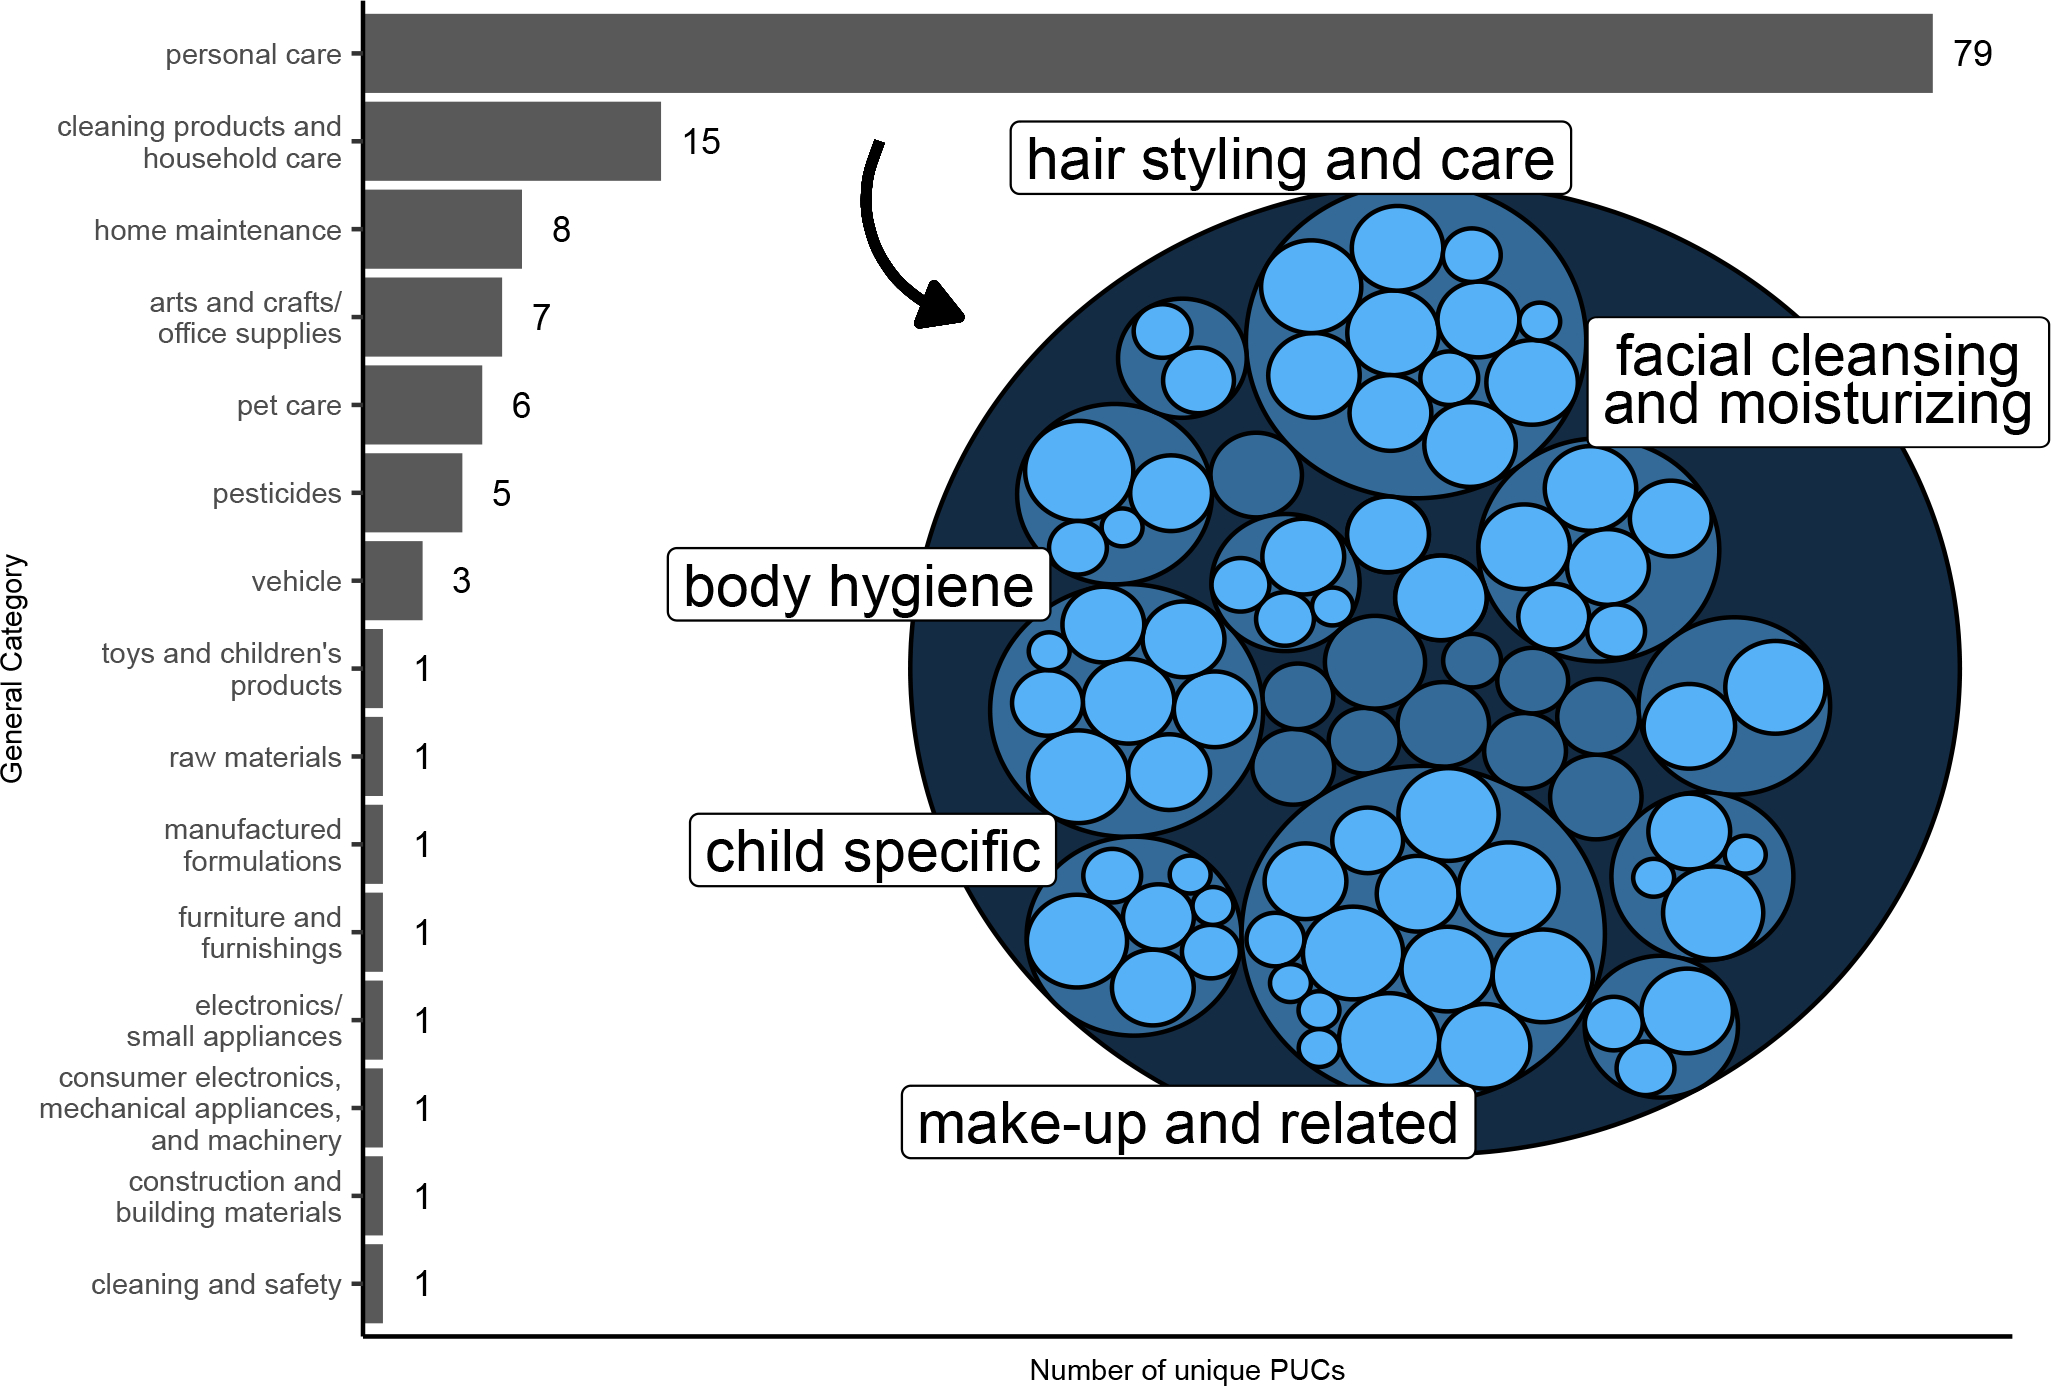
Main plot: Number of unique observed product use categories (PUCs) that are grouped within each unique general category for 13 selected select compounds (see manuscript text for compound selection). A single PUC is a unique combination of 3 hierarchical levels: general category (top level), product family (middle level), and product type (bottom level). An example of a full PUC is: personal care, hair styling and care, hair shampoo. This PUC would be grouped into the “personal care” general category. Insert: The hierarchical organization of PUCs grouped within the “personal care” general category. Darker blue circles represent middle-level product family designations and light blue circles represent bottom-level product types. For example, there are 11 specific product types (e.g., hair shampoo, hair conditioner, etc.) within the product family “hair styling and care”. The product families with the 5 largest number of product types are labeled. Circle size is proportional to how many of the 13 compounds were associated with that product family or type.
Table 2.
Compounds assigned to product use categories with a general product category “personal care” and a product family “hair styling and care”.
| Product Type | Compounds |
|---|---|
| Hair conditioner – leave in | Methylparaben, ethylparaben, propylparaben, linalool, 3-[(2-ethylhexyl)oxy]propane1,2-diol |
| Hair styling | Methylparaben, ethylparaben, propylparaben, linalool, 3-[(2-ethylhexyl)oxy]propane1,2-diol |
| Shampoo | Methylparaben, ethylparaben, propylparaben, linalool, camphor, 3-[(2-ethylhexyl)oxy]propane1,2-diol |
| General | Methylparaben, propylparaben, linalool, camphor, 3-[(2-ethylhexyl)oxy]propane1,2-diol |
| Hair conditioning treatment | Methylparaben, propylparaben, linalool, 3-[(2-ethylhexyl)oxy]propane1,2-diol |
| Hair relaxer | Methylparaben, linalool |
| Hair spray | Methylparaben, propylparaben, linalool, 3-[(2-ethylhexyl)oxy]propane1,2-diol |
| Lice shampoo | Methylparaben, propylparaben |
| Shampoo – dandruff | Methylparaben, propylparaben, linalool, camphor, 3-[(2-ethylhexyl)oxy]propane1,2-diol |
| Hair conditioner | Methylparaben, propylparaben, linalool, camphor, 3-[(2-ethylhexyl)oxy]propane1,2-diol |
| Dry shampoo | linalool |
Of the 11 compounds that did not have PUC data, 7 had available Harmonized Functional Use data. Figure 3 summarizes the unique Harmonized Functional Uses observed and the detected compounds associated with each use. Table 3 summarizes the different manufacturer-reported functional uses that were clustered within each Harmonized Functional Use (e.g., reported functional uses “perfuming” and “fragrance component” were both grouped into the harmonized functional use “Fragrance”).
Figure 3.
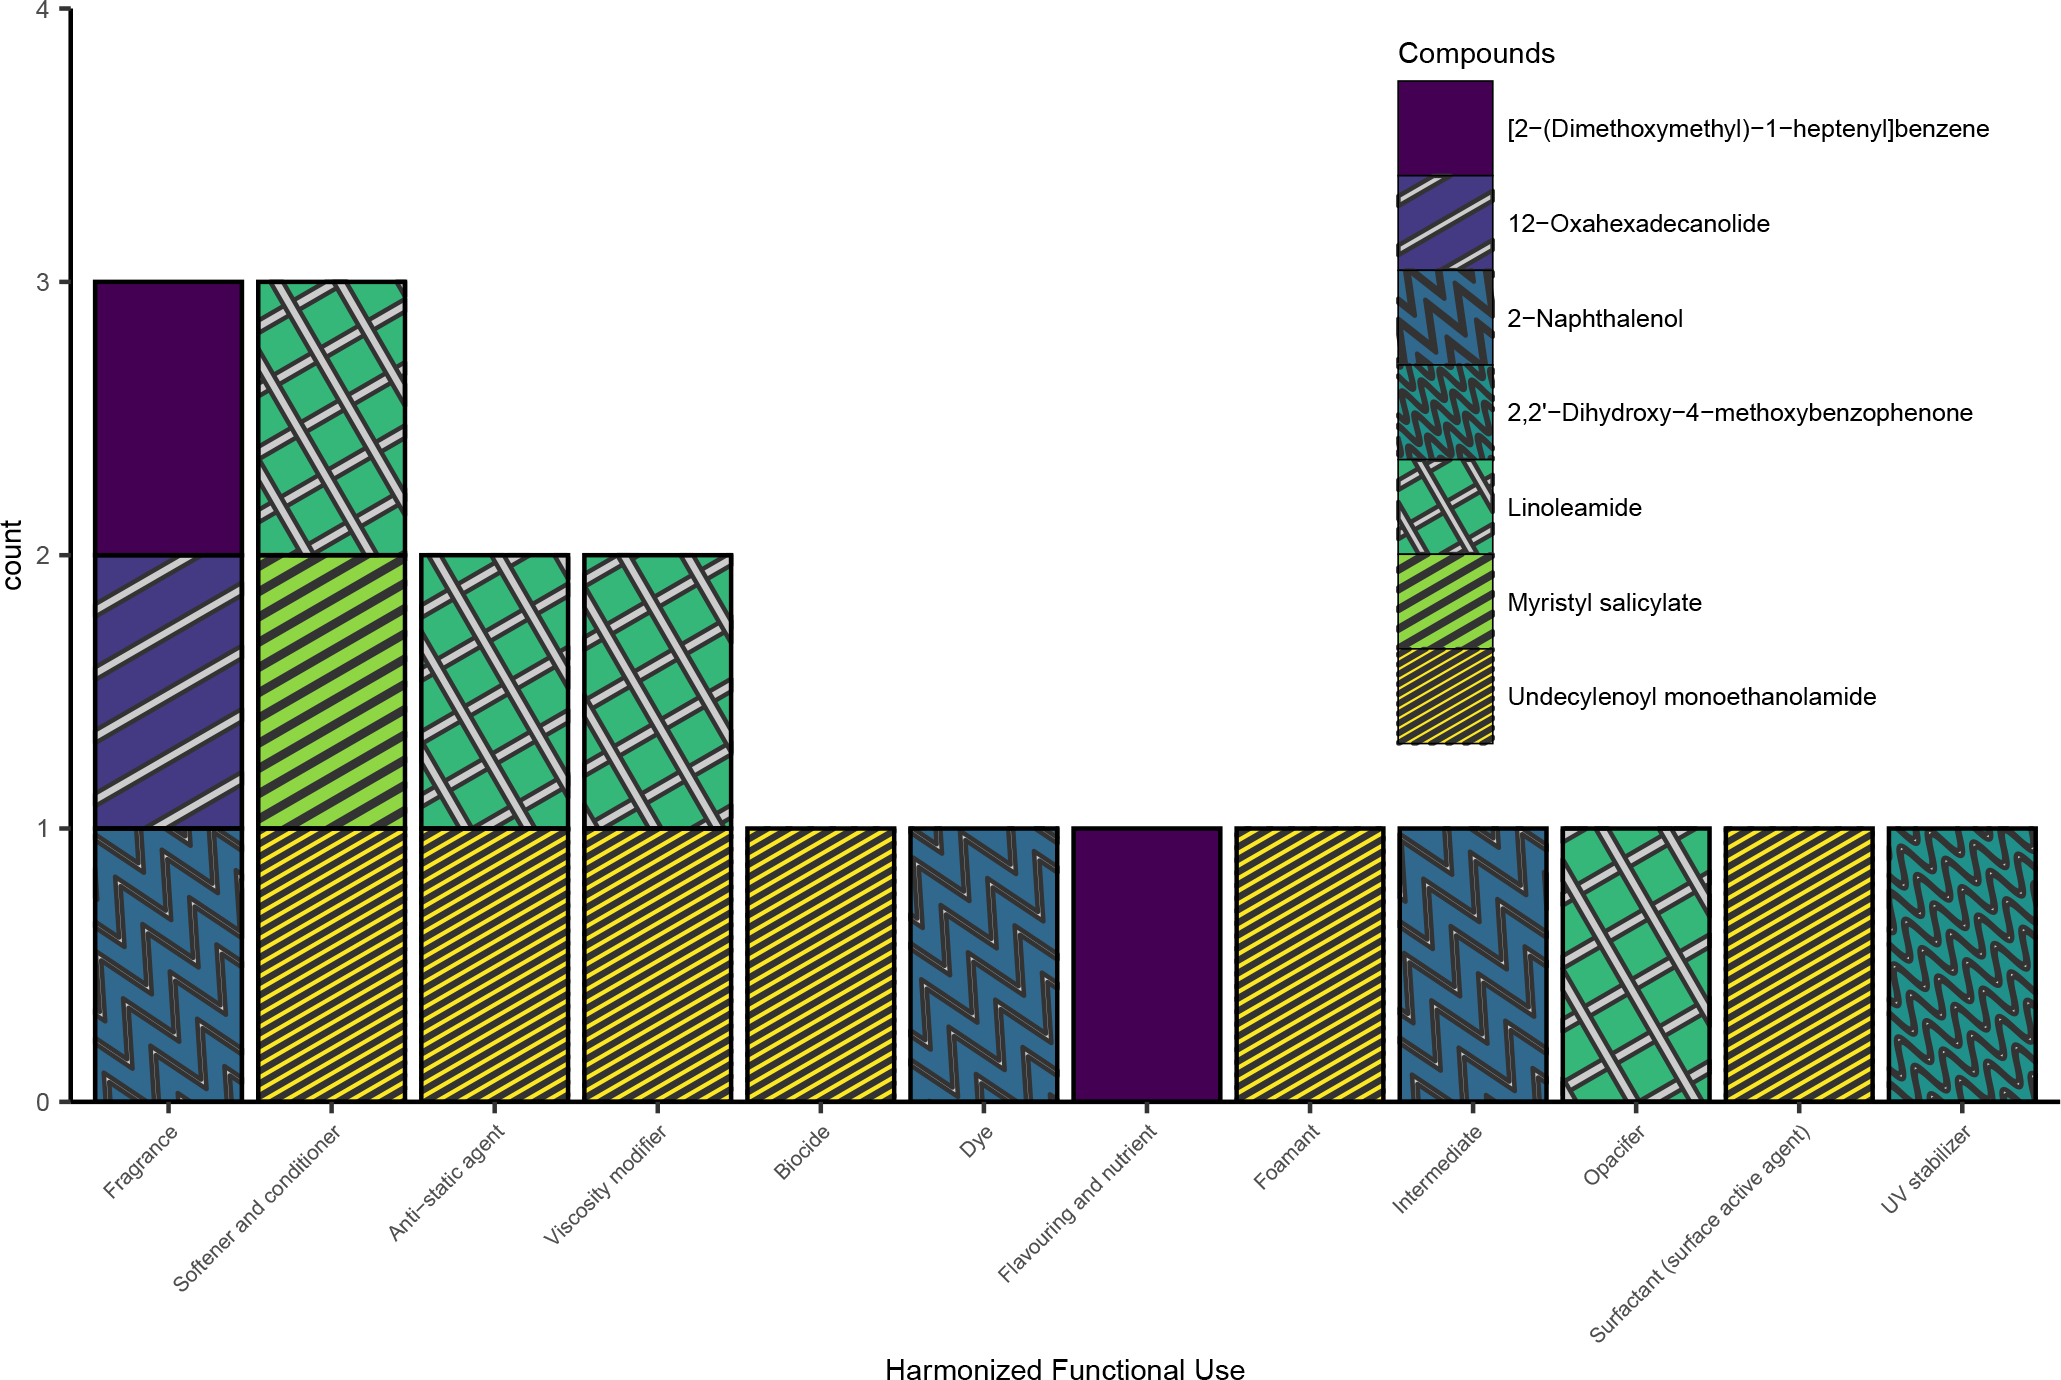
Number of compounds associated with specific Harmonized Functional Uses. Seven compounds are included for which no associated Product Use Category data was available. Bars are colored and filled to indicate which specific compound was associated with each use.
Table 3.
Harmonized and reported functional uses for compounds for which no product use information data was available.
| Harmonized Functional Use | Reported Functional Uses |
|---|---|
| Fragrance | Perfuming, fragrance component |
| Softener and conditioner | Hair conditioning, skin conditioning |
| Anti-static agent | Antistatic |
| Viscosity modifier | viscosity controlling |
| Biocide | antimicrobial |
| Dye | Hair dyeing |
| Flavouring and nutrient | Flavouring, flavor enhancer, flavoring agent or adjuvant |
| Foamant | Foam boosting |
| Intermediate | Intermediate substance in pigment production |
| Opacifer | Opacifying |
| Surfactant (surface active agent) | Surfactant |
| UV stabilizer | UV absorber, light stabilizers/UV absorbers, light stabilizers/UV absorbers > benzophenones |
4. Discussion
This work describes the implementation of a suspect screening method for studying occupational chemical exposures among a group of U.S.-based hairdressers. Due to the analytical approach employed, care was taken to incorporate various recommended quality assurance and quality control practices (22–24,29,30). Specimen processing was minimized to detect as many compounds as possible, but this caused a large amount of matrix to be injected on the instrument in each batch. Therefore, specimens were analyzed over multiple batches to allow for periodic cleaning and calibration (22).
The method was monitored with a fortified matrix-matched control which was analyzed multiple times during each batch. The reproducible peak areas and retention times, as well as low mass errors, lend confidence to the method performance. Additionally, the participant specimens were proportionally distributed across the multiple batches as previously recommended (22), so any inter-batch variability did not disproportionately affect only one study group. An additional benefit of including the fortified control was its inclusion in assessing the data processing workflow (29,30). For example, we were able to adjust default parameters that improved grouping of peaks. We also were able to identify limitations of the workflow, for example the inability to adjust integration parameters that resulted in integration across unresolved peaks, highlighting that chromatography is still an important consideration in nontargeted analyses (38).
Figure 1 shows the hairdressers were spread across the length of PC1, with some participants overlapping with the comparison group, while the office workers were more tightly clustered. Differences in products used, services provided, and use of personal protective equipment were reported for these hairdressers (21) and could contribute, in part, to the variability observed by PCA. Additional factors could include differences in products used outside the workplace for personal use, the number of clients served, the specific services performed on the day of specimen collection, and the timing of services relative to the post-shift urine collection. For example, exposure to a compound with a short half-life may not be detected if a product containing that compound was only used at the beginning of a shift.
Detected compounds were associated with 131 unique PUCs distributed across 15 different general product categories. The second largest general category, in terms of number of unique PUCs observed, was “cleaning products and household care” and included products such as carpet and floor cleaners, bathroom cleaners, air fresheners, and disinfectants. This group of products could represent additional sources of occupational chemical exposures among hairdressers beyond products used to provide services to clients. For example, allyl ionone, the level 3 compound with the highest median peak area ratio between hairdressers and office workers, is associated with air fresheners.
Most observed PUCs belonged to the “personal care” general category. Personal care products are overrepresented in the CPDat due to more rigorous U.S. Food and Drug Administration reporting criteria (34). However, this could be seen as an advantage as this group’s occupation likely skews more heavily towards using these products, and because women of color are reported to use a wider variety of hair care products and with more frequency compared to White women (2). “Hair styling and care” was the second largest product family among the “personal care” general category, in terms of number of product types mapped to detected compounds. Only 6 unique compounds were associated with the different product types observed within this product family and all were associated with multiple products (Table 2); among these compounds were methylparaben, ethylparaben, and propylparaben. Parabens are widely used preservatives in personal care products, may act as endocrine-disrupting chemicals, and represent a potentially important class of compounds in this worker population (2,39).
Harmonized functional uses data provide some evidence that a chemical may be present in certain products based on its use (37). 2-Naphthol was associated with three harmonized functional uses: “fragrance”, “dye”, and “intermediate”; the reported uses that were mapped to the harmonized uses “dye” and “intermediate” were “hair dyeing” and “Intermediate substance in pigment production”, respectively (Table 3). On the day of specimen collection 17.4% of hairdressers performed semi-permanent coloring services and 21.7% performed permanent hair coloring services (21). Further work is needed to properly interpret urinary detection of 2-naphthol. For example, 2-naphthol is a urinary biomarker of naphthalene exposure (40) which has been detected in hair salons (9), but 2-naphthol could also indicate exposure to chemicals in hair dyeing products according to the functional use evidence. As such, urinary 2-naphthol detection may indicate exposure to chemicals from a variety of sources. Additionally, 2,2’-hydroxy-4-methoxybenzophenone (benzophenone-8) had a harmonized functional use “UV stabilizer” and could be present in products as an intended ingredient, but it is also a metabolite of benzophenone-3 (41), which was previously detected in a hair relaxer product (1). Improving the characterization of these exposures is necessary for proper interpretation of urinary biomarker results and improved risk assessments.
There are some inherit limitations in this analysis that should be noted when interpreting these data. Specimen preparation was minimized to expand the number of analytes detected, but as a result some analytes may not be detected due to sensitivity issues caused by low concentrations or matrix effects. While more thorough specimen preparations are routinely employed for targeted analyses, these can severely bias the compounds detected. Compound confirmation is also not possible in all cases due to limitations in reference material availability. However, Level 2 compounds were based on matches to mzCloud, a Thermo Scientific-specific spectral database in which analytes are measured across various collision energies on similar instruments to the one used in this study; this is the highest confidence annotation possible in this analysis without confirmation. Possible annotations for Level 3 compounds were searched within a large database, but only annotations within the top 5 hits that were present in the screening list were considered, and including metadata terms in the rank scoring was shown to improve candidate ranking performance (33); most level 3 compounds listed in Table S5 were ranked #1 or #2. For this pilot study we prioritized compounds that were detected initially with MS2 spectra to facilitate structural determinations. Potential compounds of interest that did not initially have MS2 spectra collected would be missed with this approach, but it is possible to re-analyze specimens to collect missing MS2 spectra if necessary. An extensive suspect screening list was employed in this analysis to filter and prioritize detected compounds. However, there are other compounds that passed the QC correction, MS2, and median group area filtering requirements but were not present on the suspect list. While some of these compounds are likely metabolites of various exposed chemicals, some of them may be other compounds of interest.
Since the suspect screening list was created from lists of known chemicals, these other compounds may be known compounds from classes not included in the lists or previously unknown chemicals. Finally, collection of a single urine specimen may have limited which compounds could be detected compared to urine collection across several days due to day-to-day variability in services performed and short half-lives for many compounds.
To our knowledge, this is the first study to use a suspect screening approach to assess occupational chemical exposures among this worker population. This approach allowed us to detect compounds not previously reported among hairdressers. Additionally, due to this methodological approach, care was taken to implement several recommended quality assurance and control measures. We also focused on exposures among minority U.S.-based hairdressers serving an ethnically diverse clientele for which data are limited. Further, we provide evidence for possible sources of exposures based on a novel evaluation of Product Use Categories and Harmonized Functional Uses. This evidence is based on publicly available data, so some information on specific products may be missing (34) due to reporting regulations (e.g., not fully disclosing ingredients due to a proprietary formulation) or if a product was not included in the original data sources (e.g., because it was imported from a country where data wasn’t included in the database). Therefore, it will be important to follow up these biomonitoring results with additional analyses in which products known to be used in the salons are tested to identify compounds present. These data will improve characterization of occupational chemical exposures in this workforce which can lead to better risk mitigation strategies and reduce potential work-related health disparities.
Supplementary Material
Impact statement:
Limited studies have investigated occupational chemical exposures among minority hairdressers serving an ethnically diverse clientele. The products used to serve these clienteles can result in a unique mixture of potentially hazardous chemicals, placing workers at an increased risk of adverse health risks. We implemented a suspect screening method to analyze urine specimens from a sample of US-based Black and Latina hairdressers. Compounds present in higher abundance among hairdressers compared to office workers were associated with several hair care product types with functional uses including fragrance, dye, and UV stabilizer. These results will help guide future studies to improve characterization of hairdressers’ occupational chemical exposures.
Acknowledgements
We would like to thank the hair salon owners, hairdressers, and office staff at the University of Maryland who participated in this study. We would also like to thank Centro de Apoyo Familiar and the UMD H.A.I.R. network for their assistance with our recruitment efforts as well as our student interns (Lucy Aistis, Mireim Alibrahim, Ruth Cachola, Seyrona McLean, Surbhi Sardana, and Angela Sun) who helped with sample processing and data entry. We would like to thank the Johns Hopkins NIOSH-funded Educational Research Center and the Wait Family for their support. We also thank Dr. Kristin Isaacs from the U.S. EPA for assistance with the Product Use Category and Harmonized Functional Use data.
Funding
Lesliam Quirós-Alcalá was supported by an NHLBI Career Development Award (K01HL138124); Matthew N. Newmeyer was supported by NIEHS Training grant (T32 ES 007141). This research was supported by a grant from the U.S. Centers for Disease Control and Prevention (CDC), National Institute for Occupational Safety and Health to the Johns Hopkins Education and Research Center for Occupational Safety and Health (award number T42 OH0008428). The findings and conclusions in this manuscript are those of the authors and do not necessarily represent the official position or views of the NIH or CDC.
Footnotes
Competing Interests
The authors declare no competing interests
Ethical Approval
All study protocols were reviewed and approved by the University of Maryland’s Institutional Review Board (ref. # 1076658–17). All participants provided written informed consent.
Data availability
Data will be made available upon reasonable request.
References
- 1.Helm JS, Nishioka M, Brody JG, Rudel RA, Dodson RE. Measurement of endocrine disrupting and asthma-associated chemicals in hair products used by Black women. Environ Res. 2018;165:448–458. [DOI] [PubMed] [Google Scholar]
- 2.James-Todd T, Senie R, Terry MB. Racial/ethnic differences in hormonally-active hair product use: A plausible risk factor for health disparities. J Immigr Minor Healt. 2012;14(3):506–511. [DOI] [PubMed] [Google Scholar]
- 3.Wise LA, Palmer JR, Reich D, Cozier YC, Rosenberg L. Hair relaxer use and risk of uterine leiomyomata in African-American women. Am J Epidemiol. 2012;175(5):432–440. [DOI] [PMC free article] [PubMed] [Google Scholar]
- 4.Stiel L, Adkins-Jackson PB, Clark P, Mitchell E, Montgomery S. A review of hair product use on breast cancer risk in African American women. Cancer Med-US. 2016;5(3):597–604. [DOI] [PMC free article] [PubMed] [Google Scholar]
- 5.U.S. Bureau of Labor Statistics. BLS Data Finder. https://beta.bls.gov/dataQuery/find?st=0&r=20&q=hairdressers&more=0&fq=survey:[ln]. Accessed 25 Aug 2022.
- 6.Quiros-Alcala L, Pollack AZ, Tchangalova N, DeSantiago M, Kavi LKA. Occupational exposures among hair and nail salon workers: A scoping review. Curr Envir Health Rep. 2019;6(4):269–285. [DOI] [PubMed] [Google Scholar]
- 7.de Gennaro G, de Gennaro L, Mazzone A, Porcelli F, Tutino M. Indoor air quality in hair salons: Screening of volatile organic compounds and indicators based on health risk assessment. Atmos Environ. 2014;83:119–126. [Google Scholar]
- 8.Louis LM, Kavi LK, Boyle M, Pool W, Bhandari D, De Jesús VR, et al. Biomonitoring of volatile organic compounds (VOCs) among hairdressers in salons primarily serving women of color: A pilot study. Environ Int. 2021;154:106655–106670. [DOI] [PMC free article] [PubMed] [Google Scholar]
- 9.Kaikiti C, Stylianou M, Agapiou A. TD-GC/MS analysis of indoor air pollutants (VOCs, PM) in hair salons. Chemosphere. 2022;294:133691–133701. [DOI] [PubMed] [Google Scholar]
- 10.Wang LH, Tsai SJ. Simultaneous determination of oxidative hair dye p-phenylenediamine and its metabolites in human and rabbit biological fluids. Anal Biochem. 2003;312(2):201–207. [DOI] [PubMed] [Google Scholar]
- 11.Hueber-Becker F, Nohynek GJ, Dufour EK, Meuling WJA, de Bie AThHJ, Toutain H, et al. Occupational exposure of hairdressers to [14C]-para-phenylenediamine-containing oxidative hair dyes: A mass balance study. Food Chem Toxicol. 2007;45(1):160–169. [DOI] [PubMed] [Google Scholar]
- 12.Schettgen T, Heinrich K, Kraus T, Gube M. Determination of 2,5-toluylenediamine (2,5-TDA) and aromatic amines in urine after personal application of hair dyes: kinetics and doses. Arch Toxicol. 2011;85(2):127–133. [DOI] [PubMed] [Google Scholar]
- 13.Gube M, Heinrich K, Dewes P, Brand P, Kraus T, Schettgen T. Internal exposure of hairdressers to permanent hair dyes: a biomonitoring study using urinary aromatic diamines as biomarkers of exposure. Int Arch Occup Environ Health. 2011;84(3):287–292. [DOI] [PubMed] [Google Scholar]
- 14.Hooff GP, Huizen NA van, Meesters RJW, Zijlstra EE, Abdelraheem M, Abdelraheem W, et al. Analytical investigations of toxic p-phenylenediamine (PPD) levels in clinical urine samples with special focus on MALDI-MS/MS. PLOS ONE. 2011;6(8):e22191–e22198. [DOI] [PMC free article] [PubMed] [Google Scholar]
- 15.Kolena B, Petrovičová I, Šidlovská M, Pilka T, Neuschlová M, Valentová I, et al. Occupational phthalate exposure and health outcomes among hairdressing apprentices. Hum Exp Toxicol. 2017;36(10):1100–1112. [DOI] [PubMed] [Google Scholar]
- 16.Kolena B, Petrovicova I, Sidlovska M, Hlisnikova H, Tomasovova E, Zoldakova V, et al. Phthalates exposure and occupational symptoms among Slovakian hairdressing apprentices. Appl Sci. 2019;9(16):3321–3335. [Google Scholar]
- 17.Arfaeinia H, Ramavandi B, Yousefzadeh S, Dobaradaran S, Ziaei M, Rashidi N, et al. Urinary level of un-metabolized parabens in women working in beauty salons. Environ Res. 2021;200:111771–111779. [DOI] [PubMed] [Google Scholar]
- 18.Andra SS, Austin C, Patel D, Dolios G, Awawda M, Arora M. Trends in the application of high-resolution mass spectrometry for human biomonitoring: An analytical primer to studying the environmental chemical space of the human exposome. Environ Int. 2017;100:32–61. [DOI] [PMC free article] [PubMed] [Google Scholar]
- 19.Pourchet M, Debrauwer L, Klanova J, Price EJ, Covaci A, Caballero-Casero N, et al. Suspect and non-targeted screening of chemicals of emerging concern for human biomonitoring, environmental health studies and support to risk assessment - From promises to challenges and harmonisation issues. Environ Int. 2020;139:105545–105557. [DOI] [PubMed] [Google Scholar]
- 20.Guo Z, Huang S, Wang J, Feng YL. Recent advances in non-targeted screening analysis using liquid chromatography - high resolution mass spectrometry to explore new biomarkers for human exposure. Talanta. 2020;219:121339–121354. [DOI] [PubMed] [Google Scholar]
- 21.Boyle MD, Kavi LK, Louis LM, Pool W, Sapkota A, Zhu L, et al. Occupational exposures to phthalates among Black and Latina U.S. hairdressers serving an ethnically diverse clientele: A pilot study. Environ Sci Technol. 2021;55(12):8128–8138. [DOI] [PubMed] [Google Scholar]
- 22.Dunn WB, Wilson ID, Nicholls AW, Broadhurst D. The importance of experimental design and QC samples in large-scale and MS-driven untargeted metabolomic studies of humans. Bioanalysis. 2012;4(18):2249–2264. [DOI] [PubMed] [Google Scholar]
- 23.Broadhurst D, Goodacre R, Reinke SN, Kuligowski J, Wilson ID, Lewis MR, et al. Guidelines and considerations for the use of system suitability and quality control samples in mass spectrometry assays applied in untargeted clinical metabolomic studies. Metabolomics. 2018;14(72). [DOI] [PMC free article] [PubMed] [Google Scholar]
- 24.Caballero-Casero N, Belova L, Vervliet P, Antignac JP, Castaño A, Debrauwer L, et al. Towards harmonized criteria in quality assurance and quality control of suspect and non-target LC-HRMS analytical workflows for screening of emerging contaminants in human biomonitoring. TrAC Trend Anal Chem. 2021;116201–116214. [Google Scholar]
- 25.Frigerio G, Moruzzi C, Mercadante R, Schymanski EL, Fustinoni S. Development and application of an LC-MS/MS untargeted exposomics method with a separated pooled quality control strategy. Molecules. 2022;27(8):2580–2594. [DOI] [PMC free article] [PubMed] [Google Scholar]
- 26.Williams AJ, Grulke CM, Edwards J, McEachran AD, Mansouri K, Baker NC, et al. The CompTox Chemistry Dashboard: A community data resource for environmental chemistry. J Cheminformatics. 2017;9(1):61–87. [DOI] [PMC free article] [PubMed] [Google Scholar]
- 27.Lowe CN, Williams AJ. Enabling high-throughput searches for multiple chemical data using the U.S.-EPA CompTox Chemicals Dashboard. J Chem Inf Model. 2021;61(2):565–570. [DOI] [PMC free article] [PubMed] [Google Scholar]
- 28.McEachran AD, Mansouri K, Grulke C, Schymanski EL, Ruttkies C, Williams AJ. “MS-Ready” structures for non-targeted high-resolution mass spectrometry screening studies. J Cheminformatics. 2018;10(1):45–60. [DOI] [PMC free article] [PubMed] [Google Scholar]
- 29.Knolhoff AM, Premo JH, Fisher CM. A proposed quality control standard mixture and its uses for evaluating nontargeted and suspect screening LC/HR-MS method performance. Anal Chem. 2021;93(3):1596–1603. [DOI] [PubMed] [Google Scholar]
- 30.Sobus JR, Grossman JN, Chao A, Singh R, Williams AJ, Grulke CM, et al. Using prepared mixtures of ToxCast chemicals to evaluate non-targeted analysis (NTA) method performance. Anal Bioanal Chem. 2019;411(4):835–851. [DOI] [PMC free article] [PubMed] [Google Scholar]
- 31.Schymanski EL, Jeon J, Gulde R, Fenner K, Ruff M, Singer HP, et al. Identifying small molecules via high resolution mass spectrometry: Communicating confidence. Environ Sci Technol. 2014;48(4):2097–2098. [DOI] [PubMed] [Google Scholar]
- 32.Ruttkies C, Schymanski EL, Wolf S, Hollender J, Neumann S. MetFrag relaunched: incorporating strategies beyond in silico fragmentation. J Cheminform. 2016;8(1):3–18. [DOI] [PMC free article] [PubMed] [Google Scholar]
- 33.Schymanski EL, Kondić T, Neumann S, Thiessen PA, Zhang J, Bolton EE. Empowering large chemical knowledge bases for exposomics: PubChemLite meets MetFrag. J Cheminformatics. 2021;13(1):19–33. [DOI] [PMC free article] [PubMed] [Google Scholar]
- 34.Dionisio KL, Phillips K, Price PS, Grulke CM, Williams A, Biryol D, et al. The Chemical and Products Database, a resource for exposure-relevant data on chemicals in consumer products. Sci Data. 2018;5(1):180125–180133. [DOI] [PMC free article] [PubMed] [Google Scholar]
- 35.Williams A. The Chemical and Products Database (CPDat) MySQL Data File. 2017. doi.org/ 10.23645/epacomptox.5352997. [DOI] [Google Scholar]
- 36.Isaacs KK, Dionisio K, Phillips K, Bevington C, Egeghy P, Price PS. Establishing a system of consumer product use categories to support rapid modeling of human exposure. J Expo Sci Environ Epidemiol. 2020;30(1):171–183. [DOI] [PMC free article] [PubMed] [Google Scholar]
- 37.Isaacs KK, Goldsmith MR, Egeghy P, Phillips K, Brooks R, Hong T, et al. Characterization and prediction of chemical functions and weight fractions in consumer products. Toxicol Rep. 2016;3:723–732. [DOI] [PMC free article] [PubMed] [Google Scholar]
- 38.Knolhoff AM, Kneapler CN, Croley TR. Optimized chemical coverage and data quality for non-targeted screening applications using liquid chromatography/high-resolution mass spectrometry. Anal Chim Acta. 2019;1066:93–101. [DOI] [PubMed] [Google Scholar]
- 39.James-Todd TM, Chiu YH, Zota AR. Racial/ethnic disparities in environmental endocrine disrupting chemicals and women’s reproductive health outcomes: Epidemiological examples across the life course. Curr Epidemiol Rep. 2016;3(2):161–180. [DOI] [PMC free article] [PubMed] [Google Scholar]
- 40.Preuss R, Angerer J, Drexler H. Naphthalene—an environmental and occupational toxicant. Int Arch Occup Environ Health. 2003;76(8):556–576. [DOI] [PubMed] [Google Scholar]
- 41.Okereke CS, Kadry AM, Abdel-Rahman MS, Davis RA, Friedman MA. Metabolism of benzophenone-3 in rats. Drug Metab Dispos. 1993;21(5):788–791. [PubMed] [Google Scholar]
Associated Data
This section collects any data citations, data availability statements, or supplementary materials included in this article.
Supplementary Materials
Data Availability Statement
Data will be made available upon reasonable request.