

Abstract
When less energy is available to consume, people often lose weight, which reduces their overall metabolic rate. Their cellular metabolic rate may also decrease (metabolic adaptation), possibly reflected in physiological and/or endocrinological changes. Reduced energy availability can result from calorie restriction or increased activity energy expenditure, raising the following question that our review explores: do the body's metabolic and physiological responses to this reduction differ or not depending on whether they are induced by dietary restriction or increased activity? First, human studies offer indirect, contentious evidence that the body metabolically adapts to reduced energy availability, both in response to either a calorie intake deficit or increased activity (exercise; without a concomitant increase in food intake). Considering individual aspects of the body's physiology as constituents of whole-body metabolic rate, similar responses to reduced energy availability are observed in terms of reproductive capacity, somatic maintenance and hormone levels. By contrast, tissue phenotypic responses differ, most evidently for skeletal tissue, which is preserved in response to exercise but not calorie restriction. Thus, while in many ways ‘a calorie deficit is a calorie deficit’, certain tissues respond differently depending on the energy deficit intervention.
This article is part of a discussion meeting issue ‘Causes of obesity: theories, conjectures and evidence (Part I)’.
Keywords: metabolic suppression, resting metabolic rate, energy compensation, energy availability, calorie restriction, activity
1. Introduction
Jill and Jane are monozygotic twins. They are both in chronic energy balance—the normal energetic state for most people most of the time. That is, over the long-term they are ingesting energy from their diet that is equivalent to the amount of energy they expend, and as a result their body mass and tissue composition remain stable. Both Jill and Jane wish to lose weight, which they know requires an energy deficit, and in principle at least they have two distinct approaches to achieving this: either decreasing their energy intake by eating less or increasing their energy expenditure by being more active.
From a mathematical perspective, if Jill managed to restrict her dietary intake by the same amount of kcal as Jane managed to expend due to being more active, with no other changes to their behaviours, they would be in the same energy deficit and their energy availability (arithmetically defined as dietary energy intake minus activity energy expenditure) would be the same (figure 1); that is, both Jill and Jane would have the same amount of energy available for all physiological functions outside of activity. However, the physiological challenges presented to the body as a result of dieting versus being active are by no means entirely the same. Thus, the following question arises as to whether the physiological response to the disruption of energy balance is truly independent of whether an energy deficit of the same magnitude is created by dietary restriction or by increased activity. In other words, if Jill commits to losing weight by decreasing her food intake and Jane by increasing her activity levels, representing the same reduction in energy availability, what, if any, metabolic and physiological differences would we observe between them in the long run? We consider this question first at the whole-body level, and then at the hormonal and tissue level i.e. at the level of constituent parts of the body's overall metabolism.
Figure 1.

From a state of energy balance, Jill creates an energy deficit by reducing her energy intake (EI), while Jane creates the same energy deficit by increasing her activity energy expenditure (AEE). In both cases, the initial energy deficit (the difference between total daily energy expenditure, TDEE, and EI) results in less (non-endogenous) energy being available for all other physiological functions outside of activity. If a state of energy deficit persists then body weight decreases, in turn resulting in metabolic rate decreasing, and while reduced energy availability (EA) persists, metabolic adaptations (observed as reductions in cellular metabolic rate) may result; together this reduces TDEE, allowing Jill and/or Jane to eventually return to energy balance.
2. Part 1: Whole-body energy expenditure
(a) . What is metabolic adaptation and do we observe it?
It has been proposed that one of the reasons why weight loss is often hard to achieve and maintain in the long-term is that, in the face of an energy deficit, the body compensates by reducing energy expenditure, which in turn closes the energy gap between energy in and energy out [1,2]. This compensation could occur in the form of behavioural adaptations, such as reductions in non-exercise activity (e.g. walking, pottering, fidgeting), or in the form of metabolic adaptations, i.e. a reduction in basal energy requirements measured at the cellular level. Mechanisms that could underlie putative metabolic adaptations include improved energy efficiency, and down-regulation of energy-expensive processes such as immune defence, the sympathetic nervous system, reproduction, growth, maintenance of body core temperature and the function of vital organs such as the heart and kidneys [3–5]. Although metabolic adaptations should manifest as reductions in resting metabolic rate (RMR) and can, therefore, be measured via indirect calorimetry, there is an ongoing debate about whether RMR reductions in response to an energy deficit are truly reflective of an adaptive reduction in the metabolic rates of the remaining body tissues or simply just a consequence of the reduction in tissue mass (figure 2).
Figure 2.
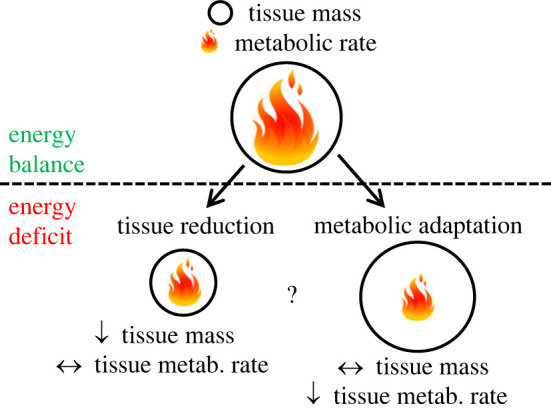
Graphical depiction of reductions in whole-body resting metabolic rate (RMR) as a consequence of an energy deficit. The gross reduction in RMR could be due to a reduction in the size of metabolically active tissues (left side of the figure) or a reduction of the metabolic rate of the remaining tissues (right side). In reality it could well involve a combination of both, though the latter is debated.
A reduction in body mass and size typically results in a reduced RMR, and therefore such changes in body composition must be accounted for when assessing any further metabolic responses to energy deficiency. Consequently, metabolic adaptations are typically defined as a reduction in (measured) RMR that exceeds the reduction in RMR expected based on loss of body tissue. Considering that the primary predictor of RMR is fat-free mass (FFM), or lean body mass, historically RMR reductions have been adjusted for changes in FFM [6] by reporting RMR relative to FFM or including FFM in a regression model. In general, most prediction equations assume that the RMR equivalent of 1 kg of FFM is in the range of 20–25 kcal FFM−1 d−1 [7–9], suggesting that if a person lost 3 kg of FFM, a reduction in RMR greater than 60–75 kcal d−1 would be interpreted as metabolic adaptation.
However, there are two problems with this assumption. First, because fat mass (FM) is not metabolically inert, its loss also reduces RMR; prediction equations estimate the contribution of 1 kg of fat mass (FM) to RMR to be in the range of 3–10 kcal d−1 [10–12]. Although this is substantially lower than the metabolic rate of FFM, reductions in FM during weight loss generally exceed FFM losses by at least a ratio of 3 : 1, sometimes considerably more. As a result, the contribution of FM losses to a reduction in RMR can be meaningful, and thus need to be considered when quantifying metabolic adaptations using a multiple linear regression approach [13]. Second, FFM is not a homogeneous tissue, as it is composed both of organs with very high metabolic activities, such as the heart, liver, kidneys and the spleen (the metabolic rates of which range between 200 and 440 kcal kg−1; [14]) and organs and tissues with much lower metabolic rates, such as skeletal muscle (13 kcal kg−1) and bone (2.3 kcal kg−1) [14]. Failure to account for changes in the exact organ and tissue composition could lead to meaningful over- or underestimation of the expected RMR reduction, thereby attenuating or amplifying the true extent of metabolic adaptations. This is especially relevant when considering that exercise—when compared to caloric restriction—likely exerts distinct effects on some of these tissues, especially skeletal muscle (see §3a(ii)). Ideally, changes in the size of these organs and tissues, and the subsequent impact on predicted RMR, are tracked using advanced imaging techniques such as magnetic resonance imaging (MRI), which provide fairly precise measurements [15,16]. Alternatively, changes in the sizes of skeletal muscle, adipose tissue, bone mass, brain and inner organs can also be estimated based on segmental body composition data assessed by dual-energy X-ray absorptiometry [17,18], which is more readily available in most clinical and research settings.
(b) . Evidence of metabolic adaptation in response to diet-induced weight loss
Although there is an ongoing debate about the existence, magnitude and true implications of metabolic adaptations [19,20], there is evidence from human experiments that metabolic adaptations are indeed apparent in response to calorie-restricted weight loss. Some of the earliest evidence stems from a re-analysis of the Minnesota starvation study by Dulloo & Jacquet [11], in which they estimated the metabolic adaptations of young, healthy and normal-weight men after 24 weeks of semi-starvation to peak at around 400 kcal d−1. However, given the methodological limitations at the time of the original study, metabolic adaptations could only be estimated based on FFM- and FM-based predictions of RMR. However, in a study of 32 non-obese men participating in an experiment involving controlled overfeeding, caloric restriction and subsequent refeeding, Müller et al. [21] used whole-body MRI to quantify changes in organ and tissue masses. After three weeks of 50% caloric restriction, metabolic adaptations were quantified at 72 kcal d−1, accounting for approximately 33% of the observed RMR reduction in response to weight loss. In a re-analysis of data from the CALERIE phase 2 study, in which normal-to-overweight adults underwent approximately 12% calorie restriction for a duration of 2 years [22], Martin et al. [23] used dual-energy X-ray absorptiometry (DXA)-derived changes in organ and tissue masses to quantify metabolic adaptation. After 1 year, metabolic adaptations were quantified at approximately 40 kcal d−1 and accounted for 40% of the observed RMR reduction, suggesting that adaptations are not only present in short-term interventions but persist even after more prolonged caloric restriction. Among anorexia nervosa patients, who presented a model of much more severe and chronic caloric restriction and exhibited approximately 20% lower organ and muscle mass than healthy individuals based on DXA-based estimates of organ and tissue sizes, Kosmiski et al. [24] reported metabolic adaptations at an average 226 kcal d−1.
This evidence from human studies, however, is challenged by experimental data from mice [25] indicating that changes in individual organ sizes after three months of calorie restriction (determined from the dissection of 20 body compartments) fully explained measured RMR reductions. As such, it remains possible that even the human studies that have used the most advanced approaches to accounting for changes in body organs and tissues, and that report metabolic adaptations, continue to underestimate the true RMR effect of weight loss because they still fail to account for all pertinent reductions in tissue mass.
(c) . Evidence of metabolic adaptation in response to increased exercise
To answer the question about whether metabolic adaptations occur in response to chronic exercise per se or as a consequence of an exercise-induced energy deficit, we aggregated RMR data from selected exercise interventions (table 1) and compared these data with diet-induced energy deficits (figure 3). Following the approach taken for calorie deficit studies as described earlier, we operationally defined metabolic adaptation as a reduction in RMR that exceeds the RMR change caused by the loss of body tissue. However, assessment and interpretation of changes in RMR and body composition in exercise interventions are complicated by several factors.
Table 1.
Changes in RMR reported by selected exercise interventions.
| reference | sample | intervention | frequency | length (d) | diet | weight change (kg) | FFM change (kg) | FM change (kg) | RMR change (kcal d−1) | predicted RMR changea (kcal d−1) | estimated metabolic adaptation (kcal d−1) |
|---|---|---|---|---|---|---|---|---|---|---|---|
| Tremblay et al. [26] | 14 male monozygotic twins | cycling | 2× per day | 93 | maintain baseline | −5.0 | −0.1 | −4.9 | −138 | −50 | −88 |
| Byrne et al. [27] | 9 sedentary women | walking and resistance training | 3–4× per week | 140 | n.a. | 1.7 | 1.9 | −0.2 | −53 | 22 | −75 |
| Westerterp et al. [28] | 23 men and women | running | 4× per week | 280 | ad libitum | −1.0 | 2.7 | −3.6 | −62 | −2 | −59 |
| Koehler et al. [29] | 7 sedentary women | aerobic exercise to increase TDEE by 30% | 5× per week | 90 | maintain baseline | −2.7 | −0.1 | −2.2 | −77 | −22 | −54 |
| Hand et al. [30] | 26 overweight men and women | walking and running to expend 17.5 kcal kg−1 week−1 | n.a. | 182 | maintain weight | −0.4 | 0.2 | −0.4 | 2 | −2 | 3 |
| Hand et al. [30] | 23 overweight men and women | walking and running to expend 35 kcal kg−1 week−1 | n.a. | 182 | maintain weight | −0.6 | 0.7 | −1.0 | 3 | −2 | 5 |
| Frey-Hewitt et al. [31] | 21 overweight men | walking and running | 3× per week | 365 | maintain baseline | −4.1 | 0 | −4.1 | −23 | −41 | 18 |
| Martin et al. [32] | 61 overweight men and women | walking and running to expend 20 kcal kg−1 week−1 | 3–5× per week | 168 | ad libitum | −1.6 | −0.1 | −1.4 | 6 | −15 | 21 |
| Martin et al. [32] | 59 overweight men and women | walking and running to expend 8 kcal kg−1 week−1 | 3–5× per week | 168 | ad libitum | −0.4 | −0.3 | −0.2 | 48 | −6 | 54 |
| Koehler et al. [29] | 9 sedentary women | aerobic exercise to increase TDEE by 30% | 5× per week | 90 | matched increase in TDEE | −1.1 | 0.5 | −1.1 | 119 | −5 | 124 |
| Goran & Poehlmann [33] | 11 older men and women | cycling | 3× per week | 56 | n.a. | 0 | 0.8 | −0.9 | 167 | 1.7 | 165 |
aRMR change was predicted using coefficients of 12.4 kcal kg−1 for changes in FFM and 9.9 kcal kg−1 for changes in FM, respectively (https://doi.org/10.1093/ajcn/80.5.1379).
Figure 3.

Relationships between observed changes in resting metabolic rate (RMR) and changes in body weight (a) and also predicted changes in RMR (b), and estimated metabolic adaptation and changes in body weight (c), all in selected studies involving caloric restriction (white) or exercise. For exercise studies, colours depict the level of control over dietary energy intake: red = intake was maintained at levels prior to the intervention; yellow = intake was ad libitum; green = intake was sufficient to maintain body weight; intake was undefined. The dashed lines represent unity (b), where metabolic adaptation is indicated in data points to the right of the line, and zero (c), where metabolic adaptation is indicated in data points below the line. Estimated metabolic adaptation for these studies is calculated as the difference between observed change in RMR and RMR change predicted from the change in FFM and FM using previously published coefficients [12]. Data sources: caloric restriction: [23,31,34]; exercise: [26–33]. * RMR change was predicted using coefficients of 12.4 kcal kg−1 for changes in FFM and 9.9 kcal kg−1 for changes in FM, respectively [12]; ** metabolic adaptations were estimated as the difference in measured and predicted RMR change.
First, the ability to increase total daily energy expenditure through exercising (table 1), and consequently the putative energy deficit that can be induced by an exercise intervention, is generally much smaller than the energy deficit that can be incurred by calorie restriction [35]. In fact, with the exception of one study [26], which induced a calorie deficit of 1000 kcal d−1 for three months, we estimated the overall impact of most exercise interventions listed in table 1 on the energy budget to be in the range of 130–500 kcal d−1, which is meaningfully smaller than the energy deficits induced by most interventions employing calorie restriction.
Second, it is well known from the literature that most exercise interventions generally produce only marginal weight loss [36,37], an effect that has been attributed to compensatory increases in dietary energy intake [38–40]. For our interpretation of RMR changes following exercise interventions, it is, therefore, crucial to differentiate based on whether dietary intake was maintained at pre-exercise levels or increased. Third, even in the face of apparent weight stability, we need to account for the fact that exercise interventions, and particularly those incorporating resistance exercise, likely result in gains in muscle mass, which may obscure the depletion of body energy stores in the form of FM. Fourth, excess post-exercise oxygen consumption (EPOC) could return heightened measures of RMR, if RMR measurements are made within about 24 h of the most recent exercise bout [41,42].
Last, most exercise interventions fail to measure and report changes in body composition at the same level of scrutiny as that demonstrated by some of the aforementioned experiments investigating metabolic adaptation after caloric restriction [21,23]. Indeed, we have been unable to find studies that measured RMR before and after substantial weight loss due to an exercise intervention that assessed body composition with more nuance than a two-compartment model (e.g. [29,32]). Therefore, our re-analysis of changes in RMR from selected exercise interventions (table 1) relies on whole-body rather than tissue-specific body composition data, but with information on changes in FM and FFM. Therefore, for each study we calculated the expected change in RMR due to changes in body tissue mass using previously published coefficients for FFM (12.4 kcal kg−1) and FM (9.9 kcal d−1) [12].
(i) . Studies showing evidence of metabolic adaptations following increased exercise
Monozygotic twins who exercised twice a day to expend 1000 kcal d−1 for 93 days consecutively while maintaining their energy intake at pre-exercise levels exhibited a 138 kcal d−1 reduction in RMR [26]. The observed weight reduction of on average 5 kg consisted almost exclusively of fat loss (4.9 kg), while FFM was maintained. Based on these changes in FM and FFM, we calculated an estimated metabolic adaptation of approximately 88 kcal d−1, which is of the same magnitude as observed following calorie restriction [23,31,34].
Westerterp et al. [28] reported a 72 kcal d−1 reduction in sleeping metabolic rate (SMR) in participants who ran four times per week for 44 weeks in preparation for a half-marathon. Although only minimal weight loss (−1.0 kg) occurred, participants lost 3.6 kg of FM while gaining 2.7 kg of FFM. Using the aforementioned coefficients, given these changes in body composition we would have predicted RMR to remain stable (decreasing by just 2 kcal d−1) and thus conclude that the participants exhibited metabolic adaptation.
Due to the greater energy cost of aerobic exercise, only a few studies have focused on the impact of other exercise modalities on RMR and metabolic adaptations. A considerable RMR reduction (−53 kcal d−1) was reported in participants who conducted resistance exercise four times per week and walked three times a week [27]. Since participants gained weight (1.7 kg) and FFM (1.9 kg) over the course of the 20-week training programme, we would have expected RMR to increase by approximately 22 kcal d−1, suggesting that the participants exhibited metabolic adaptation to a degree concomitant with the aforementioned aerobic exercise studies that resulted in meaningful reductions in FM. Indeed, participants in the same study who were assigned to the resistance training without the aerobic exercise presented with a 44 kcal d−1 increase in RMR while gaining similar amounts of FFM (1.9 kg), further strengthening the evidence from this study that exercise resulting in a reduction in energy availability in turn results in metabolic adaptation.
(ii) . Studies showing no evidence of metabolic adaptations following increased exercise
By contrast to the aforementioned studies, Frey-Hewitt et al. [31] reported a 23 kcal d−1 RMR decrease in overweight men who exercised three times per week for 1 year. Considering that subjects subsequently lost 4.1 kg [31], the observed RMR change was well within the range of what we would have expected based on body composition changes (−41 kcal d−1), suggesting no evidence of metabolic adaptation. Likewise, the 167 kcal d−1 increase in RMR reported in older adults who exercised three times per week for eight weeks [33] also provided no evidence of metabolic adaptation, considering that observed changes in FFM (+0.8 kg) and FM (−0.9 kg) were only minor.
Modest changes in body weight (0.4–0.6 kg) and FM (0.4–1.0 kg) were also reported among overweight adults who exercised for 26 weeks at two regime intensities to expend either 17.5 or 35 kcal kg−1 per week [30]. Participants were instructed to adjust their diet to maintain their body weight. There were no meaningful changes in RMR (+2–3 kcal d−1), demonstrating no evidence of metabolic adaptation. In a very similar design, Martin et al. [32] reported no meaningful changes in RMR after 24 weeks (−6 kcal d−1 and −15 kcal d−1) in overweight men and women who exercised 3–5 times per week to expend 8 kcal kg−1 or 20 kcal kg−1 per week, respectively. Interestingly, while no metabolic adaptation was apparent in either study, both reported a reduction in the initial energy deficit created by the exercise intervention as a result of behavioural compensation in the form of reduced non-exercise activity [30] or increased dietary energy intake [32]. Taken together, these findings support the hypothesis that some form of compensation is inevitable when more energy is expended through exercise, but it is possible that behavioural adaptations may prevent metabolic adaptations (and subsequent weight loss), and perhaps also vice versa.
(iii) . Reconciling the contradictory results from studies involving increased exercise
It is important to note that although the increase in exercise energy expenditure was generally well quantified in most of the aforementioned exercise studies involving a chronic exercise intervention, little if any control was employed over dietary energy intake, which was either allowed ad libitum (e.g. [32]) or participants were supervised to increase food intake in order to maintain weight stability (e.g. [30]). As a consequence, it is likely that the putative energy deficit caused by the increase in exercise was likely attenuated or completely abolished. By contrast, when previously sedentary women increased their energy expenditure by 30% through exercising five times a week with energy intake being clamped at pre-intervention levels, their RMR decreased by 77 kcal d−1 after three months [29], which was approximately 50 kcal d−1 more than what we would expect based on changes in FM (−2.2 kg) and FFM (−0.1 kg). Interestingly, when women completed the same exercise regimen but increased their energy intake by approximately 30%, their RMR increased by 119 kcal d−1 [29].
The data from the aforementioned studies have been collated to assess patterns between changes in RMR, changes in body weight composition and different levels of calorie control (figure 3). This shows that, while calorie restriction studies tend to result in metabolic adaptation, this outcome is much less consistent for exercise intervention studies. Moreover, the exercise intervention studies that do suggest evidence of metabolic adaptation tend to be those few investigations where participants were required to maintain their energy intake at pre-exercise levels. Taken together then, these findings from longitudinal studies suggest that metabolic adaptations do not occur in response to exercise per se but rather when people fail to match their increased energy expenditure (i.e., reduced energy availability).
This observation is further supported by cross-sectional evidence of metabolic adaptation in exercising populations with symptoms of chronic energy deficiency, such as menstrual disturbances, a hallmark of the female athlete triad and the relative energy deficiency in sports (REDs) syndrome [43,44]. For example, De Souza et al. [45] reported a dose–response relationship between metabolic adaptations and the severity of menstrual disturbances, ranging from healthy ovulatory cycles to subtle menstrual disturbances (approx. −8% lower RMR per kg FFM) to amenorrhea as the most severe form (approx. 12% lower RMR per kg FFM). In another comparison using a DXA-based approach to account for possible differences in organ and tissue masses, Koehler et al. [46] reported that female athletes with amenorrhea exhibited metabolic adaptations of on average 112 kcal d−1 (10%), whereas no metabolic adaptations were apparent in normally menstruating controls. Considering that both groups conducted similarly high levels of exercise, metabolic adaptations were most likely driven by reduced energy availability, further evidenced by observed reductions in concentrations of metabolic hormones (leptin, T3) in the amenorrheic athletes.
(d) . Part 1 conclusion
As shown in figure 3, there is little evidence from the literature that exercise interventions per se result in metabolic adaptations, which is in agreement with a meta-analysis by Mackenzie-Shalders et al. [47] and the animal literature [48,49]. This arguably makes sense evolutionarily because there is no obvious need to reduce metabolic rate if energy intake continues to match energy expenditure. However, if chronic increases in exercise energy expenditure are not matched by increased calorie intake, then weight loss, or more specifically reductions in FM, consequently ensues. In these cases, exercise interventions may indirectly result in metabolic adaptations of the same magnitude as those observed after caloric restriction, given the degree of weight loss, suggesting that the net energy deficit is the primary driver of metabolic adaptations.
3. Part 2: Tissue level energy expenditure—endocrine and skeletal muscle responses
RMR, however, is a single value representing whole-body energy expenditure, and may not be sufficiently sensitive to detect changes in the metabolism of the endocrine or other physiological systems resulting from metabolic adaptation. Assessing the effect of an energy deficit on markers of metabolic function and on specific tissues that may be differentially affected by exercise is an alternative approach to determine whether there is a physiological response that would lead to differential metabolic adaptations and if various tissues are affected differently.
As discussed in §1, inducing an energy deficit through exercise tends to reduce fat mass while maintaining or increasing FFM and, similarly, incorporation of exercise with individuals feeding ad libitum typically leads to no weight loss but an increase of FFM while reducing FM (table 1). It might be reasonable to expect that inducing an energy deficit through exercise would result in the maintenance of metabolic rate and function of active tissues that would otherwise be down-regulated by the lack of exercise—such as skeletal muscle—while tissues/organs/systems that are not directly implicated in activity would be affected regardless of the presence of exercise, or potentially further down-regulated. Examples of the dysregulation of metabolic processes due to low energy availability by exercising or dieting may be observed cross-sectionally in divergent populations such as female athletes who ingest insufficient energy for their active lifestyles versus women with anorexia nervosa (without compulsive exercise) [24,50]. Prominent commonalities in these two populations are the high prevalence of menstrual disorders and low bone mineral density [43,51], representing indirect evidence that some physiological processes (e.g. reproductive function) may be down-regulated in the face of an energy deficit regardless of the driver of the deficit. However, phenotypically these two populations can be drastically different: amenorrheic athletes can achieve levels of strength and aerobic capacity to compete at an international level in sport [52,53], while females with anorexia nervosa show impaired muscle structure, strength and maximal aerobic capacity [54,55]. It becomes clear from these examples, therefore, that physical capacity (and muscle function, as one of many variables that determine it) are differentially regulated in the face of low energy availability, and that the metabolic and physiological response is not the same with and without the presence of exercise.
(a) . Systemic endocrine changes of reproduction, somatic maintenance, growth, etc.
Well-controlled short-term laboratory studies indicate that reduced energy availability as a result of increased activity levels does not appear to influence systemic endocrine responses associated with reproductive function, somatic maintenance, growth and other endocrine responses differently from reduced energy availability induced by calorie restriction [56]. Menstrual disturbances are often observed in exercising women because of alteration of the hypothalamic–pituitary–gonadal axis and are reflected in a range of disturbances ranging from luteal phase defects to amenorrhea [57]. The secretion of luteinizing hormone (LH), a key hormone responsible for the regulation of reproduction, by the anterior pituitary gland, was shown to be affected by low energy availability, and independently of the presence of exercise [58], with decreasing levels of energy availability showing more profound alterations of circulating LH [59]. In relation to somatic maintenance, a similar pattern has been observed for the hypothalamic–pituitary–thyroid axis, with exercise itself having no effect per se on circulating levels of the thyroid hormone triiodothyronine (T3) [60], and circulating levels of T3 being inversely related to energy availability [59]. Insulin-like growth factor-1 (IGF-1), a key hormone regulating the growth of tissues, is down-regulated during low energy availability in females but unaffected by the presence of exercise when energy availability is maintained [61]. Similarly, circulating levels of leptin, a key hormone in the regulation of bodyweight and adiposity and several other metabolic processes, is affected equally by low energy availability induced through diet or exercise [46,61,62].
The responses of T3 and leptin are perhaps of particular interest, because they are master-switches in the regulation of metabolism [63,64]. Studies incorporating long-term interventions to achieve 10% of body weight loss show concomitant decreases in leptin, T3 and RMR, with RMR being rescued to baseline levels with repletion of T3 and leptin via injection [65,66]. Therefore, the research findings outlined above from short-term studies using diet or exercise to induce an energy deficit [46,59–62] support the idea that metabolic adaptation takes place in the form of reduced metabolic rate of tissues during the state of low energy availability regardless of the energy deficit being induced by diet or exercise, at least if leptin and T3 are considered as key in metabolic adaptation. However, these observations do not provide evidence of how tissue-specific responses may diverge depending on whether the energy deficit is induced through a dietary energy deficit or increase in exercise.
(b) . Skeletal muscle and physical capacity
The presence (or absence) of exercise appears not to have a significant effect on the systemic hormonal responses to low energy availability outlined above associated with metabolic adaptation, but it does have a significant effect on the phenotype of several tissues [67]. Given the importance of skeletal muscle during exercise and the fact that it is a significant contributor to RMR because it comprises approximately 40% of body mass in normal weight individuals and is thought to contribute to approximately 20% of RMR [68], this section will be centred around skeletal muscle, with a focus on muscle protein synthesis and skeletal muscle quality.
Research investigating changes in skeletal muscle protein synthesis and quality as a result of an energy deficit does not seem—to the best of our knowledge—to have used exercise alone to induce an energy deficit. Therefore, the following discussion considers the available literature where an energy deficit has been induced through calorie restriction alone or in combination with resistance-type or endurance-type exercise. Low energy availability reduces skeletal muscle protein synthesis [69–71], which is a key driver of the loss of muscle mass during prolonged energy deficits [72]. Incorporating resistance-type exercise during an energy deficit rescues skeletal muscle protein synthesis to energy balance levels both acutely, in the first 4 h post-exercise [69], and chronically, during days and weeks of low energy availability with concomitant exercise [72–74]. As such, a systematic review of the literature shows that incorporation of exercise and resistance training in particular is an effective tool to preserve FFM [75], quite possibly through the retention of muscle mass. It is noteworthy that even if an energy deficit impairs the capacity to accrue lean mass during a resistance-type training intervention when compared to resistance training combined with energy balance, gains in function/strength seem to be unaffected [76].
Beyond resistance exercise, aerobic exercise may also have a distinct effect on modulating the phenotype of skeletal muscle during an energy deficit. Research into rodents and humans indicates that aerobic exercise during an energy deficit can maintain or improve skeletal muscle function, as observed by improvements in markers of mitochondrial biogenesis and respiration [77–79], suggesting that the metabolic activity of muscle may be rather distinct depending on whether or not exercise is incorporated concomitantly during periods of energy deficit.
4. Overall conclusion and future directions
So does reduced energy availability due to eating less or exercising more produce distinct metabolic responses?
A summary of the response to this question is provided in figure 4. In terms of the effect on whole-body energy expenditure, the available data suggest that a calorie deficit is a calorie deficit; that is, regardless of how that deficit is induced, the greater the decrease in weight the greater the decrease in RMR, and the more likely are metabolic adaptations. However, the analysis of studies involving an exercise intervention is limited, first because the nominal energy deficit created by exercise is often rather small and second because unless food intake is restricted the deficit is attenuated by a compensatory increase in energy intake (figure 3).
Figure 4.

Summary of the effect of energy deficit induced through diet and through exercise on whole-body RMR, systemic endocrine responses, skeletal muscle protein synthesis, mass and strength, and aerobic capacity. While the effect of exercise on whole-body RMR is unclear, responses of systemic circulating key hormones appear to be unaffected by the presence of exercise, signalling a down-regulation of metabolism. However, broadly speaking, skeletal muscle metabolism and physical capacity are maintained or improved by the incorporation of exercise compared to no exercise. MPS, muscle protein synthesis.
The absolute magnitude of these metabolic adaptations—even as a result of a chronically low energy availability—appears modest at well below 100 kcal d−1. Interestingly, these magnitudes of metabolic adaptation represent about the same reduction as observed in the RMR of elderly individuals, accounting for changes in fat and FFM, over about 3–5 years of ageing [80]. Moreover, such a degree of metabolic adaptation does not appear substantial enough to be an important factor in explaining resistance to body weight loss during chronic dieting [20]. It is worth noting that variation in measured metabolic variation between participants is considerable, and reached at least 200 kcal d−1 in a few participants in the study by Müller et al. [21], although a substantial part of the observed inter-individual variability is likely due to measurement error, which can be in the range of 3–5% for RMR [81]. Which traits associate with variability in metabolic adaptation for a given intervention could be a fruitful avenue of future research.
While, as far as we can presently tell, whole-body metabolic rate responds similarly to low energy availability regardless of context, in terms of the underlying physiological milieu of the body some tissues and systems respond similarly—such as the endocrine system—while others, such as skeletal muscle, respond differently. It appears, then, that the body apportions its diminished energy resources differently to some degree in response to a reduction in energy intake versus an increase in activity energy expenditure, quite possibly as an adaptive response.
What does this all mean for Jill and Jane? While both of them will likely present with similar, small differences in metabolic adaptation and similar systemic endocrine responses, Jill will possibly see a reduction of her skeletal muscle mass and strength, while Jane will become leaner, preserve or increase her skeletal muscle mass and improve her strength and cardio-respiratory capacity [78,82,83]. With a similar whole-body metabolic rate to Jill, does Jane, therefore, experience a trade-off against her preserved, even enlarged, skeletal muscle mass, in terms of other tissues? Further work is required to understand the effects on overall metabolic rate of chronic increases in activity and the underlying mechanisms [49,84], where measurements are taken with the same level of scrutiny (in particular organ sizes) as has been applied to recent calorie restriction studies. Also missing from the literature are matched calorie restricted and exercise intervention studies where the same deficit is induced by calorie restriction in one experimental condition to exercise in another experimental condition.
Data accessibility
All data presented in this article are collated from the literature, and presented in table 1.
Authors' contributions
L.G.H.: conceptualization, writing—original draft, writing—review and editing; J.L.A.: conceptualization, writing—original draft, writing—review and editing; K.K.: conceptualization, writing—original draft, writing—review and editing.
All authors gave final approval for publication and agreed to be held accountable for the work performed therein.
Conflict of interest declaration
We declare we have no competing interests.
Funding
We received no funding for this study.
References
- 1.Redman LM, Heilbronn LK, Martin CK, De Jonge L, Williamson DA, Delany JP, Ravussin E, Team PC. 2009. Metabolic and behavioral compensations in response to caloric restriction: implications for the maintenance of weight loss. PLoS One 4, e4377. ( 10.1371/journal.pone.0004377) [DOI] [PMC free article] [PubMed] [Google Scholar]
- 2.Anastasiou CA, Karfopoulou E, Yannakoulia M. 2015. Weight regaining: from statistics and behaviors to physiology and metabolism. Metabolism 64, 1395-1407. ( 10.1016/j.metabol.2015.08.006) [DOI] [PubMed] [Google Scholar]
- 3.Aronne LJ, Hall KD, M. Jakicic J, Leibel RL, Lowe MR, Rosenbaum M, Klein S. 2021. Describing the weight-reduced state: physiology, behavior, and interventions. Obesity 29, S9-S24. ( 10.1002/oby.23092) [DOI] [PMC free article] [PubMed] [Google Scholar]
- 4.Halsey LG. 2021. The mystery of energy compensation. Physiol. Biochem. Zool. 94, 380-393. ( 10.1086/716467) [DOI] [PubMed] [Google Scholar]
- 5.Müller MJ, Heymsfield SB, Bosy-Westphal A. 2023. Changes in body composition and homeostatic control of resting energy expenditure during dietary weight loss. Obesity 31, 892-895. ( 10.1002/oby.23703) [DOI] [PubMed] [Google Scholar]
- 6.Speakman JR, Selman C. 2003. Physical activity and resting metabolic rate. Proc. Nutr. Soc. 62, 621-634. ( 10.1079/PNS2003282) [DOI] [PubMed] [Google Scholar]
- 7.Wang Z, Heshka S, Zhang K, Boozer C, Heymsfield S. 2001. Resting energy expenditure: systematic organization and critique of prediction methods. Obesity 9, 331-336. ( 10.1038/oby.2001.42) [DOI] [PubMed] [Google Scholar]
- 8.Cunningham JJ. 1991. Body composition as a determinant of energy expenditure: a synthetic review and a proposed general prediction equation. Am. J. Clin. Nutr. 54, 963-969. ( 10.1093/ajcn/54.6.963) [DOI] [PubMed] [Google Scholar]
- 9.Mifflin MD, St Jeor ST, Hill LA, Scott BJ, Daugherty SA, Koh YO. 1990. A new predictive equation for resting energy expenditure in healthy individuals. Am. J. Clin. Nutr. 51, 241-247. ( 10.1093/ajcn/51.2.241) [DOI] [PubMed] [Google Scholar]
- 10.Nelson KM, Weinsier RL, Long CL, Schutz Y. 1992. Prediction of resting energy expenditure from fat-free mass and fat mass. Am. J. Clin. Nutr. 56, 848-856. ( 10.1093/ajcn/56.5.848) [DOI] [PubMed] [Google Scholar]
- 11.Dulloo AG, Jacquet J. 1998. Adaptive reduction in basal metabolic rate in response to food deprivation in humans: a role for feedback signals from fat stores. Am. J. Clin. Nutr. 68, 599-606. ( 10.1093/ajcn/68.3.599) [DOI] [PubMed] [Google Scholar]
- 12.Müller MJ, et al. 2004. World Health Organization equations have shortcomings for predicting resting energy expenditure in persons from a modern, affluent population: generation of a new reference standard from a retrospective analysis of a German database of resting energy expenditure. Am. J. Clin. Nutr. 80, 1379-1390. ( 10.1093/ajcn/80.5.1379) [DOI] [PubMed] [Google Scholar]
- 13.Galgani JE, Santos JL. 2016. Insights about weight loss-induced metabolic adaptation. Obesity 24, 277. ( 10.1002/oby.21408) [DOI] [PubMed] [Google Scholar]
- 14.Elia M. 1992. Organ and tissue contribution to metabolic rate. In Energy metabolism. Tissue determinants and cellular corrolaries (eds Kinney JM, Tucker HN), pp. 61-77. New York, NY: Raven Press. [Google Scholar]
- 15.Gallagher D, Belmonte D, Deurenberg P, Wang Z, Krasnow N, PI-Sunyer FX, Heymsfield SB. 1998. Organ-tissue mass measurement allows modeling of REE and metabolically active tissue mass. Am. J. Physiol. Endocrinol. Metab. 275, E249-E258. ( 10.1152/ajpendo.1998.275.2.E249) [DOI] [PubMed] [Google Scholar]
- 16.Müller M, Bosy-Westphal A, Kutzner D, Heller M. 2002. Metabolically active components of fat-free mass and resting energy expenditure in humans: recent lessons from imaging technologies. Obes. Rev. 3, 113-122. ( 10.1046/j.1467-789X.2002.00057.x) [DOI] [PubMed] [Google Scholar]
- 17.Hayes M, Chustek M, Wang Z, Gallagher D, Heshka S, Spungen A, Bauman W, Heymsfield SB. 2002. DXA: potential for creating a metabolic map of organ-tissue resting energy expenditure components. Obes. Res. 10, 969-977. ( 10.1038/oby.2002.132) [DOI] [PubMed] [Google Scholar]
- 18.Bosy-Westphal A, Reinecke U, Schlörke T, Illner K, Kutzner D, Heller M, Müller M. 2004. Effect of organ and tissue masses on resting energy expenditure in underweight, normal weight and obese adults. Int. J. Obes. 28, 72-79. ( 10.1038/sj.ijo.0802526) [DOI] [PubMed] [Google Scholar]
- 19.Martins C, Roekenes J, Salamati S, Gower BA, Hunter GR. 2020. Metabolic adaptation is an illusion, only present when participants are in negative energy balance. Am. J. Clin. Nutr. 112, 1212-1218. ( 10.1093/ajcn/nqaa220) [DOI] [PMC free article] [PubMed] [Google Scholar]
- 20.Müller MJ, Heymsfield SB, Bosy-Westphal A. 2021. Are metabolic adaptations to weight changes an artefact? Am. J. Clin. Nutr. 114, 1386-1395. ( 10.1093/ajcn/nqab184) [DOI] [PubMed] [Google Scholar]
- 21.Müller MJ, et al. 2015. Metabolic adaptation to caloric restriction and subsequent refeeding: the Minnesota Starvation Experiment revisited. Am. J. Clin. Nutr. 102, 807-819. ( 10.3945/ajcn.115.109173) [DOI] [PubMed] [Google Scholar]
- 22.Kraus WE, et al. 2019. 2 years of calorie restriction and cardiometabolic risk (CALERIE): exploratory outcomes of a multicentre, phase 2, randomised controlled trial. Lancet Diabetes Endocrinol. 7, 673-683. ( 10.1016/S2213-8587(19)30151-2) [DOI] [PMC free article] [PubMed] [Google Scholar]
- 23.Martin A, Fox D, Murphy CA, Hofmann H, Koehler K. 2022. Tissue losses and metabolic adaptations both contribute to the reduction in resting metabolic rate following weight loss. Int. J. Obes. 46, 1168-1175. ( 10.1038/s41366-022-01090-7) [DOI] [PMC free article] [PubMed] [Google Scholar]
- 24.Kosmiski L, Schmiege SJ, Mascolo M, Gaudiani J, Mehler PS. 2014. Chronic starvation secondary to anorexia nervosa is associated with an adaptive suppression of resting energy expenditure. J. Clin. Endocrinol. Metab. 99, 908. ( 10.1210/jc.2013-1694) [DOI] [PMC free article] [PubMed] [Google Scholar]
- 25.Mitchell SE, et al. 2017. The effects of graded levels of calorie restriction: VIII. Impact of short term calorie and protein restriction on basal metabolic rate in the C57BL/6 mouse. Oncotarget 8, 17 453-17 474. ( 10.18632/oncotarget.15294) [DOI] [PMC free article] [PubMed] [Google Scholar]
- 26.Tremblay A, Poehlman E, Després J-P, Theriault G, Danforth E, Bouchard C. 1997. Endurance training with constant energy intake in identical twins: changes over time in energy expenditure and related hormones. Metabolism 46, 499-503. ( 10.1016/S0026-0495(97)90184-0) [DOI] [PubMed] [Google Scholar]
- 27.Byrne HK, Wilmore JH. 2001. The effects of a 20-week exercise training program on resting metabolic rate in previously sedentary, moderately obese women. Int. J. Sport Nutr. Exerc. Metab. 11, 15-31. ( 10.1123/ijsnem.11.1.15) [DOI] [PubMed] [Google Scholar]
- 28.Westerterp KR, Meijer GA, Janssen EM, Saris WH, Hoor FT. 1992. Long-term effect of physical activity on energy balance and body composition. Br. J. Nutr. 68, 21-30. ( 10.1079/BJN19920063) [DOI] [PubMed] [Google Scholar]
- 29.Koehler K, De Souza M, Williams N. 2017. Less-than-expected weight loss in normal-weight women undergoing caloric restriction and exercise is accompanied by preservation of fat-free mass and metabolic adaptations. Eur. J. Clin. Nutr. 71, 365-371. ( 10.1038/ejcn.2016.203) [DOI] [PubMed] [Google Scholar]
- 30.Hand GA, et al. 2020. The effect of exercise training on total daily energy expenditure and body composition in weight-stable adults: a randomized controlled trial. J. Phys. Act. Health 17, 456-463. ( 10.1123/jpah.2019-0415) [DOI] [PubMed] [Google Scholar]
- 31.Frey-Hewitt B, Vranizan KM, Dreon DM, Wood PD. 1990. The effect of weight loss by dieting or exercise on resting metabolic rate in overweight men. Int. J. Obes. 14, 327-334. [PubMed] [Google Scholar]
- 32.Martin CK, et al. 2019. Effect of different doses of supervised exercise on food intake, metabolism, and non-exercise physical activity: the E-MECHANIC randomized controlled trial. Am. J. Clin. Nutr. 110, 583-592. ( 10.1093/ajcn/nqz054) [DOI] [PMC free article] [PubMed] [Google Scholar]
- 33.Goran MI, Poehlman ET. 1992. Endurance training does not enhance total energy expenditure in healthy elderly persons. Am. J. Physiol. 263, E950-E957. ( 10.1152/ajpendo.1992.263.5.E950) [DOI] [PubMed] [Google Scholar]
- 34.Leibel RL, Rosenbaum M, Hirsch J. 1995. Changes in energy expenditure resulting from altered body weight. N. Engl. J. Med. 332, 621-628. ( 10.1056/NEJM199503093321001) [DOI] [PubMed] [Google Scholar]
- 35.Caudwell P, Gibbons C, Hopkins M, Naslund E, King N, Finlayson G, Blundell J. 2011. The influence of physical activity on appetite control: an experimental system to understand the relationship between exercise-induced energy expenditure and energy intake. Proc. Nutr. Soc. 70, 171-180. ( 10.1017/S0029665110004751) [DOI] [PubMed] [Google Scholar]
- 36.Swift DL, Mcgee JE, Earnest CP, Carlisle E, Nygard M, Johannsen NM. 2018. The effects of exercise and physical activity on weight loss and maintenance. Prog. Cardiovasc. Dis. 61, 206-213. ( 10.1016/j.pcad.2018.07.014) [DOI] [PubMed] [Google Scholar]
- 37.Swift DL, Johannsen NM, Lavie CJ, Earnest CP, Church TS. 2014. The role of exercise and physical activity in weight loss and maintenance. Prog. Cardiovasc. Dis. 56, 441-447. ( 10.1016/j.pcad.2013.09.012) [DOI] [PMC free article] [PubMed] [Google Scholar]
- 38.Thivel D, et al. 2021. Diet- but not exercise-induced iso-energetic deficit induces compensatory appetitive responses. Eur. J. Clin. Nutr. 75, 1425-1432. ( 10.1038/s41430-020-00853-7) [DOI] [PubMed] [Google Scholar]
- 39.King NA, et al. 2012. Exercise, appetite and weight management: understanding the compensatory responses in eating behaviour and how they contribute to variability in exercise-induced weight loss. Br. J. Sports Med. 46, 315-322. ( 10.1136/bjsm.2010.082495) [DOI] [PubMed] [Google Scholar]
- 40.Hopkins M, King NA, Blundell JE. 2010. Acute and long-term effects of exercise on appetite control: is there any benefit for weight control? Curr. Opin Clin. Nutr. Metab. Care 13, 635-640. ( 10.1097/MCO.0b013e32833e343b) [DOI] [PubMed] [Google Scholar]
- 41.Bielinski R, Schutz Y, Jequier E. 1985. Energy metabolism during the postexercise recovery in man. Am. J. Clin. Nutr. 42, 69-82. ( 10.1093/ajcn/42.1.69) [DOI] [PubMed] [Google Scholar]
- 42.Maehlum S, Grandmontagne M, Newsholme EA, Sejersted OM. 1986. Magnitude and duration of excess postexercise oxygen consumption in healthy young subjects. Metabolism 35, 425-429. ( 10.1016/0026-0495(86)90132-0) [DOI] [PubMed] [Google Scholar]
- 43.De Souza MJ, et al. 2014. 2014 female athlete triad coalition consensus statement on treatment and return to play of the female athlete triad: 1st International Conference held in San Francisco, California, May 2012 and 2nd International Conference held in Indianapolis, Indiana, May 2013. Br. J. Sports Med. 48, 289-289. ( 10.1136/bjsports-2013-093218) [DOI] [PubMed] [Google Scholar]
- 44.Mountjoy M, et al. 2014. The IOC consensus statement: beyond the Female Athlete Triad—Relative Energy Deficiency in Sport (RED-S). Br. J. Sports Med. 48, 491-497. ( 10.1136/bjsports-2014-093502) [DOI] [PubMed] [Google Scholar]
- 45.De Souza MJ, Lee DK, Vanheest JL, Scheid JL, West SL, Williams NI. 2007. Severity of energy-related menstrual disturbances increases in proportion to indices of energy conservation in exercising women. Fertil. Steril. 88, 971-975. ( 10.1016/j.fertnstert.2006.11.171) [DOI] [PubMed] [Google Scholar]
- 46.Koehler K, Williams NI, Mallinson RJ, Southmayd EA, Allaway HC, De Souza MJ. 2016. Low resting metabolic rate in exercise-associated amenorrhea is not due to a reduced proportion of highly active metabolic tissue compartments. Am. J. Physiol. 311, E480-E487. ( 10.1152/ajpendo.00110.2016) [DOI] [PubMed] [Google Scholar]
- 47.Mackenzie-Shalders K, Kelly JT, So D, Coffey VG, Byrne NM. 2020. The effect of exercise interventions on resting metabolic rate: a systematic review and meta-analysis. J. Sports Sci. 38, 1635-1649. ( 10.1080/02640414.2020.1754716) [DOI] [PubMed] [Google Scholar]
- 48.Pontzer H. 2015. Constrained total energy expenditure and the evolutionary biology of energy balance. Exerc. Sport Sci. Rev. 43, 110-116. ( 10.1249/JES.0000000000000048) [DOI] [PubMed] [Google Scholar]
- 49.Halsey LG. 2021. The mystery of energy compensation. arxiv [Online]. Available: (http://arxiv.org/abs/2107.13418).
- 50.Allaway HC, Southmayd EA, de Souza MJ. 2016. The physiology of functional hypothalamic amenorrhea associated with energy deficiency in exercising women and in women with anorexia nervosa. Horm. Mol. Biol. Clin. Investig. 25, 91-119. ( 10.1515/hmbci-2015-0053) [DOI] [PubMed] [Google Scholar]
- 51.Chou SH, Mantzoros C. 2018. Bone metabolism in anorexia nervosa and hypothalamic amenorrhea. Metabolism 80, 91-104. ( 10.1016/j.metabol.2017.10.009) [DOI] [PubMed] [Google Scholar]
- 52.Tornberg ÅB, Melin A, Koivula FM, Johansson A, Skouby S, Faber J, Sjödin A. 2017. Reduced neuromuscular performance in amenorrheic elite endurance athletes. Med. Sci. Sports Exerc. 49, 2478-2485. ( 10.1249/MSS.0000000000001383) [DOI] [PubMed] [Google Scholar]
- 53.Areta JL. 2020. Case study: resumption of eumenorrhea in parallel with high training load after 4 years of menstrual dysfunction: a 5-year follow-up of an elite female cyclist. Int. J. Sport Nutr. Exerc. Metab. 30, 229-234. ( 10.1123/ijsnem.2019-0284) [DOI] [PubMed] [Google Scholar]
- 54.Essen B, Fohlin L, Thorén G, Saltin B. 1981. Skeletal muscle fibre types and sizes in anorexia nervosa patients. Clin. Physiol. 1, 395-403. ( 10.1111/j.1475-097X.1981.tb00907.x) [DOI] [PubMed] [Google Scholar]
- 55.Mcloughlin DM, Spargo E, Wassif WS, Newham DJ, Peters TJ, Lantos PL, Russell GF. 1998. Structural and functional changes in skeletal muscle in anorexia nervosa. Acta Neuropathol. 95, 632-540. ( 10.1007/s004010050850) [DOI] [PubMed] [Google Scholar]
- 56.Areta JL, Taylor HL, Koehler K. 2021. Low energy availability: history, definition and evidence of its endocrine, metabolic and physiological effects in prospective studies in females and males. Eur. J. Appl. Physiol. 121, 1-21. ( 10.1007/s00421-020-04516-0) [DOI] [PMC free article] [PubMed] [Google Scholar]
- 57.De Souza MJ, Toombs R, Scheid J, O'Donnell E, West SL, Williams NI. 2010. High prevalence of subtle and severe menstrual disturbances in exercising women: confirmation using daily hormone measures. Hum. Reprod. 25, 491-503. ( 10.1093/humrep/dep411) [DOI] [PubMed] [Google Scholar]
- 58.Loucks A, Verdun M, Heath E. 1998. Low energy availability, not stress of exercise, alters LH pulsatility in exercising women. J. Appl. Physiol. 84, 37-46. ( 10.1152/jappl.1998.84.1.37) [DOI] [PubMed] [Google Scholar]
- 59.Loucks AB, Thuma JR. 2003. Luteinizing hormone pulsatility is disrupted at a threshold of energy availability in regularly menstruating women. J. Clin. Endocrinol. Metab. 88, 297-311. ( 10.1210/jc.2002-020369) [DOI] [PubMed] [Google Scholar]
- 60.Loucks A, Callister R. 1993. Induction and prevention of low-T3 syndrome in exercising women. Am. J. Physiol. 264, R924-R930. ( 10.1152/ajpregu.1993.264.5.R924) [DOI] [PubMed] [Google Scholar]
- 61.Papageorgiou M, Martin D, Colgan H, Cooper S, Greeves JP, Tang JC, Fraser WD, Elliott-Sale KJ, Sale C. 2018. Bone metabolic responses to low energy availability achieved by diet or exercise in active eumenorrheic women. Bone 114, 181-188. ( 10.1016/j.bone.2018.06.016) [DOI] [PubMed] [Google Scholar]
- 62.Hilton L, Loucks A. 2000. Low energy availability, not exercise stress, suppresses the diurnal rhythm of leptin in healthy young women. Am. J. Physiol. 278, E43-E49. ( 10.1152/ajpendo.2000.278.1.E43) [DOI] [PubMed] [Google Scholar]
- 63.Kim B. 2008. Thyroid hormone as a determinant of energy expenditure and the basal metabolic rate. Thyroid 18, 141-144. ( 10.1089/thy.2007.0266) [DOI] [PubMed] [Google Scholar]
- 64.Blüher S, Mantzoros CS. 2009. Leptin in humans: lessons from translational research. Am. J. Clin. Nutr. 89, 991S-997S. ( 10.3945/ajcn.2008.26788E) [DOI] [PMC free article] [PubMed] [Google Scholar]
- 65.Rosenbaum M, Murphy EM, Heymsfield SB, Matthews DE, Leibel RL. 2002. Low dose leptin administration reverses effects of sustained weight-reduction on energy expenditure and circulating concentrations of thyroid hormones. J. Clin. Endocrinol. Metab. 87, 2391-2394. ( 10.1210/jcem.87.5.8628) [DOI] [PubMed] [Google Scholar]
- 66.Rosenbaum M, Goldsmith RL, Haddad F, Baldwin KM, Smiley R, Gallagher D, Leibel RL. 2018. Triiodothyronine and leptin repletion in humans similarly reverse weight-loss-induced changes in skeletal muscle. Am. J. Physiol. Endocrinol. Metab. 315, E771-E779. ( 10.1152/ajpendo.00116.2018) [DOI] [PMC free article] [PubMed] [Google Scholar]
- 67.Thyfault JP, Bergouignan A. 2020. Exercise and metabolic health: beyond skeletal muscle. Diabetologia 63, 1464-1474. ( 10.1007/s00125-020-05177-6) [DOI] [PMC free article] [PubMed] [Google Scholar]
- 68.Heymsfield SB, Smith B, Dahle J, Kennedy S, Fearnbach N, Thomas DM, Bosy-Westphal A, Müller MJ. 2021. Resting energy expenditure: from cellular to whole-body level, a mechanistic historical perspective. Obesity 29, 500-511. ( 10.1002/oby.23090) [DOI] [PubMed] [Google Scholar]
- 69.Areta JL, et al. 2014. Reduced resting skeletal muscle protein synthesis is rescued by resistance exercise and protein ingestion following short-term energy deficit. Am. J. Physiol. 306, E989-E997. ( 10.1152/ajpendo.00590.2013) [DOI] [PubMed] [Google Scholar]
- 70.Hector AJ, Marcotte GR, Churchward-Venne TA, Murphy CH, Breen L, Von Allmen M, Baker SK, Phillips SM. 2015. Whey protein supplementation preserves postprandial myofibrillar protein synthesis during short-term energy restriction in overweight and obese adults. J. Nutr. 145, 246-252. ( 10.3945/jn.114.200832) [DOI] [PubMed] [Google Scholar]
- 71.Pasiakos SM, et al. 2010. Acute energy deprivation affects skeletal muscle protein synthesis and associated intracellular signaling proteins in physically active adults. J. Nutr. 140, 745-751. ( 10.3945/jn.109.118372) [DOI] [PubMed] [Google Scholar]
- 72.Hector AJ, McGlory C, Damas F, Mazara N, Baker SK, Phillips SM. 2018. Pronounced energy restriction with elevated protein intake results in no change in proteolysis and reductions in skeletal muscle protein synthesis that are mitigated by resistance exercise. FASEB J. 32, 265-275. ( 10.1096/fj.201700158RR) [DOI] [PubMed] [Google Scholar]
- 73.Murphy CH, et al. 2018. Effect of resistance training and protein intake pattern on myofibrillar protein synthesis and proteome kinetics in older men in energy restriction. J. Physiol. 596, 2091-2120. ( 10.1113/JP275246) [DOI] [PMC free article] [PubMed] [Google Scholar]
- 74.Murphy CH, Churchward-Venne TA, Mitchell CJ, Kolar NM, Kassis A, Karagounis LG, Burke LM, Hawley JA, Phillips SM. 2015. Hypoenergetic diet-induced reductions in myofibrillar protein synthesis are restored with resistance training and balanced daily protein ingestion in older men. Am. J. Physiol. 308, E734-E743. ( 10.1152/ajpendo.00550.2014) [DOI] [PMC free article] [PubMed] [Google Scholar]
- 75.Weinheimer EM, Sands LP, Campbell WW. 2010. A systematic review of the separate and combined effects of energy restriction and exercise on fat-free mass in middle-aged and older adults: implications for sarcopenic obesity. Nutr. Rev. 68, 375-388. ( 10.1111/j.1753-4887.2010.00298.x) [DOI] [PubMed] [Google Scholar]
- 76.Murphy C, Koehler K. 2022. Energy deficiency impairs resistance training gains in lean mass but not strength: a meta-analysis and meta-regression. Scand. J. Med. Sci. Sports 32, 125-137. ( 10.1111/sms.14075) [DOI] [PubMed] [Google Scholar]
- 77.Marosi K, et al. 2018. Metabolic and molecular framework for the enhancement of endurance by intermittent food deprivation. FASEB J. 32, 3844. ( 10.1096/fj.201701378RR) [DOI] [PMC free article] [PubMed] [Google Scholar]
- 78.Toledo FG, Menshikova EV, Azuma K, Radiková Z, Kelley CA, Ritov VB, Kelley DE. 2008. Mitochondrial capacity in skeletal muscle is not stimulated by weight loss despite increases in insulin action and decreases in intramyocellular lipid content. Diabetes 57, 987-994. ( 10.2337/db07-1429) [DOI] [PubMed] [Google Scholar]
- 79.Coen PM, et al. 2015. Exercise and weight loss improve muscle mitochondrial respiration, lipid partitioning, and insulin sensitivity after gastric bypass surgery. Diabetes 64, 3737-3750. ( 10.2337/db15-0809) [DOI] [PMC free article] [PubMed] [Google Scholar]
- 80.Pontzer H, et al. 2021. Daily energy expenditure through the human life course. Science 373, 808-812. ( 10.1126/science.abe5017) [DOI] [PMC free article] [PubMed] [Google Scholar]
- 81.Compher C, Frankenfield D, Keim N, Roth-Yousey L. 2006. Best practice methods to apply to measurement of resting metabolic rate in adults: a systematic review. J. Am. Diet Assoc. 106, 881-903. ( 10.1016/j.jada.2006.02.009) [DOI] [PubMed] [Google Scholar]
- 82.Villareal DT, Chode S, Parimi N, Sinacore DR, Hilton T, Armamento-Villareal R, Napoli N, Qualls C, Shah K. 2011. Weight loss, exercise, or both and physical function in obese older adults. N. Engl. J. Med. 364, 1218-1229. ( 10.1056/NEJMoa1008234) [DOI] [PMC free article] [PubMed] [Google Scholar]
- 83.Brennan AM, et al. 2022. Weight loss and exercise differentially affect insulin sensitivity, body composition, cardiorespiratory fitness, and muscle strength in older adults with obesity: a randomized controlled trial. J. Gerontol. A Biol. Sci. Med. Sci. 77, 1088-1097. ( 10.1093/gerona/glab240) [DOI] [PMC free article] [PubMed] [Google Scholar]
- 84.Gonzalez JT, Batterham AM, Atkinson G, Thompson D. 2023. Perspective: is the response of human energy expenditure to increased physical activity additive or constrained? Adv. Nutr. 14, 406-419. ( 10.1016/j.advnut.2023.02.003) [DOI] [PMC free article] [PubMed] [Google Scholar]
Associated Data
This section collects any data citations, data availability statements, or supplementary materials included in this article.
Data Availability Statement
All data presented in this article are collated from the literature, and presented in table 1.