

Abstract
Changes correlating with increasing obesity include insulin resistance, hyperlipidaemia, hyperinsulinaemia, highly processed food and environmental toxins including plastics and air pollution. The relationship between the appearance of each of these potential causes and the onset of obesity is unknown. The cause(s) must precede obesity, the consequence, and temporally relate to its rising incidence. Macronutrients such as carbohydrates or fats are unlikely to cause obesity since these have long been constituents of human diets. Furthermore, food consumption and body weight have been well-regulated in most humans and other species until recent times. Thus, attention must focus on changes that have occurred in the last half-century and the relationship between such changes and specific populations that are impacted. The hypothesis presented here is that substances that have entered our bodies recently cause obesity by generating false and misleading information about energy status. We propose that this misinformation is caused by changes in the oxidation–reduction (redox) potential of metabolites that circulate and communicate to organs throughout the body. Examples are provided of food additives that generate reactive oxygen species and impact redox state, thereby, eliciting inappropriate tissue-specific functional changes, including insulin secretion. Reversal requires identification, neutralization, or removal of these compounds.
This article is part of a discussion meeting issue ‘Causes of obesity: theories, conjectures and evidence (Part I)’.
Keywords: redox, reactive oxygen species, metabolic regulation, hyperinsulinaemia, mitochondria, energy metabolism
1. Introduction
World-wide obesity has nearly tripled since 1975, according to the World Health Organization. This is unlikely to be caused by genetic changes since they do not occur on such a short time scale. Furthermore, a recent study found that average body weights have risen among primates and rodents living in research environments, as well as among domestic dogs and cats [1]. Thus, animals that share our environment are also becoming obese [2]. Among a cohort of people aged 2–19 years, the rate of body mass index increase roughly doubled during the pandemic [3]. Current strategies, concepts and putative solutions appear to have had no impact. This perspective presents an alternative testable and actionable hypothesis.
2. Hypothesis: excess reactive oxygen species,1 often designated as inflammation or oxidative stress, generate false signals
Reactive oxygen species (ROS) are important normal cell constituents produced as signals in response to fuel excess. It is hypothesized that environmental substances, which have entered our bodies during the last half century, cause obesity by inducing oxidative stress. This is hypothesized to be caused by an imbalance between the generation of ROS and ROS removal capacity of the antioxidant systems of cells. We further propose that such excess ROS generates false and misleading signals concerning the energy state. Such misleading signals of fuel excess stimulate insulin secretion and lipid storage, inappropriately. This would transiently lower blood glucose, thereby inducing hunger, followed by food consumption, insulin secretion and increased fat storage [4,5]. Sustained hyperinsulinaemia ultimately causes insulin resistance [6] and increases lipid stores in excess of normal adipocyte capacity, thus inducing adipose tissue inflammation [7], altering the circulating lipid profile and promoting ectopic fat deposition [8]. Excess intracellular lipid content in ß-cells, muscle and liver then may impact lipid-mediated signalling within cells [9]. As an example, we have documented a direct correlation between ß-cell lipid content and basal insulin hypersecretion and a negative correlation between lipid content and both glucose stimulated insulin secretion (GSIS) and insulin content [10]. Overwhelming the ROS antioxidant capacity disrupts normal regulation of energy efficiency and causes systemic inflammation [11].
3. Control of body weight
Body weight and fuel stores are genetically determined. Regulation occurs through alterations in food input, exercise and energy efficiency [12]. In nature, variations in all three regulatory processes have been observed, and these variations serve to sustain, decrease or increase body weight and body fat stores [13]. Energy efficiency increases in anticipation of hibernation or migration or in response to fuel deprivation; energy is wasted in response to fuel excess and during heat production [14]. Since the start of the obesity epidemic, very little research has focused on the potential impact of exogenous non-food factors on body weight and fuel handling efficiency. Rather, most research/therapeutic focus has assumed volitional control of food intake, body adipose stores and activity levels [6,15–19]. Significant consideration should be given to the possibility that body weight and fat stores are centrally programmed, much like height and temperature. Such a possibility implies that this normal regulated process can be disrupted by something that has entered our environment in the last half century to cause obesity, which we will refer to as obesogens.
4. Normal mitochondrial redox and reactive oxygen species regulation: information sharing among tissues
Cooperative systemic neural and hormonal communication networks are well-established and essential for physiological function. However, it is also important that all tissues in the body be continuously aware of the metabolic state and poised to respond rapidly and appropriately to the need to maintain essential local energy supply.
We have proposed (figure 1) a redox communication system to maintain systemic energy [16,20–23]. Metabolism alters redox reactants frequently and transiently in all cells and cellular compartments in response to fuel need or fuel excess. Redox reactants comprise an essential energy-sensitive communication system within each cell and among cellular compartments [16,20,21,23]. The metabolism of both glucose and fatty acids increases mitochondrial nicotinamide adenine dinucleotide hydrogen (NADH) levels. When more fuel is present than is needed to maintain essential adenosine triphosphate (ATP) levels, increases occur in the mitochondrial NADH/NAD ratio leading to ROS generation (figure 1a), mainly in the form of H2O2 [20,21,23]. By contrast, an increase in energy demand, or a fall in ATP, stimulates mitochondrial NADH consumption to restore the ATP/ADP (adenosine diphosphate) ratio and diminishes ROS production. Because the NADH/NAD ratio also impacts all reactants involved in dehydrogenase reactions that share these cofactors, the redox state is also reflected in their substrate to product metabolite ratios (figure 1b). Since some of these metabolites equilibrate across mitochondrial and cytosolic membranes, such intracellular information is reflected in circulating metabolite redox indicators, thereby, sharing energetic information among organs [16].
Figure 1.

Redox communication system. (a) Fuels generate NADH that donates electrons to the electron transport chain generating a proton gradient that drives ATP synthesis via ATP (complex V). Excess NADH, more than needed to maintain ATP levels, generates ROS. Most ROS is converted to H2O2 by superoxide dismutase (SOD). (b) Redox state information is shared among all tissues via circulating metabolites. Metabolites that are readily transported into and out of cells reflect the redox state in their compartment of origin. Thus, the lactate to pyruvate ratio (L/P) reflects the cytosolic NADH/NAD ratio, mainly influenced by muscle; the ß-hydroxybutyrate to acetoacetate ratio (ß/A) reflects the mitochondrial redox state, mainly influenced by liver; the cysteine to cystine ratio (SH/SS) reflects the intracellular thiol ratio, mainly influenced by reactive oxygen species (ROS) production. (c) Nicotinamide nucleotide transhydrogenase (NNT), like ATP synthase, uses the proton gradient to convert NADH to NADPH. NADPH, in turn maintains the thiols in the reduced state needed to convert H2O2 to H2O. (d) NADPH is required to return oxidized glutathione (GSSG) to the reduced state (GSH) after glutathione peroxidase detoxifies H2O2 to H2O. NADH is restored by fuels that generates pyruvate, lactate, acetoacetate (Acoc), ß-hydroxybutyrate (ß-OHB). (Online version in colour.)
Britton Chance and colleagues were first to determine the mechanism of many of the mitochondrial changes in ROS production. They documented that these changes were related to electron transport chain (ETC) flux and changes in O2 consumption [24–29]. In turn, increases in ROS production are coupled to ROS removal by nicotinamide nucleotide transhydrogenase (NNT) (figure 1c,d). A key role of NNT is to generate mitochondrial NADPH that is needed to scavenge ROS. Thus, NNT activity serves to maintain the thiol redox state at the expense of a proton leak since NNT uses the proton gradient as the driving force for NADPH production [30]. The net effect of NADPH generation by NNT is to use some of the excess fuel to remove ROS and waste energy.
The prominent response to fuel excess, elicited by elevated mitochondrial NADH, is a rise in ROS production (figure 1a) by complexes I and III of the ETC [31,32]. In addition, the increase in ROS production in response to excess free fatty acid (FFA) oxidation is greater than the response to excess glucose since ß-oxidation donates electrons to the ETC via both complexes I and III. Nutrient excess is also associated with an increased mitochondrial membrane potential that is essential for both ROS generation and scavenging [33]. Variations in ROS scavenging capacity and efflux of ROS from the mitochondria as well as the levels of other reactive species determine the consequences and duration of ROS elevation [27].
5. Control of energy efficiency
Mitochondria are the main site of cellular ROS production [34]. ROS removal, within the mitochondrial matrix, is achieved using electrons from such redox couples as thioredoxin and glutathione, which require the availability of NADPH at major rate-controlling steps to convert the oxidized reactant to the reduced reactant (figure 1d) [33].
We suggest that the ‘leak’ resulting from flux through NNT is a positive and key element in maintaining stable body fuel stores and regulating energy efficiency. Thus, excess fuel generates ROS as a signal. Subsequently ROS removal stimulates flux through NNT and ‘wastes’ energy when fuel is plentiful but not when resources are scarce or membrane potential low. This mechanism can explain variations in energy efficiency and variations in the amount of substrate required to produce a molecule of ATP [35]. This implies that when fuel supply is abundant, more fuel is used to make each molecule of ATP than when fuel supply is low because energy is ‘wasted’ scavenging ROS. This mechanism of increased ROS production in the presence of excess nutrients uses some of the fuel to signal excess and remove ROS. ROS removal also depends on ROS scavenging capacity, thiol availability and rapid restoration of reduced thiols. Thus, overwhelming ROS removal capacity will cause failure to compensate for caloric variation, diminish energy wasting, sustain elevated ROS levels, promote oxidative damage leading to the dysregulation of insulin secretion, fat storage and appetite control and favour obesity. Loss of such compensatory variations in energy efficiency would be predicted in the absence of NNT or when NNT capacity is overwhelmed by non-fuel ROS generation. This may explain the value of the C57Bl6J mouse as the most commonly used model for obesity and diabetes research since this model lacks NNT [33,36–38].
6. Evidence for human variations in energy efficiency in response to over- and undernutrition
Elegant studies by Leibel et al. have documented that efforts to decrease or increase body weight cause compensatory changes in energy expenditure that oppose the desired weight change and strive to maintain the ‘normal’ weight. Weight gain due to overfeeding requires more calories per day than predicted from caloric intake at weight stability, presumably due to decreased energy efficiency. Likewise, weight loss requires a greater decrement in caloric intake than anticipated, due to increased energy efficiency. These compensatory responses to variations in nutrient intake may explain the failure of most treatments for obesity [39,40], the tendency to maintain and restore weight, and periods of weight stability. Consistent with this concept, an early study designed to experimentally increase body weight in lean individuals required around 8000 calories per day to induce a 20% weight increase and normal weight was spontaneously restored in most subjects when the study ended [41,42].
7. Reactive oxygen species: essential signals in all cells
ROS increases elicit a wide variety of cell-specific responses depending on the cellular compartment and specific cell type (figure 2). Adipocytes increase lipid cycling, both lipolysis and triglyceride synthesis. This leads to a net increase in triglyceride stores, if insulin is also elevated, or a net decrease at basal insulin or when lipolytic hormones rise [21]. ROS also inhibits the ETC in adipocytes essentially blocking fatty acid oxidation to favour fat storage over fat burning [43]. Insulin secretion is stimulated in pancreatic ß-cells in response to increased ROS, whether of mitochondrial, cytosolic, or extracellular origin and is inhibited in response to ROS scavenging [16,44–46]. ROS effects are greater in ß-cells than other cells because they express low levels of ROS scavenging enzymes [47]. Gluconeogenesis is inhibited in hepatocytes in response to ROS [23]. ROS has also been shown to act in the hypothalamus to modulate food intake through effects on various neurons, including pro-opiomelanocortin and agouti-related protein (AgRP)-neuropeptide Y (NPY) neurons. Neuronal AgRP and NPY are stimulated and melanocortin-stimulating hormone is decreased in response to increased ROS [48]. Elevations in hypothalamic ROS are influenced by a variety of hormones and nutrients and mitochondria are considered to be the primary ROS source [49]. These varied consequences of ROS production in response to excess fuel in different cell types are logical and synergistic: ß-cells release insulin to promote fuel storage, adipocytes synthesize triglycerides, hepatocytes cease glucose production and neurons signal satiety (figure 2). However, ROS increases that are not related to energy state can generate misleading signals and cause oxidative stress (figure 3). H2O2 impacts susceptible proteins or effects the thiol redox state that influences hundreds of proteins containing reactive cysteines. ROS also synergistically impact opposing enzymatic functions [50,51], inhibiting phosphatases and stimulating kinases [52–55].
Figure 2.
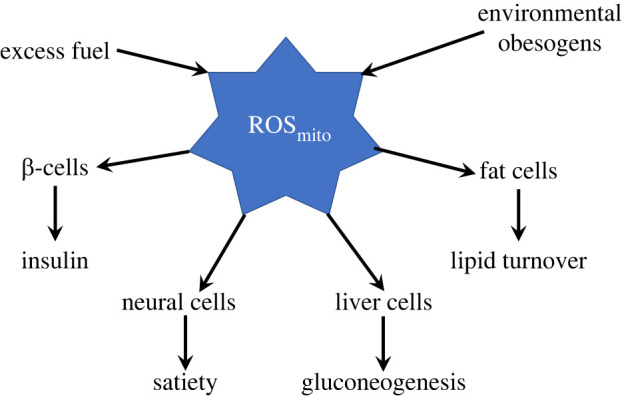
ROS signals and targets. Mitochondrial ROS is normally produced in response to excess fuel (NADH). ROS is an important signal of fuel excess that regulates energy metabolism by modulating insulin secretion from ß-cells, triglyceride synthesis in fat cells, gluconeogenesis in liver, and hunger and satiety in neural cells. Environmental obesogens may generate inappropriate signals by similar mechanisms. (Online version in colour.)
Figure 3.
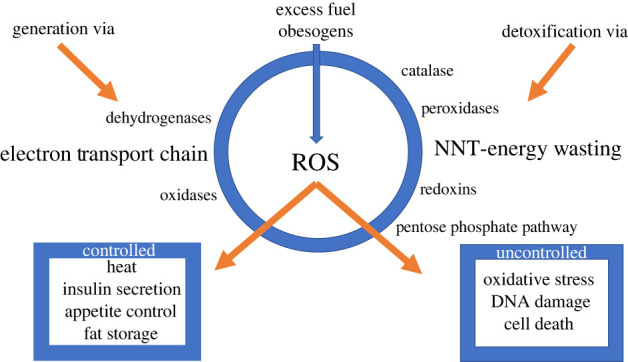
Generation and detoxification of ROS. ROS is an important signal that impacts heat generation, insulin secretion, appetite control and fuel storage when controlled but causes oxidative stress, DNA damage and cell death when excessive. In addition to ROS produced in the electron transport chain in response to excess fuel, ROS is also generated by several mitochondrial dehydrogenases and cellular oxidases. Detoxification or ROS removal involves a variety of processes in multiple compartments. In the mitochondria NNT and peroxidases dominate and in the cytosolic and microsomal compartments peroxidases, the pentose phosphate pathway, catalase and redoxins all play important roles. The mechanisms by which obesogens increase ROS are not yet defined nor is it known whether they effect the generation or detoxification of ROS. (Online version in colour.)
ROS can also be generated from xanthine oxidase (XO), NADPH oxidases (NOX), in addition to the mitochondrial ETC [56]. Under physiological conditions, ROS is controlled by the antioxidant defence system important in regulating cellular homeostasis [57]. However, excessive ROS production or impaired antioxidant capacity can disrupt redox signalling and cause molecular damage [58].
8. Protection from excess reactive oxygen species
The normal variations in ROS are critical, transient, natural and essential signals (figure 3). However, they can be harmful when present in excess or for prolonged periods or when generated inappropriately, when fuel is not excessive and fuel storage and appetite control are not needed. Cells are protected from excess or extended exposure to ROS by multiple defence systems and antioxidants: glutathione peroxidases, thioredoxin peroxidases, superoxide dismutases (SODs), peroxiredoxins, glutathione, thioredoxin 2, glutaredoxin 2, cytochrome c oxidase (complex IV), coenzyme Q, ascorbic acid, tocopherol, vitamin E and carotene [20–25]. Moreover, catalase, which commonly detoxifies H2O2 in the peroxisome, is also found in other compartments [26,27].
During ageing and other disease states ROS-protective systems diminish [59] consistent with the more oxidized circulating thiol redox indicators [60]. ROS generated by many cellular processes can be overproduced in response to stimuli. Such major increases in ROS levels can overwhelm the antioxidant defence mechanisms causing oxidative stress and ultimately cell death. Oxidative damage can impact many functions causing inflammation, ageing, neurodegenerative disorders and cancer [61].
Sirtuins and other transcriptional regulators also exert important post-translational modifications on antioxidant enzymes and mediate enhanced antioxidant defence. These include glucose-6-phosphate dehydrogenase deacetylation regulating NADPH homeostasis [62]; deacetylation of SOD2 during caloric restriction, leading to increased activity and decreased oxidative stress [63]; and peroxiredoxin 3 deacetylation by SIRT3 protecting small intestine from oxidative stress [64]. Recent evidence suggests that sirtuin 6 is also involved in upregulating the antioxidant response [65]. It is not known whether obesogens impact any of these important ROS defence systems.
9. Causes of obesity
Numerous causes of obesity have been hypothesized including increased dietary fat, carbohydrate or ultra-processed food (UPF) consumption, inactivity, hyperlipidaemia and hyperinsulinaemia [66]. Based on these hypotheses, solutions have been sought that involved decreasing consumption of suspected agents. Interestingly, a meta-analysis of 23 studies on low fat versus low carbohydrate diets provided support for the greater benefits of low carb diets (figure 4, https://www.healthline.com/nutrition/23-studies-on-low-carb-and-low-fat-diets). Well-controlled studies have also shown that increased consumption of UPF is associated with increased food consumption and weight gain while decreasing UPF consumption in the same subjects was associated with weight loss [67]. However, these studies do not identify a specific cause of obesity since the diets include multiple variables. Low carb diets tend to contain less UPF and decreased UPF consumption appears to decrease total calorie as well as carbohydrate intake. Both high carb and high UPF contain many new and non-nutrient ingredients and potential obesogens. Thus, the precise mechanisms and critical variables are difficult to establish.
Figure 4.

Comparison of low carb and low fat diets. Data from https://www.healthline.com ‘Wellness Topics’ nutrition. Data taken from 23 studies on low carb and low fat diets. (Online version in colour.)
Variations in energy efficiency are implied in several controlled human feeding studies. Individuals who have the greatest increase in energy expenditure during overfeeding are most resistant to weight gain [68] whereas those that decrease energy expenditure most during food deprivation are most likely to gain weight [69]. Such variations are most likely genetically determined. In this perspective, we suggest that new chemicals that have arisen in the past half century, elevated in both UPF and processed carbohydrates, and frequently consumed unintentionally, generate false signals that subvert normal regulatory mechanisms, increase basal insulin secretion and lead to obesity in susceptible individuals. Indeed, basal hyperinsulinaemia has been found to predict the development of future obesity [66,70,71].
10. What has changed in our environment?
It is unlikely that macronutrients such as carbohydrates or fats cause obesity since these have long been constituents of the human diet [72–74]. High carbohydrate diets have been common in warm to moderate climates where agriculture thrives, and high fat diets have been consumed in cold climates where dairy is a major source of nutrients. Furthermore, food consumption and body weight have been stable and well-regulated in all species until recent times. In addition, the notion that increased saturated fat or red meat consumption could cause obesity is inconsistent with the most recent public health data since consumption of these foods has decreased [75]. The increasing incidence of obesity correlates with increasing consumption of UPF along with thousands of potential environmental toxins including some derived from fertilizers, insecticides, plastics and air pollutants [76–78]. Neither the sequence nor causal relationship between the appearance of each of these possible causes of obesity and the onset of obesity has been quantitatively determined.
Our attention must focus on changes that have occurred in the last half-century. The number of agricultural chemicals registered with the US government grew from a few to over 21 000 by the year 2000 (https://www.nass.usda.gov). These products contain more than 875 active ingredients. US farmers are spending close to five per cent of their total operating budgets on pesticides. In 1960, the University of Nebraska Extension Service published a guide to all known ‘Chemicals that Control Weeds’. The guide was printed on one double-sided sheet of paper, 8½ by 24 inches long. In 2005, the ‘Guide to Weed Management in Nebraska’ was 168 pages long (https://extensionpubs.unl.edu).
Not all changes mentioned above are negative since some have provided food for our ever-increasing human population and diminished the prevalence of starvation as a leading world health problem. Our concern is on the need for a rigorous assessment of the metabolic impact of any new food or non-food agents that currently may impact our bodies’ metabolic regulation. Such an assessment would benefit greatly from the availability of libraries containing all new chemicals that may be ingested, as well as addition to such a library of any new chemicals, prior to permitting their access to our environment. Such a chemical library could then be used to perform mechanistic investigations into possible metabolic targets and impacts.
11. Food additives can generate reactive oxygen species
Obesogens include chemicals that can be ingested, often inadvertently, including tributyltin (TBT), blood-borne pathogens (BBP), arsenic, atrazine, cadmium, chlorpyrifos, diethylhexyl phthalate (DEHP), perfluorooctanoic acid (PFOA), perfluorooctane sulfonate (PFOS) and tetrachlorodibenzo-p-dioxin (TCDD) that have been reported to target mitochondria resulting in excessive ROS production, cell death and insulin resistance (reviewed in [79]). TBT and bisphenol A (BPA) also impact mitochondrial bioenergetics [80,81]. Polluted air increases systemic oxidative stress and inflammation in mouse models, leading to obesity [82,83]. The molecular mechanisms involved in obesogen ROS generation remain unknown but include many candidates (figure 3). The broad categories that need to be considered include stimulation of ROS generation via the respiratory chain, NOX, several mitochondrial dehydrogenases, several cellular oxidases (monoamine, lysyl, microsomal monamine, etc.); inhibition of ROS detoxification including redoxins, catalase, peroxidases and the pentose phosphate pathway; and transcriptional adaptation to increases in ROS.
We have also identified a small number of examples of non-nutrient food additives that can generate ROS and stimulate ß-cell insulin secretion inappropriately at basal glucose [46]. It is not yet known whether sufficiently high levels of such food additives occur in humans, but this can be determined. ROS generation also occurs in response to cytokines, inflammation and xenobiotics in many systems [84]. Increases in cytokines accompany the inflammatory state induced by enlarged adipocytes [85]. Such increases in cytokines can also have a beneficial effect by inducing adipocyte [86] or ß-cell proliferation [87] in order to accommodate excess nutrients. When induced by exogenous agents, these may be appropriate responses to a misperceived need for ß-cells to secrete more insulin or adipocytes to store more fat. Reversal of the increasing obesity trend in the population requires determination of whether the effects of these, or the thousands of other yet untested agents, have a detrimental impact on humans in vivo. Identification and in vivo confirmation of significant levels of inappropriate ROS generators would hopefully lead to removal of such substances, referred to as obesogens or metabolic disruptors [76], from our food environment [88–90]. It has clearly been documented that insulin secretion at basal glucose can stimulate food consumption and induce weight gain [4,91], in addition to overworking ß-cells and leading to diabetes [19,92]. Furthermore, the same signals that inappropriately stimulate insulin secretion may similarly misinform function in other organs. It is important to note that ROS scavenging cannot be an effective therapeutic intervention since it will also block essential signal generation and fuel responses.
12. Testing the hypothesis
Identification and determination of the tissue levels and concentration dependence for inappropriate ROS production by food additives and other agents that inadvertently enter our bodies from the environment is urgent. Such screening can be performed in vitro in isolated cells: insulin secretion at basal glucose in ß-cells; TG synthesis in adipocytes; gluconeogenesis in hepatocytes; and ROS production in most other cell types. Determination of blood or tissue levels of proposed disruptive agents during the development of hyperinsulinaemia and obesity may be achieved using newly available mass-spectral-analysis, even in existing samples. Differences among individuals in responses to inappropriate ROS signal generation may also be expected based on variations in ROS scavenging capacity (thiol content, catalase and peroxidase expression), a characteristic that has not been evaluated.
It is extremely disturbing that most publications and guidance on obesity are based on the unproven and often untestable concept that obesity and resulting metabolic dysfunction can be resolved through behavioural or macronutrient selection, despite lack of compelling evidence that these approaches are effective in most individuals. We present this alternative and testable hypothetical framework to encourage serious consideration and analysis of the thousands of new substances that have entered our environment since the epidemic began, if they are found to be present in human samples. Documentation of their presence in humans or animals that share our environment will justify careful assessment of their impact on energy efficiency and removal from our environment, if harmful. This endeavour will be greatly facilitated by the construction of a readily available library of chemicals that have appeared in our food supply and environment since the mid twentieth century.
13. Summary
In summary, we propose that non-fuel substances increase ROS either directly or through changes in the oxidation–reduction potential of circulating metabolites or by impairment of antioxidant defence. These changes are communicated throughout the body and induce false signals of fuel excess in many organs leading to obesity and dysfunctional metabolic energy regulation.
Endnote
Reactive oxygen species (ROS) refers to a class of reactive compounds formed from O−2, including H2O2. This group of compounds are non-specifically designated oxidative stress, elevated cytokines or inflammation.
Data accessibility
This article has no additional data.
Author contribution
B.C.: conceptualization, formal analysis, investigation, methodology, writing—original draft, writing—review and editing.
Conflict of interest declaration
I declare I have no competing interests.
Funding
I received no funding for this study.
References
- 1.Klimentidis YC, et al. 2011. Canaries in the coal mine: a cross-species analysis of the plurality of obesity epidemics. Proc. R. Soc. B 278, 1626-1632. ( 10.1098/rspb.2010.1890) [DOI] [PMC free article] [PubMed] [Google Scholar]
- 2.Harris SE, Munshi-South J. 2017. Signatures of positive selection and local adaptation to urbanization in white-footed mice (Peromyscus leucopus). Mol. Ecol. 26, 6336-6350. ( 10.1111/mec.14369) [DOI] [PMC free article] [PubMed] [Google Scholar]
- 3.Woolford SJ, Sidell M, Li X, Else V, Young DR, Resnicow K, Koebnick C. 2021. Changes in body mass index among children and adolescents during the COVID-19 pandemic. J. Am. Med. Assoc. 326, 1434-1436. ( 10.1001/jama.2021.15036) [DOI] [PMC free article] [PubMed] [Google Scholar]
- 4.Willing AE, Walls EK, Koopmans HS. 1990. Insulin infusion stimulates daily food intake and body weight gain in diabetic rats. Physiol. Behav. 48, 893-898. ( 10.1016/0031-9384(90)90245-y) [DOI] [PubMed] [Google Scholar]
- 5.Larue-Achagiotis C, Goubern M, Laury MC. 1988. Concomitant food intake and adipose tissue responses under chronic insulin infusion in rats. Physiol. Behav. 44, 95-100. ( 10.1016/0031-9384(88)90351-4) [DOI] [PubMed] [Google Scholar]
- 6.Corkey BE. 2012. Diabetes: have we got it all wrong? Insulin hypersecretion and food additives: cause of obesity and diabetes? Diabetes Care 35, 2432-2437. ( 10.2337/dc12-0825) [DOI] [PMC free article] [PubMed] [Google Scholar]
- 7.Gustafson B, Gogg S, Hedjazifar S, Jenndahl L, Hammarstedt A, Smith U. 2009. Inflammation and impaired adipogenesis in hypertrophic obesity in man. Am. J. Physiol. Endocrinol. Metab. 297, E999-E1003. ( 10.1152/ajpendo.00377.2009) [DOI] [PubMed] [Google Scholar]
- 8.Metcalfe LK, Smith GC, Turner N. 2018. Defining lipid mediators of insulin resistance—controversies and challenges. J. Mol. Endocrinol. 62, R65-R82. ( 10.1530/JME-18-0023) [DOI] [PubMed] [Google Scholar]
- 9.Corcoran MP, Lamon-Fava S, Fielding RA. 2007. Skeletal muscle lipid deposition and insulin resistance: effect of dietary fatty acids and exercise. Am. J. Clin. Nutr. 85, 662-677. ( 10.1093/ajcn/85.3.662) [DOI] [PubMed] [Google Scholar]
- 10.Erion KA, Berdan CA, Burritt NE, Corkey BE, Deeney JT. 2015. Chronic exposure to excess nutrients left-shifts the concentration dependence of glucose-stimulated insulin secretion in pancreatic β-cells. J. Biol. Chem. 290, 16 190-16 201. ( 10.1074/jbc.M114.620351) [DOI] [PMC free article] [PubMed] [Google Scholar]
- 11.Juan CA, de la Lastra JMP, Plou FJ, Perez-Lebena E. 2021. The chemistry of reactive oxygen species (ROS) revisited: outlining their role in biological macromolecules (DNA, lipids and proteins) and induced pathologies. Int. J. Mol. Sci. 22, 4642. ( 10.3390/ijms22094642) [DOI] [PMC free article] [PubMed] [Google Scholar]
- 12.Galgani JE, Moro C, Ravussin E. 2008. Metabolic flexibility and insulin resistance. Am. J. Physiol. Endocrinol. Metab. 295, E1009-E1017. ( 10.1152/ajpendo.90558.2008) [DOI] [PMC free article] [PubMed] [Google Scholar]
- 13.Dobson GP. 2004. Organ arrest, protection and preservation: natural hibernation to cardiac surgery. Comp. Biochem. Physiol. B 139, 469-485. ( 10.1016/j.cbpc.2004.06.002) [DOI] [PubMed] [Google Scholar]
- 14.Jansen HT, et al. 2019. Hibernation induces widespread transcriptional remodeling in metabolic tissues of the grizzly bear. Commun. Biol. 2, 336. ( 10.1038/s42003-019-0574-4) [DOI] [PMC free article] [PubMed] [Google Scholar]
- 15.Corkey BE. 2012. Banting lecture 2011: hyperinsulinemia: cause or consequence? Diabetes 61, 4-13. ( 10.2337/db11-1483) [DOI] [PMC free article] [PubMed] [Google Scholar]
- 16.Corkey BE, Deeney JT. 2020. The redox communication network as a regulator of metabolism. Front. Physiol. 11, 567796. ( 10.3389/fphys.2020.567796) [DOI] [PMC free article] [PubMed] [Google Scholar]
- 17.Corkey BE, Shirihai O. 2012. Metabolic master regulators: sharing information among multiple systems. Trends Endocrinol. Metab. 23, 594-601. ( 10.1016/j.tem.2012.07.006) [DOI] [PMC free article] [PubMed] [Google Scholar]
- 18.Erion K, Corkey BE. 2018. Beta-cell failure or beta-cell abuse? Front. Endocrinol. 9, 532. ( 10.3389/fendo.2018.00532) [DOI] [PMC free article] [PubMed] [Google Scholar]
- 19.Erion KA, Corkey BE. 2017. Hyperinsulinemia: a cause of obesity? Curr. Obes. Rep. 6, 178-186. ( 10.1007/s13679-017-0261-z) [DOI] [PMC free article] [PubMed] [Google Scholar]
- 20.Istfan N, Hasson B, Apovian C, Meshulam T, Yu L, Anderson W, Corkey BE. 2021. Acute carbohydrate overfeeding: a redox model of insulin action and its impact on metabolic dysfunction in humans. Am. J. Physiol. Endocrinol. Metab. 321, E636-E651. ( 10.1152/ajpendo.00094.2021) [DOI] [PMC free article] [PubMed] [Google Scholar]
- 21.Jones AI, Meshulam T, Oliveira MF, Burritt N, Corkey BE. 2016. Extracellular redox regulation of intracellular reactive oxygen generation, mitochondrial function and lipid turnover in cultured human adipocytes. PLoS One 11, e0164011. ( 10.1371/journal.pone.0164011) [DOI] [PMC free article] [PubMed] [Google Scholar]
- 22.Kleckner AS, Wong S, Corkey BE. 2015. The intra- or extracellular redox state was not affected by a high versus low glycemic response diet in mice. PLoS One 10, e0128380. ( 10.1371/journal.pone.0128380) [DOI] [PMC free article] [PubMed] [Google Scholar]
- 23.Nocito L, Kleckner AS, Yoo EJ, Jones IV AR, Liesa M, Corkey BE. 2015. The extracellular redox state modulates mitochondrial function, gluconeogenesis, and glycogen synthesis in murine hepatocytes. PLoS One 10, e0122818. ( 10.1371/journal.pone.0122818) [DOI] [PMC free article] [PubMed] [Google Scholar]
- 24.Boveris A, Chance B. 1973. The mitochondrial generation of hydrogen peroxide: general properties and effect of hyperbaric oxygen. Biochem. J. 134, 707-716. ( 10.1042/bj1340707) [DOI] [PMC free article] [PubMed] [Google Scholar]
- 25.Boveris A, Oshino N, Chance B. 1972. The cellular production of hydrogen peroxide. Biochem. J. 128, 617-630. ( 10.1042/bj1280617) [DOI] [PMC free article] [PubMed] [Google Scholar]
- 26.Chance B. 1965. Control of energy metabolism in moitochondria. In Control of energy metabolism (eds Chance B, Estabrook RW, Williamson JR), pp. 415-435. New York, NY: Academic Press. [Google Scholar]
- 27.Oshino N, Jamieson D, Chance B. 1975. The properties of hydrogen peroxide production under hyperoxic and hypoxic conditions of perfused rat liver. Biochem. J. 146, 53-65. ( 10.1042/bj1460053) [DOI] [PMC free article] [PubMed] [Google Scholar]
- 28.Prusiner S, Williamson JR, Chance B, Paddle BM. 1968. Pyridine nucleotide changes during thermogenesis in brown fat tissue in vivo. Arch. Biochem. Biophys. 123, 368-377. ( 10.1016/0003-9861(68)90147-1) [DOI] [PubMed] [Google Scholar]
- 29.Scholz R, Thurman RG, Williamson JR, Chance B, Bucher T. 1969. Flavin and pyridine nucleotide oxidation-reduction changes in perfused rat liver. I. Anoxia and subcellular localization of fluorescent flavo proteins. J. Biol. Chem. 244, 2317-2324. [PubMed] [Google Scholar]
- 30.Hoek JB, Rydstrom J. 1988. Physiological roles of nicotinamide nucleotide transhydrogenase. Biochem. J. 254, 1-10. ( 10.1042/bj2540001) [DOI] [PMC free article] [PubMed] [Google Scholar]
- 31.Goncalves RL, Quinlan CL, Perevoshchikova IV, Hey-Mogensen M, Brand MD. 2015. Sites of superoxide and hydrogen peroxide production by muscle mitochondria assessed ex vivo under conditions mimicking rest and exercise. J. Biol. Chem. 290, 209-227. ( 10.1074/jbc.M114.619072) [DOI] [PMC free article] [PubMed] [Google Scholar]
- 32.Sies H, Jones DP. 2020. Reactive oxygen species (ROS) as pleiotropic physiological signalling agents. Nat. Rev. Mol. Cell Biol. 21, 363-383. ( 10.1038/s41580-020-0230-3) [DOI] [PubMed] [Google Scholar]
- 33.Smith CD, Schmidt CA, Lin CT, Fisher-Wellman KH, Neufer PD. 2020. Flux through mitochondrial redox circuits linked to nicotinamide nucleotide transhydrogenase generates counterbalance changes in energy expenditure. J. Biol. Chem. 295, 16 207-16 216. ( 10.1074/jbc.RA120.013899) [DOI] [PMC free article] [PubMed] [Google Scholar]
- 34.Murphy MP. 2009. How mitochondria produce reactive oxygen species. Biochem. J. 417, 1-13. ( 10.1042/BJ20081386) [DOI] [PMC free article] [PubMed] [Google Scholar]
- 35.Brand MD, Harper ME, Taylor HC. 1993. Control of the effective P/O ratio of oxidative phosphorylation in liver mitochondria and hepatocytes. Biochem. J. 291, 739-748. ( 10.1042/bj2910739) [DOI] [PMC free article] [PubMed] [Google Scholar]
- 36.Albracht SP, Meijer AJ, Rydstrom J. 2011. Mammalian NADH:ubiquinone oxidoreductase (complex I) and nicotinamide nucleotide transhydrogenase (Nnt) together regulate the mitochondrial production of H2O2—implications for their role in disease, especially cancer. J. Bioenerg. Biomembr. 43, 541-564. ( 10.1007/s10863-011-9381-4) [DOI] [PubMed] [Google Scholar]
- 37.Fergusson G, et al. 2014. Defective insulin secretory response to intravenous glucose in C57Bl/6J compared to C57Bl/6N mice. Mol. Metab. 3, 848-854. ( 10.1016/j.molmet.2014.09.006) [DOI] [PMC free article] [PubMed] [Google Scholar]
- 38.Freeman H, Shimomura K, Cox RD, Ashcroft FM. 2006. Nicotinamide nucleotide transhydrogenase: a link between insulin secretion, glucose metabolism and oxidative stress. Biochem. Soc. Trans. 34, 806-810. ( 10.1042/BST0340806) [DOI] [PubMed] [Google Scholar]
- 39.Leibel RL, Rosenbaum M, Hirsch J. 1995. Changes in energy expenditure resulting from altered body weight. N. Engl. J. Med. 332, 621-628. ( 10.1056/NEJM199503093321001) [DOI] [PubMed] [Google Scholar]
- 40.Rosenbaum M, Leibel RL, Hirsch J. 1997. Obesity. N. Engl. J. Med. 337, 396-407. ( 10.1056/NEJM199708073370606) [DOI] [PubMed] [Google Scholar]
- 41.Sims EA, Danforth E Jr. 1987. Expenditure and storage of energy in man. J. Clin. Invest. 79, 1019-1025. ( 10.1172/JCI112913) [DOI] [PMC free article] [PubMed] [Google Scholar]
- 42.Sims EA, Danforth E Jr, Horton ES, Bray GA, Glennon JA, Salans LB. 1973. Endocrine and metabolic effects of experimental obesity in man. Recent Prog. Horm. Res. 29, 457-496. [DOI] [PubMed] [Google Scholar]
- 43.Wang T. 2010. Respiration in adipocytes is inhibited by reactive oxygen species. Obes. Silver Spring 18, 1493-1502. ( 10.1038/oby.2009.456) [DOI] [PMC free article] [PubMed] [Google Scholar]
- 44.Corkey BE, Deeney JT, Merrins MJ. 2021. What regulates basal insulin secretion and causes hyperinsulinemia? Diabetes 70, 2174-2182. ( 10.2337/dbi21-0009) [DOI] [PMC free article] [PubMed] [Google Scholar]
- 45.Pi J, et al. 2007. Reactive oxygen species as a signal in glucose-stimulated insulin secretion. Diabetes 56, 1783 –1791. ( 10.2337/db06-1601) [DOI] [PubMed] [Google Scholar]
- 46.Saadeh M, Ferrante TC, Kane A, Shirihai O, Corkey BE, Deeney JT. 2012. Reactive oxygen species stimulate insulin secretion in rat pancreatic islets: studies using mono-oleoyl-glycerol. PLoS One 7, e30200. ( 10.1371/journal.pone.0030200) [DOI] [PMC free article] [PubMed] [Google Scholar]
- 47.Lenzen S, Drinkgern J, Tiedge M. 1996. Low antioxidant enzyme gene expression in pancreatic islets compared with various other mouse tissues. Free Radic. Biol. Med. 20, 463-466. ( 10.1016/0891-5849(96)02051-5) [DOI] [PubMed] [Google Scholar]
- 48.Shadel GS, Horvath TL. 2015. Mitochondrial ROS signaling in organismal homeostasis. Cell 163, 560-569. ( 10.1016/j.cell.2015.10.001) [DOI] [PMC free article] [PubMed] [Google Scholar]
- 49.Drougard A, Fournel A, Valet P, Knauf C. 2015. Impact of hypothalamic reactive oxygen species in the regulation of energy metabolism and food intake. Front. Neurosci. 9, 56. ( 10.3389/fnins.2015.00056) [DOI] [PMC free article] [PubMed] [Google Scholar]
- 50.Bak DW, Bechtel TJ, Falco JA, Weerapana E. 2019. Cysteine reactivity across the subcellular universe. Curr. Opin. Chem. Biol. 48, 96-105. ( 10.1016/j.cbpa.2018.11.002) [DOI] [PMC free article] [PubMed] [Google Scholar]
- 51.Fowler NJ, Blanford CF, de Visser SP, Warwicker J. 2017. Features of reactive cysteines discovered through computation: from kinase inhibition to enrichment around protein degrons. Sci. Rep. 7, 16338. ( 10.1038/s41598-017-15997-z) [DOI] [PMC free article] [PubMed] [Google Scholar]
- 52.Go YM, Jones DP. 2013. The redox proteome. J. Biol. Chem. 288, 26 512-26 520. ( 10.1074/jbc.R113.464131) [DOI] [PMC free article] [PubMed] [Google Scholar]
- 53.Krylatov AV, Maslov LN, Voronkov NS, Boshchenko AA, Popov SV, Gomez L, Wang H, Jaggi AS, Downey JM. 2018. Reactive oxygen species as intracellular signaling molecules in the cardiovascular system. Curr. Cardiol. Rev. 14, 290-300. ( 10.2174/1573403X14666180702152436) [DOI] [PMC free article] [PubMed] [Google Scholar]
- 54.Skoko JJ, Attaran S, Neumann CA. 2019. Signals getting crossed in the entanglement of redox and phosphorylation pathways: phosphorylation of peroxiredoxin proteins sparks cell signaling. Antioxidants 8, 29. ( 10.3390/antiox8020029) [DOI] [PMC free article] [PubMed] [Google Scholar]
- 55.Zhang J, Wang X, Vikash V, Ye Q, Wu D, Liu Y, Dong W. 2016. ROS and ROS-mediated cellular signaling. Oxidative Med. Cell. Longev. 2016, 4350965. ( 10.1155/2016/4350965) [DOI] [PMC free article] [PubMed] [Google Scholar]
- 56.Otoupalova E, Smith S, Cheng G, Thannickal VJ. 2020. Oxidative stress in pulmonary fibrosis. Compr. Physiol. 10, 509-547. ( 10.1002/cphy.c190017) [DOI] [PubMed] [Google Scholar]
- 57.Mittal M, Siddiqui MR, Tran K, Reddy SP, Malik AB. 2014. Reactive oxygen species in inflammation and tissue injury. Antioxid. Redox Signal. 20, 1126-1167. ( 10.1089/ars.2012.5149) [DOI] [PMC free article] [PubMed] [Google Scholar]
- 58.Evans EPP, Scholten JTM, Mzyk A, Reyes-San-Martin C, Llumbet AE, Hamoh T, Arts EG, Schirhagl R, Cantineau AE. 2021. Male subfertility and oxidative stress. Redox Biol. 46, 102071. ( 10.1016/j.redox.2021.102071) [DOI] [PMC free article] [PubMed] [Google Scholar]
- 59.Espinoza SE, Guo H, Fedarko N, DeZern A, Fried LP, Xue QL, Leng S, Beamer B, Walston JD. 2008. Glutathione peroxidase enzyme activity in aging. J. Gerontol. A 63, 505-509. ( 10.1093/gerona/63.5.505) [DOI] [PMC free article] [PubMed] [Google Scholar]
- 60.Jones DP. 2015. Redox theory of aging. Redox Biol. 5, 71-79. ( 10.1016/j.redox.2015.03.004) [DOI] [PMC free article] [PubMed] [Google Scholar]
- 61.Singh A, Kukreti R, Saso L, Kukreti S. 2019. Oxidative stress: a key modulator in neurodegenerative diseases. Molecules 24, 1583. ( 10.3390/molecules24081583) [DOI] [PMC free article] [PubMed] [Google Scholar]
- 62.Wang YP, et al. 2014. Regulation of G6PD acetylation by SIRT2 and KAT9 modulates NADPH homeostasis and cell survival during oxidative stress. EMBO J. 33, 1304-1320. ( 10.1002/embj.201387224) [DOI] [PMC free article] [PubMed] [Google Scholar]
- 63.Qiu X, Brown K, Hirschey MD, Verdin E, Chen D. 2010. Calorie restriction reduces oxidative stress by SIRT3-mediated SOD2 activation. Cell Metab. 12, 662-667. ( 10.1016/j.cmet.2010.11.015) [DOI] [PubMed] [Google Scholar]
- 64.Wang Z, et al. 2020. SIRT3-mediated deacetylation of PRDX3 alleviates mitochondrial oxidative damage and apoptosis induced by intestinal ischemia/reperfusion injury. Redox Biol. 28, 101343. ( 10.1016/j.redox.2019.101343) [DOI] [PMC free article] [PubMed] [Google Scholar]
- 65.Collins JA, et al. 2021. Sirtuin 6 (SIRT6) regulates redox homeostasis and signaling events in human articular chondrocytes. Free Radic. Biol. Med. 166, 90-103. ( 10.1016/j.freeradbiomed.2021.01.054) [DOI] [PMC free article] [PubMed] [Google Scholar]
- 66.Odeleye OE, de Courten M, Pettitt DJ, Ravussin E. 1997. Fasting hyperinsulinemia is a predictor of increased body weight gain and obesity in Pima Indian children. Diabetes 46, 1341-1345. ( 10.2337/diab.46.8.1341) [DOI] [PubMed] [Google Scholar]
- 67.Crimarco A, Landry MJ, Gardner CD. 2022. Ultra-processed foods, weight gain, and co-morbidity risk. Curr. Obes. Rep. 11, 80-92. ( 10.1007/s13679-021-00460-y) [DOI] [PMC free article] [PubMed] [Google Scholar]
- 68.Levine JA, Eberhardt NL, Jensen MD. 1999. Role of nonexercise activity thermogenesis in resistance to fat gain in humans. Science 283, 212-214. ( 10.1126/science.283.5399.212) [DOI] [PubMed] [Google Scholar]
- 69.Schlogl M, Piaggi P, Pannacciuli N, Bonfiglio SM, Krakoff J, Thearle MS. 2015. Energy expenditure responses to fasting and overfeeding identify phenotypes associated with weight change. Diabetes 64, 3680-3689. ( 10.2337/db15-0382) [DOI] [PMC free article] [PubMed] [Google Scholar]
- 70.Wiebe N, Muntner P, Tonelli M. 2022. Associations of body mass index, fasting insulin, and inflammation with mortality: a prospective cohort study. Int. J. Obes. 46, 1-7. ( 10.1038/s41366-022-01211-2) [DOI] [PMC free article] [PubMed] [Google Scholar]
- 71.Wiebe N, Stenvinkel P, Tonelli M. 2019. Associations of chronic inflammation, insulin resistance, and severe obesity with mortality, myocardial infarction, cancer, and chronic pulmonary disease. JAMA Netw. Open 2, e1910456. ( 10.1001/jamanetworkopen.2019.10456) [DOI] [PMC free article] [PubMed] [Google Scholar]
- 72.Careau V, et al. 2021. Energy compensation and adiposity in humans. Curr. Biol. 31, 4659-4666. ( 10.1016/j.cub.2021.08.016) [DOI] [PMC free article] [PubMed] [Google Scholar]
- 73.Pontzer H. 2018. Energy constraint as a novel mechanism linking exercise and health. Physiology 33, 384-393. ( 10.1152/physiol.00027.2018) [DOI] [PubMed] [Google Scholar]
- 74.Pontzer H, Wood BM, Raichlen DA. 2018. Hunter-gatherers as models in public health. Obes. Rev. 19, 24-35. ( 10.1111/obr.12785) [DOI] [PubMed] [Google Scholar]
- 75.Lee JH, Duster M, Roberts T, Devinsky O. 2021. United States dietary trends since 1800: lack of association between saturated fatty acid consumption and non-communicable diseases. Front. Nutr. 8, 748847. ( 10.3389/fnut.2021.748847) [DOI] [PMC free article] [PubMed] [Google Scholar]
- 76.Heindel JJ, Blumberg B. 2019. Environmental obesogens: mechanisms and controversies. Annu. Rev. Pharmacol. Toxicol. 59, 89-106. ( 10.1146/annurev-pharmtox-010818-021304) [DOI] [PMC free article] [PubMed] [Google Scholar]
- 77.Egusquiza RJ, Blumberg B. 2020. Environmental obesogens and their impact on susceptibility to obesity: new mechanisms and chemicals. Endocrinology 161, 1-14. ( 10.1210/endocr/bqaa024) [DOI] [PMC free article] [PubMed] [Google Scholar]
- 78.Ren XM, Kuo Y, Blumberg B. 2020. Agrochemicals and obesity. Mol. Cell. Endocrinol. 515, 110926. ( 10.1016/j.mce.2020.110926) [DOI] [PMC free article] [PubMed] [Google Scholar]
- 79.Heindel JJ, et al. 2022. Obesity II: establishing causal links between chemical exposures and obesity. Biochem. Pharmacol. 199, 115015. ( 10.1016/j.bcp.2022.115015) [DOI] [PMC free article] [PubMed] [Google Scholar]
- 80.Marroqui L, Tudurí E, Alonso-Magdalena P, Quesada I, Nadal Á, Dos Santos RS. 2018. Mitochondria as target of endocrine-disrupting chemicals: implications for type 2 diabetes. J. Endocrinol. 239, R27-R45. ( 10.1530/joe-18-0362) [DOI] [PubMed] [Google Scholar]
- 81.Gassman NR. 2017. Induction of oxidative stress by bisphenol A and its pleiotropic effects. Environ. Mol. Mutagen. 58, 60-71. ( 10.1002/em.22072) [DOI] [PMC free article] [PubMed] [Google Scholar]
- 82.Sun Q, et al. 2009. Ambient air pollution exaggerates adipose inflammation and insulin resistance in a mouse model of diet-induced obesity. Circulation 119, 538-546. ( 10.1161/CIRCULATIONAHA.108.799015) [DOI] [PMC free article] [PubMed] [Google Scholar]
- 83.Liu C, et al. 2014. Air pollution-mediated susceptibility to inflammation and insulin resistance: influence of CCR2 pathways in mice. Environ. Health Perspect. 122, 17-26. ( 10.1289/ehp.1306841) [DOI] [PMC free article] [PubMed] [Google Scholar]
- 84.Ray PD, Huang BW, Tsuji Y. 2012. Reactive oxygen species (ROS) homeostasis and redox regulation in cellular signaling. Cell. Signal. 24, 981-990. ( 10.1016/j.cellsig.2012.01.008) [DOI] [PMC free article] [PubMed] [Google Scholar]
- 85.Furukawa S, et al. 2004. Increased oxidative stress in obesity and its impact on metabolic syndrome. J. Clin. Invest. 114, 1752-1761. ( 10.1172/JCI21625) [DOI] [PMC free article] [PubMed] [Google Scholar]
- 86.Sies H, Belousov VV, Chandel NS, Davies MJ, Jones DP, Mann GE, Murphy MP, Yamamoto M, Winterbourn C. 2022. Defining roles of specific reactive oxygen species (ROS) in cell biology and physiology. Nat. Rev. Mol. Cell Biol. 23, 499-515. ( 10.1038/s41580-022-00456-z) [DOI] [PubMed] [Google Scholar]
- 87.Donath MY, Storling J, Berchtold LA, Billestrup N, Mandrup-Poulsen T. 2008. Cytokines and β-cell biology: from concept to clinical translation. Endocr. Rev. 29, 334-350. ( 10.1210/er.2007-0033) [DOI] [PubMed] [Google Scholar]
- 88.Lustig RH, et al. 2022. Obesity I: Overview and molecular and biochemical mechanisms. Biochem. Pharmacol. 199, 115012. ( 10.1016/j.bcp.2022.115012) [DOI] [PMC free article] [PubMed] [Google Scholar]
- 89.Heindel JJ, et al. 2022. Obesity II: Establishing causal links between chemical exposures and obesity. Biochem. Pharmacol. 199, 115015. ( 10.1016/j.bcp.2022.115015) [DOI] [PMC free article] [PubMed] [Google Scholar]
- 90.Kassotis CD, et al. 2022. Obesity III: Obesogen assays: limitations, strengths, and new directions. Biochem. Pharmacol. 199, 115014. ( 10.1016/j.bcp.2022.115014) [DOI] [PMC free article] [PubMed] [Google Scholar]
- 91.Frikke-Schmidt H, Pedersen TA, Fledelius C, Olsen GS, Hellerstein M. 2013. Adipose weight gain during chronic insulin treatment of mice results from changes in lipid storage without affecting de novo synthesis of palmitate. PLoS One 8, e76060. ( 10.1371/journal.pone.0076060) [DOI] [PMC free article] [PubMed] [Google Scholar]
- 92.Thomas DD, Corkey BE, Istfan NW, Apovian CM. 2019. Hyperinsulinemia: an early indicator of metabolic dysfunction. J. Endocr. Soc. 3, 1727-1747. ( 10.1210/js.2019-00065) [DOI] [PMC free article] [PubMed] [Google Scholar]
- 93.Foster GD, et al. 2003. A randomized trial of a low-carbohydrate diet for obesity. N. Engl. J. Med. 348, 2082-2090. ( 10.1056/NEJMoa022207) [DOI] [PubMed] [Google Scholar]
- 94.Samaha FF, et al. 2003. A low-carbohydrate as compared with a low fat diet in severe obesity. N. Engl. J. Med. 348, 2074-2081. ( 10.1056/NEJMoa022637) [DOI] [PubMed] [Google Scholar]
- 95.Sondike SB, et al. 2003. Effects of a low-carbohydrate diet on weight loss and cardiovascular risk factor in overweight adolescents. J. Pediatr. 142, 253-258. ( 10.1067/mpd.2003.4) [DOI] [PubMed] [Google Scholar]
- 96.Brehm BJ, et al. 2003. A randomized trial comparing a very low carbohydrate diet and a calorie-restricted low fat diet on body weight and cardiovascular risk factors in healthy women. J. Clin. Enocrinol. Metab. 88, 1617-1623. ( 10.1210/jc.2002-021480) [DOI] [PubMed] [Google Scholar]
- 97.Aude YW, et al. 2004. The national cholesterol education program diet vs a diet lower in carbohydrates and higher in protein and monounsaturated fat. Arch. Intern. Med. 164, 2141-2146. ( 10.1001/archinte.164.19.2141) [DOI] [PubMed] [Google Scholar]
- 98.Yancy WS Jr, et al. 2004. A low-carbohydrate, ketogenic diet versus a low-fat diet to treat obesity and hyperlipidemia. Ann. Intern. Med. 140, 769-777. ( 10.7326/0003-4819-140-10-200405180-00006) [DOI] [PubMed] [Google Scholar]
- 99.Meckling KA, et al. 2004. Comparison of a low-fat diet to a low-carbohydrate diet on weight loss, body composition, and risk factors for diabetes and cardiovascular disease in free-living, overweight men and women. J. Clin. Endocrinol. Metab. 89, 2717-2723. ( 10.1210/jc.2003-031606) [DOI] [PubMed] [Google Scholar]
- 100.Nickols-Richardson SM, et al. 2005. Perceived hunger is lower and weight loss is greater in overweight premenopausal women consuming a low-carbohydrate/high-protein vs high-carbohydrate/low-fat diet. J. Am. Diet Assoc. 105, 1433-1437. ( 10.1016/j.jada.2005.06.025) [DOI] [PubMed] [Google Scholar]
- 101.Daly ME, et al. 2006. Short-term effects of severe dietary carbohydrate-restriction advice in Type 2 diabetes: a randomized controlled trial. Diabet. Med. 23, 15-20. ( 10.1111/j.1464-5491.2005.01760.x) [DOI] [PubMed] [Google Scholar]
- 102.McClernon FJ, et al. 2007. The effects of a low-carbohydrate ketogenic diet and low-fat diet on mood, hunger, and self-reported symptoms. Obesity 15, 182-187. ( 10.1038/oby.2007.516) [DOI] [PubMed] [Google Scholar]
- 103.Gardner CD, et al. 2007. Comparison of the Atkins, Zone, Ornish, and LEARN diets for change in weight and related risk factors among overweight premenopausal women: the A TO Z weight loss study: a randomized trial. J. Am. Med. Soc. 297, 969-977. ( 10.1001/jama.297.9.969) [DOI] [PubMed] [Google Scholar]
- 104.Halyburton AK, et al. 2007. Low- and high-carbohydrate weight-loss diets have similar effects on mood but not cognitive performance. Am. J. Clin. Nutr. 86, 580-587. ( 10.1093/ajcn/86.3.580) [DOI] [PubMed] [Google Scholar]
- 105.Dyson PA, et al. 2007. A low-carbohydrate diet is more effective in reducing body weight than healthy eating in both diabetic and non-diabetic subjects. Diabet. Med. 24, 1430-1435. ( 10.1111/j.1464-5491.2007.02290.x) [DOI] [PubMed] [Google Scholar]
- 106.Westman EC, et al. 2008. The effect of a low-carbohydrate ketogenic diet vs a low-glycemic index on glycemic control in type 2 diabetes mellitus. Nutr. Metab. 5, 5-36. ( 10.1186/1743-7075-5-36) [DOI] [PMC free article] [PubMed] [Google Scholar]
- 107.Shai I, et al. 2008. Weight loss with a low-carbohydrate, Mediterranean, or low-fat diet. N. Engl. J. Med. 359, 229-241. ( 10.1056/NEJMoa0708681) [DOI] [PubMed] [Google Scholar]
- 108.Keogh JB, et al. 2008. Effects of weight loss from a very-low-carbohydrate diet on endothelial function and markers of cardiovascular risk in subjects with abdominal obesity. Am. J. Clin. Nutr. 87, 567-576. ( 10.1093/ajcn/87.3.567) [DOI] [PubMed] [Google Scholar]
- 109.Tay J, et al. 2008. Metabolic effects of weight loss on very-low-carbohydrate diet compared with an isocaloric high-carbohydrate diet in abdominally obese subjects. J. Am. Coll. Cardiol. 51, 59-67. ( 10.1016/j.jacc.2007.08.050) [DOI] [PubMed] [Google Scholar]
- 110.Volek JS, et al. 2009. Carbohydrate restriction has a more favorable impact on the metabolic syndrome than a low fat diet. Lipids 44, 297-309. ( 10.1007/s11745-008-3274-2) [DOI] [PubMed] [Google Scholar]
- 111.Brinkworth GD, et al. 2009. Long-term effects of a very-low-carbohydrate weight loss diet compared with an isocaloric low-fat diet after 12 mo. Am. J. Clin. Nutr. 90, 23-32. ( 10.3945/ajcn.2008.27326) [DOI] [PubMed] [Google Scholar]
- 112.Hernandez TL, et al. 2010. Lack of suppression of circulating free fatty acids and hypercholesterolemia during weight loss on a high-fat, low-carbohydrate diet. Am. J. Clin. Nutr. 91, 578-585. ( 10.3945/ajcn.2009.27909) [DOI] [PMC free article] [PubMed] [Google Scholar]
- 113.Guldbrand, et al. 2012. In type 2 diabetes, randomization to advice to follow a low-carbohydrate diet transiently improves glycaemic control compared with advice to follow a low-fat diet producing similar weight loss. Diabetologia 55, 2118-2127. ( 10.1007/s00125-012-2567-4) [DOI] [PMC free article] [PubMed] [Google Scholar]
Associated Data
This section collects any data citations, data availability statements, or supplementary materials included in this article.
Data Availability Statement
This article has no additional data.