

Abstract
Background
Appropriate skin treatment and care warrants an accurate prediction of skin moisture. However, current diagnostic tools are costly and time‐consuming. Stratum corneum moisture content has been measured with moisture content meters or from a near‐infrared image.
Objective
Here, we establish an artificial intelligence (AI) alternative for conventional skin moisture content measurements.
Methods
Skin feature factors positively or negatively correlated with the skin moisture content were created and selected by using the PolynomialFeatures(3) of scikit‐learn. Then, an integrated AI model using, as inputs, a visible‐light skin image and the skin feature factors were trained with 914 skin images, the corresponding skin feature factors, and the corresponding skin moisture contents.
Results
A regression‐type AI model using only a visible‐light skin‐containing image was insufficiently implemented. To improve the accuracy of the prediction of skin moisture content, we searched for new features through feature engineering (“creation of new factors”) correlated with the moisture content from various combinations of the existing skin features, and have found that factors created by combining the brown spot count, the pore count, and/or the visually assessed skin roughness give significant correlation coefficients. Then, an integrated AI deep‐learning model using a visible‐light skin image and these factors resulted in significantly improved skin moisture content prediction.
Conclusion
Skin moisture content interacts with the brown spot count, the pore count, and/or the visually assessed skin roughness so that better inference of stratum corneum moisture content can be provided using a common visible‐light skin photo image and skin feature factors.
Keywords: AI model, pore count, skin moisture content, skin roughness, spot count, visible‐light skin image
1. INTRODUCTION
Various skin moisture meters are currently available and include a Corneometer (Courage+Khazaka Electronic) and a moisture checker (Scalar Corp). The type and performance of each moisture meter has been reviewed. 1 , 2
To provide a contact‐less moisture content measurement, the attenuated total reflection‐Fourier transform infrared spectroscopy and the confocal Raman spectrometer have been developed. 3 , 4 , 5 , 6 , 7 However, the infrared spectroscopy and the confocal Ramana spectrometer currently require special equipment.
A major advance in deep learning techniques has opened up many new fields and created a large number of applications. 8 Among them, medical imaging is one of the most actively researched areas. 9 An artificial intelligence (AI) image model has been applied to skin diagnosis and identifies various kinds of skin lesions. 10 Also, there are several commercial AI skin analyzer applications (e.g., “Hadapasha” by Shiseido, “Kirei‐Hada AI” by Kao Corporation). Unfortunately, the skin moisture content measurement remains challenging.
Here, we sought to develop a versatile AI method and technology for predicting the skin moisture content from a visible‐light skin image.
2. METHODS
2.1. Subjects and data
Image data and skin features were obtained, with devices or by human experts, from 205 subjects (group 1) or 264 subjects (group 2) enrolled in cosmetic clinical tests conducted by Saticine Medical. The tests were conducted according to the approval of the Institute Ethics Committee of Saticine Medical, and written consent was obtained from each subject. The subjects are Japanese healthy females, between 20 and 59 years old (inclusive) at the time of consent, and had skin characteristics that fell under the skin type III or IV (according to the Fitzpatrick classification).
2.2. Moisture content measurement
The measurements were taken on the neck. After the skin was adapted to the test environment, the stratum corneum moisture content was measured using a Corneometer CM825 (Courage+Khazaka) according to the manufacturer's instructions. The moisture content ranged from 3.5 to 67.7 (a.u.) and the average was 23.9 (a.u.) in group 1. In group 2, the moisture content ranged from 18.1 to 77.7 (a.u.) and the average was 49.6 (a.u.).
2.3. Measurement or visual assessment of other skin features
The skin features measured with a device or visually assessed by human experts are listed in Table S1.
After the skin was adapted to the test environment, the transepidermal water loss was measured using a Tewameter TM300 (Courage+Khazaka). The sebum level was measured using a Sebumeter SM815 (Courage+Khazaka). A Cutometer CT580 (with a probe opening of 2.0 mm and at a negative pressure of 150 mbar; Courage+Khazaka) was used to measure the skin flexibility and elasticity. A Skin‐pH‐Meter PH905 (Courage+Khazaka) was used for pH measurement, and the resulting value was defined as the pH of the subject. The melanin or hemoglobin level was measured using a Mexameter MX18 (Courage+Khazaka). A corneum checker (D200; Promotool) was used to collect stratum corneum tissue, an image of which was then captured with a microscope (i‐Scope; Moritex). The percentage (%) of deep peeling in the captured image was analyzed by image analysis software. A color‐difference meter CM‐700d (Konica Minolta) was used to measure the hemoglobin index or the hemoglobin oxygen saturation. A color‐difference meter CM‐700d (Konica Minolta, Japan) was also used to measure the skin brightness (L*), the skin redness (a*), and the skin yellowness (b*).
After the skin was adapted to the test environment, a replica of the cheek was made using a hydrophilic vinyl silicone impression material SKIN CAST (Raptor Survey Institute), and one or more images of the prepared replica were captured. Then, image analysis software was used to analyze the average area, the total count, the angle standard deviation, the circularity, the brightness difference among skin pores, and other features in the captured replica image.
After the skin was adapted to the test environment, a face image analyzer (VISIA; Canfield Scientific) was used to analyze various skin features in the face according to the manufacturer's instructions.
After the skin was adapted to the test environment, the surface temperature of each subject's face was measured with a non‐contact radiation thermometer (CISE; Muranaka Medical).
After the skin was adapted to the test environment, various skin features of each subject's face were subjected to three‐ or five‐grade visual assessment by skilled evaluation panelists who had been trained by Saticine Medical.
2.4. Regression‐type AI image model construction and training environment
Whole face images from the above subjects (group 1) were resized to 600 × 600 pixels, and split into 138 training data, 16 validation data, and 18 test data. The base image model used was EfficientNetB7 and the weights used were “imagenet”. The whole layers were trainable. Each data included the face image data and the corresponding moisture content and was input to the base model. The image was normalized by dividing each pixel value by 255. The moisture content was normalized by dividing the value by the maximum. The output of the base model was input to a Dense(1024) layer with a ReLU activation function, and finally to a Dense(1) layer to predict the moisture content.
2.5. How to create skin feature factors and calculate a correlation coefficient
In group 1, all the skin features listed above were converted to a pandas DataFame (df) and normalized by first determining the maximum (max()) and the minimum (min()), followed by calculating (df_input—df_input.min()) / (df_input.max()—df_input.min()). In group 2, skin features corresponding to those of group 1 were selected and processed in the same manner as in group 1. Next, the PolynomialFeatures(3) (i.e., the degree of PolynomialFeatures was 3) of scikit‐learn (https://scikit‐learn.org/stable/modules/generated/sklearn.preprocessing.PolynomialFeatures.html) was used to create new skin feature factors by combining any three skin features including identical skin features. The number of new skin feature factors created in group 1was (54 (the number of skin features) −1 (stratum corneum moisture content))3 = 148,877.
How all the skin features or the new skin feature factors as so created were correlated with the stratum corneum moisture content was analyzed by the corr() function of pandas. The results were sorted descendingly or ascendingly to identify skin feature factors positively or negatively correlated with the stratum corneum moisture content.
2.6. How to construct an integrated deep‐learning model
An integrated deep‐learning (DL) model was constructed by using an AI image model output and three factors as inputs. The AI image model used was EfficientNetB7 as described above. The three factors used were any combination of the above‐identified skin feature factors or 0. The image model output and the three factors were concatenated and used as inputs for the integrated DL model.
The combined inputs were input to a Dense(12) layer with a ReLU activation function, a Dense(24) layer with a ReLU activation function, and a Dense(1) layer to predict the moisture content.
2.7. How to train the integrated DL model and the model evaluation
Skin images from the above face images were resized to 600 × 600 pixels, and split into 914 training data, 229 validation data, and 127 test data in group 1 or 1007 training data, 252 validation data, and 140 test data in group 2. Each data included the skin image data, the corresponding skin feature factors, and the corresponding moisture content, and was input to the integrated DL model. The image was normalized by dividing each pixel value by 255. Each factor was normalized by dividing the value by the maximum. The moisture content was normalized by dividing the value by the maximum. In the case of group 2, the moisture content, the brown spot count, and the pore count were normalized using the MinMaxScaler function of scikit‐learn.
To evaluate the integrated DL model, the evaluate() function of Keras was used with all 127 test data for group 1 or all the 140 test data for group 2. Thus, the calculated evaluation losses presented were derived from the 127 test data for group 1 or the 140 test data for group 2.
3. RESULTS
3.1. Training of regression‐type skin moisture content prediction AI model using visible‐light skin images
To allow for versatile and easy‐to‐use moisture content prediction applications, we investigated the use of visible‐light skin images, instead of near‐infrared skin images, for training a stratum corneum moisture content prediction AI model.
First, visible‐light whole‐face images from 172 persons were resized to 600 × 600 pixels, and used as training data. Each corresponding stratum corneum moisture content was used as a corresponding label. The moisture content measured ranged from 0 to 53.3 (a.u.). EfficientNetB7 was used as a base model, and the weights used for training the model were “imagenet”.
Figure 1 shows the training results. The loss for training data decreased as the epoch increased while the loss for validation data remained substantially the same after epoch 10.
FIGURE 1.

Training of a regression‐type skin moisture content prediction artificial intelligence (AI) model using just a visible‐light face image as an input. The ordinate represents a loss for training or validation data. The abscissa represents an epoch during the training. Here, 138 training data and 16 validation data were used for training and 18 test data were used for evaluation of the trained model.
When test data was used for the prediction, the difference between the actual moisture content and the predicted moisture content was 10.7 (a.u.) on average of 16 test data.
3.2. Skin features correlated with stratum corneum moisture content
We then sought to find a way to reduce the difference between the predicted moisture content and the actual moisture content. First, we checked the correlation between the stratum corneum moisture content in group 1 as measured by a moisture meter and other skin features as measured by devices (e.g., VISIA, replicas) or human experts skilled in skin evaluation.
The skin features used included 54 skin features (Table S1).
Table 1 shows a list of skin features positively or negatively correlated with the measured moisture content (Table 1A,B for group 1 and Table 1C,D for group 2). From the highest score for group 1, the pore count measured by VISIA, the brown spot count measured by VISIA, the porphyrin count measured by VISIA, the rough skin mesh count measured by VISIA, the UV spot count measured by VISIA, the porphyrin area measured by VISIA, or the spot count measured by VISIA had a correlation coefficient of 0.30, 0.30, 0.24, 0.24, 0.23. 0.17, or 0.17, respectively (Table 1A). In addition, the negatively correlated skin features are listed ascendingly. The rough skin was visually assessed by the experts, the wrinkle count measured using replicas, or the coarse skin mesh visually assessed by the experts had a correlation coefficient of −0.35, −0.20, or −0.18, respectively (Table 1B).
TABLE 1.
List of skin features positively or negatively correlated with the stratum corneum moisture content.
| A | |
|---|---|
| Positively correlated feature | Correlation coefficient |
| Corneum stratum moisture content (a.u.) | 1.00 |
| Pore count_VISIA | 0.30 |
| Brown spot count_VISIA | 0.30 |
| Porphyrin count_VISIA | 0.24 |
| Rough skin mesh count_VISIA | 0.24 |
| UV spot count_VISIA | 0.23 |
| Porphyrin area_VISIA | 0.17 |
| Spot count_VISIA | 0.17 |
| B | |
|---|---|
| Negatively correlated feature | Correlation coefficient |
| Rough skin_visually assessed | −0.35 |
| Wrinkle count_replica | −0.20 |
| Coarse skin mesh_visually assessed | −0.18 |
| C | |
|---|---|
| Positively correlated feature | Correlation coefficient |
| Corneum stratum moisture content (a.u.) | 1.00 |
| Brown spot count_VISIA | 0.26 |
| pH | 0.23 |
| Pore count_VISIA | 0.23 |
| Sebum level (a.u,) | 0.21 |
| D | |
|---|---|
| Negatively correlated feature | Correlation coefficient |
| Pore angle SD | −0.24 |
| Rough skin_visually assessed | −0.19 |
| Acness_visually assessed | −0.19 |
For group 2, a similar analysis was performed to give positively correlated features (Table 1C) and negatively correlated features (Table 1D). Among the positively correlated features, the brown spot count and the pore count were shared between group 1 and group 2. This indicates the significance of these skin features across the groups. Also, among the negatively correlated features, the visually assessed rough skin was shared between group 1 and group 2 although the correlation coefficient (−0.19) in group 2 was lower than that (−0.35) of group 1.
3.3. Positively or negatively correlated factors created by combining skin features with PolynomialFeatures(3)
To improve the correlation between the moisture content and some skin feature, we created positively or negatively correlated factors by combining the above skin features using the PolynomialFeatures function of scikit‐learn.
Three randomly selected skin features in group 1 were programmatically multiplied to construct each new skin feature factor (this processing is herein referred to as PolynomialFeatures(3)). The correlation between the moisture content and each new skin feature factor was then calculated. Table 2A,B shows the positively or negatively correlated factors.
TABLE 2.
Top‐ranked skin feature factors positively (Table 2A) or negatively (Table 2B) correlated with the stratum corneum moisture content in group 1. Table 2C shows the case of positively correlated skin feature factors in group 2. The skin feature factors were created by combining the skin features listed in Table S1 by the PolynomialFeatures(3) of scikit‐learn.
| A | |
|---|---|
| Positively correlated combined factor | Correlation coefficient |
| Brown spot count_VISIA * Pore count_VISIA^2 | 0.45 |
| UV spot count_VISIA * Pore count_VISIA^2 | 0.45 |
| UV pore count_VISIA * Brown spot count_VISIA * Pore count_VISIA | 0.44 |
| Brown spot count_VISIA^2 * Pore count_VISIA | 0.44 |
| UV spot count_VISIA^2 * Pore count_VISIA | 0.43 |
| Pore count_VISIA^3 | 0.43 |
| B | |
|---|---|
| Negative correlated combined factor | Correlation coefficient |
| Pore circularity (a.u.)_replica * Rough skin_visually assessed | −0.36 |
| a*(a.u.) * Pore circularity (a.u.)_replica * Rough skin_visually assessed | −0.35 |
| Rough skin_visually assessed | −0.34 |
| Pore circularity (a.u.)_replica * Dark pore_visually assessed * Rough skin_visually assessed | −0.34 |
| Pore angle SD(°)_replica * Rough skin_visually assessed | −0.34 |
| Hemoglobin index (a.u.)_color difference * Pore circularity (a.u.)_replica * Rough skin_visually assessed | −0.34 |
| C | |
|---|---|
| Positively correlated combined factor | Correlation coefficient |
| Brown spot count_VISIA | 0.31 |
| Brown spot count_VISIA^2 | 0.28 |
| Brown spot count_VISIA * Pore count_VISIA | 0.28 |
| Pore count_VISIA | 0.27 |
| Brown spot count_VISIA^3 | 0.25 |
| Brown spot count_VISIA^2 * Pore count_VISIA | 0.25 |
The highly positively correlated factors included the factor (brown spot count measured by VISIA) × (pore count measured by VISIA)2 (herein referred to as f1 (positive factor)); the factor (brown spot count measured by VISIA)2 × (pore count measured by VISIA) (herein referred to as f2 (positive factor)); and the factor (pore count measured by VISIA)3 (herein referred to as f3 (positive factor)), the correlation coefficient of which were 0.45, 0.44, and 0.43, respectively.
The highly negatively correlated factors included the factor “rough skin” visually assessed by experts, the correlation coefficient of which was −0.34. This “rough skin” factor appeared in the top 6 negatively correlated skin feature factors created. Thus, “ rough skin” was used as a factor f3 (negative factor) in the following model.
The brown spot count and pore count were likewise programmatically multiplied to create new skin feature factors in group 2 (Table 2C). The top‐ranked factor was the brown spot count itself (correlation coefficient: 0.31). Any combination of the brown spot count and/or the pore count did not result in an increase in the correlation coefficient in group 2. This differed from the case of group 1 while the two skin features were among the highest.
3.4. Integrated AI skin moisture prediction model using a visible‐light skin image and positively or negatively correlated factors
Subsequently, we revised the above regression‐type skin moisture prediction model by combining a visible‐light skin image and the above factors as inputs to construct an integrated skin moisture content AI DL model. Figure 2 schematically illustrates the structure of the integrated skin moisture content AI DL model. A skin image was first input and processed by a regression‐type AI image model (EfficientNetB7) to give an output value. This output value and three other factors 1, 2, and 3 were then used as inputs for another AI DL model (see the DL model in the Method section). Here, the factors were any of the above f1, f2, and/or f3 (positive factor or negative factor) and/or 0. After processing these inputs in the AI DL model, the moisture content of the skin image was predicted.
FIGURE 2.

The structure of an integrated artificial intelligence (AI) deep‐learning (DL) model having a visible‐light skin image and skin feature factors as inputs.
3.5. How positively or negatively correlated factors affected loss evaluation in the integrated model
Various combinations of factors were assigned to the inputs for the integrated AI model. Figure 3A is a graph indicating the effects of the factors on decreasing the evaluation loss in the integrated AI DL model in the case of group 1. “No factors” means that all the factors were 0 (0, 0, 0). Other factors were provided as “Negative control”: (irrelevant subject ID number, 0, 0); “1 positive factor”: (f1, 0, 0); “1 negative factor”: (0, 0, f3 (negative factor)); “2 positive factors”: (f1, f2, 0); “2 positive and 1 negative factors”: (f1, f2, f3 (negative factor); and “3 positive factors”: (f1, f2, f3 (positive factor)). The details of each factor described above are provided in Figure 3B.
FIGURE 3.

How the evaluation loss during training was affected by a combination of skin feature factors. Figure 3A shows the degree of reduction in the evaluation loss in the case of group 1 by each combination of skin feature factors shown in Figure 3B. The “No factors” indicates that no factors were used and (0, 0, 0) as input. The “Negative control” was the subject's ID number. The “1 positive factor”, “1 negative factor”, “2 positive factors”, “2 positive 1 negative factors”, and “3 positive factors” were provided with (f1, 0, 0), (0, 0, (negative) f3), (f1, f2, 0), (f1, f2, (negative) f3), and (f1, f2, (positive) f3), respectively. Figure 3C shows the evaluation loss in an integrated model using No factors or the 3 positive factors in combination with skin image data in group 2.
Next, each skin moisture‐integrated AI DL model was trained with 914 training data (skin image and corresponding factor inputs) and 229 validation data for 20 epochs or more until the loss became constant. Then, the evaluation loss in Keras was calculated using 124 test data. Each evaluation loss was shown in Figure 3 as follows: “No factors”: 0.049; “Negative control”: 0.047; “1 positive factor”: 0.043; “1 negative factor”: 0.041; “2 positive factors”: 0.038; “2 positive and 1 negative factors”: 0.036; and “3 positive factors”: 0.34. The percentage of reduction in the evaluation loss with respect to the “No factors” was: “Negative control”: 3.7%; “1 positive factor”: 11.9%; “1 negative factor”: 16.6%; “2 positive factors”: 22.4%; “2 positive and 1 negative factors”: 25.5%; and “3 positive factors”: 29.8%.
To verify the effect of the above factors, an integrated AI model was trained using 1007 training data and 252 validation data derived from group 2. Figure 3C shows that in group 2, the evaluation loss was decreased from 0.031 (“No factors”) to 0.028 (3 positive factors). The decrease (9.7%) was smaller than in the case of group 1 although the starting point (0.031) was also smaller than that (0.049) in the case of group 1.
3.6. Training of the integrated AI DL model using three positively correlated factors
Figure 4A is a graph showing the actual training process of the integrated AI DL model using the three positive factors in group 1. The model was trained using 914 training data and 229 validation data for 20 epochs. The training loss decreased and increased as the training proceeded, and then reached a plateau. The validation loss increased and decreased as the training proceeded, and then reached a plateau.
FIGURE 4.

Training of an integrated artificial intelligence (AI) deep‐learning (DL) model using a visible‐light skin image and three positive skin feature factors as inputs. The ordinate represents a loss for training or validation data. The abscissa represents an epoch during the training. In the case of group 1 (Figure 4A), 914 training data and 229 validation data were used for training, and 127 test data were used for the evaluation of the trained model. In the case of group 2 (Figure 4B), 1007 training data and 252 validation data were used for training and 140 test data was used for evaluation of the trained model.
Figure 4B is a graph showing the actual training process of the integrated AI DL model using the three positive factors in group 2. Similar dynamics were observed between the case of group 1 and the case of group 2.
3.7. Prediction of stratum corneum moisture content by the integrated AI DL model
The above integrated AI DL model using the three positive factors in group 1 was utilized to predict the stratum corneum moisture contents of several skin images including images from subjects with the skin having a high, medium, or low skin moisture content.
Figure 5A is a skin image from a subject with a medium moisture content (23.3 (a.u.)). The “True” indicates the measured skin moisture content, and the “Pred” indicates the skin moisture content predicted by the integrated AI DL model. The predicted moisture content was 23.7 (a.u.). Figure 5B is a skin image with a high moisture content (45.5 (a.u.)). The predicted moisture content was 44.3 (a.u.). Figure 5C is a skin image with a low moisture content (10.5 (a.u.)). The predicted moisture content was 22.5 (a.u.).
FIGURE 5.
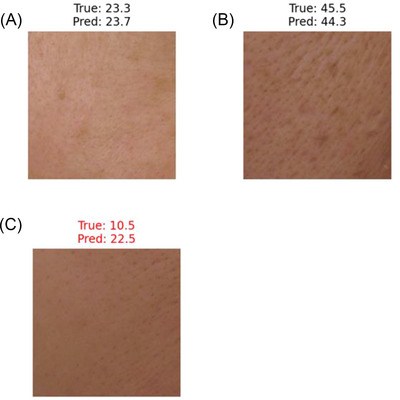
Differences between the actual moisture content and the predicted moisture content. Figure 5A is a test data skin image with moderate moisture content. The “True” indicates an actual measured moisture content. The “Pred” indicate a moisture content predicted by the integrated artificial intelligence (AI) deep‐learning (DL) model using a visible‐light skin image and the three positively correlated skin feature factors. Figure 5B is a test data skin image with high moisture content. Figure 5C is a test data skin image with low moisture content.
In this AI DL integrated model, when test data was used for the prediction, the difference between the actual moisture content and the predicted moisture content was 4.7 (a.u.) on average of 16 test data.
4. DISCUSSION
In this study, we have provided an AI solution to the prediction of skin moisture content from a visible‐light skin image. By using, as inputs, a visible‐light skin image and skin feature factors, an integrated AI DL model was trained to predict the skin moisture content better than an AI image model using a visible‐light face image input.
In the integrated AI DL model using a visible light skin image and “No factors” in group 1, when test data was used for the prediction, the difference between the actual moisture content and the predicted moisture content was 8.4 (a.u.) on average of 16 test data while the simple whole face image AI model gave 10.7 (a.u.) in average of 16 test data. This indicates that the training with skin image data reduced the difference when compared to the training with face image data. This suggests that the use of skin image data gives a better prediction of the skin moisture content than the use of face image data. The skin image, as the denomination suggests, is limited to skin only. By contrast, the face image contains components other than the skin, such as hair, eyes, the background, and so on. Images containing only skin could provide the integrated AI DL model with more precise information.
Then, the integrated AI DL model was provided with skin feature factors positively or negatively correlated with the stratum corneum moisture content. The results have revealed that in the case of group 1, as the number of skin feature factors increased, the evaluation loss of the model decreased in an additive manner (see Figure 3A). The effect of the number of positively or negatively correlated skin feature factors on the evaluation loss seems to be additive. This may indicate that there is no synergistic effect among the skin feature factors so far identified. When the integrated AI DL model with a skin image and three positively correlated skin feature factors were trained, the evaluation loss decreased by about 30% from that of the integrated AI DL model without any skin feature factor input. This has demonstrated that the use of a visible‐light skin image and skin feature factors as inputs makes it possible to significantly increase the accuracy of prediction of the skin moisture content from the visible‐light skin image.
In the case of group 2, the same skin feature factors produced some but weaker effects. This indicates that the skin feature factors should be fine‐tuned depending on a subject group of interest.
4.1. Negatively correlated factors
Among the skin feature factors created by using the PolynomialFeatures(3) (see Table 2), the skin feature factors negatively correlated with the skin moisture content in a visible‐light skin image involve visually assessed skin roughness.
Previous reports 11 have revealed that when some substance was administered, the skin moisture content increased while the skin roughness decreased, suggesting the inverse correlation between the skin moisture content and the skin roughness. This may agree with our findings. The correlation coefficient between the skin moisture content and the visually assessed skin roughness was −0.35. The lowest correlation efficiency of the skin feature factor (Pore circularity (a.u.)_replica × Rough skin_visually assessed) was −0.36 and the two are substantially the same. Besides, the visually assessed skin roughness is included in the top six negatively correlated skin feature factors listed in Table 2B. Also, the visually assessed skin roughness also appeared in the case of group 2. Therefore, the visually assessed skin roughness should be a significant feature negatively correlated with the skin moisture content.
4.2. Positively correlated factors
The skin feature factors positively correlated with the skin moisture content in a visible‐light skin image involve a skin pore count and a brown spot count.
The correlation coefficient between the skin moisture content and the skin pore count measured by VISIA was 0.30 in group 1. The correlation coefficient between the skin moisture content and the brown spot count measured by VISIA was also 0.30 in group 1. By contrast, the new skin feature factors created by combining the skin pore count and/or the brown spot count, including f1, f2, and f3 (positive factors) (see Figure 3B), gave correlation coefficients of 0.45, 0.44, and 0.43, respectively, which were significantly increased when compared to the direct correlation coefficient. So far, the fact that these positive skin feature factors f1, f2, and f3 are highly correlated with the skin moisture content has been unknown. On top of that, these skin feature factors can reduce the evaluation loss of the integrated AI DL model in an additive fashion, demonstrating that they can provide an interaction with the skin moisture content during the prediction from a visible‐light skin image. Therefore, the use of these newly identified skin feature factors makes it possible to improve the accuracy of the prediction of skin moisture content from a visible‐light skin photo image.
However, in group 2, although the pore count and the brown spot count were among the highest in terms of the correlation coefficient, any combination of the two factors did not give an increase in the correlation coefficient. This fact may indicate that the skin feature factors are involved with the two features, but fine‐tuning of the skin feature factors should be implemented case by case.
4.3. Limitation of prediction and a possible alternative solution
The integrated AI DL model gives good prediction of skin moisture content in a medium range (e.g. 15–35 (a.u.)), but inferior prediction in a high range (e.g., more than 35 (a.u.)) and poor prediction in a low range (e.g., less than 15 (a.u.)) in group 1 (see Figure 5).
Why the prediction in the low range was poor is unclear. Since the number of training data was 914 images (see Figure 4A), an increase in the number of training data might solve the problem. However, there may be an intrinsic technical difficulty in predicting the skin moisture content in the low range from a visible‐light skin image. The use of a near infrared‐light image in combination may be of help. 7
As a possible alternative solution, we examined the use of a classification‐type skin moisture content prediction AI model, and have found that the classification‐type model can be better trained with visible‐light skin image data (data not shown). Thus, the type of moisture content prediction AI model as well as the type of skin image might affect the prediction accuracy and the training feasibility.
5. CONCLUSION
A visible‐light skin image and skin feature factors can be used as inputs to provide a stratum corneum moisture content prediction integrated AI DL model with improved precision. This integrated model could provide a solution to more accurate prediction of skin moisture content from an easy‐to‐obtain visible‐light photo image, and can thus be useful for versatile skin moisture content prediction applications.
CONFLICT OF INTEREST STATEMENT
Tomoyuki Shishido and Ichiro Iwai are inventors of a patent application for the invention of this AI skin moisture content prediction method.
Supporting information
Supporting Information
ACKNOWLEDGMENTS
We thank Dr. Gunnar P. H. Dietz for critically reading the manuscript. This work was supported by JST, the establishment of university fellowships towards the creation of science and technology innovation, and Grant Number JPMJFS2112.
Shishido T, Ono Y, Kumazawa I, Iwai I, Suziki K. Artificial intelligence model substantially improves stratum corneum moisture content prediction from visible‐light skin images and skin feature factors. Skin Res Technol. 2023;29:e13414. 10.1111/srt.13414
Contributor Information
Ichiro Iwai, Email: I-iwai@saticine-md.co.jp.
Kenji Suziki, Email: suzuki.k.di@m.titech.ac.jp.
DATA AVAILABILITY STATEMENT
Subject data is from subjects of cosmetics clinical studies, which have been approved by the Institute committee. The data should not be disclosed without the written consent of each subject.
REFERENCES
- 1. Fluhr JW, Gloor M, Lazzerini S, Kleesz P, Grieshaber R, Berardesca E. Comparative study of five instruments measuring stratum corneum hydration (Corneometer CM 820 and CM 825, Skicon 200, Nova DPM 9003, DermaLab). Part II. In vivo. Skin Res Technol. 1999;5(3):171‐178. [Google Scholar]
- 2. Clarys P, Clijsen R, Taeymans J, Barel AO. Hydration measurements of the stratum corneum: comparison between the capacitance method (digital version of the Corneometer CM 825(R)) and the impedance method (Skicon‐200EX(R)). Skin Res Technol. 2012;18(3):316‐323. [DOI] [PubMed] [Google Scholar]
- 3. Potts RO, Guzek DB, Harris RR, McKie JE. A noninvasive, in vivo technique to quantitatively measure water concentration of the stratum corneum using attenuated total‐reflectance infrared spectroscopy. Arch Dermatol Res. 1985;277(6):489‐495. [DOI] [PubMed] [Google Scholar]
- 4. Brancaleon L, Bamberg MP, Sakamaki T, Kollias N. Attenuated total reflection‐Fourier transform infrared spectroscopy as a possible method to investigate biophysical parameters of stratum corneum in vivo. J Invest Dermatol. 2001;116(3):380‐386. [DOI] [PubMed] [Google Scholar]
- 5. Boncheva M, de Sterke J, Caspers PJ, Puppels GJ. Depth profiling of Stratum corneum hydration in vivo: a comparison between conductance and confocal Raman spectroscopic measurements. Exp Dermatol. 2009;18(10):870‐876. [DOI] [PubMed] [Google Scholar]
- 6. Caspers PJ, Lucassen GW, Bruining HA, Puppels GJ. Automated depth‐scanning confocal Raman microspectrometer for rapid in vivo determination of water concentration profiles in human skin. J Raman Spectrosc. 2000;31(8‐9):813‐818. [Google Scholar]
- 7. Egawa M, Yanai M, Maruyama N, Fukaya Y, Hirao T. Visualization of water distribution in the facial epidermal layers of skin using high‐sensitivity near‐infrared (NIR) imaging. Appl Spectrosc. 2015;69(4):481‐487. [DOI] [PubMed] [Google Scholar]
- 8. Dargan S, Kumar M, Ayyagari M, Kumar G. A survey of deep learning and its applications: a new paradigm to machine learning. Arch Comput Methods Eng. 2020;27:1071‐1092. [Google Scholar]
- 9. Barragan‐Montero A, Javaid U, Valdes G, et al. Artificial intelligence and machine learning for medical imaging: A technology review. Phys Med. 2021;83:242‐256. [DOI] [PMC free article] [PubMed] [Google Scholar]
- 10. Gessert N, Nielsen M, Shaikh M, Werner R, Schlaefer A. Skin lesion classification using ensembles of multi‐resolution EfficientNets with meta data. MethodsX. 2020;7:100864. [DOI] [PMC free article] [PubMed] [Google Scholar]
- 11. Jung K, Kim SH, Joo KM, et al. Oral intake of enzymatically decomposed AP collagen peptides improves skin moisture and ceramide and natural moisturizing factor contents in the stratum corneum. Nutrients. 2021;13(12):4372. [DOI] [PMC free article] [PubMed] [Google Scholar]
Associated Data
This section collects any data citations, data availability statements, or supplementary materials included in this article.
Supplementary Materials
Supporting Information
Data Availability Statement
Subject data is from subjects of cosmetics clinical studies, which have been approved by the Institute committee. The data should not be disclosed without the written consent of each subject.