

Summary
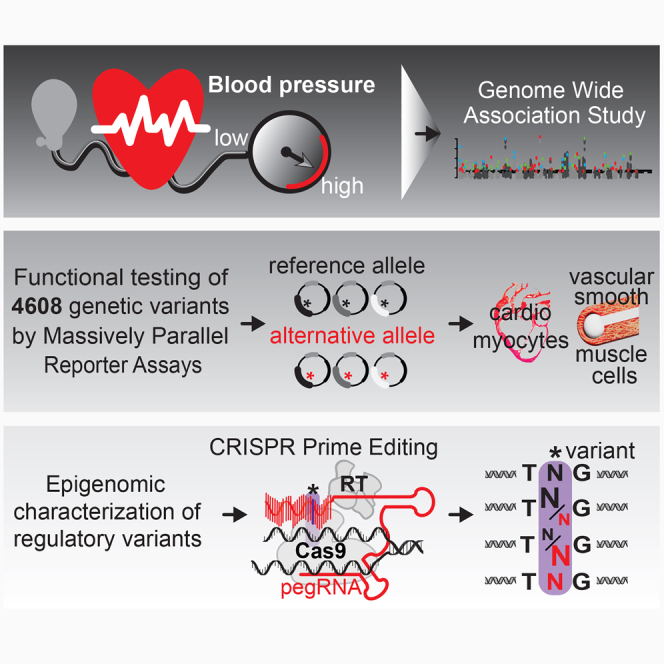
High blood pressure (BP) is the major risk factor for cardiovascular disease. Genome-wide association studies have identified genetic variants for BP, but functional insights into causality and related molecular mechanisms lag behind. We functionally characterize 4,608 genetic variants in linkage with 135 BP loci in vascular smooth muscle cells and cardiomyocytes by massively parallel reporter assays. High densities of regulatory variants at BP loci (i.e., ULK4, MAP4, CFDP1, PDE5A) indicate that multiple variants drive genetic association. Regulatory variants are enriched in repeats, alter cardiovascular-related transcription factor motifs, and spatially converge with genes controlling specific cardiovascular pathways. Using heuristic scoring, we define likely causal variants, and CRISPR prime editing finally determines causal variants for KCNK9, SFXN2, and PCGF6, which are candidates for developing high BP. Our systems-level approach provides a catalog of functionally relevant variants and their genomic architecture in two trait-relevant cell lines for a better understanding of BP gene regulation.
Keywords: massively parallel reporter assay, MPRA, genetic variant, regulatory variant, chromosome conformation capturing Hi-C Omni-C, CRISPR prime editing, blood pressure gene regulation, genomic architecture, hypertension, genomic marker, molecular precision medicine
Graphical abstract
Highlights
-
•
Functional testing of 4,608 genetic variants associated with blood pressure
-
•
High densities of regulatory variants spatially converge to influence target genes
-
•
Heuristic scoring using epigenomic properties defines likely causal variants
-
•
CRISPR prime editing determines gene-regulatory effects of causal variants
Functional testing of 4,608 genetic variants associated with blood pressure revealed high densities of regulatory variants at candidate genes. Epigenomic properties defined likely causal variants, which were ultimately tested for their gene-regulatory effects by CRISPR prime editing.
Introduction
Blood pressure (BP) is a complex multifactorial polygenic trait controlled by genetic and environmental factors and physiologic processes (cardiac, vascular, renal, neural, and endocrine mechanisms). High BP (hypertension) is the leading cause of cardiovascular disease (CVD), currently affecting an estimated 1.25 billion people and contributing to mortality from non-communicable disease worldwide. The prevalence and absolute burden of hypertension and CVD are expected to continue to increase.1 Genome-wide association studies (GWASs) have identified genetic variants for BP2,3,4,5,6,7,8,9,10,11,12,13,14 that explain one-third of the estimated 30%–50% heritability of BP.3,15 However, most of these genetic variants map to the non-coding genome.16,17 Identifying mechanisms underlying non-coding genetic association is challenging, because incompletely annotated regulatory elements are coupled with highly diverse non-coding functions.18 Specifically, genetic variants map to cis-regulatory elements (CREs), such as open chromatin, enhancers, promoters, and RNA genes,16,19 and modulate transcriptional programs by altering transcription factor binding sites (TFBSs).5,16
GWASs lack functional relevance, because determining causal variants that manifest phenotypes is difficult.20 Indeed, most GWAS variants are often not causal themselves, but rather are associated with causal variants in linkage disequilibrium (LD).21,22 Yet, prediction tools for variant pathogenicity have limited accuracy, especially for non-coding loci.23 Recently, there has been an increasing number of studies wherein researchers integrate fine-mapping approaches with functional follow-up experiments.24,25,26 However, fine-mapping, such as colocalization, has limitations, because it works under the assumption of only a single causal variant,27 which does not reflect the genetic architecture of complex traits.28,29 Thus, experimental studies assaying all variants in LD with GWAS variants to define putative causal variants are paramount.30 Such systems-level approaches will unravel genetic variants regulating BP genes and their genomic architecture to advance hypertension genomics and molecular precision medicine.15 Massively parallel reporter assays (MPRAs) can accomplish this aim because they efficiently assess regulatory activities of thousands of genomic loci by coupling candidate regions to a reporter gene and linking them to unique molecular identifiers (barcodes).21,31,32 So far, MPRAs have successfully identified likely causal variants for specific quantitative traits,28,29,31,33 such as coronary artery disease (CAD)34 and red blood cell traits.33
We systematically test 4,608 genetic variants and identified hundreds of regulatory variants in two BP-related cell types that generate the contractile tonus: vascular smooth muscle cells (VSMCs) and cardiomyocytes (CMs). We find that some loci show high density of hundreds of regulatory variants at distinct known and novel BP candidate genes. Most regulatory variants are in LD to GWAS variants, are enriched in SINE/Alu elements, disrupt TFBSs of transcription factors (TFs) required for BP regulation, and are in spatial genomic proximity to cardiovascular genes. Developing heuristic scoring with functional epigenomics defines a set of the most likely causal variants per locus. Using CRISPR prime editing, we finally link causal regulatory variants to target genes. Our findings illuminate the functional genomic architecture of BP genes, and our resource of BP variants will facilitate the study of responses to hypertension in cardiac and vascular tissue to accelerate approaches employing genomic markers for BP and hypertension.15
Results
MPRA identifies regulatory variants at BP loci
We selected 135 previously reported GWAS variants4,5,7,11,35 associated with BP and hypertension and 4,473 variants in high LD (Figure 1A; Table S1; STAR Methods).36 These variants were mostly located in introns, promoters, and UTRs (Pearson’s chi-square test, FDR < 0.05, Figure 1B).37 To determine regulatory effects, we cloned variants with their genomic context (±67 bp, each allele represented by 25 barcodes), together with 335 random sequences (5 barcodes each) and six known regulatory variants identified previously (100 barcodes each)5,21 in ∼233,000 uniquely barcoded plasmids (Figure 1C; STAR Methods).
Figure 1.

Functional characterization of genetic variants associated with blood pressure
(A) Genomic location of GWAS sentinel variants (colored, p < 5 × 10⁻⁸) and variants in high LD (gray, ±500 kb, r2 > 0.8) for each of the blood pressure traits.
(B) Enrichment of GWAS variants at DNA and RNA regulatory elements using ChIPseeker.37 Bars above odds ratio >1 (dotted line) denote enrichment, with black bars indicating significance (∗adjusted p < 0.05), while odds ratios <1 denote depletion. Downstream, gene end (<3 kb); dist., distal.
(C) MPRA design. Each reference and alternative allele (centered in 135 bp elements) was linked to 25 unique barcodes and cloned in front of a minimal CMV promoter and GFP reporter. Differentiated cardiomyocytes (CMs) and vascular smooth muscle cells (VSMCs) were transfected with the plasmid pool and barcodes were quantified.
(D) MPRA activity distribution of active sequences for CMs (5.46%) and VSMCs (5.39%).
(E) Variant effect sizes (log2 fold change) of reference allele activity vs. alternative allele in CMs (left) and VSMCs (right). Variants with significant regulatory activities are colored. Log2 fold change >0 indicates higher activity for reference sequence, while <0 indicates more activity of the alternative sequence.
(F) Effect size correlation between regulatory variants in CMs and VSMCs. Spearman’s rho (r) and number of sequences (n) are shown.
(G) Enrichment of regulatory elements at enhancer and promoter elements in five tissues. Thick black outlines represent significance at adjusted p < 0.05.
(H) Functional enrichment analysis of regulatory variants nearest neighboring genes. MBP, mean blood pressure; DBP, diastolic blood pressure; SBP, systolic blood pressure.
(I) Regulatory variants overlap GTEx eQTLs in BP-related tissues, especially in aorta and tibial artery.
(J) Functional enrichment analysis of nearest-neighbor genes of regulatory variants overlapping eQTLs.
(K) Colocalization analysis of regulatory variants. Upper bar plot shows the number of eGenes (target gene of an eQTL) colocalized with all analyzed BP GWAS loci (coloc) and GWAS loci with at least one regulatory variant in LD (reg. coloc). Bottom bar plot shows the number of all analyzed BP GWAS loci and GWAS loci with at least one regulatory variant in LD that colocalizes with eQTLs. Only eQTLs defined in GTEx cardiovascular-related tissues are shown. See also Figures S1 and S2; Tables S1, S2, S3, and S4.
We conducted MPRAs in VSMCs and CMs, because these cells generate the contractile tonus regulating BP and they respond to hypertension-induced structural changes in the cardiovascular system38,39,40 (Figures S1A–S1H; Video S1). We first quantified the ability of each sequence to regulate reporter transcription in either cell type. Regardless of the included allele, ∼5% of sequences drove transcription, similar to previous MPRAs33,41 (Figure 1D). We found 340 (7.37%) variants active in CMs and 350 (7.6%) in VSMCs. Barcode recovery was lower in VSMCs, and sequences showed a wider distribution of MPRA activity compared with CMs (Figures 1D, S1F, and S1I), likely due to lower transfection efficiency. Forty-four percent of active variants were shared between cell types (Figure S1J).
We then addressed whether the active sequences were preferentially located in CREs of cardiovascular-related tissues by interrogating the overlap with DNase-hypersensitive sites (DHSs) and chromatin immunoprecipitation sequencing (ChIP-seq) data from the compendium of epigenomic maps (EpiMap).42 To test this, we used DHS regions, active enhancers, promoters, and repressed regions in cardiac tissues, brain VSMCs, coronary artery, and smooth muscle. In both CMs and VSMCs, we found that elements with significant transcriptional activity are preferentially located at promoter elements (Figure S1K; Pearson’s chi-square test). Similar to previous findings,21 variants in promoters had higher MPRA activity than those located in enhancers, DHS regions, or closed chromatin regions (Figure S1L; two-sided Mann-Whitney testing, p < 0.05). The significant enrichment of active sequences in promoter elements is probably due to their higher transcriptional activity compared with sequences located in enhancers.
We next set out to identify variants with significant allelic skewing (FDR < 0.05), termed regulatory variants. We identified 1,788 (39%) in CMs and 391 (8.5%) in VSMCs (overlap 66.5%; overlap calculated by dividing the number of regulatory variants in both cell types by the smallest set of regulatory variants; Figures 1E and S2A–S2D; Tables S2, S3, and S4; STAR Methods), and regulatory variant effect sizes were highly correlated between cell types, consistent with recent findings31,43 (r = 0.71; Figure 1F). Most known variants identified in previous MPRAs21 or luciferase assays5 showed regulatory capacity in both cell types (five and four of six in CMs and VSMCs, respectively; Figure S2E), confirming the robustness and capacity of our analysis to detect true regulatory variants. Differences in the number of regulatory variants detected between cell types may result from larger barcode recovery associated with higher transfection efficiencies and consequently more statistical power to detect regulatory variants in CMs. Finally, we found that of the original GWAS variants, 91% in CMs and 63% in VSMCs had at least one regulatory variant in LD.
We further characterized the regulatory variants with EpiMap and determined that CM regulatory variants are preferentially located at both promoters and enhancers, while VSMC regulatory variants are found at promoters (Figure 1G; Pearson’s chi-square test, p < 0.05). These enrichments occur for closely related cell-type enhancer/promoter annotations, such as cardiac myocytes for CMs and cardiac muscle for VSMCs. As expected,21 regulatory variants at promoters had higher effect sizes than those located at enhancers, at DHSs, or in closed chromatin (two-sided Mann-Whitney testing, p < 0.05; Figure S2F). The functional enrichment of regulatory variant nearest genes showed an association with BP-related phenotypes (Figure 1H).
Next, we assessed if regulatory variants are associated with gene expression changes by studying expression quantitative trait loci (eQTLs) in cardiovascular-related tissues from GTEx (atrial appendage, left ventricle, coronary artery, tibial artery, and aorta).44 We found that regulatory variants with directionality concordant with the eQTL (sign of MPRA effect size concordant with sign of eQTL beta) had higher regulatory effect sizes than discordant regulatory variants (Figure S2G). More than 60% of our regulatory variants overlap with eQTLs (Figure 1I) and more than 25% with eQTLs in tissues from other BP-related systems (i.e., vascular, neural, and endocrine systems; Figure S2H). The higher proportion of regulatory variants overlapping tibial artery and aorta eQTLs (Figure 1I) may be explained by the larger number of GTEx eQTLs available for those tissues (Figure S2I). eQTL target genes are enriched in BP-relevant terms (Figure 1J). These results suggest that regulatory variants detected in MPRAs could mediate gene expression changes in tissues involved in BP regulation.
The simple overlap between genomic coordinates of GWAS-associated variants and eQTLs does not imply that the same genetic variant is driving both associations. To address the proportion of GWAS loci associated with BP that could be explained by gene expression changes, statistical colocalization analysis of GWAS variants and eQTLs was developed to evaluate whether both association analyses are driven by the same set of genetic variants.45 We performed a colocalization analysis between our BP-related variants with eQTLs from cardiovascular-related tissues.44 From the 135 tested loci, 48% (65/135 loci) colocalized with 151 eGenes (target genes of an eQTL). Further filtering for loci having at least one regulatory variant in LD, we were able to link 47% (63/135) of regulatory loci with 149 likely target genes (Figure 1K). Furthermore, we were able to link 39% of our regulatory loci with 124 likely target genes (Figure S2J) in tissues from other BP-related systems (i.e., vascular, renal, neural, and endocrine systems). Overall, these results suggest that at least half of the GWAS BP associations are driven by at least one variant affecting gene expression. The remaining loci could still be driven by changes in gene expression if the relevant eQTLs were highly cell-type specific or context dependent and had not been identified by current eQTL catalogs. An alternative explanation is that they could be driven by post-transcriptional mechanisms not captured in eQTL analysis, such as translation.
BP-associated regulatory variants disrupt TFBSs required for cardiovascular function
Changes in regulatory activity between alleles often relate to altered TFBSs.21,22,31 To uncover this relationship in our MPRA, we first addressed whether prediction of TFBS correlated with higher activity. The total number of TFs predicted to bind at active variants is larger than in non-active sequences (Figure 2A; Mann-Whitney, p = 6.135 × 10⁻³³). Next, we applied a linear regression model to find TFBSs that significantly explained MPRA activity variance. We determined that 87 TFBSs were associated with MPRA activity (86 TFBSs in both cell types and 1 TFBS in CMs alone; Figure S3A; STAR Methods). Most of these TFBSs were enriched at active sequences (88% in CMs and 65% in VSMCs), and half of them were also significantly enriched in sequences with regulatory variants (52% in CMs and 34% in VSMCs, hypergeometric test, FDR < 0.05; Figure 2B). Importantly, TFs predicted to bind at regulatory variants were enriched in cardiovascular terms. Among the TFs, we find T-box and RARA TFs, which are involved in various processes underlying formation and integration of heart components and vasculature (Figures 2C, S3B, and S3C).46,47
Figure 2.

Transcription factor binding sites (TFBSs) and their disruption at active and regulatory variants
(A) Comparison of the total numbers of TFBSs between active variants according to their significance (active in none, CMs, VSMCs, or both). Number of observations per group is written below each boxplot, and asterisks denote significance determined by two-sided Mann-Whitney tests (∗∗p = 6.135 × 10⁻³³). Box limits represent upper and lower quartiles. Central boxplot line represents the median and whiskers represent 1.5× interquartile range (IQR). Points represent outliers.
(B) Colored dots denote significant enrichment of predicted TF motifs across active and regulatory variants (hypergeometric testing, FDR calculated using the multicomp.multipletests function in Python with the Benjamini and Hochberg procedure, significance at FDR < 0.05).
(C) Enrichment analysis of TFs predicted to bind regulatory variants revealed cardiac and BP terms (top 10 terms are shown).
(D) Comparison of the total numbers of different TFBSs (absolute [number of TFBSs in reference allele] − [number of TFBSs in alternative allele]) between regulatory variants according to their significance (regulatory in none, CMs [∗p = 0.014], VSMCs, or both [∗p = 0.00073]).
(E) Counts of TFBS disruptions at regulatory variants for the top TFs in CMs and VSMCs.
(F) Enrichment analysis revealed important cardiac and BP terms of TFs that are predicted to be mostly disrupted at sites of regulatory variants.
(G) Examples of TFBSs disrupted by regulatory variants on either reference or alternative alleles. Horizontal black lines represent means.
(H) Bar plot depicting number of regulatory variants bound by expressed TFs in the cardiovascular system (only TFs bound to >2 regulatory variants in CMs are shown).
(I) Overlap between TFs bound (ChIP-seq in cardiovascular cell-types) at regulatory variants in CMs and VSMCs. See also Figure S3.
We then looked at TFBSs that were disrupted by one of the regulatory variant alleles. Twenty-four percent of regulatory variants (CMs, 431/1,788, and VSMCs, 95/391) disrupt at least one TFBS, similar to a recent study.48 The number of disrupted motifs is larger at regulatory variants compared with non-significant variants in both CMs and VSMCs (Figures 2D, 2E, and S3D–S3F; Mann-Whitney, p = 0.00073). Remarkably, TFs predicted to differentially bind regulatory variant alleles were enriched in terms related to heart and kidney development and in pathways known to play important roles in hypertension, such as the interleukin 18 pathway49 and the orexin receptor pathway50 (Figure 2F). For example, TFBSs for cardiovascular TFs, such as GATA1/3,51 MEF2A,52 TBX1 and TBX19,53 and RARA,47 were disrupted, and MPRA-activity changes ensued (Figure 2G).
To further study TF binding at our regulatory variants in their genomic context, we queried 417 ChIP-seq experiments of individual TFs in 33 cardiovascular cell lines for a total of 61 different TFs.54 One hundred thirty-six (7.6%) and 36 (9%) regulatory variants had at least one ChIP-Seq peak, corresponding to 43 different TFs in CMs and 36 in VSMCs (Figures 2H and 2I). The majority of them were shared between the two cell types (Figure 2I). Analyzing ChIP-seq data of individual TFs in cell lines derived from kidney and the neural system, which are BP-relevant tissues, we observed that 25% and 16% of our regulatory variants in CMs and VSMCs had at least one ChIP-seq peak in kidney and in the neural system, respectively. In addition, 9 and 7 TFs that we previously predicted to significantly explain MPRA variance are bound to regulatory variants found in CMs and VSMCs in the kidney and in the neural system, respectively. Furthermore, 74 and 20 regulatory variants in CMs and VSMCs, respectively, had TFs bound in all different BP-related systems assayed (Figure S3G). Thus, our MPRA approach determined genetic variants that are bound by TFs in BP-relevant cell types. Collectively, our set of regulatory variants harbors TFBSs that may relate to cardiovascular function by influencing the binding of distinct TFs relevant for BP regulation.
Alu elements preferentially harbor BP-associated regulatory variants
We wanted to address whether our regulatory variants were located in evolutionarily conserved regions. We observed that a minority of variants were in ultra-conserved elements, defined by PhastCons scores of >0.855 (77 variants in CMs, 12 in VSMCs; Figure S4A; Tables S5 and S6), suggesting that most regulatory variants are in non-conserved regions. Recent findings addressing the dichotomy of enhancer activity show that “fragile” enhancers are less conserved, at both the sequence and the functional levels,56 while evolutionarily conserved “stable” enhancers stably regulate developmental processes.56,57 Therefore, we hypothesized that the majority of our regulatory variants function in fragile enhancers. In fact, regions harboring regulatory variants in both cell types (window of ±10 bp surrounding the variant; variant position was excluded from the analysis) had significantly lower conservation values compared with regions harboring variants with no MPRA regulatory capacity (Figure S4B; Mann-Whitney. p = 0.00558). Considering that most regulatory variants appeared as non-conserved polymorphisms, we next asked if they predominantly mapped to repetitive sequences of transposable elements. We found a significant enrichment of CM regulatory variants in repetitive regions (p = 0.0234, Z score = 1.955, regioneR package with permutation test).58 We then explored whether this enrichment was driven by specific classes of repetitive elements. Indeed, 54% of regulatory variants were located in SINE/Alu elements, which is more than expected by chance (FDR = 0.0044 in CMs, FDR = 1.21 × 10⁻⁸ in VSMCs; Figures 3A and S4C). To explore this further, we assessed the relationship between being located in repetitive sequences and MPRA activity. In general, sequences in repetitive regions harboring regulatory variants had overall higher MPRA activity (Figure 3B; Mann-Whitney tests range from p = 0.00016 to p = 1.81 × 10⁻¹²). This was also true for all MPRA-tested sequences (Figure 3B; Mann-Whitney tests range from p = 0.00016 to p = 6.38 × 10⁻²⁰). Consistent with this, the number of TFBSs was larger for regulatory variants located in repeats (Figure 3C; Mann-Whitney, p = 8.109 × 10⁻²⁶, p = 2.754 × 10⁻¹¹, and p = 3.1841 × 10⁻⁹). On average, regulatory sequences in CMs and VSMCs had two times more TFBSs when located in repeats compared with unique sequences (8 vs. 4 in CMs, 10 vs. 4 in VSMCs, Mann-Whitney, p = 2.44 × 10⁻¹¹ and p = 2.61 × 10⁻⁹, respectively).
Figure 3.

Regulatory variants in repetitive sequences have higher MPRA activity
(A) Number of regulatory variants within repeats. Asterisks indicate significant enrichments (BH adjusted p value determined by a Pearson’s chi-square test). OR, odds ratio.
(B) MPRA activities of variants in repetitive sequences (rep. seq.) or unique sequences for all variants (left), active variants (middle), and regulatory variants (right) in CMs (top) and VSCMs (bottom). Number of observations per group are written below each boxplot. Asterisks indicate significant differences between distributions determined by two-sided Mann-Whitney tests at p < 0.05. P values are depicted above plots. Box limits represent upper and lower quartiles. Central boxplot line represents the median and whiskers represent 1.5× IQR. Points represent outliers. These comparisons are considered to be independent. Therefore, multiple-testing correction was not applied.
(C) Total numbers of predicted TFBSs located in repetitive regions vs. non-repetitive regions (unique seq.): other variants for all MPRA-tested variants (left), regulatory sequences in CMs (middle), and regulatory sequences in VSMCs (right). Asterisks denote significance (∗∗two-sided Mann-Whitney tests at p < 0.05). Box limits represent upper and lower quartiles. Central boxplot line represents the median and whiskers represent 1.5× IQR. Points represent outliers. These comparisons are considered to be independent. Therefore, multiple-testing correction was not applied.
(D) Colored dots denote significant enrichment of predicted TFBSs across variants in repetitive sequences (hypergeometric testing, FDR < 0.05).
(E) Examples of two zinc-finger TFs harboring KRAB domains that act as repressors (left and middle, CMs; right, VSMCs). Numbers in plots represent the total number of regulatory variants with a disrupted TFBS for the respective TF and p values. Box limits represent upper and lower quartiles. Central boxplot line represents the median and whiskers represent 1.5× IQR. See also Figure S4; Tables S5 and S6.
In general, many individual TFBSs (71%–81% in CMs, 62%–72% in VSMCs) associated with MPRA activity variance were significantly enriched in sequences located in repeats (hypergeometric test, FDR < 0.05; Figure 3D). We noticed that many zinc-finger TFs were among the enriched TFs in repetitive sequences. Kruppel-associated (KRAB) zinc-finger proteins (KZFPs) represent one of the largest families of DNA binding proteins.59 Recent studies demonstrate the preferential location of those TFs to transposable elements and suggest they act as repressors.60 Of the 11 TFBSs for zinc-finger TFs enriched in repeats, 10 feature KRAB domains and, consequently, disruption of ZNF sites resulted in higher MPRA activities (Figure 3E; p values determined by Mann-Whitney tests). Our results suggest that repetitive sequences have an intrinsic capacity to contribute to transcription. However, further in vitro and in vivo work is needed to address whether regulatory variants in these repetitive sequences functionally contribute to BP, hypertension risk, and CVD.
Loci harboring BP candidate genes can have high densities of regulatory variants
Recently published MPRA studies indicate that several regulatory variants in a haplotype may act synergistically within eQTLs and GWAS loci by cooperatively influencing target gene regulation.28,29,61 To explore this further, we studied the distribution of the number of variants per GWAS locus and found them to be highly variable (Figure 4A). When looking at the number of variants per GWAS locus, we observed that some GWAS loci had a large number of active variants (Figure S4D; Tables S7 and S8) and even more regulatory variants when normalizing for both number of variants in LD and length of haplotype block (Figures 4B, S4E, and S4F; Tables S9, S10, S11, and S12). These loci harbor genes that either had been reported in independent experimental studies in addition to the initial GWAS, such as MAP4,62 PDE5A,63 and CPEB4,64 and in chromosomal region 10q24.32,65 or had been recently proposed to be involved in BP regulation, such as ULK4,66,67 CFDP1,68 FBN1,69 and ESR170 (Figures 4B and 4C). Notably, some loci with up to hundreds of regulatory variants also showed high numbers of DHS peaks (i.e., 110 for ULK4, 57 for MAP4, 63 for CFDP1, etc.; Figure S4G), which may partially explain the clustering of regulatory variants.
Figure 4.

GWAS loci can have high densities of regulatory variants
(A) Density plot of the number of variants in LD per GWAS variant per megabase. Red line denotes median (572 variants/Mb), genes with high number of regulatory variants (B) are labeled.
(B) Density plot of the ratio between the number of regulatory variants in LD per GWAS variant and the number of variants per megabase in each LD block in CMs (left) and VSMCs (right). Red lines denote medians.
(C) Genome browser examples with numbers of aggregated regulatory variants at ULK4, MAP4, CFDP1, and 10q24.32 loci. Black lines indicate LD blocks.
(D) Scheme for luciferase assays. Reference and alternative sequences of every haplotype of concatenated regulatory alleles were analyzed in the 5′ → 3′ direction 5′ of luciferase. Number of variants concatenated for luciferase assays per locus is shown.
(E) Fold changes in luciferase activity comparing haplotypes of reference vs. alternative sequences to empty vector (four biological replicates). Asterisks show significance determined by unpaired two-tailed t tests (∗∗∗p < 0.004, ∗∗∗∗p < 0.0001). These comparisons are considered to be independent. Therefore, multiple-testing correction was not applied.
(F) Bubble plot showing the MPRA regulatory capacity of variants tested in the luciferase assay. See also Figure S4; Tables S7, S8, S9, S10, S11, S12, S13, and S14.
Thus far, MPRAs cannot test synergistic effects on the transcription of multiple regulatory variants and the cooperative binding of TFs. We sought to test whether synergistic regulatory haplotypes had larger effects on transcription than single variants using concatenated regulatory variants (either reference or alternative sequence). To do this, we selected 29 regulatory variants with high regulatory activity (CMs, q ≤ 0.01; VSMCs, q ≤ 0.1; both log2 FC ±1, 83% in repeats) that also mapped to loci with high densities of regulatory variants (Table S13). Specifically, we chose 10 variants at ULK4, four at MAP4, four at SMARCC1, and two each at the CPEB4, ESR1, PDE5A, and INSR loci. We concatenated the variants (each centered in 135 bp oligos) according to their genomic order (Figure 4D; Table S14), and compared the activity of the reference haplotype with its alternative haplotype (sentinel variants defined the naming of reference/alternative) over an empty vector in luciferase assays. We found that haplotypes with more regulatory variants (i.e., at SMARRC1, MAP4, and ULK4 loci) showed higher luciferase activity fold changes than those with fewer variants (Figure 4E; t tests, p < 0.005). Thus far, it remains unclear why more variants with higher activities derive from the reference alleles than expected in both cell types (Figure 4F; expectation 50%, Pearson’s chi-square test, p = 0.0015).
Loci with regulatory variants spatially converge with cardiovascular genes outside of their LD blocks
BP loci can have various densities of regulatory variants. Therefore, it is interesting to consider if these genomic regions harboring regulatory variants interact in three-dimensional (3D) genome organization with trait-relevant genes, similar to 3D proximity of genes and regulators in transcription factories.42,71,72,73,74,75 We addressed this question using chromosome conformation capture data of stem cell-derived stages of cardiac differentiation76 and VSMCs (Figure 5A; STAR Methods). We binned the genome in 50 kb bins, filtered for bins with at least one regulatory variant (CMs, 258 bins; VSMCs, 157 bins; Figure S5A) and interrogated these bins to identify significantly interacting regions. We analyzed only targets outside of the GWAS loci to not confound functional enrichment analysis with genes that had been identified in GWASs. We determined that bins with regulatory variants significantly interacted with regions harboring BP-related genes (within 50 kb bins, p < 0.001), for example, for heart morphogenesis and smooth muscle-related signaling (Figure 5B; Table S15). Excluding all BP GWAS loci and using 1,000× permuted random sets of interactions (p < 0.05) showed that our bins with regulatory variants interacted more than random genomic regions, in both CMs and VSMCs (Figure 5C; p < 0.001).
Figure 5.

Regulatory variants spatially converge with trait-relevant genes in 3D genome organization
(A) Scheme of Hi-C/Omni-C analysis with genome binned in 50 kb bins to analyze significant interactions of bins harboring regulatory variants with target genes. Ratios of regulatory over non-regulatory variants of each bin were generated to account for variant distribution per bin.
(B) Enrichment analysis of genes within 50 kb bins of significantly interacting bins with at least one regulatory variant. Cutoff p <0.001 to reduce number of genes for enrichment analysis. Terms listed are related to cardiovascular function according to the literature; BP-related terms are highlighted in bold.
(C) Number of genomic interactions for bins with regulatory variants compared with 1,000× permuted random sets of interactions. Red line denotes mean number of interactions per bin, asterisks denote significance (∗∗∗∗empirical p = 0).
(D and E) Arch plots (10% opacity) across entire chromosomes showing all significant genomic contacts of bins (50 kb) with regulatory variants at (D) ULK4 and (E) MAP4 in three Hi-C and in two Omni-C datasets. Numbers in arch plots indicate total number of interactions. Z scores indicate interactions occurring more (positive) or less (negative) often than expected considering the genomic linear distance. Zoomed-in windows exemplify that consecutive bins interact with the same targets.
(F) Scheme of Hi-C/Omni-C analysis to determine solely genomic contacts between bins harboring regulatory variants (reciprocal interactions).
(G) Number of reciprocal interactions per cell type.
(H) Enrichment analysis of genes involved in reciprocal interactions revealed specific cardiovascular pathways (highlighted in bold font). See also Figures S5 and S6; Table S15.
Next, we assessed whether regulatory variant density per genomic bin affected the numbers of genomic interactions by considering ratios of regulatory/non-regulatory variants (Figure 5A). Overall, bins with more regulatory variants (higher ratios) did not show more genomic interactions than bins with more non-regulatory variants, presumably because 3D genome organization happens on scales of chromosomal domains (i.e., topologically associated domains [TADs] and compartments), rather than sizes of LD blocks (Figures S5B–S5F). By focusing on the ULK4 and MAP4 loci with the highest densities of regulatory variants, we investigated their contribution to particular cardiovascular signal transductions. We found that consecutive bins with high densities of regulatory variants concertedly interacted with target genes that were significantly enriched in very specific cardiovascular pathways, such as cardiac and vasculature development and the RhoA GTPase cycle77 and SLIT-ROBO signaling78 (Figures 5D, 5E, S5G, and S6A). The last two pathways represent promising therapeutical targets for BP regulation.
The 3D proximity of regions with regulatory variants can entail a certain subset of genes that is different from the linear genomic lineup of all genes around all regulatory variants (Figure 1H). Therefore, to determine these genes and their biological relevance in cardiovascular pathways, we next addressed directly (reciprocally) interacting bins with regulatory variants (Figures 5F, S5H, and S5I). Interestingly, we found that a majority of bins with regulatory variants are involved in reciprocal interactions in all datasets (82.6% in CMs [213 bins] and 67.5% in VSMCs [106 bins]; Figures 5G, S5H, and S5I). For example, bins with regulatory variants at ULK4, MAP4, CACNA2D2, RYK, MECOM, and NEP, which are all linked to cardiovascular function, interacted directly (Figures S6B and S6C). In functional enrichments, we further explored the genes involved in these reciprocal contacts and found specific cardiovascular pathways, such as keratinization and leptin signaling during heart development79,80,81 and sialic acid transport and guanylate cyclase activity in smooth muscle82,83,84 (Figure 5H; Table S16). Reciprocal interactions occurred more frequently than in 1,000× randomly selected sets of interactions (p < 0.05; Figure S6D). By analyzing spatial genome organization, we uncovered the genomic architecture of regulatory variants in GWAS loci and showed that they converge in spatial hubs. Specifically, bins harboring regulatory variants spatially interact with target genes that are involved in specific cardiovascular signaling cascades, and they can be far away in the linear genome.
Heuristic scoring identifies the most likely causal variants
Our MPRA uncovered regulatory variants that are potential candidates to drive the association with BP regulation identified in GWASs. To determine the most likely causal variants, we developed a heuristic scoring algorithm to rank variants based on functional annotation and likeliness to affect targets. To do this, we utilized functional genomic properties (MPRA effect sizes [active and/or regulatory variants], LD association), genetic features (GWAS p value, variants in LD, ultra-conserved element, predicted TFBSs, GTEx eQTLs), and the epigenetic state (DHS, histone marks) in relevant cell types (see STAR Methods). Most regulatory variants (93%) overlapped with two or more functional annotations, while some had up to six functional annotations (Figure 6A). Of note, nearest-neighbor genes of regulatory variants with high ranking scores (>median; Tables S17 and S18) had more significant enrichment in cGMP-PKG signaling, which regulates systemic and pulmonary BP,85 and in vascular processes compared with low-ranked variants (Figure S6E). Exploring the scores revealed that the top 10% densely spread regulatory variants in comparison with less dense variants had significantly higher scores (Mann-Whitney, p = 0.00011; Figure 6B), indicating that loci with aggregated regulatory variants harbor more regulatory potential than loci with sparse variant distribution.
Figure 6.

Heuristic scoring identifies likely causal variants, and CRISPR prime editing definitively determines variant target genes
(A) Distribution of heuristic scores for all regulatory variants. Numbers above bars indicate numbers of regulatory variants per score.
(B) Comparison of the heuristic ranking scores between loci with high regulatory variants density (top 10%) and low variant density (bottom 10%). Significance from Mann Whitney test, CMs: p = 0.00011, VSMCs: p = 0.038. Number of variants under each category is shown inside each box.
(C) Significant associations between genetically predicted gene expression (GPGE) of ULK4, MAP4, CFDP1, and NT5C2 genes with SBP, DBP, and PP (pulse pressure) traits in BP-relevant tissues.
(D) CRISPR prime editing (PE) comprising Cas9 nickase, reverse transcriptase (RT), and pegRNAs precisely edited regulatory variants at allelic ratios: 100% reference sequence, low editing (∼30% of reference sequence), medium editing (∼60% of reference sequence), and ∼100% alternative sequence.
(E) Gene model for variant rs4631439 determining KCNK9.
(F) PE efficiencies (%) shown in Sanger sequencing tracks of rs4631439.
(G) Correlation between KCNK9 gene expression and PE allelic ratios for rs4631439.
(H) Arch plots (25% opacity) show genomic interactions as Z scores of locus harboring rs4631439 (in 50 kb bin) in Hi-C data of ventricular CMs (day 80) and in Omni-C data of VSMCs (day 21).
(I) Selection of predicted TFBSs that are disrupted at the variant’s position. Ambiguous mapping of TF motifs to multiple positions around variants is highlighted in gray.
(J) Gene model for variant rs3824754, SFXN2, and PCGF6.
(K) PE efficiencies (%) of rs4631439 and predicted TFBSs for ZNF619 that get disrupted at the variant’s position.
(L) Correlations between gene expression for SFXN2 and PCGF6 and rs3824754 allelic ratios from PE.
(M) Significant associations between GPGE of SFXN2 with SBP and PP traits in BP-relevant tissues.
(N) Arch plots (25% opacity) show genomic interactions as Z scores of locus harboring rs3824754 (in 50 kb bin) with SFXN2 and PCGF6 in Hi-C/Omni-C data. See also Figures S5 and S6; Tables S17, S18, S19, S20, S21, and S22.
We then wanted to further address whether our candidate genes at loci with highly ranked scores and highly dense regulatory variants (i.e., ULK4, MAP4, etc.) are putatively causal for BP traits both in cardiovascular and in other BP-relevant tissues (kidney, aorta, neural system, lung, fibroblasts). To do this, we looked at the associations between genetically predicted gene expression and BP traits found by the S-PrediXcan method86,87 from a recent trans-ethnic BP study.2 PrediXcan is an association approach that identifies trait-associated genes by correlating the genetically regulated expression of each gene with the trait of interest. We found associations for ULK4 across many tissues, while MAP4, CFDP1, and NT5C2 were each identified in two tissues (Figure 6C). These results suggest that genes near highly ranked regulatory variants in CMs and VSMCs may also play a role in BP regulation in other BP-relevant tissues. Our systematic scoring of functional regulatory variants represents a valuable resource for multiple fields investigating BP and cardiac and vascular responses to hypertension and will help shorten the list of putatively causal variants for mechanistic follow-up studies.
CRISPR prime editing (PE) determines gene-regulatory effects of causal variants
Further experimental approaches testing the MPRA-identified and epigenomically characterized regulatory variants in the endogenous chromatin context are required to finally link causality to target genes. To accomplish this aim, we selected three regulatory variants (rs4631439, rs3824754, and rs3753326) at different GWAS loci that were ranked among the most likely causal variants by our scoring system and substituted them by PE88 (Tables S19 and S20). We hypothesized that either the reference or the alternative alleles of regulatory variants, or a ratio of both, had expression effects on nearby genes. We chose HEK293 cells for PE, because their aneuploid genomes allow modeling of different allelic ratios and their TF expression profile and DHS landscapes are similar to those of CMs and VSMCs (88.56% of TFs [604/682] expressed >1 TPM in CMs and VSMCs; Figures S6F–S6G). PE substituted the HEK293 genotype at a regulatory variant’s position to different allelic ratios (low [∼30%], medium [∼60%], high [80%–100% = alternative sequence]) (Figure 6D). We reasoned that if a regulatory variant affected TF binding and influenced target gene expression, we should observe a correlation between allelic ratio and gene expression. Thus, to identify gene expression changes in the isogenic cell lines, we performed RNA sequencing (STAR Methods).
Regulatory variant rs4631439 is in an intron of TRAPPC910 in an ENCODE3 enhancer (Figure 6E) and is the only regulatory variant in its LD block in both CMs and VSMCs. Upon rs4631439 editing (Figure 6F), TRAPPC9 expression did not change. Instead, expression of KCNK9 (TASK3), located 345.4 kb upstream, positively correlated with the proportion of variant editing (permutation test, FDR < 0.05; Figure 6G; STAR Methods). KCNK9 is a potassium channel, and its deletion recapitulates essential hypertension in vivo.89 This result is consistent with the observation that the rs4631439 reference allele is the one associated with higher hypertension risk5,10 and KCNK9 downregulation. In addition, in a cross-sectional and a longitudinal study, several common genetic variants at the KCNK9 locus were associated with BP variation.90 Hi-C/Omni-C data in CMs and VSMCs corroborated PE results by revealing genomic contacts between genes (KCNK9) and bins harboring the edited variant (Figure 6H; 90% confidence interval, p < 0.1 is significant, KCNK9 p = 0.08). TFBS analysis predicts that the rs4631439 alternative allele disrupts three TFBSs of zinc-finger TFs, of which two have a repressor function.91 This is consistent with the finding that TFBS disruption increases expression (Figure 6I; Table S21). rs4631439 was not tested as an eQTL in GTEx.
Regulatory variant rs3824754 is located at an ultra-conserved element boundary in the promoter region of BORCS792,93 and the promoter of long non-coding RNA (lncRNA) RP11-753C18 (lnc_CYP17A1) at 10q24.32 (Figure 6J). The variant is the only variant in this LD block with regulatory activity in both CMs and VSMCs. Editing rs3824754 (Figure 6K) did not affect the expression of nearby genes but rather led to significant downregulation of two genes farther away: SFXN2 (111.1 kb upstream) and PCGF6 (448.2 kb downstream, FDR <0.05; Figure 6L). SFXN2 is a serine transporter and is associated with BP94 and CAD,95 and we found significant association in other BP-relevant tissues using predicted gene expression levels (Figure 6M), while PCGF6 regulates mesodermal lineage differentiation.96 In GTEx,44 rs3824754 is an eQTL for SFXN2 in multiple tissues, and consistent with our PE results, the alternative allele is associated with SFXN2 downregulation (Figure S6H). We predicted that the ZNF619 TFBS would be disrupted by one of the regulatory variant alleles (Figure 6K; Table S22), and ChIP-seq analysis from ENCODE confirmed that ZNF619 binds at this region.97 Genomic contacts in CMs and VSMCs showed significant interactions between rs3824754, PCFG6, and SFXN2 (p = 0.05, 90% confidence interval; Figure 6N). Editing of rs3753326 in an intron of CELA2A in an ENCODE3 enhancer did not lead to changes in nearby genes (±500 kb; Figure S6I). Our findings show that PE can definitively determine variant target genes that are promising candidates for BP regulation and hypertension risk. Moreover, the heuristic ranking approach provides a confident list of regulatory variants to study BP gene regulation.
Discussion
GWASs link genetic loci and common human traits and diseases98; however, dissecting the underlying mechanisms driving these associations is challenging, because of variants in high LD and an incomplete knowledge of the non-coding genome.15,16 Thus far, a few studies have successfully identified causal variants and their association with target genes and biological consequences.99 We used high-throughput genomics to functionally test 4,608 genetic variants associated with BP and hypertension in two cardiovascular-related cell types. We are able to identify at least one regulatory variant in LD with 91% and 63% of the GWAS hits in CMs and VSMCs, respectively. By combining MPRAs with public epigenome data, TFBSs, eQTLs, and chromosome conformation information, we describe credible variants enriched at CREs and nearby BP genes as strong candidates to drive GWAS associations and to be functionally involved in BP gene regulation. Finally, using PE perturbations, we identified target genes for two of these variants and their mechanistic function. For example, we found that KCNK9, which has been previously associated with hypertension,89 is affected by regulatory variant rs4631439. Collectively, we provide a resource of systematically characterized regulatory variants that are likely to be involved in BP gene regulation.
Current concepts constitute that GWAS hits are driven by a single causal variant. However, recent studies suggest that multiple variants can act together to drive eQTL and GWAS association.28,29 Furthermore, disease-associated loci can harbor multiple regulatory variants at different enhancer elements that could simultaneously contribute to complex traits.42 We find that several BP-associated loci have high densities of regulatory variants in CREs that can add up their function to transcribe a reporter and to cooperatively interact in 3D with cardiovascular genes. This is also in line with another recent MPRA study uncovering that transcriptional activation functions linearly and that more TFBSs at enhancers lead to additive effects.61
It is possible that loci with high densities of regulatory variants cooperatively drive transcriptional programs. Each variant alone contributes small effects, as is known for BP regulation,3 but acting in concert they influence BP signaling and hypertension risk. We suggest that, especially, the microtubule-associated proteins MAP4 and ULK4, as well as CFDP1, CPEB4, PDE5A, FBN1, ESR1, and genes at chr.10q24.32 (see Tables S9 and S10), are of particular interest for functional follow-up studies because aggregated regulatory variants at their loci may contribute more to the polygenic BP traits than single causal variants.
Understanding 3D genome organization is fundamental to identifying gene-regulatory networks driving disease risk. Indeed, we find that loci with regulatory variants coalesce with intricate cardiovascular signaling networks and that they can modify the expression of genes that are distant in linear space but in close spatial proximity via chromatin loops. Target genes of long-range interactions are enriched in BP-related signaling, suggesting that BP-regulatory variants may exert their BP-associated effects through interactions that extend their LD block, similar to recent findings.100,101 Editing two regulatory variants showed that three identified target genes are not the closest in linear genomic space. This is concordant with recent fine-mapping approaches addressing genomic distances between variants and causal genes, predicting that sentinel variants have at least one causal gene within <500 kb distance102 and that in ∼23% of variant-transcriptional start site (TSS) connections, the involved gene was not the closest.103
We present evidence that BP-regulatory variant loci are less conserved and substantially map to repetitive sequences (SINE/Alu). Recent studies correlate repeats with transcriptional regulation through cis and trans effects104 and show that genetic variation in repetitive sequences may affect gene expression by altered TF recruitment in a cell-type-specific and species-specific manner.104 BP-regulatory variants within repetitive regions show stronger effect sizes than variants in unique sequences, and variants within TFBSs show more TF diversity and motifs (>2-fold). The differential activities of regulatory variants allowed us to relate altered TFBSs to a set of TFs that control cardiovascular function. It remains to be determined if sequence-specific recognition of TFBSs around regulatory variants in repetitive sequences influence BP gene regulation and hypertension risk and if putative cotranscriptional activation of nearby transposable elements complements target gene regulation in spatial proximity.104
In conclusion, we augment the understanding of the functional genomic architecture required for BP gene regulation by determining regulatory variants in two cardiovascular-related cell types, highlighting candidate genes and physiologically relevant pathways, and by providing a confident list of regulatory variants for follow-up studies. Distinguishing regulatory from non-regulatory variants accelerates current efforts in molecular precision medicine15 to use indicatory “risk variants” clinically as genomic markers.
Limitations of the study
Prior studies have confirmed the effectiveness of MPRAs in identifying regulatory variants.21,31,33 However, our study has several limitations. First, some variants may be regulatory only under certain disease-related conditions, such as inflammation, or in their native genomic context.105 Second, we have studied BP-relevant genetic variants in two cell types related to hypertension; however, the MPRA-identified variants and loci may exert their pathogenic mechanisms in other tissues or cell types that we have not tested in this study, such as adrenal gland or kidney. Third, MPRAs using exogenous DNA constructs in in vitro models are limited in fully recapitulating complex in vivo scenarios. Thus, further work and additional functional assays are needed to address whether our regulatory variants in CMs and VSMCs are regulatory in their genomic context, in other BP-related cell types, and under hypertensive and CVD-related conditions.
STAR★Methods
Key resources table
| REAGENT or RESOURCE | SOURCE | IDENTIFIER |
|---|---|---|
| Antibodies | ||
| Mouse monoclonal Anti-Cardiac Troponin T antibody | Abcam | Cat#ab10214; RRID:AB_2206574 |
| Bacterial and virus strains | ||
| NEB 5-alpha Competent E.coli (High Efficiency) | NEB | Cat#C2987H |
| Chemicals, peptides, and recombinant proteins | ||
| STEMdiff CM Differentiation Kit | STEMCELL Technologies | Cat#05010 |
| SfiI | NEB | Cat#R0123L |
| Alkaline Phosphatase, Calf Intest | NEB | Cat#M0290L |
| T4 DNA Ligase | NEB | Cat#M0202M |
| XbaI | NEB | Cat#R0145L |
| KpnI-HF | NEB | Cat#R3142L |
| Q5- High Fidelity DNA polymerase | NEB | Cat#M0491L |
| Formamide (Deionized) | Invitrogen | Cat#AM9342 |
| Agencourt AMPure XP | Beckman Coulter | Cat#A63881 |
| Trizol Reagent | Life Technologies | Cat#15596018 |
| RNase-Free DNase set | Qiagen | Cat#79254 |
| DNaseI recombinant | Worthington Biochemical | Cat#LS006355 |
| T4 Polynucleotide Kinase | NEB | Cat#M0201L |
| SacI-HF | NEB | Cat#R3156L |
| Lipofectamine 3000 | Invitrogen | Cat#L3000008 |
| Lipofectamine Stem Transfection Reagent | Invitrogen | Cat#STEM00015 |
| Recombinant Human EGF Protein, CF | R&D Systems | Cat#236-EG-200 |
| L-Alanyl-L-Glutamine | ThermoFisher Scientific | Cat#J66996.14 |
| Geneticin | Life Technologies | Cat#G418 |
| TGF-b1 | R&D Systems | Cat#240-B-002 |
| GeneXPlus Transfection Reagent | ATCC | Cat#ACS-4004 |
| 16% Formaldehyde (W/V) Methanol-free | ThermoFisher Scientific | Cat#28906 |
| 5M NaCl | Invitrogen | Cat#AM9759 |
| 1M Tris pH8.0 | Invitrogen | Cat#AM9856 |
| Tween-20 | Sigma-Aldrich | Cat#P9416 |
| BsaI HF-v2 | NEB | Cat#R3733S |
| BsmBI | NEB | Cat#R0739S |
| Puromycin Dihydrochloride | Gibco | Cat#A1113803 |
| Thermo Scientifi Phusion Hot Start II High-Fidelity PCR Master Mix | Thermo Scientific | Cat#F565L |
| DirectPCR Lysis Reagent | Viagen | Cat#301-C |
| OneTaq Hot Start Quick-Load 2X Master Mix with Standard Buffer | NEB | Cat#M0488L |
| PowerUp™ SYBR™ Green Master Mix | ABI | A25742 |
| Critical commercial assays | ||
| Micellula DNA Emulsion & Purification Kit | Chimerx | Cat#3600-02 |
| QIAGEN Plasmid Plus Maxi Kit | Qiagen | Cat#12965 |
| dsDNA Quantitation, High Sensitivity | ThermoFisher Scientific | Cat#Q32851 |
| RNeasy Mini Kit | Qiagen | Cat#74104 |
| SuperScript III 1st Strand Synthesis | Invitrogen | Cat#18080051 |
| Gibson Assembly Master Mix - 10 rxns | NEB | Cat#E2611S |
| Quick Ligation Kit | NEB | Cat#M2200L |
| Dual-Luciferase Reporter Assay System | Promega | Cat#E1910 |
| DNeasy Blood and Tissue kit | Qiagen | Cat#69506 |
| Monarch PCR & DNA Cleanup Kit | NEB | Cat#T1030L |
| TruSeq Stranded Total RNA Ribo-Zero Gold | Illumina | Cat#RS-122-2301 |
| Deposited data | ||
| MPRA and RNAseq data upon CRISPR prime editing | This paper | GSE213558 |
| Omni-C data | This paper | GSE217358 |
| Experimental models: Cell lines | ||
| Human: HEK-293 | ATCC | Cat#CRL-1573 |
| Human: hTERT-immortalized adipose derived primary human mesenchymal stem cells | ATCC | Cat#SCRC4000 |
| Human: PGPC-17 human iPS cells | Hildebrandt et al., 2019106 | N/A |
| Oligonucleotides | ||
| ePCR forward primer: GCTAAGGGCCTAAC TGGCCGCTTCACTG |
Mattioli et al.21 | N/A |
| ePCR reverse primer: GTTTAAGGCCTCCG AGGCCGACGCTCTTC |
Mattioli et al.21 | N/A |
| cloning step 1, universal 3’ primer: AATGAT ACGGCGACCACCGAGATCTACACTCTTT CCCTACACGACGCTCTTCCGATCT |
Mattioli et al.21 | N/A |
| cloning step 1, universal 5’ primer: caagcagaa gacggcatacgagatCGTGATgtgactggagttcagacg tgtgctcttccgatctACTGGCCGCTTCACTG |
Mattioli et al.21 | N/A |
| cloning steps 2 & 3 and cDNA libraries, universal 3’ primer: AATGATACGGCGACCACCGAGATCTACAC TCTTTCCCTACACGACGCTCTTCCGATCT |
Mattioli et al.21 | N/A |
| cloning steps 2 & 3 and cDNA libraries, universal 5’ primer: caagcagaagacggcatacgagatCGTGATgtgac tggagttcagacgtgtgctcttccgatctCGCCGCGTGGAG GAGGA |
Mattioli et al.21 | N/A |
| Oligonucleotide pool, see Table S1 | This paper | N/A |
| pegRNA/gRNAs, see Table S19 | This paper | N/A |
| qPCR primers, see Table S24 | This paper | N/A |
| Recombinant DNA | ||
| pGL4.29 | Promega | Cat#E8471 |
| pRL-TK | Promega | Cat#E2241 |
| MPRA_backbone_empty_pGL4-2.3_cloning_site_polyA | Mattioli et al.21 | N/A |
| pCMV-PE2 | Anzalone et al.88 | Addgene Cat#132775 |
| pU6-gg acceptor | Anzalone et al.88 | Addgene Cat#132777 |
| BPK1520_puroR | Erwood et al.107 | Addgene Cat#173901 |
| Software and algorithms | ||
| rAggr | N/A | https://web.archive.org/web/20160416223424/http://raggr.usc.edu/ |
| HaploView | N/A | http://www.broad.mit.edu/mpg/haploview |
| MPRAnalyze | Ashuach et al.108 | https://bioconductor.org/packages/release/bioc/html/MPRAnalyze.html |
| BEDTools | Quinlan and Hall109 | https://code.google.com/archive/p/bedtools/ |
| R version | v4.0.2 | https://www.r-project.org/ |
| Ensembl Variant Effect Predictor Tool | McLaren et al.110 | https://github.com/Ensembl/ensembl-tools/archive/release/83.zip |
| PhyloP | Pollard et al.111 | http://compgen.cshl.edu/phast/ |
| PastCons | Siepel et al.55 | http://compgen.cshl.edu/phast/downloads.php |
| ColocQuial | Chen et al.45 | https://github.com/bvoightlab/ColocQuiaL |
| COLOC package | Giambartolomei et al.27 | https://github.com/bvoightlab/ColocQuiaL |
| FIMO | Bailey et al.112 | https://meme-suite.org/meme/doc/fimo.html |
| Python Statsmodels package | Seabold et al.113 | https://www.statsmodels.org/stable/index.html |
| Hisat2 | Kim et al.114 | http://daehwankimlab.github.io/hisat2/ |
| FeatureCounts | Liao et al.115 | https://subread.sourceforge.net/ |
| DESeq2 | Love et al.116 | http://www.bioconductor.org/packages/release/bioc/html/DESeq2.html |
| Metascape | Zhou et al.117 | https://metascape.org/gp/index.html#/main/step1 |
| WebGestalt | Liao et al.118 | http://www.webgestalt.org/ |
| Hi-C Processing Protocol | 4D Nucleome Project | https://data.4dnucleome.org/resources/data-analysis/hi_c-processing-pipeline#overview |
| Samtools version 1.5 | Li et al.119 | https://samtools.sourceforge.net/ |
| Pairx version 0.3.7 | N/A | https://github.com/4dn-dcic/pairix |
| Pairtools version 0.3.0 | N/A | https://github.com/open2c/pairtools |
| Cooler version 0.8.11 | Abdennur and Mirny120 | https://github.com/mirnylab/cooler |
| RepeatMasker Open-4.0 | Smit, AFA, Hubley, R & Green, P | http://www.repeatmasker.org |
| Sushi package v1.32.0 | R v4.0.2 | https://bioconductor.org/packages/3.14/bioc/html/Sushi.html |
| DeepPE | Kim et al.121 | http://deepcrispr.info/DeepPE/ |
| EditR | Kluesner et al.122 | http://baseeditr.com/ |
| GraphPad Prism v 9.3.0 | 9.3.0 | https://www.graphpad.com/scientific-software/prism/ |
| R v4.1.2 | 4.1.2 | https://www.r-project.org/ |
| Python v3.8.10 | 3.8.10 | https://www.python.org/downloads/ |
| Cutadapt | Martin123 | https://cutadapt.readthedocs.io/en/stable/ |
Resource availability
Lead contact
Further information and requests for resources and reagents should be directed to and will be fulfilled by the lead contact Philipp G. Maass (Philipp.maass@sickkids.ca).
Materials availability
Aliquots of the MPRA plasmid pool generated in this study can be obtained upon suitable request from the Maass Lab (SickKids Research Institute).
Experimental model and subject details
All studies were performed under the regulation of the SickKids Research Ethics Board and Canadian Institutes of Health Research Stem Cell Oversight Committee. Human iPS cells derived from peripheral blood lymphocytes of a healthy adult male donor (PGPC-17),106 were differentiated into cardiomyocytes (CMs) using the STEMdiff CM Differentiation Kit (STEMCELL Technologies). hTERT-immortalized female adipose-derived primary human mesenchymal stem cells (MSCs, SCRC4000, ATCC) were maintained in basal MSC media (PCS-500-030, ATCC), supplemented with 2 % FBS (ThermoFisher), 5 ng/ml recombinant human FGF basic (R&D Systems 233-FB-010), 5 ng/ml recombinant human FGF acidic (R&D Systems 232-FA-025), 5 ng/ml recombinant human EGF (R&D Systems 236-EG-200), 2.4 mM L-Alanyl-L-Glutamine (ThermoFisher), and 0.2 mg/ml Geneticin (G418, ThermoFisher). MSCs were differentiated into VSMCs over the course of 19 days by supplementing the above described basal MSC media with 1 ng/ml TGF-β1 (R&D Systems 240-B-002) as previously described.124,125 HEK-293 cells (ATCC) were cultured in EMEM (Gibco), supplemented with 10 % FBS (Canadian origin, ThermoFisher) and 1 % Penicillin/Streptomycin (ThermoFisher). All cells were maintained at sub-confluent conditions, maintained at 37 C with 5 % CO2 and were passaged every 3-4 days.
Method details
Variant selection and MPRA design
We compiled a collection of 135 GWAS variants based on the results of Warren and colleagues.5 We used GWAS variants in European ancestry as input for rAggr (https://web.archive.org/web/20160416223424/http://raggr.usc.edu/) which uses an expectation–maximization algorithm from Haploview (http://www.broad.mit.edu/mpg/haploview),36 to identify variants in high LD in European populations (±500 kilobases [kb] of GWAS variant, r2 ≥ 0.8, MAF ≥ 0.05). The full list of variants can be accessed in Table S1. Each variant was centered in an element of 135 base pairs (bp) which was included in each oligonucleotide to accurately sample the variant in its surrounding genomic environment and its regulatory capacity.21 All oligos contained universal primers, two restriction sites, an 11 bp barcode, and the genomic locus of interest as follows: 5’ - universal primer 1 (ACTGGCCGCTTCACTG) – variant region (135 bp) - XbaI (6 bp) - KpnI (6 bp) - barcode (11 bp) - universal primer 2 (AGATCGGAAGAGCGTCG) - 3’. By using 25 unique barcodes for each allele of the BP-associated variants, we achieved redundancy and statistical power, and we reduced both sampling bias and technical variation during the experimental steps, such as the loss of oligonucleotides during cloning procedures.
We used six known regulatory variants as positive controls for regulatory activity. Four of them were identified in a previous MPRA study to have differential activity in both HepG2 and K562 cell lines.21 The remaining two known variants had been identified in a hypertension GWAS study, and tested for regulatory activity in a luciferase assay5 (Figure S2E). Each known variant was coupled to 100 unique barcodes per allele. 335 random sequences each with five barcodes served as negative controls for the detection of transcriptionally active sequences, resulting in a total pool of 232,975 oligonucleotides.
Emulsion-PCR (ePCR) amplification of oligonucleotides
The oligo pool was ePCR-amplified in 18 parallel reactions according to the manufacturer’s instructions (ePCR, Micellula DNA Emulsion & Purification Kit, Chimerx). Primers were designed to include SfiI restriction sites for subsequent cloning steps (5’ primer: GCTAAGGGCCTAACTGGCCGCTTCACTG; 3’ primer: GTTTAAGGCCTCCGAGGCCGACGCTCTTC). After ePCR amplification, 1 ng of oligo pool was used as input for library preparation. Oligo representation was evaluated by sequencing on a HiSeq 2500 (Illumina), where each unique barcode was quantified (Figure S1).
MPRA cloning
For high-throughput cloning, the synthesized oligos as pool (Twist Bioscience) were coupled to a cytomegalovirus (CMV) minimal promoter, a reporter gene, and a unique barcode.21,43,126,127 Integrity, representation, and unimodality of oligos and barcodes were validated at each cloning step by sequencing on a HiSeq 2500 (Illumina, Figure S1). Specifically, 50 ng of the ePCR-amplified oligo pool and 6 μg of the MPRA empty vector were digested using 50 U of SfiI (NEB) in a 20 μL reaction at 50˚C for 90 minutes. The empty vector was treated with calf intestinal phosphatase (CIP; NEB) at 37˚C for 30 minutes. Fragments were ligated in a 4:1 insert:vector ratio using T4 DNA ligase (NEB) in a total of two 20 μl ligation reactions. Ligations were evenly split and used for transformations of 32x 50 μL DH5α chemically competent cells (NEB). Cells were spread across 80 LB ampicillin plates and incubated at 37˚C overnight. All transformed bacterial colonies were pooled together by scraping plates into liquid LB and plasmid DNA was purified using twelve endotoxin-free Plasmid Plus Maxis (Qiagen).
In the second cloning step the oligo pool was sequentially digested with KpnI followed by XbaI (NEB). The insert consisting of a GFP ORF downstream of a cytomegalovirus (CMV) minimal promoter (5’-AGAGGGTATATAATGGAAGCTCGACTTCCAG-3’) was cut from a previously used MPRA vector,21 using KpnI and XbaI and ligated into the linearized oligo pool. Ligations were prepared and transformed as described above. Barcode representation was evaluated (Figure S1). To remove plasmids that did not contain integrated promoter-GFP, the oligo pool was digested with KpnI. Complete clones were size selected by separation on an agarose gel, re-ligated, cloned, and sequenced as described above.
MPRA library preparation
50 ng of cloned oligo pools (DNA input) were amplified using Q5 DNA polymerase (NEB), 5 % Formamide, and 5 μL of 2 mM index primer (cloning step 1, universal 3’ primer: AATGATACGGCGACCACCGAGATCTACACTCTTTCCCTACACGACGCTCTTCCGATCT; Index 1 5’ primer: caagcagaagacggcatacgagatCGTGATgtgactggagttcagacgtgtgctcttccgatctACTGGCCGCTTCACTG; cloning steps 2 & 3 and cDNA libraries, universal 3’ primer: AATGATACGGCGACCACCGAGATCTACACTCTTTCCCTACACGACGCTCTTCCGATCT; Index 1 5’ primer: caagcagaagacggcatacgagatCGTGATgtgactggagttcagacgtgtgctcttccgatctCGCCGCGTGGAGGAGGA, underlined nucleotides = index; hot start PCR setting: 98°C 30 sec, 98°C 7 sec, 55°C 10 sec, 72°C 10 sec [x 22-28 cycles], 72°C 2 min, 4°C hold). Library integrity, specific amplification, and concentration were first checked after 22 cycles using a Qubit Fluorometer with a dsDNA High Sensitivity Assay Kit (ThermoFisher) and BioAnalyzer (Agilent). Insufficient amplifications were run for 2-6 additional cycles. Amplified libraries were then size selected three times using AMPure beads (Beckman) at 0.6X, 1.6X, and 1X ratios as per the manufacturer’s instructions.
Cell culture & transfections
Immunofluorescent staining of troponin (Abcam ab10214), and video documentation of beating cardiomyocytes validated successful CM differentiation (Video S1). Transfections of 21 days differentiated CMs were performed with 2x10⁶ cells and 10 μg of the MPRA plasmid pool (split in two wells of a 6-well plate) and Lipofectamine Stem Transfection Reagent (STEM00015, ThermoFisher) for 48 h. Transfections with GFP served to evaluate transfection efficiencies on an EVOS M5000 epifluorescence microscope (ThermoFisher, Figure S1).
Successful VSMC differentiation of hTERT-immortalized adipose derived primary human mesenchymal stem cells (MSCs, SCRC4000, ATCC) was validated by quantification of smooth muscle markers (transgelin [TAGLN], calponin-1 [CNN1], and smooth muscle actin [ACTA2]) using qRT-PCR with PowerUp (ABI) (Figure S1, Table S24).124 CTs were normalized to GAPDH as a housekeeper. 19-20 days differentiated VSMCs (1.1x10⁶ cells / 10 cm dish) were transfected with 12 μg MPRA oligo pool and 12 μl GeneXPlus (1:1 ratio, ACS-4004, ATCC) for 48 h. Transfection efficiency was evaluated as described for CMs (Figure S1). Lower transfection efficiencies and thus lower barcode recovery rates were observed in VSMCs, consequently impacting our statistical power to detect regulatory variants in this cell type.
RNA extraction, DNase I treatment, and cDNA preparation
Total RNA was extracted from MPRA-transfected cells using the phenol-chloroform extraction method according to standard protocols. Residual genomic or plasmid DNA was removed using a two-step DNase I digestion. First, an off-column digestion was performed using a RNase-free DNase set (Qiagen), followed by a column purification using the RNeasy Mini Kit (Qiagen) according to the manufacturer’s instructions. Subsequently, the sample was digested again using a DNase I from Worthington for 30 minutes at 37˚C. cDNA was synthesized using SuperScript III First Strand Synthesis System (Invitrogen). Reactions including and excluding reverse transcriptase (RT) were run in parallel. DNA contamination was calculated using qRT-PCR with PowerUp (ABI) where percent contamination was calculated as the difference in Ct between reactions without RT and those with RT, with values normalized to GAPDH. Samples with DNA contamination above 0.25 % were re-prepared or rejected (Figure S1).
Luciferase assays
Oligos with variants (each 135 bp) that showed significant differential activity in the MPRAs were aligned according to their 5’ → 3’ genomic orientation. This haplotype was modeled by a G-block (IDT) and inserted into pGL4.29 (Promega) via PCR-mediated addition of KpnI and SacI restriction sites, respectively. Oligos harboring highly repetitive sequences (i.e. SMARCC1 and MAP4, Tables S13 and S14), were stitched together as single oligos by Gibson Assembly (NEB). Specifically, 90 bp long single-stranded oligo pairs (IDT) contained a four or five bp sequence complementary to the following (top) or previous (bottom) segment. Top and bottom oligo pairs were annealed and phosphorylated with T4 PNK (NEB). All segments were then mixed in equal parts and subject to the same annealing protocol. Gaps were sealed using Quick Ligase (NEB). These assemblies were then PCR-amplified and processed as described above. HEK-293 cells were transfected using Lipofectamine 3000 (ThermoFisher). 1x10⁵ cells were seeded in a 24-well plate and transfected with 75 fmol of pGL4.29+haplotype and 12.5 ng of pRL-TK plasmid (Promega) after 24 hours. Cells were harvested and lysed 48 hours post transfection, and luminescence was measured using the Dual Luciferase Reporter Assay System (Promega) on a Synergy Neo2 plate reader (BioTek) equipped with a dual reagent injector system.
Hi-C and Omni-C
The molecular chromosome conformation capture technique Hi-C,128 and Omni-C (randomly digested chromatin, Dovetail Genomics, CA, USA) analyze genomic interactions. We utilized published Hi-C datasets of CMs,76 and generated Omni-C data of MSC-derived VSMCs (day 21). VSCMs were FA-crosslinked for 10 min and pelleted for 5 min with 2000 g. Pellets were washed in 800 μl wash buffer (100 mM NaCl, Tris pH8.0, 0.05% Tween-20) until fully resuspended. Supernatants were removed after 5 min centrifugation at 2000 g. The latter two steps were repeated, and cell pellets were frozen at -80C for library preparation. Of two independent VSMC differentiations, three technical replicates and library preparations were performed by Dovetail Genomics, CA, USA. The processing of the raw sequencing data was done using the Hi-C Processing Protocol from the 4D Nucleome project (https://data.4dnucleome.org/resources/data-analysis/hi_c-processing-pipeline#overview) (see below).
CRISPR prime editing
Prime editing and nicking guides were designed for 32 regulatory variants using DeepPE121 (Table S19). pCMV-PE2 and pU6-gg acceptor plasmids were a gift from David Liu’s lab (Addgene #132775 and #132777, respectively). Prime editing guides were cloned into pU6-gg acceptor using Golden Gate Assembly with Bsa1 HF-v2 (NEB).88 Nicking guides were cloned into BPK1520_puroR, a gift from Ronald Cohn’s lab (Addgene #173901), using BsmBI. HEK-293 cells (ATCC) were transfected at 80 % confluency in 12-well plates with 300 ng pCMV-PE2, 250 ng BPK1520_PuroR+nicking guide (Addgene #173901)107, and 700 ng of pU6-gg acceptor+pegRNA via the Lipofectamine 3000 protocol (ThermoFisher). Transfected cells were selected 36 hours post-transfection with 3 μg/mL puromycin. Cells were subcultured as needed and ultimately harvested 7 days post-transfection for genotypization. Transfected cell populations were subject to gDNA extraction using DNeasy Blood & Tissue kit (Qiagen). 400-800 bp regions around prime edited regions were PCR-amplified using Phusion High-Fidelity PCR Master Mix (ThermoFisher). Amplicons were purified using the Monarch PCR & DNA Cleanup Kit (NEB) and sent for Sanger sequencing, using the forward primer from the earlier PCR. Level of editing within the population was assessed using EditR.122. Despite DeepPE scores that theoretically allow successful PE of 32 variants, we accomplished various editing levels of three of the 32 variants (Table S20).
If the cell population harbored the desired edit, single cells from the population were distributed across three 96-well plates using a limited dilution. These isogenic cell lines grown in 96-well plates were harvested 10-14 days after seeding, keeping 50 % in culture. gDNA was extracted using DirectPCR lysis buffer (Viagen). Genotyping PCRs were carried out using OneTaq Quick-Load 2X MM with Standard Buffer (NEB). Amplicons were purified using the Monarch PCR & DNA Cleanup Kit (NEB), sent for Sanger sequencing, and level of editing was assessed using EditR.122 Up to three independent clones displaying similar of the desired editing levels were expanded for two separate passages and RNA for RNAseq was harvested and prepared using phenol-chloroform extractions. PE of rs3824754 displayed intermediate level of editing, therefore a second round of transfection, limited dilution, and genotyping was performed to obtain clones with editing efficiencies > 50 % (further information see below).
RNAseq HEK-293, VSMCs, CMs
We aligned reads to hg19 using Hisat2.114 We used FeatureCounts to count reads aligning to genes in GENCODE v25 (human).115 We quantified gene expression in tpm units in each sample using DESeq2.116
Quantification and statistical analysis
MPRA sequencing and data analysis
The plasmid pool as DNA input and each TagSeq replicate (CMs = 5 replicates, VSMCs = 4 replicates) was sequenced on the HiSeq 2500 platform (Illumina), single end with 50 bp. MPRA-transfected cells were harvested 48 hours post transfection and barcodes were sequenced.21,32,43
MPRA data pre-processing
First, we trimmed and quality-filtered DNA and RNA reads using cutadapt (Martin 2011). Then, we mapped reads to the barcodes and 10 upstream nucleotides of GFP requiring an exact match. We filtered for sequences that had less than 50 % of their barcodes with counts ≥ 10 in the input DNA library (n= 4587 tested variants).
MPRA activity
To quantify MPRA activities for each sequence in our pool in each cell line, we used the “quantification” mode from MPRAnalyze108, which takes barcode specific effects (or tag-sequence specific effects) into account. MPRAnalyze first quantifies each sequence’s rate of transcription or activity by comparing RNA counts for each barcode to input DNA counts (plasmid pool). Then, to identify active sequences able to drive transcription, each sequence’s activity is compared to a background distribution that is estimated using the random sequences present in the oligopool. We determined sequences to have significantly higher activity than background at MPRAnalyze q-value < 0.05.
Differential MPRA activity
We used the MPRAnalyze “comparison” mode to perform differential activity analyses. When assessing differential effects between alleles, the null hypothesis is the lack of differential transcription between the two alleles rather than lack of transcription. Therefore, we generated a null distribution of non-differential alleles by selecting a subset of sequences that had 100 barcodes each and split them between reference and alternative alleles randomly (Figure S2A). Specifically, we had 41 sequences, each with 100 barcodes (known regulatory alleles, see variant selection and MPRA design). For each of them, we randomly selected pairs of 25 barcodes and assigned them as reference or alternative. We performed this step three times. Overall, we had a background distribution of 126 comparisons. We separately tested for differential activity between reference and alternative alleles in CMs and VSMCs. We considered variants to have regulatory activity if their MPRAnalyze q value was < 0.05, and refer to them as “regulatory variants”.
Annotation of variants
eQTLs
We integrated our regulatory variants with eQTL mapping data from the latest available version of the GTEx project (signif_variant_gene_pairs files downloaded from GTEx portal).44 We overlapped our confident set of regulatory variants identified in CMs and VSMCs with eQTL data from the most closely related tissues, i.e. Heart Atrial Appendage, Heart Left Ventricle, and Artery Coronary, Artery Tibial, and Artery Aorta, respectively. We additionally overlapped our confident set of regulatory variants identified in CMs and VSMCs with eQTL data from other BP-related systems, i.e. vascular, renal, neural, and endocrine systems.
RepeatMasker
We overlapped genomic coordinates of repetitive sequences from RepeatMasker (Smit, AFA, Hubley, R & Green, P., RepeatMasker Open-4.0. 2013-2015 <http://www.repeatmasker.org>) with our set of tested variants using bedtools.109 Enrichment of specific repeated families were calculated using a Pearson's Chi-squared test in R. p values were adjusted by the Benjamini-Hochberg method.
Genomic location
We queried our tested variants in the Ensembl Variant Effect Predictor tool,110 to get their effect and genomic location. To evaluate the enrichment of genomic locations we compared the annotation of our variants with the genomic location of a randomly selected set of 5000 variants from the 1000G project.129 The enrichment test was done using a Pearson's Chi-squared test in R. We adjusted p values by the Benjamini-Hochberg method.
Variant density calculations
We grouped variants by GWAS variants and we calculated the density of variants per LD-block as follows. We retrieved the genomic coordinates from the first and last variants per LD-block and calculated the length of the block in MegaBases. Finally, we calculated the density of variants as the number of LD variants per Megabase (number of variants in LD / length of the block in megabases). Ratios of active/regulatory variants were calculated as the ratio between the number of regulatory variants in a locus and the density of variants in the region (number of regulatory variants in LD / density of variants in the region).
Conservation scores
We overlapped the genomic coordinates of our set of sequences (using a window of ±10 bp surrounding the variant and specifically excluding the variant position for this analysis) with pre-computed conservation scores from PhyloP,111 and PhastCons130 using bedtools.109 Phastcons scores higher > 0.8 were used to define ultraconserved regions of the genome. To get the per-base conservation score of the window we used pre-computed PhyloP scores. We calculated differences in distributions of scores using a two-sided Mann-Whitney test in R.
Colocalization analysis
To perform a colocalization analysis between the tested GWAS loci and eQTLs, we used GTEx v7 data from cardiovascular-related tissues (arteries and heart, n=5 tissues).44 In v7 data all tested variant-gene pairs are needed and freely available. We used a modified version of the ColocQuial pipeline45 to parallelize the colocalization analyses on a SLURM supercomputer. Briefly, for each GWAS locus - eGene -tissue pairs, we executed the COLOC package27 to perform the colocalization analysis between both association signals. We considered colocalizations for which PP4 conditioned (calculated as PP4/(PP3+PP4) where PP indicates a posterior probability within the coloc framework) was higher than 0.8.
Transcription factor motif analysis
Mapping TF motifs
We downloaded a curated list of human TF detailed by Lambert et al.131 Then, we used the CisBP PWM designated by the same authors to be the “best” motifs for each one of these annotated TFs. A total of 1104 different TFs with 1360 motifs were finally used. We used the FIMO software from the MEME suite with default parameters to map TF motifs to our reference and alternative sequences.112
Associating MPRA activity variance to motifs
To find motifs predictive of MPRA activity we followed the rationale from our previous study.43 Briefly, for each motif we fit a linear model to normalized MPRA activity (Box-Cox transformed) across all tested sequences including CG and CpG content as covariates.
We then calculated whether the model including the presence of the motif explained significantly more variance than the reduced model only contemplating GC and CpG content using a likelihood ratio test. We considered a motif to be significantly explaining MPRA activity variance if the adjusted p-value was < 0.05 (BH adjusted, Benjamini-Hochberg). We used the Python statsmodels package to run these analyses.
Finding disrupted/enriched motifs
We selected a set of 87 TF motifs that showed significant association with MPRA activity variance in our study. We calculated the number of shared and disrupted motifs and TFs between reference and alternative alleles from each variant and we compared between active, regulatory, and repetitive variants using a two-sided Mann-Whitney test. We calculated the enrichment of individual motifs by comparing the number of active/regulatory/repetitive sequences containing the motif versus the rest of the pool by an hypergeometric test. We considered individual motifs as enriched if the BH adjusted p value was < 0.05. We used the Python statsmodels package to run these analyses.
EpiMap analysis
We used the epigenomic maps of H9 ESC-derived smooth muscle cells (BSS01612), brain VSMCs (BSS01606), coronary artery1 (BSS00242), coronary artery2 (BSS00243), RUES-derived cardiac muscle cells (BSS00171), and cardiac myocytes (BSS00170) from EpiMap.42 We intersected genomic coordinates of our list of variants with DNase hypersensitive sites (DHS) and chromatin annotations from the mentioned closely-related tissues using bedtools.109 We calculated the enrichment of specific chromatin annotations using a Pearson's Chi-squared test in R. We adjusted p values by the Benjamini-Hochberg method. We performed comparisons between distributions of activities/fold-changes between groups using a two-sided Mann-Whitney test in R. These comparisons are considered to be independent because they come from different tissues.132 Therefore, multiple-testing correction was not applied.
Enrichment analysis
Functional enrichment of genes was accomplished with Metascape using default settings.117 To correct for a possible bias in the enrichment analyses of TFs, we additionally performed the enrichment tests using WebGestalt, an online tool that allows to use a user-defined background.118 We used as background for the enrichment analyses of TFs the set of TFs tested on the linear model (n=1104 TFs).
ChIPseq analysis
We predicted TFs bound to our tested genomic loci using the ChIP-seq Atlas Database.54 We downloaded TF ChIP assays of cardiovascular cell types from the ChIP-seq Atlas Peak Browser and intersected them with the genomic location of our tested variants using bedtools.109 We also downloaded TF ChIP assays of the kidney and the neuronal system from the ChIP-seq Atlas Peak Browser and intersected them with the genomic location of our tested variants.
Hi-C and Omni-C data analysis
Hi-C and OmniC reads were mapped to the GRCh38 version 32 human reference genome using bwa (version 0.7.17, -5SP).133 Mapping statistics were determined using samtools (version 1.5, view -bh -o).119 Filtering for valid Hi-C and Omni-C alignments was performed using pairtools (version 0.3.0, parse, sort, dedup mark-dups, select ‘(pair_type == "UU") or (pair_type == "UR") or (pair_type == "RU")’) (https://github.com/open2c/pairtools), and indexing of the resulting pairs was done with pairx (version 0.3.7) (https://github.com/4dn-dcic/pairix). Omni-C biological replicates showed high reproducibility in a Pearson’s correlation (normalized cooler output), done in R. For downstream analyses, sequences obtained from replicates of MSC and VSMC samples were pooled separately (pairtools merge (GitHub)) and balanced (cooler balance120) to serve as a combined dataset per cell type. The Hi-C matrix aggregation at 50 kb bins for all data sets and out-of-core matrix balancing were accomplished using cooler (version 0.8.11, cload pairix, balance).120 We modeled the overall Hi-C intra-chromosomal interactions using a modified LOESS method with a span (alpha) that is inversely proportional to the number of interactions per chromosome (alpha = 200/number of interactions per chromosome).134 LOESS calculates the weighted-average and weighted-standard deviation for every genomic distance separating interacting regions per chromosome, and therefore normalizes for genomic distance signal bias. The Hi-C/Omni-C signals were then transformed into a z-score by calculating the (obs-exp/stdev) as described here.134 Z-scores indicate more frequent contacts than expected for loci separated by corresponding genomic distance when positive, or less interactions when negative.134 The interaction frequency of Hi-C data follows a normal distribution. Thus, z-scores follow standard normal distribution and we extracted p-values from the cumulative normal distribution function for each z-score. We performed gene set enrichments for target genes that map within the 50 kb interacting bin. Cutoffs with p-values for enrichments are denoted in the text and in the figure legends.
Regulatory variant interaction analysis
All intra-chromosomal interactions that contained at least one regulatory variant (see deposited data at EGA) were selected for the remainder of the analysis. The following cell types were used to determine cis-chromosomal interactions containing the regulatory variants of CMs: H9hESC, mesoderm cell, cardiac mesoderm, cardiac progenitor, primitive cardiomyocyte, and ventricular cardiomyocyte,76 and in MSCs and VSMCs by Omni-C (Dovetail Genomics). Lists with these interactions and the reciprocal interactions have been deposited at EGA.
Arch plot interactions
Intra-chromosomal interactions were filtered for those interacting with bins containing regulatory variants. To determine genomic contacts between a locus with a CRISPR-prime-edited variant and target genes, we considered 90 % confidence interval and p-values <0.1 as significant. The Sushi package (version 1.32.0) in R (version 4.0.2) was used to visualize interactions.
Regulatory:non-regulatory variants ratio analysis
Due to the resolution of Hi-C/Omni-C analysis, the selected 50 kb bins often contained both regulatory and non-regulatory variants. To determine differences in intra-chromosomal interaction properties between 50 kb bins with higher proportions of regulatory variants than non-regulatory variants, we calculated ratios of the number of regulatory variants to the number of non-regulatory variants for each bin in CMs and VSMCs. The total number of interactions was summed for each 50 kb bin in the genome per cell type by counting the total number of intra-chromosomal interactions involving that genomic bin. The mean positive and negative z-score was calculated for each 50 kb bin in the genome per cell type by averaging the positive and negative z-score values for all intra-chromosomal interactions involving that genomic bin. A Pearson correlation was performed in R (version 4.0.2) to examine the correlation between the number of regulatory variants:number of non-regulatory variants ratio and the number of intra-chromosomal interactions.
Permutation analysis
Intra-chromosomal interactions (p-value ≤ 0.05) were chosen from across the genome (per cell type) with the same number of bins as the chromosomal interactions containing bins with either regulatory or non-regulatory variants. A total of 1000 random chromosomal interaction sets were chosen. The mean number of interactions was summed for each 50 kb bin (intra-chromosomal) in the genome per cell type by counting the total number of chromosomal interactions involving that genomic bin and then averaging the values for all bins for each permuted set of chromosomal interactions. A p-value was calculated to compare interactions of bins with either regulatory or non-regulatory variants to the 1000 sets of random chromosomal interactions based on the following: [p-value = (# of permutations with value ≥ test interaction set value)/1001], where the test interaction set is chromosomal interactions involving regulatory and non-regulatory variants and the value is the mean total number of cis-chromosomal interactions per bin. Since regulatory variants are often in CREs and CpG islands, we did not control for these elements during randomization to avoid confounding the analysis.
Heuristic scoring
We developed a heuristic scoring system to rank regulatory variants in each cell-type using publicly available genomic data combined with our MPRA results. The scoring ranged from 1 to 10 based on the supporting evidence for each regulatory variant. One point was added to the score for each of the following assumptions: being located in open-chromatin (DHS, promoter or enhancer); being the sentinel (lead) variant in the GWAS study; being best regulatory variant in the LD - block (lowest FDR); being defined as an eQTL in a cardiovascular-related tissue (GTEx); predicted to disrupt a TFBS; being active in one (1 Point) or both cell types (2 Points, see MPRA methods); being regulatory in one (1 Point) or both cell types (2 Points, see MPRA methods); being located in an ultraconserved element (defined by Phastcons).
CRISPR prime editing gene expression analysis
After read trimming using trim galore, we aligned rRNA sequencing reads to hg38 using Hisat2,114 and we used FeatureCounts to count reads aligning to genes in GENCODE v26 (human).115 Genes with fewer than 0.5 CPMs (∼10-15 raw counts) were filtered out. We normalized gene expression values using the median of ratios normalization method in DESeq2.116 Briefly, DESeq2 normalization re-scales samples relative to sequencing depth and RNA composition. In order to find genes affected in a dose-dependent manner by each variant, we performed a correlation analysis for each variant separately. First, we computed the Pearson correlation rho between expression of genes +/-500kb from the edited variant and the variant allelic ratios. To assess whether observed correlations are significant, we computed a null distribution using rho correlation values for all expressed genes in the experiment (excluding those tested). Empirical p-values were calculated as follows:
p-value = (nº genes with rho > tested gene’s rho)/(total nº expressed genes)
Finally, we adjusted p values by the Benjamini-Hochberg method. We considered individual genes as correlated if the BH adjusted p value was < 0.05.
Statistical analysis
All statistical tests were two-sided, unless stated otherwise. If multiple tests were carried out on the same data, p-values were corrected for multiple testing by Bonferroni correction or as stated in the Results. For statistical analysis, we used R version 4.1.2, Python version 3.8.10, and GraphPad Prism version 9.3.0.
Acknowledgments
We thank the Melé and Maass labs for intellectual input, Dr. Steven Erwood from Dr. Ronald Cohn’s lab for guidance in applying CRISPR prime editing, The Centre for Applied Genomics, The Structural & Biophysical Core Facility, and The Imaging Facility, The Hospital for Sick Children, Toronto, Canada, for assistance with high-throughput sequencing, luminescence detection, and imaging. We thank Dovetail Genomics, LLC, 100 Enterprise Way, Suite A101, Scotts Valley, CA 95066, USA, for generating Omni-C libraries and for the collaborative support throughout the project. W.O. was supported by a Fundació la Marató grant (ref. 321/C/2019), K.K. was supported by an OGS fellowship, J.W.L.B. was supported by a CGS-D fellowship, and D.F.L. was supported by an Ontario Genomics-CANSSI Ontario Postdoctoral Fellowship in Genome Data Science. This project was supported by Canada’s New Frontiers in Research Fund (NFRFE-2018-01305), the Canadian Institutes of Health Research (CIHR PJT 173542 [P.G.M.] and PJT 175034 [S.M., J.E.]), CIHR ENP 161429 under the frame of ERA PerMed (S.M.), the Ted Rogers Centre for Heart Research (S.M., J.E.), and the Heart and Stroke Foundation of Canada. J.E. holds a Canada Research Chair Tier 1 in Stem Cell Models of Childhood Disease, S.M. holds the Heart and Stroke Foundation of Canada & Robert M. Freedom Chair in Cardiovascular Science, M. Melé was supported by a Ramon y Cajal fellowship (RYC-2017-22249), and P.G.M. holds a Canada Research Chair Tier 2 in Non-coding Disease Mechanisms.
Author contributions
Conceptualization and funding acquisition, P.G.M.; methodology and formal analysis, W.O., K.D., M. Melé, and P.G.M.; software, W.O. and K.M.; investigation, W.O., K.D., K.K., D.F.L., M. Mokhtaridoost, A.S., B.J.M., J.W.L.B., and G.M.; resources, S.M. and J.E.; validation, K.D. and B.J.M.; writing – review & editing, W.O., P.G.M., and M. Melé; supervision, P.G.M. and M. Melé.
Declaration of interests
The authors declare no competing financial interests.
Inclusion and diversity
We support inclusive, diverse, and equitable conduct of research.
Published: May 24, 2023
Footnotes
Supplemental information can be found online at https://doi.org/10.1016/j.xgen.2023.100330.
Contributor Information
Marta Melé, Email: marta.mele@bsc.es.
Philipp G. Maass, Email: Philipp.maass@sickkids.ca.
Supplemental information
Data and code availability
-
•
Sequencing data are deposited in the European Genome-Phenome Archive (EGA). Accession numbers are listed in the key resources table.
-
•
Computational MPRA analysis is available at https://github.com/Mele-Lab.
-
•
Further custom code to reanalyze the data reported in this project is available from the corresponding authors on reasonable request.
References
- 1.GBD 2017 Risk Factor Collaborators Global, regional, and national comparative risk assessment of 84 behavioural, environmental and occupational, and metabolic risks or clusters of risks for 195 countries and territories, 1990-2017: a systematic analysis for the Global Burden of Disease Study 2017. Lancet. 2018;392:1923–1994. doi: 10.1016/S0140-6736(18)32225-6. [DOI] [PMC free article] [PubMed] [Google Scholar]
- 2.Giri A., Hellwege J.N., Keaton J.M., Park J., Qiu C., Warren H.R., Torstenson E.S., Kovesdy C.P., Sun Y.V., Wilson O.D., et al. Trans-ethnic association study of blood pressure determinants in over 750,000 individuals. Nat. Genet. 2019;51:51–62. doi: 10.1038/s41588-018-0303-9. [DOI] [PMC free article] [PubMed] [Google Scholar]
- 3.Evangelou E., Warren H.R., Mosen-Ansorena D., Mifsud B., Pazoki R., Gao H., Ntritsos G., Dimou N., Cabrera C.P., Karaman I., et al. Genetic analysis of over 1 million people identifies 535 new loci associated with blood pressure traits. Nat. Genet. 2018;50:1412–1425. doi: 10.1038/s41588-018-0205-x. [DOI] [PMC free article] [PubMed] [Google Scholar]
- 4.Kato N., Loh M., Takeuchi F., Verweij N., Wang X., Zhang W., Kelly T.N., Saleheen D., Lehne B., Leach I.M., et al. Trans-ancestry genome-wide association study identifies 12 genetic loci influencing blood pressure and implicates a role for DNA methylation. Nat. Genet. 2015;47:1282–1293. doi: 10.1038/ng.3405. [DOI] [PMC free article] [PubMed] [Google Scholar]
- 5.Warren H.R., Evangelou E., Cabrera C.P., Gao H., Ren M., Mifsud B., Ntalla I., Surendran P., Liu C., Cook J.P., et al. Genome-wide association analysis identifies novel blood pressure loci and offers biological insights into cardiovascular risk. Nat. Genet. 2017;49:403–415. doi: 10.1038/ng.3768. [DOI] [PMC free article] [PubMed] [Google Scholar]
- 6.Wain L.V., Vaez A., Jansen R., Joehanes R., van der Most P.J., Erzurumluoglu A.M., O'Reilly P.F., Cabrera C.P., Warren H.R., Rose L.M., et al. Novel blood pressure locus and gene discovery using genome-wide association study and expression data sets from blood and the kidney. Hypertension. 2017;70:e4–e19. doi: 10.1161/HYPERTENSIONAHA.117.09438. [DOI] [PMC free article] [PubMed] [Google Scholar]
- 7.Ehret G.B., Ferreira T., Chasman D.I., Jackson A.U., Schmidt E.M., Johnson T., Thorleifsson G., Luan J., Donnelly L.A., Kanoni S., et al. The genetics of blood pressure regulation and its target organs from association studies in 342,415 individuals. Nat. Genet. 2016;48:1171–1184. doi: 10.1038/ng.3667. [DOI] [PMC free article] [PubMed] [Google Scholar]
- 8.Bi W., Fritsche L.G., Mukherjee B., Kim S., Lee S. A fast and accurate method for genome-wide time-to-event data analysis and its application to UK biobank. Am. J. Hum. Genet. 2020;107:222–233. doi: 10.1016/j.ajhg.2020.06.003. [DOI] [PMC free article] [PubMed] [Google Scholar]
- 9.Takeuchi F., Akiyama M., Matoba N., Katsuya T., Nakatochi M., Tabara Y., Narita A., Saw W.Y., Moon S., Spracklen C.N., et al. Interethnic analyses of blood pressure loci in populations of East Asian and European descent. Nat. Commun. 2018;9:5052. doi: 10.1038/s41467-018-07345-0. [DOI] [PMC free article] [PubMed] [Google Scholar]
- 10.Hoffmann T.J., Ehret G.B., Nandakumar P., Ranatunga D., Schaefer C., Kwok P.Y., Iribarren C., Chakravarti A., Risch N. Genome-wide association analyses using electronic health records identify new loci influencing blood pressure variation. Nat. Genet. 2017;49:54–64. doi: 10.1038/ng.3715. [DOI] [PMC free article] [PubMed] [Google Scholar]
- 11.Liu C., Kraja A.T., Smith J.A., Brody J.A., Franceschini N., Bis J.C., Rice K., Morrison A.C., Lu Y., Weiss S., et al. Meta-analysis identifies common and rare variants influencing blood pressure and overlapping with metabolic trait loci. Nat. Genet. 2016;48:1162–1170. doi: 10.1038/ng.3660. [DOI] [PMC free article] [PubMed] [Google Scholar]
- 12.Levy D., Ehret G.B., Rice K., Verwoert G.C., Launer L.J., Dehghan A., Glazer N.L., Morrison A.C., Johnson A.D., Aspelund T., et al. Genome-wide association study of blood pressure and hypertension. Nat. Genet. 2009;41:677–687. doi: 10.1038/ng.384. [DOI] [PMC free article] [PubMed] [Google Scholar]
- 13.Wain L.V., Verwoert G.C., O'Reilly P.F., Shi G., Johnson T., Johnson A.D., Bochud M., Rice K.M., Henneman P., Smith A.V., et al. Genome-wide association study identifies six new loci influencing pulse pressure and mean arterial pressure. Nat. Genet. 2011;43:1005–1011. doi: 10.1038/ng.922. [DOI] [PMC free article] [PubMed] [Google Scholar]
- 14.Kato N., Takeuchi F., Tabara Y., Kelly T.N., Go M.J., Sim X., Tay W.T., Chen C.H., Zhang Y., Yamamoto K., et al. Meta-analysis of genome-wide association studies identifies common variants associated with blood pressure variation in east Asians. Nat. Genet. 2011;43:531–538. doi: 10.1038/ng.834. [DOI] [PMC free article] [PubMed] [Google Scholar]
- 15.Padmanabhan S., Dominiczak A.F. Genomics of hypertension: the road to precision medicine. Nat. Rev. Cardiol. 2021;18:235–250. doi: 10.1038/s41569-020-00466-4. [DOI] [PubMed] [Google Scholar]
- 16.Maurano M.T., Humbert R., Rynes E., Thurman R.E., Haugen E., Wang H., Reynolds A.P., Sandstrom R., Qu H., Brody J., et al. Systematic localization of common disease-associated variation in regulatory DNA. Science. 2012;337:1190–1195. doi: 10.1126/science.1222794. [DOI] [PMC free article] [PubMed] [Google Scholar]
- 17.Buniello A., MacArthur J.A.L., Cerezo M., Harris L.W., Hayhurst J., Malangone C., McMahon A., Morales J., Mountjoy E., Sollis E., et al. The NHGRI-EBI GWAS Catalog of published genome-wide association studies, targeted arrays and summary statistics 2019. Nucleic Acids Res. 2019;47:D1005–D1012. doi: 10.1093/nar/gky1120. [DOI] [PMC free article] [PubMed] [Google Scholar]
- 18.Ward L.D., Kellis M. Interpreting noncoding genetic variation in complex traits and human disease. Nat. Biotechnol. 2012;30:1095–1106. doi: 10.1038/nbt.2422. [DOI] [PMC free article] [PubMed] [Google Scholar]
- 19.Sun H., Yu G. New insights into the pathogenicity of non-synonymous variants through multi-level analysis. Sci. Rep. 2019;9:1667. doi: 10.1038/s41598-018-38189-9. [DOI] [PMC free article] [PubMed] [Google Scholar]
- 20.Gallagher M.D., Chen-Plotkin A.S. The post-GWAS era: from association to function. Am. J. Hum. Genet. 2018;102:717–730. doi: 10.1016/j.ajhg.2018.04.002. [DOI] [PMC free article] [PubMed] [Google Scholar]
- 21.Mattioli K., Volders P.J., Gerhardinger C., Lee J.C., Maass P.G., Melé M., Rinn J.L. High-throughput functional analysis of lncRNA core promoters elucidates rules governing tissue specificity. Genome Res. 2019;29:344–355. doi: 10.1101/gr.242222.118. [DOI] [PMC free article] [PubMed] [Google Scholar]
- 22.Bourges C., Groff A.F., Burren O.S., Gerhardinger C., Mattioli K., Hutchinson A., Hu T., Anand T., Epping M.W., Wallace C., et al. Resolving mechanisms of immune-mediated disease in primary CD4 T cells. EMBO Mol. Med. 2020;12:e12112. doi: 10.15252/emmm.202012112. [DOI] [PMC free article] [PubMed] [Google Scholar]
- 23.Liu L., Sanderford M.D., Patel R., Chandrashekar P., Gibson G., Kumar S. Biological relevance of computationally predicted pathogenicity of noncoding variants. Nat. Commun. 2019;10:330. doi: 10.1038/s41467-018-08270-y. [DOI] [PMC free article] [PubMed] [Google Scholar]
- 24.Onengut-Gumuscu S., Chen W.M., Burren O., Cooper N.J., Quinlan A.R., Mychaleckyj J.C., Farber E., Bonnie J.K., Szpak M., Schofield E., et al. Fine mapping of type 1 diabetes susceptibility loci and evidence for colocalization of causal variants with lymphoid gene enhancers. Nat. Genet. 2015;47:381–386. doi: 10.1038/ng.3245. [DOI] [PMC free article] [PubMed] [Google Scholar]
- 25.Schaid D.J., Chen W., Larson N.B. From genome-wide associations to candidate causal variants by statistical fine-mapping. Nat. Rev. Genet. 2018;19:491–504. doi: 10.1038/s41576-018-0016-z. [DOI] [PMC free article] [PubMed] [Google Scholar]
- 26.LaPierre N., Taraszka K., Huang H., He R., Hormozdiari F., Eskin E. Identifying causal variants by fine mapping across multiple studies. PLoS Genet. 2021;17:e1009733. doi: 10.1371/journal.pgen.1009733. [DOI] [PMC free article] [PubMed] [Google Scholar]
- 27.Giambartolomei C., Vukcevic D., Schadt E.E., Franke L., Hingorani A.D., Wallace C., Plagnol V. Bayesian test for colocalisation between pairs of genetic association studies using summary statistics. PLoS Genet. 2014;10:e1004383. doi: 10.1371/journal.pgen.1004383. [DOI] [PMC free article] [PubMed] [Google Scholar]
- 28.Abell N.S., DeGorter M.K., Gloudemans M.J., Greenwald E., Smith K.S., He Z., Montgomery S.B. Multiple causal variants underlie genetic associations in humans. Science. 2022;375:1247–1254. doi: 10.1126/science.abj5117. [DOI] [PMC free article] [PubMed] [Google Scholar]
- 29.Cooper Y.A., Teyssier N., Dräger N.M., Guo Q., Davis J.E., Sattler S.M., Yang Z., Patel A., Wu S., Kosuri S., et al. Functional regulatory variants implicate distinct transcriptional networks in dementia. Science. 2022;377:eabi8654. doi: 10.1126/science.abi8654. [DOI] [PubMed] [Google Scholar]
- 30.Claussnitzer M., Cho J.H., Collins R., Cox N.J., Dermitzakis E.T., Hurles M.E., Kathiresan S., Kenny E.E., Lindgren C.M., MacArthur D.G., et al. A brief history of human disease genetics. Nature. 2020;577:179–189. doi: 10.1038/s41586-019-1879-7. [DOI] [PMC free article] [PubMed] [Google Scholar]
- 31.Tewhey R., Kotliar D., Park D.S., Liu B., Winnicki S., Reilly S.K., Andersen K.G., Mikkelsen T.S., Lander E.S., Schaffner S.F., Sabeti P.C. Direct identification of hundreds of expression-modulating variants using a multiplexed reporter assay. Cell. 2016;165:1519–1529. doi: 10.1016/j.cell.2016.04.027. [DOI] [PMC free article] [PubMed] [Google Scholar]
- 32.Melnikov A., Murugan A., Zhang X., Tesileanu T., Wang L., Rogov P., Feizi S., Gnirke A., Callan C.G., Jr., Kinney J.B., et al. Systematic dissection and optimization of inducible enhancers in human cells using a massively parallel reporter assay. Nat. Biotechnol. 2012;30:271–277. doi: 10.1038/nbt.2137. [DOI] [PMC free article] [PubMed] [Google Scholar]
- 33.Ulirsch J.C., Nandakumar S.K., Wang L., Giani F.C., Zhang X., Rogov P., Melnikov A., McDonel P., Do R., Mikkelsen T.S., Sankaran V.G. Systematic functional dissection of common genetic variation affecting red blood cell traits. Cell. 2016;165:1530–1545. doi: 10.1016/j.cell.2016.04.048. [DOI] [PMC free article] [PubMed] [Google Scholar]
- 34.Selvarajan I., Toropainen A., Garske K.M., López Rodríguez M., Ko A., Miao Z., Kaminska D., Õunap K., Örd T., Ravindran A., et al. Integrative analysis of liver-specific non-coding regulatory SNPs associated with the risk of coronary artery disease. Am. J. Hum. Genet. 2021;108:411–430. doi: 10.1016/j.ajhg.2021.02.006. [DOI] [PMC free article] [PubMed] [Google Scholar]
- 35.Surendran P., Drenos F., Young R., Warren H., Cook J.P., Manning A.K., Grarup N., Sim X., Barnes D.R., Witkowska K., et al. Trans-ancestry meta-analyses identify rare and common variants associated with blood pressure and hypertension. Nat. Genet. 2016;48:1151–1161. doi: 10.1038/ng.3654. [DOI] [PMC free article] [PubMed] [Google Scholar]
- 36.Barrett J.C., Fry B., Maller J., Daly M.J. Haploview: analysis and visualization of LD and haplotype maps. Bioinformatics. 2005;21:263–265. doi: 10.1093/bioinformatics/bth457. [DOI] [PubMed] [Google Scholar]
- 37.Yu G., Wang L.G., He Q.Y. ChIPseeker: an R/Bioconductor package for ChIP peak annotation, comparison and visualization. Bioinformatics. 2015;31:2382–2383. doi: 10.1093/bioinformatics/btv145. [DOI] [PubMed] [Google Scholar]
- 38.Touyz R.M., Alves-Lopes R., Rios F.J., Camargo L.L., Anagnostopoulou A., Arner A., Montezano A.C. Vascular smooth muscle contraction in hypertension. Cardiovasc. Res. 2018;114:529–539. doi: 10.1093/cvr/cvy023. [DOI] [PMC free article] [PubMed] [Google Scholar]
- 39.González A., Ravassa S., López B., Moreno M.U., Beaumont J., San José G., Querejeta R., Bayés-Genís A., Díez J. Myocardial remodeling in hypertension. Hypertension. 2018;72:549–558. doi: 10.1161/HYPERTENSIONAHA.118.11125. [DOI] [PubMed] [Google Scholar]
- 40.Lesurf R., Said A., Akinrinade O., Breckpot J., Delfosse K., Liu T., Yao R., Persad G., McKenna F., Noche R.R., et al. Whole genome sequencing delineates regulatory, copy number, and cryptic splice variants in early onset cardiomyopathy. NPJ Genom. Med. 2022;7:18. doi: 10.1038/s41525-022-00288-y. [DOI] [PMC free article] [PubMed] [Google Scholar]
- 41.Hansen T.J., Hodges E. ATAC-STARR-seq reveals transcription factor-bound activators and silencers across the chromatin accessible human genome. Genome Res. 2022;32:1529–1541. doi: 10.1101/gr.276766.122. [DOI] [PMC free article] [PubMed] [Google Scholar]
- 42.Boix C.A., James B.T., Park Y.P., Meuleman W., Kellis M. Regulatory genomic circuitry of human disease loci by integrative epigenomics. Nature. 2021;590:300–307. doi: 10.1038/s41586-020-03145-z. [DOI] [PMC free article] [PubMed] [Google Scholar]
- 43.Mattioli K., Oliveros W., Gerhardinger C., Andergassen D., Maass P.G., Rinn J.L., Melé M. Cis and trans effects differentially contribute to the evolution of promoters and enhancers. Genome Biol. 2020;21:210. doi: 10.1186/s13059-020-02110-3. [DOI] [PMC free article] [PubMed] [Google Scholar]
- 44.GTEx Consortium The GTEx Consortium atlas of genetic regulatory effects across human tissues. Science. 2020;369:1318–1330. doi: 10.1126/science.aaz1776. [DOI] [PMC free article] [PubMed] [Google Scholar]
- 45.Chen B.Y., Bone W.P., Lorenz K., Levin M., Ritchie M.D., Voight B.F. ColocQuiaL: a QTL-GWAS colocalization pipeline. Bioinformatics. 2022;38:4409–4411. doi: 10.1093/bioinformatics/btac512. [DOI] [PMC free article] [PubMed] [Google Scholar]
- 46.Hoogaars W.M.H., Barnett P., Moorman A.F.M., Christoffels V.M. T-box factors determine cardiac design. Cell. Mol. Life Sci. 2007;64:646–660. doi: 10.1007/s00018-007-6518-z. [DOI] [PMC free article] [PubMed] [Google Scholar]
- 47.McNamara P., Seo S.B., Rudic R.D., Sehgal A., Chakravarti D., FitzGerald G.A. Regulation of CLOCK and MOP4 by nuclear hormone receptors in the vasculature: a humoral mechanism to reset a peripheral clock. Cell. 2001;105:877–889. doi: 10.1016/s0092-8674(01)00401-9. [DOI] [PubMed] [Google Scholar]
- 48.van Arensbergen J., Pagie L., FitzPatrick V.D., de Haas M., Baltissen M.P., Comoglio F., van der Weide R.H., Teunissen H., Võsa U., Franke L., et al. High-throughput identification of human SNPs affecting regulatory element activity. Nat. Genet. 2019;51:1160–1169. doi: 10.1038/s41588-019-0455-2. [DOI] [PMC free article] [PubMed] [Google Scholar]
- 49.Rabkin S.W. The role of interleukin 18 in the pathogenesis of hypertension-induced vascular disease. Nat. Clin. Pract. Cardiovasc. Med. 2009;6:192–199. doi: 10.1038/ncpcardio1453. [DOI] [PubMed] [Google Scholar]
- 50.Li A., Nattie E. Orexin, cardio-respiratory function, and hypertension. Front. Neurosci. 2014;8:22. doi: 10.3389/fnins.2014.00022. [DOI] [PMC free article] [PubMed] [Google Scholar]
- 51.Dobrzycki T., Lalwani M., Telfer C., Monteiro R., Patient R. The roles and controls of GATA factors in blood and cardiac development. IUBMB Life. 2020;72:39–44. doi: 10.1002/iub.2178. [DOI] [PMC free article] [PubMed] [Google Scholar]
- 52.Medrano J.L., Naya F.J. The transcription factor MEF2A fine-tunes gene expression in the atrial and ventricular chambers of the adult heart. J. Biol. Chem. 2017;292:20975–20988. doi: 10.1074/jbc.M117.806422. [DOI] [PMC free article] [PubMed] [Google Scholar]
- 53.Chen L., Fulcoli F.G., Tang S., Baldini A. Tbx1 regulates proliferation and differentiation of multipotent heart progenitors. Circ. Res. 2009;105:842–851. doi: 10.1161/CIRCRESAHA.109.200295. [DOI] [PMC free article] [PubMed] [Google Scholar]
- 54.Zou Z., Ohta T., Miura F., Oki S. ChIP-Atlas 2021 update: a data-mining suite for exploring epigenomic landscapes by fully integrating ChIP-seq, ATAC-seq and Bisulfite-seq data. Nucleic Acids Res. 2022;50:W175–W182. doi: 10.1093/nar/gkac199. [DOI] [PMC free article] [PubMed] [Google Scholar]
- 55.Siepel A., Bejerano G., Pedersen J.S., Hinrichs A.S., Hou M., Rosenbloom K., Clawson H., Spieth J., Hillier L.W., Richards S., et al. Evolutionarily conserved elements in vertebrate, insect, worm, and yeast genomes. Genome Res. 2005;15:1034–1050. doi: 10.1101/gr.3715005. [DOI] [PMC free article] [PubMed] [Google Scholar]
- 56.Li S., Kvon E.Z., Visel A., Pennacchio L.A., Ovcharenko I. Stable enhancers are active in development, and fragile enhancers are associated with evolutionary adaptation. Genome Biol. 2019;20:140. doi: 10.1186/s13059-019-1750-z. [DOI] [PMC free article] [PubMed] [Google Scholar]
- 57.Kvon E.Z., Zhu Y., Kelman G., Novak C.S., Plajzer-Frick I., Kato M., Garvin T.H., Pham Q., Harrington A.N., Hunter R.D., et al. Comprehensive in vivo interrogation reveals phenotypic impact of human enhancer variants. Cell. 2020;180:1262–1271.e15. doi: 10.1016/j.cell.2020.02.031. [DOI] [PMC free article] [PubMed] [Google Scholar]
- 58.Gel B., Díez-Villanueva A., Serra E., Buschbeck M., Peinado M.A., Malinverni R. regioneR: an R/Bioconductor package for the association analysis of genomic regions based on permutation tests. Bioinformatics. 2016;32:289–291. doi: 10.1093/bioinformatics/btv562. [DOI] [PMC free article] [PubMed] [Google Scholar]
- 59.Urrutia R. KRAB-containing zinc-finger repressor proteins. Genome Biol. 2003;4:231. doi: 10.1186/gb-2003-4-10-231. [DOI] [PMC free article] [PubMed] [Google Scholar]
- 60.Imbeault M., Helleboid P.Y., Trono D. KRAB zinc-finger proteins contribute to the evolution of gene regulatory networks. Nature. 2017;543:550–554. doi: 10.1038/nature21683. [DOI] [PubMed] [Google Scholar]
- 61.Sahu B., Hartonen T., Pihlajamaa P., Wei B., Dave K., Zhu F., Kaasinen E., Lidschreiber K., Lidschreiber M., Daub C.O., et al. Sequence determinants of human gene regulatory elements. Nat. Genet. 2022;54:283–294. doi: 10.1038/s41588-021-01009-4. [DOI] [PMC free article] [PubMed] [Google Scholar]
- 62.Li L., Zhang Q., Lei X., Huang Y., Hu J. MAP4 as a new candidate in cardiovascular disease. Front. Physiol. 2020;11:1044. doi: 10.3389/fphys.2020.01044. [DOI] [PMC free article] [PubMed] [Google Scholar]
- 63.Kass D.A., Champion H.C., Beavo J.A. Phosphodiesterase type 5: expanding roles in cardiovascular regulation. Circ. Res. 2007;101:1084–1095. doi: 10.1161/CIRCRESAHA.107.162511. [DOI] [PubMed] [Google Scholar]
- 64.Riechert E., Kmietczyk V., Stein F., Schwarzl T., Sekaran T., Jürgensen L., Kamuf-Schenk V., Varma E., Hofmann C., Rettel M., et al. Identification of dynamic RNA-binding proteins uncovers a Cpeb4-controlled regulatory cascade during pathological cell growth of cardiomyocytes. Cell Rep. 2021;35:109100. doi: 10.1016/j.celrep.2021.109100. [DOI] [PubMed] [Google Scholar]
- 65.Vishnolia K.K., Hoene C., Tarhbalouti K., Revenstorff J., Aherrahrou Z., Erdmann J. Studies in zebrafish demonstrate that CNNM2 and NT5C2 are most likely the causal genes at the blood pressure-associated locus on human chromosome 10q24.32. Front. Cardiovasc. Med. 2020;7:135. doi: 10.3389/fcvm.2020.00135. [DOI] [PMC free article] [PubMed] [Google Scholar]
- 66.Nandakumar P., Lee D., Hoffmann T.J., Ehret G.B., Arking D., Ranatunga D., Li M., Grove M.L., Boerwinkle E., Schaefer C., et al. Analysis of putative cis-regulatory elements regulating blood pressure variation. Hum. Mol. Genet. 2020;29:1922–1932. doi: 10.1093/hmg/ddaa098. [DOI] [PMC free article] [PubMed] [Google Scholar]
- 67.Mecklenburg N., Kowalczyk I., Witte F., Görne J., Laier A., Mamo T.M., Gonschior H., Lehmann M., Richter M., Sporbert A., et al. Identification of disease-relevant modulators of the SHH pathway in the developing brain. Development. 2021;148:dev199307. doi: 10.1242/dev.199307. [DOI] [PubMed] [Google Scholar]
- 68.Prozzillo Y., Delle Monache F., Ferreri D., Cuticone S., Dimitri P., Messina G. The true story of yeti, the "abominable" heterochromatic gene of Drosophila melanogaster. Front. Physiol. 2019;10:1093. doi: 10.3389/fphys.2019.01093. [DOI] [PMC free article] [PubMed] [Google Scholar]
- 69.Aalders J., Léger L., Van der Meeren L., Van den Vreken N., Skirtach A.G., Sinha S., De Backer J., van Hengel J. Effects of fibrillin mutations on the behavior of heart muscle cells in Marfan syndrome. Sci. Rep. 2020;10:16756. doi: 10.1038/s41598-020-73802-w. [DOI] [PMC free article] [PubMed] [Google Scholar]
- 70.Manosroi W., Tan J.W., Rariy C.M., Sun B., Goodarzi M.O., Saxena A.R., Williams J.S., Pojoga L.H., Lasky-Su J., Cui J., et al. The association of estrogen receptor-beta gene variation with salt-sensitive blood pressure. J. Clin. Endocrinol. Metab. 2017;102:4124–4135. doi: 10.1210/jc.2017-00957. [DOI] [PMC free article] [PubMed] [Google Scholar]
- 71.Kragesteen B.K., Spielmann M., Paliou C., Heinrich V., Schöpflin R., Esposito A., Annunziatella C., Bianco S., Chiariello A.M., Jerković I., et al. Dynamic 3D chromatin architecture contributes to enhancer specificity and limb morphogenesis. Nat. Genet. 2018;50:1463–1473. doi: 10.1038/s41588-018-0221-x. [DOI] [PMC free article] [PubMed] [Google Scholar]
- 72.Bertero A., Fields P.A., Ramani V., Bonora G., Yardimci G.G., Reinecke H., Pabon L., Noble W.S., Shendure J., Murry C.E. Dynamics of genome reorganization during human cardiogenesis reveal an RBM20-dependent splicing factory. Nat. Commun. 2019;10:1538. doi: 10.1038/s41467-019-09483-5. [DOI] [PMC free article] [PubMed] [Google Scholar]
- 73.Gorkin D.U., Leung D., Ren B. The 3D genome in transcriptional regulation and pluripotency. Cell Stem Cell. 2014;14:762–775. doi: 10.1016/j.stem.2014.05.017. [DOI] [PMC free article] [PubMed] [Google Scholar]
- 74.Schoenfelder S., Sexton T., Chakalova L., Cope N.F., Horton A., Andrews S., Kurukuti S., Mitchell J.A., Umlauf D., Dimitrova D.S., et al. Preferential associations between co-regulated genes reveal a transcriptional interactome in erythroid cells. Nat. Genet. 2010;42:53–61. doi: 10.1038/ng.496. [DOI] [PMC free article] [PubMed] [Google Scholar]
- 75.Osborne C.S., Chakalova L., Brown K.E., Carter D., Horton A., Debrand E., Goyenechea B., Mitchell J.A., Lopes S., Reik W., Fraser P. Active genes dynamically colocalize to shared sites of ongoing transcription. Nat. Genet. 2004;36:1065–1071. doi: 10.1038/ng1423. [DOI] [PubMed] [Google Scholar]
- 76.Zhang Y., Li T., Preissl S., Amaral M.L., Grinstein J.D., Farah E.N., Destici E., Qiu Y., Hu R., Lee A.Y., et al. Transcriptionally active HERV-H retrotransposons demarcate topologically associating domains in human pluripotent stem cells. Nat. Genet. 2019;51:1380–1388. doi: 10.1038/s41588-019-0479-7. [DOI] [PMC free article] [PubMed] [Google Scholar]
- 77.Dee R.A., Mangum K.D., Bai X., Mack C.P., Taylor J.M. Druggable targets in the Rho pathway and their promise for therapeutic control of blood pressure. Pharmacol. Ther. 2019;193:121–134. doi: 10.1016/j.pharmthera.2018.09.001. [DOI] [PMC free article] [PubMed] [Google Scholar]
- 78.Zhao J., Mommersteeg M.T.M. Slit-Robo signalling in heart development. Cardiovasc. Res. 2018;114:794–804. doi: 10.1093/cvr/cvy061. [DOI] [PMC free article] [PubMed] [Google Scholar]
- 79.Ghaedian M.M., Nazari Jaz A., Momeni M., Ghaedian T., Samiei N. Plasma leptin level is positively associated with blood pressure measures independent of gender and BMI. Clin. Exp. Hypertens. 2020;42:31–35. doi: 10.1080/10641963.2018.1557684. [DOI] [PubMed] [Google Scholar]
- 80.Papathanasiou S., Rickelt S., Soriano M.E., Schips T.G., Maier H.J., Davos C.H., Varela A., Kaklamanis L., Mann D.L., Capetanaki Y. Tumor necrosis factor-alpha confers cardioprotection through ectopic expression of keratins K8 and K18. Nat. Med. 2015;21:1076–1084. doi: 10.1038/nm.3925. [DOI] [PMC free article] [PubMed] [Google Scholar]
- 81.Tsikitis M., Galata Z., Mavroidis M., Psarras S., Capetanaki Y. Intermediate filaments in cardiomyopathy. Biophys. Rev. 2018;10:1007–1031. doi: 10.1007/s12551-018-0443-2. [DOI] [PMC free article] [PubMed] [Google Scholar]
- 82.Gopaul K.P., Crook M.A. Sialic acid: a novel marker of cardiovascular disease? Clin. Biochem. 2006;39:667–681. doi: 10.1016/j.clinbiochem.2006.02.010. [DOI] [PubMed] [Google Scholar]
- 83.Peng J., Vongpatanasin W., Sacharidou A., Kifer D., Yuhanna I.S., Banerjee S., Tanigaki K., Polasek O., Chu H., Sundgren N.C., et al. Supplementation with the sialic acid precursor N-Acetyl-D-Mannosamine breaks the link between obesity and hypertension. Circulation. 2019;140:2005–2018. doi: 10.1161/CIRCULATIONAHA.119.043490. [DOI] [PMC free article] [PubMed] [Google Scholar]
- 84.Buys E., Sips P. New insights into the role of soluble guanylate cyclase in blood pressure regulation. Curr. Opin. Nephrol. Hypertens. 2014;23:135–142. doi: 10.1097/01.mnh.0000441048.91041.3a. [DOI] [PMC free article] [PubMed] [Google Scholar]
- 85.Rainer P.P., Kass D.A. Old dog, new tricks: novel cardiac targets and stress regulation by protein kinase G. Cardiovasc. Res. 2016;111:154–162. doi: 10.1093/cvr/cvw107. [DOI] [PMC free article] [PubMed] [Google Scholar]
- 86.Barbeira A.N., Dickinson S.P., Bonazzola R., Zheng J., Wheeler H.E., Torres J.M., Torstenson E.S., Shah K.P., Garcia T., Edwards T.L., et al. Exploring the phenotypic consequences of tissue specific gene expression variation inferred from GWAS summary statistics. Nat. Commun. 2018;9:1825. doi: 10.1038/s41467-018-03621-1. [DOI] [PMC free article] [PubMed] [Google Scholar]
- 87.Gamazon E.R., Wheeler H.E., Shah K.P., Mozaffari S.V., Aquino-Michaels K., Carroll R.J., Eyler A.E., Denny J.C., GTEx Consortium. Nicolae D.L., et al. A gene-based association method for mapping traits using reference transcriptome data. Nat. Genet. 2015;47:1091–1098. doi: 10.1038/ng.3367. [DOI] [PMC free article] [PubMed] [Google Scholar]
- 88.Anzalone A.V., Randolph P.B., Davis J.R., Sousa A.A., Koblan L.W., Levy J.M., Chen P.J., Wilson C., Newby G.A., Raguram A., Liu D.R. Search-and-replace genome editing without double-strand breaks or donor DNA. Nature. 2019;576:149–157. doi: 10.1038/s41586-019-1711-4. [DOI] [PMC free article] [PubMed] [Google Scholar]
- 89.Guagliardo N.A., Yao J., Hu C., Schertz E.M., Tyson D.A., Carey R.M., Bayliss D.A., Barrett P.Q. TASK-3 channel deletion in mice recapitulates low-renin essential hypertension. Hypertension. 2012;59:999–1005. doi: 10.1161/HYPERTENSIONAHA.111.189662. [DOI] [PMC free article] [PubMed] [Google Scholar]
- 90.Jung J., Barrett P.Q., Eckert G.J., Edenberg H.J., Xuei X., Tu W., Pratt J.H. Variations in the potassium channel genes KCNK3 and KCNK9 in relation to blood pressure and aldosterone production: an exploratory study. J. Clin. Endocrinol. Metab. 2012;97:E2160–E2167. doi: 10.1210/jc.2012-2196. [DOI] [PMC free article] [PubMed] [Google Scholar]
- 91.Huntley S., Baggott D.M., Hamilton A.T., Tran-Gyamfi M., Yang S., Kim J., Gordon L., Branscomb E., Stubbs L. A comprehensive catalog of human KRAB-associated zinc finger genes: insights into the evolutionary history of a large family of transcriptional repressors. Genome Res. 2006;16:669–677. doi: 10.1101/gr.4842106. [DOI] [PMC free article] [PubMed] [Google Scholar]
- 92.Chen M.H., Raffield L.M., Mousas A., Sakaue S., Huffman J.E., Moscati A., Trivedi B., Jiang T., Akbari P., Vuckovic D., et al. Trans-ethnic and ancestry-specific blood-cell genetics in 746,667 individuals from 5 global populations. Cell. 2020;182:1198–1213.e14. doi: 10.1016/j.cell.2020.06.045. [DOI] [PMC free article] [PubMed] [Google Scholar]
- 93.Vuckovic D., Bao E.L., Akbari P., Lareau C.A., Mousas A., Jiang T., Chen M.H., Raffield L.M., Tardaguila M., Huffman J.E., et al. The polygenic and monogenic basis of blood traits and diseases. Cell. 2020;182:1214–1231.e11. doi: 10.1016/j.cell.2020.08.008. [DOI] [PMC free article] [PubMed] [Google Scholar]
- 94.Li C., Kim Y.K., Dorajoo R., Li H., Lee I.T., Cheng C.Y., He M., Sheu W.H.H., Guo X., Ganesh S.K., et al. Genome-wide association study meta-analysis of long-term average blood pressure in east asians. Circ. Cardiovasc. Genet. 2017;10:e001527. doi: 10.1161/CIRCGENETICS.116.001527. [DOI] [PMC free article] [PubMed] [Google Scholar]
- 95.Pott J., Burkhardt R., Beutner F., Horn K., Teren A., Kirsten H., Holdt L.M., Schuler G., Teupser D., Loeffler M., et al. Genome-wide meta-analysis identifies novel loci of plaque burden in carotid artery. Atherosclerosis. 2017;259:32–40. doi: 10.1016/j.atherosclerosis.2017.02.018. [DOI] [PubMed] [Google Scholar]
- 96.Zdzieblo D., Li X., Lin Q., Zenke M., Illich D.J., Becker M., Müller A.M. Pcgf6, a polycomb group protein, regulates mesodermal lineage differentiation in murine ESCs and functions in iPS reprogramming. Stem Cell. 2014;32:3112–3125. doi: 10.1002/stem.1826. [DOI] [PubMed] [Google Scholar]
- 97.ENCODE Project Consortium. Moore J.E., Purcaro M.J., Pratt H.E., Epstein C.B., Shoresh N., Adrian J., Kawli T., Davis C.A., Dobin A., et al. Expanded encyclopaedias of DNA elements in the human and mouse genomes. Nature. 2020;583:699–710. doi: 10.1038/s41586-020-2493-4. [DOI] [PMC free article] [PubMed] [Google Scholar]
- 98.Altshuler D., Daly M.J., Lander E.S. Genetic mapping in human disease. Science. 2008;322:881–888. doi: 10.1126/science.1156409. [DOI] [PMC free article] [PubMed] [Google Scholar]
- 99.Claussnitzer M., Dankel S.N., Kim K.H., Quon G., Meuleman W., Haugen C., Glunk V., Sousa I.S., Beaudry J.L., Puviindran V., et al. FTO obesity variant circuitry and adipocyte browning in humans. N. Engl. J. Med. 2015;373:895–907. doi: 10.1056/NEJMoa1502214. [DOI] [PMC free article] [PubMed] [Google Scholar]
- 100.Umans B.D., Battle A., Gilad Y. Where are the disease-associated eQTLs? Trends Genet. 2021;37:109–124. doi: 10.1016/j.tig.2020.08.009. [DOI] [PMC free article] [PubMed] [Google Scholar]
- 101.Smemo S., Tena J.J., Kim K.H., Gamazon E.R., Sakabe N.J., Gómez-Marín C., Aneas I., Credidio F.L., Sobreira D.R., Wasserman N.F., et al. Obesity-associated variants within FTO form long-range functional connections with IRX3. Nature. 2014;507:371–375. doi: 10.1038/nature13138. [DOI] [PMC free article] [PubMed] [Google Scholar]
- 102.Mountjoy E., Schmidt E.M., Carmona M., Schwartzentruber J., Peat G., Miranda A., Fumis L., Hayhurst J., Buniello A., Karim M.A., et al. An open approach to systematically prioritize causal variants and genes at all published human GWAS trait-associated loci. Nat. Genet. 2021;53:1527–1533. doi: 10.1038/s41588-021-00945-5. [DOI] [PMC free article] [PubMed] [Google Scholar]
- 103.Nasser J., Bergman D.T., Fulco C.P., Guckelberger P., Doughty B.R., Patwardhan T.A., Jones T.R., Nguyen T.H., Ulirsch J.C., Lekschas F., et al. Genome-wide enhancer maps link risk variants to disease genes. Nature. 2021;593:238–243. doi: 10.1038/s41586-021-03446-x. [DOI] [PMC free article] [PubMed] [Google Scholar]
- 104.Hermant C., Torres-Padilla M.E. TFs for TEs: the transcription factor repertoire of mammalian transposable elements. Genes Dev. 2021;35:22–39. doi: 10.1101/gad.344473.120. [DOI] [PMC free article] [PubMed] [Google Scholar]
- 105.Inoue F., Kircher M., Martin B., Cooper G.M., Witten D.M., McManus M.T., Ahituv N., Shendure J. A systematic comparison reveals substantial differences in chromosomal versus episomal encoding of enhancer activity. Genome Res. 2017;27:38–52. doi: 10.1101/gr.212092.116. [DOI] [PMC free article] [PubMed] [Google Scholar]
- 106.Hildebrandt M.R., Reuter M.S., Wei W., Tayebi N., Liu J., Sharmin S., Mulder J., Lesperance L.S., Brauer P.M., Mok R.S.F., et al. Precision health resource of control iPSC lines for versatile multilineage differentiation. Stem Cell Rep. 2019;13:1126–1141. doi: 10.1016/j.stemcr.2019.11.003. [DOI] [PMC free article] [PubMed] [Google Scholar]
- 107.Erwood S., Brewer R.A., Bily T.M.I., Maino E., Zhou L., Cohn R.D., Ivakine E.A. Modeling Niemann-Pick disease type C in a human haploid cell line allows for patient variant characterization and clinical interpretation. Genome Res. 2019;29:2010–2019. doi: 10.1101/gr.250720.119. [DOI] [PMC free article] [PubMed] [Google Scholar]
- 108.Ashuach T., Fischer D.S., Kreimer A., Ahituv N., Theis F.J., Yosef N. MPRAnalyze: statistical framework for massively parallel reporter assays. Genome Biol. 2019;20:183. doi: 10.1186/s13059-019-1787-z. [DOI] [PMC free article] [PubMed] [Google Scholar]
- 109.Quinlan A.R., Hall I.M. BEDTools: a flexible suite of utilities for comparing genomic features. Bioinformatics. 2010;26:841–842. doi: 10.1093/bioinformatics/btq033. [DOI] [PMC free article] [PubMed] [Google Scholar]
- 110.McLaren W., Gil L., Hunt S.E., Riat H.S., Ritchie G.R.S., Thormann A., Flicek P., Cunningham F. The Ensembl variant effect predictor. Genome Biol. 2016;17:122. doi: 10.1186/s13059-016-0974-4. [DOI] [PMC free article] [PubMed] [Google Scholar]
- 111.Pollard K.S., Hubisz M.J., Rosenbloom K.R., Siepel A. Detection of nonneutral substitution rates on mammalian phylogenies. Genome Res. 2010;20:110–121. doi: 10.1101/gr.097857.109. [DOI] [PMC free article] [PubMed] [Google Scholar]
- 112.Bailey T.L., Johnson J., Grant C.E., Noble W.S. The MEME suite. Nucleic Acids Res. 2015;43:W39–W49. doi: 10.1093/nar/gkv416. [DOI] [PMC free article] [PubMed] [Google Scholar]
- 113.Seabold S., Josef P. Proceedings of the 9th Python in Science Conference; 2010. Statsmodels: Econometric and statistical modeling with python. [Google Scholar]
- 114.Kim D., Langmead B., Salzberg S.L. HISAT: a fast spliced aligner with low memory requirements. Nat. Methods. 2015;12:357–360. doi: 10.1038/nmeth.3317. [DOI] [PMC free article] [PubMed] [Google Scholar]
- 115.Liao Y., Smyth G.K., Shi W. featureCounts: an efficient general purpose program for assigning sequence reads to genomic features. Bioinformatics. 2014;30:923–930. doi: 10.1093/bioinformatics/btt656. [DOI] [PubMed] [Google Scholar]
- 116.Love M.I., Huber W., Anders S. Moderated estimation of fold change and dispersion for RNA-seq data with DESeq2. Genome Biol. 2014;15:550. doi: 10.1186/s13059-014-0550-8. [DOI] [PMC free article] [PubMed] [Google Scholar]
- 117.Zhou Y., Zhou B., Pache L., Chang M., Khodabakhshi A.H., Tanaseichuk O., Benner C., Chanda S.K. Metascape provides a biologist-oriented resource for the analysis of systems-level datasets. Nat. Commun. 2019;10:1523. doi: 10.1038/s41467-019-09234-6. [DOI] [PMC free article] [PubMed] [Google Scholar]
- 118.Liao Y., Wang J., Jaehnig E.J., Shi Z., Zhang B. WebGestalt 2019: gene set analysis toolkit with revamped UIs and APIs. Nucleic Acids Res. 2019;47:W199–W205. doi: 10.1093/nar/gkz401. [DOI] [PMC free article] [PubMed] [Google Scholar]
- 119.Li H., Handsaker B., Wysoker A., Fennell T., Ruan J., Homer N., Marth G., Abecasis G., Durbin R., 1000 Genome Project Data Processing Subgroup The sequence alignment/map format and SAMtools. Bioinformatics. 2009;25:2078–2079. doi: 10.1093/bioinformatics/btp352. [DOI] [PMC free article] [PubMed] [Google Scholar]
- 120.Abdennur N., Mirny L.A. Cooler: scalable storage for Hi-C data and other genomically labeled arrays. Bioinformatics. 2020;36:311–316. doi: 10.1093/bioinformatics/btz540. [DOI] [PMC free article] [PubMed] [Google Scholar]
- 121.Kim H.K., Yu G., Park J., Min S., Lee S., Yoon S., Kim H.H. Predicting the efficiency of prime editing guide RNAs in human cells. Nat. Biotechnol. 2021;39:198–206. doi: 10.1038/s41587-020-0677-y. [DOI] [PubMed] [Google Scholar]
- 122.Kluesner M.G., Nedveck D.A., Lahr W.S., Garbe J.R., Abrahante J.E., Webber B.R., Moriarity B.S. EditR: a method to quantify base editing from sanger sequencing. CRISPR J. 2018;1:239–250. doi: 10.1089/crispr.2018.0014. [DOI] [PMC free article] [PubMed] [Google Scholar]
- 123.Martin, M. (2011). Cutadapt removes adapter sequences from high-throughput sequencing reads. EMBnet.journal, [S.l.], v. 17, n. 1, pp. 10–12. 10.14806/ej.17.1.200. [DOI]
- 124.Maass P.G., Aydin A., Luft F.C., Schächterle C., Weise A., Stricker S., Lindschau C., Vaegler M., Qadri F., Toka H.R., et al. PDE3A mutations cause autosomal dominant hypertension with brachydactyly. Nat. Genet. 2015;47:647–653. doi: 10.1038/ng.3302. [DOI] [PubMed] [Google Scholar]
- 125.Gong Z., Niklason L.E. Small-diameter human vessel wall engineered from bone marrow-derived mesenchymal stem cells (hMSCs) Faseb. J. 2008;22:1635–1648. doi: 10.1096/fj.07-087924. [DOI] [PMC free article] [PubMed] [Google Scholar]
- 126.Shukla C.J., McCorkindale A.L., Gerhardinger C., Korthauer K.D., Cabili M.N., Shechner D.M., Irizarry R.A., Maass P.G., Rinn J.L. High-throughput identification of RNA nuclear enrichment sequences. EMBO J. 2018;37:e98452. doi: 10.15252/embj.201798452. [DOI] [PMC free article] [PubMed] [Google Scholar]
- 127.Patwardhan R.P., Hiatt J.B., Witten D.M., Kim M.J., Smith R.P., May D., Lee C., Andrie J.M., Lee S.I., Cooper G.M., et al. Massively parallel functional dissection of mammalian enhancers in vivo. Nat. Biotechnol. 2012;30:265–270. doi: 10.1038/nbt.2136. [DOI] [PMC free article] [PubMed] [Google Scholar]
- 128.Lieberman-Aiden E., van Berkum N.L., Williams L., Imakaev M., Ragoczy T., Telling A., Amit I., Lajoie B.R., Sabo P.J., Dorschner M.O., et al. Comprehensive mapping of long-range interactions reveals folding principles of the human genome. Science. 2009;326:289–293. doi: 10.1126/science.1181369. [DOI] [PMC free article] [PubMed] [Google Scholar]
- 129.Clarke L., Fairley S., Zheng-Bradley X., Streeter I., Perry E., Lowy E., Tassé A.M., Flicek P. The international Genome sample resource (IGSR): a worldwide collection of genome variation incorporating the 1000 Genomes Project data. Nucleic Acids Res. 2017;45:D854–D859. doi: 10.1093/nar/gkw829. [DOI] [PMC free article] [PubMed] [Google Scholar]
- 130.Puigdevall P., Castelo R. GenomicScores: seamless access to genomewide position-specific scores from R and Bioconductor. Bioinformatics. 2018;34:3208–3210. doi: 10.1093/bioinformatics/bty311. [DOI] [PubMed] [Google Scholar]
- 131.Lambert S.A., Jolma A., Campitelli L.F., Das P.K., Yin Y., Albu M., Chen X., Taipale J., Hughes T.R., Weirauch M.T. The human transcription factors. Cell. 2018;172:650–665. doi: 10.1016/j.cell.2018.01.029. [DOI] [PubMed] [Google Scholar]
- 132.Miller R.G. Springer-Verlag; 1981. Simultaneous Statistical Inference. [DOI] [Google Scholar]
- 133.Li H., Durbin R. Fast and accurate short read alignment with Burrows-Wheeler transform. Bioinformatics. 2009;25:1754–1760. doi: 10.1093/bioinformatics/btp324. [DOI] [PMC free article] [PubMed] [Google Scholar]
- 134.Sanyal A., Lajoie B.R., Jain G., Dekker J. The long-range interaction landscape of gene promoters. Nature. 2012;489:109–113. doi: 10.1038/nature11279. [DOI] [PMC free article] [PubMed] [Google Scholar]
Associated Data
This section collects any data citations, data availability statements, or supplementary materials included in this article.
Supplementary Materials
Data Availability Statement
-
•
Sequencing data are deposited in the European Genome-Phenome Archive (EGA). Accession numbers are listed in the key resources table.
-
•
Computational MPRA analysis is available at https://github.com/Mele-Lab.
-
•
Further custom code to reanalyze the data reported in this project is available from the corresponding authors on reasonable request.