

Summary
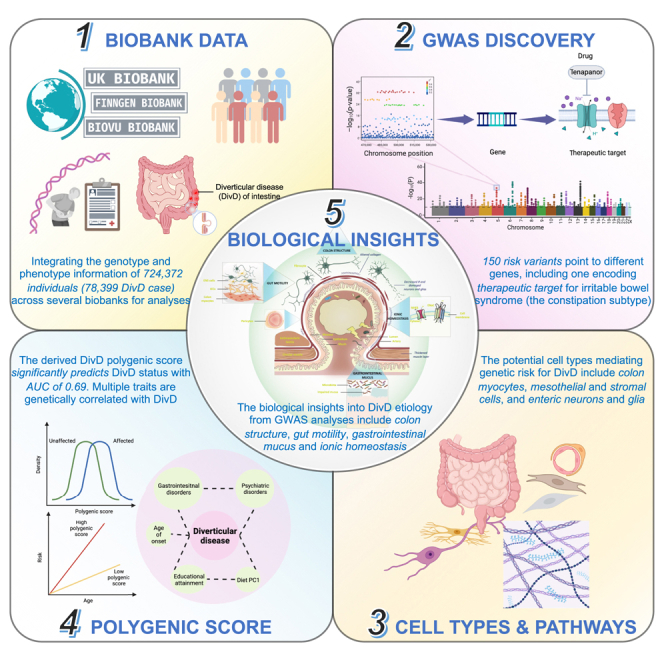
We conducted a genome-wide association study (GWAS) analysis of diverticular disease (DivD) of intestine within 724,372 individuals and identified 150 independent genome-wide significant DNA variants. Integration of the GWAS results with human gut single-cell RNA sequencing data implicated gut myocyte, mesothelial and stromal cells, and enteric neurons and glia in DivD development. Ninety-five genes were prioritized based on multiple lines of evidence, including SLC9A3, a drug target gene of tenapanor used for the treatment of the constipation subtype of irritable bowel syndrome. A DivD polygenic score (PGS) enables effective risk prediction (area under the curve [AUC], 0.688; 95% confidence interval [CI], 0.645–0.732) and the top 20% PGS was associated with ∼3.6-fold increased DivD risk relative to the remaining population. Our statistical and bioinformatic analyses suggest that the mechanism of DivD is through colon structure, gut motility, gastrointestinal mucus, and ionic homeostasis. Our analyses reinforce the link between gastrointestinal disorders and the enteric nervous system through genetics.
Keywords: diverticular disease, GWAS, gut motility, polygenic score, scRNA seq, enteric nervous system, biobank, cross-ancestry polygenic prediction
Graphical abstract
Highlights
-
•
Diverticular disease (DivD) GWAS identifies 150 risk variants in ∼724,000 individuals
-
•
The derived polygenic score significantly predicts DivD risk with AUC of 0.69
-
•
Potential DivD mechanisms: colon structure, gut motility, gastrointestinal mucus, and ionic homeostasis
-
•
Prioritized gene for DivD encodes drug target for IBS, a commonly comorbid disorder
Wu et al. investigate the genetic architecture of diverticular disease (DivD) of intestine by integrating the genotype and hospital record data from over 724,000 individuals across multiple biobanks. The authors identify 150 risk variants, and follow-up analyses implicate several cell types, including gut myocytes, mesothelial and stromal cells, and enteric neurons and glia, in disease development. Prioritized genes include a gene encoding therapeutic target for the constipation subtype of irritable bowel syndrome, a commonly comorbid disorder with DivD. Systematic estimation of genetic correlations of DivD with other complex traits highlights some potentially causal and pleiotropic relationships with DivD.
Introduction
Diverticula are sac-like protrusions in the wall of the intestinal tract, most often in the colon sigmoid.1 Diverticulosis refers to the presence of diverticula. The prevalence of diverticulosis reported in USA in 2009 was 33% in individuals 50–59 years old and 71% in those ≥80 years old.2 Diverticula in Western countries are predominantly localized in the left colon, whereas in Asian countries diverticula occur predominantly in the right colon.1 Studies of migrant communities show prevalence rates consistent with country of origin.3 Most people with diverticulosis are asymptomatic but ∼25% of individuals become symptomatic and get diagnosed with diverticular disease (DivD). The majority of DivD patients experience bothersome symptoms that could affect their quality of life, such as bloating, abdominal pain, and bowel habit changes.1 However, 15% of those individuals develop complications that may require (recurrent) hospitalization, such as diverticulitis (inflammation of the diverticula), hemorrhage, abscess, and fistula.1 These complications not only affect quality of life but can be life-threatening.1 The inpatient mortality of DivD is 1.5%–3.0%.4 It has been reported that DivD underlies ∼3,000 deaths annually in the US, which is high compared with other non-malignant gastrointestinal (GI) disorders.5 Besides the significant burden on individuals, DivD drains ∼$9.0 billion annually in the US, which is one of the most expensive GI-related healthcare expenditures.5 Despite the already heavy burden on both individuals and the healthcare system, the total prevalence of DivD is reported to increase annually, especially in younger age groups, in which diverticulosis used to be uncommon.6
The social and economic impact of DivD demands more attention from the community, research, and medicine.7 Unfortunately, individuals often tolerate bothersome symptoms, delaying discussions with medical professionals until symptoms become severe. Once diagnosed, first-line treatments are to increase dietary fiber intake, antibiotics, and surgery.1 However, given the high economic burden on the health system, new treatment algorithms are required.7 The etiology of DivD likely involves multiple factors, including genetic and lifestyle risk factors. Studying the genetic factors affecting DivD could provide biological insight into the disease pathogenesis and further contribute to new prevention and treatment strategies. Although genome-wide association studies (GWASs) of DivD have been reported, with 48 loci identified to date,8,9,10 the majority of heritable risk remains to be elucidated.11,12 Furthermore, the underlying causal tissues and cell types remain largely unknown. Here, we integrated data from multiple large-scale biobank resources to conduct GWAS analyses. A total of 150 independent genome-wide significant SNPs were identified, of which 102 SNPs are previously unreported. We further conducted a suite of post-GWAS analyses. By integrating the DivD GWAS results with single-cell RNA sequencing data from gut, we prioritized cells from the enteric neuron system and gut muscular cells for use in functional follow-up studies. We systematically evaluated the genetic relationship between DivD and a range of complex traits, including dietary habits, psychiatric disorders, behavior-related traits, and other GI disorders, to provide insights into causal or pleiotropic relationships.
Results
DivD heritability estimation
Among 454,768 individuals of European ancestry, 56,355 individuals had a diagnosis of DivD derived from hospital admission and primary care records (lifetime risk, 12.4%). Based on the full-sibling relative risk (1.63, 95% confidence interval [CI], 1.54–1.72; Table S1), the estimated DivD heritability of liability () is 0.406 (95% CI, 0.357–0.456). To compare the of DivD with the of other GI disorders, we adopted metrics from our previous study,13 which applied the same procedure in United Kingdom Biobank (UKB) to estimate of GI disorders (Figures 1A and 1B). As shown in Figure 1B, the of DivD is much higher than peptic ulcer disease (PUD), gastro-esophageal reflux disease (GERD), and irritable bowel syndrome but lower than inflammatory bowel disease (IBD). To further characterize the genetic architecture of DivD, we conducted a suite of GWAS and post-GWAS analyses (Figure 1C).
Figure 1.

Schematic overview and workflow of the current study
(A) Illustration of the common pathological characteristics or symptoms for the five GI disorders, including diverticular disease of intestine (DivD), peptic ulcer disease (PUD), gastro-esophageal reflux disease (GERD), irritable bowel syndrome (IBS), and inflammatory bowel disease (IBD). Note that pathological characteristics or symptoms are not limited to these locations.
(B) Summary metrics for GI disorders based on the UKB data. Note that the metrics for the GI disorders except DivD are adopted from Wu et al.13 Note that “142” within the “number of independent loci” plot is based on a meta-analysis GWAS of 78,399 DivD cases and 645,973 controls, where the UKB is the primary contributing cohort.
(C) Workflow of the current study. The work flow mainly includes two steps: (1) cross-biobank GWAS meta-analysis for DivD, and (2) post-GWAS analyses. Descriptions of each cohort used for meta-analysis are in Figure S1.
GWAS meta-analysis
DivD European-ancestry (DivD-EUR) GWAS meta-analysis was conducted within 724,372 individuals from three studies, including UKB (56,355 cases and 398,413 controls), FinnGen (14,357 cases and 182,423 controls), and BioVU (7,687 cases and 65,137 controls). The DivD diagnosis information of FinnGen and BioVU were derived in the same way as for UKB to avoid potential inaccuracy associated with self-report. The GWAS within each study was conducted by fitting sex, age, and genetic principal components (PCs) as covariates followed by a meta-analysis (Figure S1). Table S2 provides genetic correlation estimates for each pair of the three GWAS summary statistics. We also conducted sensitivity analyses in UKB to justify the covariate selection (STAR Methods; Figure S2; Tables S3 and S4). UKB also includes participants of South Asian (SAS) and African (AFR) ancestry, so DivD GWAS was conducted within each of the two ancestries, namely DivD-SAS (760 cases and 11,136 controls) and DivD-AFR (596 cases and 8,579 controls). The UKB East Asian cohort yielded only 57 cases, therefore, the cohort was not used for analysis. The description metrics for the studied cohorts are in Table S5. Estimated age of onset (AgeO) information was available in UKB only, so an AgeO GWAS was conducted for 53,658 DivD cases (AgeO-EUR). Given the relatively small number of cases among non-EUR ancestries, we did not conduct AgeO GWAS in these individuals.
A total of 150 lead SNPs with minor allele frequency (MAF) ≥0.01 were identified for DivD-EUR, with significance (p < 5E−8) and independence assessed through the conditional and joint GCTA-COJO14 analysis (Figure S3; Table S6). Taking 1,000 kb as window size threshold and 0.01 as linkage disequilibrium (LD) r2 threshold, the 150 DivD-EUR-associated SNPs are pruned to 142 loci, of which eight loci contain two independent SNPs. The Manhattan plot and quantile-quantile (Q-Q) plot for DivD-EUR are in Figure S4. Regional visualization plots of the 150 DivD-EUR-associated SNPs are in Data S1. Using the same method and pruning settings above, a total of two independent SNPs with MAF ≥ 0.01 were identified for AgeO-EUR, and these two SNP associations represent two loci, of which one locus is shared with DivD-EUR (Table S7). Regional visualization plots of the two AgeO-EUR SNPs are in Data S2.
Of the 150 DivD-EUR-associated SNPs, 48 have been reported by previous DivD GWASs,8,9,10 and 35 SNPs have been previously reported with association p value ranging between 5E−8 and 1E−59 and here formally reached genome-wide significance level. Sixty-seven SNPs have not previously been reported as associated with DivD. Thus, a total of 102 independent SNPs, corresponding to 100 loci, are reported here for the first time as associated with DivD at the genome-wide significance threshold. Some of these DivD-EUR-associated SNPs have already been linked to other GI disorders or relevant traits; e.g., #67, #68, and #80 SNP in Figure S3 are associated with hemorrhoids,15 and #50, #67, #97 and #148 SNP in Figure S3 are associated with stool frequency16 (Table S8).
The majority of the DivD-EUR-associated common SNPs in our analyses showed small-to-moderate risk on diverticular diseases of European-ancestry individuals with odds ratio (OR) of 1.02–1.17 (Figure 2A). For DivD-EUR, the 150 SNPs explained a total of 2.5% variance (estimated in the UKB European DivD cohort) with rs10179961 (#17) explaining the largest individual variance (0.13%) (Table S9). Among the 150 DivD-EUR-associated SNPs, 135 and 133 SNPs were available in the DivD-SAS and DivD-AFR GWAS summary statistics, respectively, after MAF filtering and allele matching. Given the small sample size of the non-European cohorts, we showed evidence of replication by regression of the association effect sizes of these SNPs estimated from the DivD-SAS and DivD-AFR on the DivD-EUR estimates. The regression coefficients were significant: 1.00 (p = 3.0E−10) in DivD-SAS and 0.91 (p = 1.3E−7) in DivD-AFR (Figure 2B), providing evidence for shared genetic risk for DivD across ancestries. Although effect size estimates for some SNPs were larger in DivD-SAS and DivD-AFR compared with DivD-EUR, the standard errors were higher so that only rs10910384 (#7) in AFR ancestry was formally significant (p = 1.4E−06) after Bonferroni correction from these analyses (Tables S10 and S11).
Figure 2.

Characteristics of effect size of DivD-EUR-associated SNPs
(A) Per-effect allele OR vs. effect allele frequency for DivD-EUR-associated SNPs (p < 1.0E−5).
(B) Regression of DivD-SAS and DivD-AFR GWAS SNP effect sizes on DivD-EUR effect sizes of SNPs that are genome-wide significant. Each dot represents an SNP, and labeled SNPs are those with association p value within the corresponding ancestry <0.05. The number in the bracket corresponds to the number in the “#” column of Figure S3. The regression line and 95% CI are presented. Note that rs10910384 (#7) in AFR ancestry was the only significant association (p = 1.4E−06) after Bonferroni correction from these analyses.
SNP-based heritability, tissues, and cell types
The proportion of variance in trait liability attributable to genome-wide common SNPs jointly, the SNP-based heritability (), was estimated to be 0.113 (95% CI, 0.101–0.125) for DivD-EUR and 0.020 (95% CI, 0.003–0.036) for AgeO-EUR (Table S12). The genetic correlation (rg) between DivD-EUR and AgeO-EUR was estimated to be −0.85 (p = 2.4E−5). Genomic partitioning analyses to identify genomic annotations enriched for SNP-based heritability17 were conducted based on various genomic annotations. First, the DivD-EUR was partitioned by SNP annotation set derived from cell-type group histone mark data. Results showed that of DivD-EUR was statistically significantly enriched in all 10 system-level cell-type groups, but GI cell-type group was the most significant (Table S13; Figure S4).
Given the highest significance and relevance of the GI cell-type group, we repeated our analyses using cell-type-specific SNP annotations derived from GI tissues of human18 and colon and ileum cells of both human and mouse.19 Briefly, we tested whether the DivD-EUR was enriched in regions containing the gene sets for tissues or cell types (defined as the top 10% genes that are specifically expressed in them; STAR Methods). Previous study shows ulcerative colitis (UC) and Crohn’s disease (CD) are enriched in regions containing genes specifically expressed in T cells.20 To validate our derived annotations, we conducted the same analyses using GWAS summary statistics from UC and CD21 and T cell annotations. To understand the difference of implicated cell types across DivD, UC, and CD, we also included other cell-type annotations for comprehensive analyses.
DivD showed higher significance of enrichment in esophagus gastroesophageal junction, esophagus muscularis, and colon sigmoid in human GTEx GI bulk tissues, while CD and UC were more enriched in ileum and colon transverse (Figure 3A). In addition to SNP annotations from human GI bulk tissue, we also used SNP annotations from human colon cells and mouse colon and ileum cells. In human colon cell SNP annotations, DivD was enriched in genes that are highly expressed in myocytes, interstitial cells of Cajal (ICCs), mesothelial cells, pericytes, and fibroblast cells, while UC and CD were more enriched in genes that are highly expressed in T cells, macrophage, and epithelial cells (Figure 3B). In addition to these results, we observed significant enrichment of DivD, UC, and CD in human colon glia and neurons (Figures 3C and 3D). The enrichment results in human GI bulk tissues and colon cells are provided in Table S14. The DivD enrichment results in mouse colon and ileum cells were similar to those in human colon cells (Table S15 and S16; Figures S5 and S6). UC and CD enrichment showed similar patterns across human GI tissues, human colon cells, and mouse colon and ileum cells, but the associations for CD are more significant. This may reflect in part the differential power of the GWAS data used, which can be benchmarked by the number of genome-wide significant SNPs for UC (50) and CD (72)21 (https://www.ebi.ac.uk/gwas/publications/28067908; Figures 3, S5, and S6; Tables S15 and S16). Given the significant enrichment results of DivD, UC, and CD in the enteric nervous system, we further repeated our analyses in independent mouse nervous system data. We found that DivD, UC, and CD showed enrichment in both enteric glia and enteric neuron (Table S17; Figure S7).
Figure 3.

Human GI tissues and colon cell types implicated by GWAS associations for DivD, UC, and CD
(A–D) The tissue and cell-type annotations are labeled with the corresponding dataset name, as shown on the left side of the y axis. (A) GTEx GI tissue, (B) colon cell, (C) colon glia, and (D) colon neuron. The length of the bar represents the significance of enrichment (x axis) for each of DivD, UC, and CD in the corresponding tissue or cell-type annotations (shared y axis). The color of each bar shows the significance level after Bonferroni correction. p <0.05/639 were labeled cross-trait significance while p <0.05/213 were labeled single-trait significance. EsoGasJunc, gastroesophageal junction; EsoMuscu, esophagus muscularis; ColonSig, colon, sigmoid; ColonTrans, colon, transverse; EsoMucosa, esophagus mucosa; ICCs, interstitial cells of Cajal; PIMN, putative inhibitory motor neuron; PEMN, putative excitatory motor neuron; PSN, putative sensory neuron; PIN, putative interneuron; PSVN, secretomotor/vasodilator neuron. Cell types and glia and neuron types are defined in Drokhlyansky et al.19 See Figure S6–S8 for additional results.
In addition to these gene-expression-derived annotations, we also used chromatin annotations to partition the DivD . A total of 489 tissue-specific chromatin-based annotations from peaks measured from six epigenetic marks were included.20 The of DivD-EUR was enriched in chromatin-based annotations from peaks of four epigenetic marks (H3K27ac, H3K4me1, H3K4me3, DNase; Table S18). The enriched annotations of the four epigenetic marks were in digestive tissues, including stomach, duodenum, colon, and rectal smooth muscle.
Gene prioritization and pathways
To better understand the potential biological mechanism of each lead SNP, we applied several approaches to prioritize candidate causal genes (Figure 4A), including the nearest gene, genes containing SNPs in LD (r2 ≥ 0.6) with a lead SNP, a gene with the highest V2G (variant-to-gene) score of a lead SNP from Open Target Genetics platform, and genes from the bowel-related pathways that are within ± 1 Mb of a lead SNP. Results are in Table S19. We also tried to identify a gene with a fine-mapped cis quantitative trait locus (QTL) of which the posterior inclusion probability (PIP) is ≥0.1 for DivD-EUR. Briefly, we first fine-mapped DivD-EUR SNPs and filtered out those with PIP < 0.1. We then retrieved the overlapped SNPs between the remaining DivD-EUR fine-mapped SNPs and fine-mapped SNPs from the eQTL Catalogue (PIP ≥ 0.1). The corresponding gene was reported if both criteria were met. The QTL of different measures includes gene expression (ge), exon counts, transcript usage (tx) and promoter, splicing and 3′-end usage event (txrev). Detailed information for gene prioritization is described in the STAR Methods section. The DivD-EUR fine-mapped results are in Table S20 and the retrieved information from eQTL Catalogue are in Table S21. Genes with at least one fine-mapped cis ge-QTL variant in any tissue of eQTL Catalogue (PIP ≥ 0.1) that is also a fine-mapped variant for DivD-EUR (PIP ≥ 0.1), related to Figure 4 and STAR Methods, Table S22. Genes with at least one fine-mapped cis exon-QTL variant in any tissue of eQTL Catalogue (PIP ≥ 0.1) that is also a fine-mapped variant for DivD-EUR (PIP ≥ 0.1), related to Figure 4 and STAR Methods, Table S23. Genes with at least one fine-mapped cis tx-QTL variant in any tissue of eQTL Catalogue (PIP ≥ 0.1) that is also a fine-mapped variant for DivD-EUR (PIP ≥ 0.1), related to Figure 4 and STAR Methods, Table S24. Genes with at least one fine-mapped cis txrev-QTL variant in any tissue of eQTL Catalogue (PIP ≥ 0.1) that is also a fine-mapped variant for DivD-EUR (PIP ≥ 0.1), related to Figure 4 and STAR Methods.
Figure 4.

Gene prioritization for DivD
(A) Approaches and criteria for DivD gene prioritization. Details for gene prioritization are also provided in the STAR Methods section.
(B) Ninety-five genes were prioritized with at least three sources. The number in the “#” column corresponds to the number in the “#” column of Figure S3. Number in the “No. of sources” corresponds to the number of blue-colored squares in the matrix. For the “Fine-mapped QTL” column, we also expand the QTL categories to gene expression QTL (Ge-QTL); exon-QTL; transcript usage QTL (Tx-QTL); and promoter, splicing, and 3′-end usage event QTL (Txrev-QTL), as indicated by yellow color.
A total of 164 genes (155 unique) were prioritized, among which 95 genes were identified from at least three approaches (Figure 4B). SLC9A3, prioritized by rs11747491 (#43) with four approaches, encodes the sodium-proton exchanger hNHE3, a therapeutic-effect target for tenapanor for the treatment of the constipation subtype of irritable bowel syndrome (IBS-C). Mutations in the SLC9A3 gene cause congenital sodium diarrhea. SPINT2, prioritized by rs12976534 (#137), also has mutations known to cause congenital sodium diarrhea.22 HTR2B, prioritized by rs7604042 (#24) from three approaches, encodes the serotonin receptor 5-HT2b. We also checked the overlapped genes between the 164 prioritized genes and the top 10% most specific genes for the enriched GI tissues and cell types of Figure 3 (Table S25); e.g., GPN1 is in the colon putative inhibitory motor neuron (PIMN) gene set. Similarly, PIEZO2 is in fibroblast, ICCs, and putative excitatory motor neuron (PEMN) gene sets, and BDNF is in mesothelial, pericytes, and glia gene sets. Among the 164 prioritized genes, a total of 10 genes encode therapeutic-effect mediating targets for US Food and Drug Administration (FDA)-approved drugs (Table S26), including SLC9A3 (mentioned above for IBS-C), HTR2B, CACNB2, COL6A1, COL6A2, FGFR2, ITGB3, KCNA4, KCNH2, and SCN9A. We then tested the enrichment of the 164 prioritized genes in the Gene Ontology pathways using g:Profiler (https://biit.cs.ut.ee/gprofiler). The enriched molecular function pathways include notch binding and extracellular matrix structural constituent, and the top two biological process pathways include anatomical structure morphogenesis and cation transport (Table S27). More details for genes with biological implications are provided in the Discussion.
Polygenic score analysis
We first derived SNP weights based on DivD-EUR summary statistics using SBayesR23 and then calculated polygenic scores (PGSs) in independent cohorts using the SNP weights. We systemically investigated the prediction accuracy and stratification ability of the PGSs in these cohorts (Figure 5A). The 7,696 participants of EUR ancestry from the CARTaGENE Biobank,24 including 146 individuals with DivD, were used to estimate the prediction accuracy. The AUC of the calculated PGS solely predicting DivD risk was 0.688 (95% CI, 0.645–0.732) and the AUC increased to 0.760 (95% CI, 0.721–0.800) when incorporating family history, age, and sex into the PGS predicting DivD risk model (Figure 5B; Table S28). We next characterized PGS for DivD risk stratification in the CARTaGENE cohort. The average PGS of DivD case is 0.70 (Cohen’s d, 95% CI, 0.54–0.87, p = 8.9E−14) standard deviations greater than those of controls. We converted the PGS into quintiles (1 = lowest, 5 = highest) and calculated the OR of DivD risk for participants of each quintile (DivD status ∼ PGS quintiles). Individuals from the top quintile have an OR of 8.85 (95% CI, 4.24–18.47) to develop DivD compared with individuals from the bottom quintile (Figure 5C). We also converted the PGS into percentiles and calculated the OR using individuals from the top percentiles against the remaining percentiles (the top 0.5% vs. the remaining 99.5%, the top 1% vs. the remaining 99%, the top 5% vs. the remaining 95%, the top 10% vs. the remaining 90%, and the top 20% vs. the remaining 80%). For example, individuals from the top 20% percentiles had an OR of 3.60 for DivD risk compared with the remaining individuals (Table 1). We further took the AgeO into consideration in DivD risk stratification. Participants from the top quintile of PGS reached CARTaGENE sample-estimated lifetime risk (1.9%, 146 out of 7,696) at ∼45 years old, while those from the bottom quintile did not reach this prevalence even 20 years later (Log rank p < 1.0E−4; Figure 5D). In addition to EUR ancestry, we also investigated prediction accuracy of the PGSs in UKB participants of other ancestries using the SBayesR-derived SNP weights. The PGSs are predictive in participants of SAS (AUC, 0.638; 95% CI, 0.612–0.658; p = 6.9E−37) and AFR ancestry (AUC, 0.587; 95% CI, 0.563–0.611; p = 8.9E−14) (Table 2).
Figure 5.

DivD PGS prediction analyses
(A) Workflow for prediction analyses. SBayesR was applied to derive the SNP weights for downstream PGS calculation together with DivD-EUR GWAS summary statistics.
(B) AUC of DivD risk prediction models in CARTaGENE cohort. The derived PGS provides comparable predictive ability on top of traditional risk factors (age and sex). The AUC is based on a logistic regression model with coefficients estimated for age, sex, family history (FH), and PGS estimated from the CARTaGENE data.
(C) OR for developing DivD in CARTaGENE cohort (146 individuals with DivD and 7,550 controls) for each PGS quintile. The black dots are the OR values and the error bars are the 95% CIs.
(D) The cumulative risk of DivD for individuals in the top and bottom quintile (with 95% CIs) of PGS of the CARTaGENE data.
Table 1.
Risk stratification of PGS in DivD risk in CARTaGENE participants of EUR ancestry
| High-PGS definition | Reference group | No. of individuals from high-PGS group | No. of individuals from reference group | Odds ratio | 95% CI | p value |
|---|---|---|---|---|---|---|
| Top 20% of distribution | Remaining 80% | 1,539 | 6,157 | 3.60 | 2.59–5.01 | 2.8E−14 |
| Top 10% of distribution | Remaining 90% | 770 | 6,926 | 3.53 | 2.43–5.11 | 3.0E−11 |
| Top 5% of distribution | Remaining 95% | 385 | 7,311 | 3.51 | 2.21–5.60 | 1.2E−07 |
| Top 1% of distribution | Remaining 99% | 77 | 7,619 | 5.38 | 2.43–11.92 | 3.3E−05 |
| Top 0.5% of distribution | Remaining 99.5% | 39 | 7,657 | 9.76 | 4.03–23.67 | 4.6E−07 |
| Top 20% of distribution | Bottom 20% of distribution | 1,539 | 1,540 | 8.85 | 4.24–18.47 | 6.3E−09 |
Table 2.
Prediction accuracy of PGS in DivD risk in UKB SAS and AFR ancestry participants
| Biobank | Ancestry | No. of cases/no. of controls | Logistic regression coefficient | s.e. for logistic regression coefficient | p value for logistic regression coefficient | AUC | 95% CI of AUC | R2 on the liability scale | s.e. for R2 on the liability scale |
|---|---|---|---|---|---|---|---|---|---|
| UKB | SAS | 760/11,136 | 0.485 | 0.038 | 6.9E−37 | 0.638 | 0.612–0.658 | 0.053 | 0.008 |
| AFR | 596/8,579 | 0.320 | 0.043 | 8.9E−14 | 0.587 | 0.563–0.611 | 0.023 | 0.006 | |
| CARTaGENEa | EUR | 146/7,550 | 0.708 | 0.085 | 9.7E−17 | 0.688 | 0.645–0.732 | 0.079 | 0.019 |
Results of prediction accuracy of PGS in individuals of EUR ancestry are also listed for comparison.
Genetic relationship with complex traits
We first investigated the genetic relationship between DivD and a range of complex traits using PGS regression. For PGS regression, we first constructed PGS for BioVU participants of European ancestry using DivD GWAS summary statistics of EUR ancestry from UKB. We then regressed 1,378 diseases outcome and 295 laboratory measurements on DivD PGS using logistic and linear models, respectively. PGS regression method does not require the GWAS summary statistics of complex traits from BioVU. DivD PGS was statistically significantly associated not only with BioVU diverticulosis and diverticulitis (p = 8.9E−85; Figure 6A; Table S29) but also with obesity, hernia, GERD and abdominal pain. Total white blood cell count was the most significant association among the 295 laboratory measures (p = 2.5E−12; Figure 6B; Table S30).
Figure 6.

Genetic relationship between DivD and complex traits
(A) Association of DivD PGS with common diseases in BioVU using UKB participants of EUR ancestry as the discovery sample.
(B) Association of DivD PGS with clinical biomarker measurements in BioVU using UKB participants of EUR ancestry as the discovery sample.
(C) Statistically significant genetic correlation estimates between DivD and other complex traits after Bonferroni correction. The blue dot represents the genetic correlation (rg) estimate between DivD and complex trait using bivariate LDSC with a 95% CI presented as a red horizontal line. The corresponding trait name is labeled above the dot. The blue dashed vertical line represents rg equaling zero. The traits are grouped into five categories, as labeled at the top of each rectangle.
In addition to PGS regression, we also estimated the genetic correlation between DivD and 358 other complex traits using GWAS summary statistics and bivariate LDSC.25 The genetic correlation from bivariate LDSC is not biased by sample overlap.25 Our analyses were conducted both on the LDHub platform and locally (STAR Methods). We identified strong rg with gastritis and duodenitis (0.45, p = 3.8E−43), gastroenteritis and colitis (0.38, p = 6.6E−15), and irritable bowel syndrome (0.37, p = 1.3E−23) (Figure 6C, “GI trait and disorders” column). The significant rg may help explain why DivD is frequently diagnosed alongside other conditions in clinics such as irritable bowel syndrome.26 We further conducted cross-sectional analyses to determine the number of individuals who had both DivD and other GI disorders, such as irritable bowel syndrome (Table S31; Figure S8). Our results showed that approximately 1 in 5 individuals with irritable bowel syndrome also had DivD over the course of their lifetimes. In addition to these GI-related traits, as shown in Figure 6C, we also identified other significant rg with years of education (EA, −0.17, p = 7.6E−14), body mass index (BMI, 0.12, p = 6.9E−7), stress (0.37, p = 5.3E−10), anxiety (0.29, p = 7.0E−18), and depression (0.23, p = 8.2E−20). Moreover, DivD was negatively genetically correlated with dietary patterns PC1, a diet composition trait representing increased wholemeal bread consumption, and increased fruit and vegetable intake (−0.15, p = 2.5E−12) (Figure 6C, “Diet intake-related traits” column). Full significant rg results for DivD are provided in Table S32.
Discussion
We conducted genome-wide association analyses on DivD, maximizing sample size by integrating data from three biobanks. We identified 150 independent SNPs (149 autosomal SNPs and one X chromosome SNP) associated with DivD and 2 SNPs associated with the AgeO of DivD at the genome-wide significance threshold. We conducted comprehensive post-GWAS analyses using the GWAS summary statistics to provide insights into the biological mechanisms and epidemiology of DivD.
There is an important genetic contribution to DivD, and it is a highly polygenic disease. The heritability of DivD estimated using UKB data is 0.406 (95% CI, 0.357–0.456), which is similar to 0.40 (95% CI, 0.18–0.47) estimated using primary and secondary diagnoses from Swedish Twin Registry data11 and lower than 0.53 (95% CI, 0.45–0.61) estimated from a population-based study in Denmark.12 The variation in these estimates may reflect differences among these cohorts. Despite this variation, these estimates provide evidence that genetic factors significantly contribute to DivD susceptibility. Previous studies identified three loci,8 39 loci,9 and 48 loci10 associated with DivD in individuals of European ancestry. The number of DivD cases in our study triples the previous study,10 and our 150 independent SNP associations represent 142 loci, including 141 autosomal loci and one X chromosome locus (Table S33 provides a comparison between current study and previous DivD GWAS studies using UKB as discovery cohort). Among the 150 independent SNPs, 102 SNPs (101 autosomal SNPs and one X chromosome SNP), corresponding to 100 loci, have not been previously reported. The prediction accuracy of PGS predicting DivD risk model in our study is 0.688 (95% CI, 0.645–0.732), which is comparable with or even higher than AUC from many PGS predicting corresponding complex trait models.27 The prediction accuracy increases further when sex, baseline age, and family history are incorporated into the model (Figure 5B). The top 20% of the PGS was associated with 3.6-fold increased risk of DivD in EUR ancestry compared with the remaining 80% of the sample. The negative genetic correlation between DivD-EUR and AgeO-EUR (Figure 6C) suggests that individuals with higher PGS have an earlier onset of DivD, and this relationship has been observed in other diseases, such as asthma28 and breast cancer,29 but here is reported for DivD for the first time. Despite the limited sample size of datasets of non-European ancestries, we show that DivD-associated loci are shared, at least partially, across individuals of SAS and AFR ancestry (Figure 2B). This conclusion is also supported by the transferability of DivD PGS derived from European GWAS summary statistics in SAS and AFR DivD risk (Table 2).
We applied multiple strategies to interpret DivD GWAS results, including (1) integrating large-scale bulk tissue and single-cell gene expression data with DivD to identify potentially causal cell types at high resolution (a brief discussion of results from UC and CD for a comparison are provided as a supplemental note in the STAR Methods section), (2) linking diverse annotations (physical distance, LD region, bowel-related pathway, V2G score, uniform-QCed fine-mapped QTL data) with DivD lead SNPs to prioritize potentially causal genes, (3) testing the enrichment of prioritized DivD genes in a range of Gene Ontology pathways to relate the potential mechanisms, and (4) connecting DivD PGS with a range of common diseases to understand DivD biological nature by disease similarity. In the current study, based on the results from the four analytic strategies above, the biological insights into the potential mechanisms of genetic predisposition to DivD onset could be divided into four themes, as shown in Figure 7:
Figure 7.

Schematic plot of the mechanism insights from the current DivD GWAS study
The biological insights into the potential mechanisms of genetic predisposition to DivD onset could be summarized into four themes (capitalized words in the four blue triangles with the regional enlarged illustration in the four boxes). Note that the pericytes annotation belongs to the colon structure theme. The italic words represent some of the pathological changes observed in DivD patients and the non-italic non-capitalized words are linked to the meaning of corresponding illustrations using black segments. Detailed descriptions are provided in the Discussion.
Colon structure
The normal colonic wall consists of mucosa, submucosa, muscularis propria and the outmost serosa. Unlike the small intestine, the longitudinal muscle of the colon is not continuous but formed into three parallel running muscle bands, which is the basis for the preferential occurrence of diverticula.30 Diverticula develop between the longitudinal muscle bands of the haustra, in the areas where blood vessels pierce the circular muscle layer (weak point) to supply blood to the mucosa.30,31 Consistent with these observations, our study shows that DivD is highly enriched in regions containing genes highly expressed in the colon sigmoid bulk tissue but not in the ileum (Figure 3B), suggesting the relevance of colon sigmoid in understanding the mechanisms of genetics in DivD initiation (STAR Methods provides a supplemental note for discussion about other bulk-tissue enrichment results for DivD). The enrichment of DivD in colon sigmoid bulk tissue is sensible but not very informative in terms of understanding the mechanism of genetics in DivD development, especially since colonoscopy, histology following biopsy, and various imaging modalities have already achieved high-resolution visualizations. Hence, we linked DivD with single-cell gene expression data derived from the human colon, as these analyses may implicate cell types of particular importance to the onset of DivD, which could further inform iPSC-based organoid models of GI disorders.32 We found the enrichment of DivD in genes highly specifically expressed in myocytes, mesothelial cells, fibroblasts, and pericytes (Figure 3B). Previous pathology study has shown changes in enteric musculatures between 20 DivD patients and 19 controls, such as thickened circular and longitudinal muscle layers, the disturbed architecture of smooth muscle cells, and reduced myofilament density.33 Alterations in enteric connective tissue have also been reported, including increased connective tissue index in the longitudinal muscle layer of DivD patients33 and elastin fibers.34 Cells enriched from our analyses are concordant with cells of tissues involved in the alterations described above, suggesting that genetic predisposition to DivD is mediated, at least in part, through influences on these cells. Although the observations from pathology studies mentioned above could be the consequence of DivD, given the unique position of genetics in the central dogma of molecular biology, our findings suggest that these changes could also contribute to DivD onset. In addition to prioritizing cells for iPSC-based organoid models to study how genetic variation contributes to DivD onset, our study also highlights the need to track pathology changes prior to diverticula presence.
Corresponding to the cell types identified through DivD analyses, the enriched Gene Ontology sets, including extracellular matrix structural constituent and anatomical structure morphogenesis (Table S27), and the association between DivD PGS and incisional hernias (Table S29) also point to connective tissues. It has been reported that individuals with DivD have altered connective tissue composition and collagen metabolism1,33 and are more prone to having other connective tissue disorders.35 COL6A1 and COL6A2 are both associated with DivD in our analyses and they encode the basic structural alpha 1 and alpha 2 chains of type VI collagen, a ubiquitously expressed extracellular matrix protein.36 In addition to collagen-related genes, we also identified ELN encoding elastin, which constitutes part of the extracellular matrix and confers elasticity to tissues. As mentioned above, diverticula often develop at the sites of vascular entry. The enrichment of colon pericytes, which are regulators of vascular morphogenesis and function,37 indicates that mesenteric vascular may also be involved in DivD initiation.
Gut motility
Other cell-type enrichment results for DivD implicated ICCs, enteric glia, and enteric neurons. A parsimonious interpretation is that common genetic variants underlying DivD risk may act through these cell types histologically or physiologically. Disturbances of gut motility have been observed in some DivD patients, such as myoelectrical aberrations,38 increased amounts of motility, disorganization, and retrograde propagation of propulsions.39 Although these observations were after DivD onset (i.e., could be a compensatory reaction to DivD pathophysiology), the results demonstrate the link between gut motility and DivD. The enrichment of ICCs and cells from the enteric nervous system in our study implies that motility disturbance contributes to DivD etiology. Future prospective colonic manometry studies based on large-scale individuals are needed to track the motility change prior to DivD onset. GDNF, associated with DivD in our analyses (Figure 4), encodes glia-derived neurotrophic factors. The protein promotes growth and differentiation as well as synaptic plasticity of the enteric nervous system.40 Lack of GDNF mRNA expression has been reported in DivD patients and could further contribute to the observation of a reduced number of enteric glia, neurons, and ICCs in DivD patients.40,41,42 Our results also implicate several neurotransmitter receptors. HTR2B, encoding serotonin receptor 5-HT2b, is associated with DivD in our analyses. A recent study has found that 5-HT2b is predominantly expressed in colon ICCs, and antagonists of this protein impaired colonic motility in healthy mice.43 We identified loci around PIEZO1 and PIEZO2 genes, which have been implicated in GI motility and serotonin synthesis.44,45 Gut motility relies on cell-to-cell interactions. A mouse model study showed that ICCs integrate and mediate enteric neurons and generate slow waves and rhythmic contractions of smooth musculature, supporting the concept that the core units for controlling GI motility are made up of nerves, ICCs, and smooth muscle cells.46 Our analyses imply the role of the enteric nervous cells-ICCs-myocytes circuit in DivD etiology.
GI mucus
In addition to the two themes above, similar to those proposed by the previous study,10 the genetic associations from our study also suggest other mechanisms. rs4556017, an intronic variant within the MUC12 gene, is associated with DivD. This gene encodes membrane-associated mucin 12, which plays an essential role in forming a protective and lubricative layer on epithelial cells and interactions between cells and the luminal environment.47 MUC12 gene is highly expressed in the colon47 and has been reported as associated with hemorrhoids.15 Mucin 12 was downregulated in colorectal cancer cell lines, suggesting the implication in epithelial cell growth regulation.48 The role of mucins in intestinal mucosal defense and inflammation has been emphasized49; however, studies regarding the relationship between mucin 12 and DivD remain sparse. Interestingly, a previous PUD GWAS also identified loci within or around mucin genes, including one membrane-associated gene MUC1 and three secreted gel-forming genes, MUC6, MUC2, and MUC5AC.13 Both the results highlight mucin biology in the etiology of GI disorders. An earlier study reported microbiota differences between individuals with diverticula and those without.50 By the analogy of the relationship between MUC1 and Helicobacter pylori,51 it is possible that mucin 12 interacts with microbiota and thus is involved in the development of DivD, including diverticulitis. Future studies are needed to advance our understanding of whether mucin 12 or microbiota are involved in the pathogenesis of DivD and if there is an interaction between mucin 12 and microbiota that contributes to DivD development.
Ionic homeostasis
Interestingly, we also identified genes related to sodium channels, including SLC9A3 and NEDD4L. SLC9A3 encodes hNHE3, an epithelial brush border Na+/H+ exchanger that uses an inward sodium ion gradient to expel acids from the cell. Defects of this gene cause congenital secretory sodium diarrhea. A recent study has shown Nedd4-2 (encoded by NEDD4L) affects hNHE3 activity, which further contributes to human diarrheal symptoms.52 hNHE3 is also a drug target of tenapanor for IBS-C treatment. Constipation is one of the symptoms shared between IBS-C and DivD. SPINT2 is also associated with DivD in our analyses, and mutations in this gene also cause congenital sodium diarrhea.22 In addition to abdominal pain, changing bowel habits are often observed in DivD patients. Our analyses show that intestinal ionic homeostasis, including sodium, may play a role in changing bowel habits, in addition to the enteric neuron system mentioned above.
The development of DivD is a process involving both structural and functional changes and their interaction with the intraluminal environment such as pressure. Our results provide a plausible mechanistic interpretation that individuals with genetic susceptibility to DivD are more prone to have colonic wall weakness, abnormality of gut motility in the degree and duration, impaired mucus, and disturbance of ionic homeostasis. The presence of these defects individually or collectively, under certain triggers from environmental changes such as diet, leads to DivD onset.
The genetic correlations between DivD and other complex traits have implications for understanding the factors for DivD onset. For example, our result shows that smoking was positively correlated with DivD. A previous study applied the Mendelian randomization (MR) paradigm to investigate the causal effect of smoking on DivD.53 The significant outcome from MR analysis has implications for disease prevention. However, the pre-requisites must be met before conducting MR analysis to prevent potential biases.54 Our results also prioritize insomnia and dietary fiber intake for future MR investigation, which may provide strategies for DivD onset. Note that these diet intake traits were habits based on a snapshot or a certain time period in a lifetime course. Genetic correlation estimates using GWAS of these traits may change when taking different time periods into consideration. The genetic correlations between DivD and GI /psychiatric-related traits may reflect the shared pathways or causal relationships among these disorders. Future larger studies are needed to investigate the causal relationships between DivD and other complex traits. Analyses conducted using the BioVU hospital database to investigate the relationship between DivD PGS and clinical and laboratory measurements highlight abdominal pain and white blood cell count in a positive direction (regression coefficient >0; Tables S29 and S30). Abdominal pain is one of the most typical symptoms of DivD patients, and individuals with diverticulitis often showed increased white blood cell counts, hence our analyses depicting the genetic relationship between DivD and complex traits also fit the clinical manifestation of DivD patients. These results imply that such analyses could also help highlight unobserved clinical characteristics.
In summary, we identified 150 independent SNPs (102 are novel) and two independent novel SNPs for DivD and the corresponding AgeO respectively by integrating several biobank resources for GWAS analyses. We explored these findings through bioinformatic analyses at the level of functional genomics, biological mechanisms, and epidemiology. Our analyses show that our GWAS findings point to potential mechanism insight, including colon structure, gut motility, GI mucus, and ionic homeostasis. These findings directly support that exploration of the genetic architecture of GI disorders is useful for understanding their causal mechanisms, which will further contribute to disease prevention, diagnosis, and treatment. Taken together, these findings of DivD, a lower GI disorder, and our previous findings of PUD,13 an upper GI disorder, illustrate that large biobank data boost power for our understanding of the common diseases, especially for those whose genetic factors are well recognized but have not yet been studied using GWAS paradigm.
Limitations of the study
Despite the comprehensive analyses and informative results of our study, there are also some limitations. First, the definition of DivD in our primary analyses is relatively broad, given the limited phenotype information. Analyses based on finer disease subtypes should be conducted if additional phenotypes are available in future. The DivD status information of participants is obtained during the period from the recruitment date to the last follow-up date through the available medical records. This means that some of the individuals currently considered as controls in our analyses may change their DivD status later, which could reduce the statistical power to detect more risk variants. Second, the identification of implicated genes from GWAS loci remains a challenging task. The prioritized genes in this study are based on current data, methods, and criteria. As such, there is a possibility that some of these genes may not be the true implicated genes. However, the gene prioritization framework used in this study could be further improved by incorporating more optimized methods and utilizing powerful and appropriate data in future research. Third, we combined RNA sequencing data with GWAS findings to prioritize the tissues and cell types for functional follow-up of DivD loci. However, many of the datasets are based on mouse models, which are important resources as cell-type-specific gene expressions are highly conserved across species,19,55 but we recognize that there are differences between human and mouse GI tracts. Fourth, Genetic relationships of DivD with other complex traits were estimated using GWAS summary statistics from various cohorts. It is important to acknowledge the presence of potential sample and recruitment biases within these cohorts, as these biases may influence the observed estimates.
STAR★Methods
Key resources table
| REAGENT or RESOURCE | SOURCE | IDENTIFIER |
|---|---|---|
| Deposited data | ||
| DivD-EUR and AgeO-EUR GWAS summary statistics | This paper | https://cnsgenomics.com/content/data |
| SNP-weights for polygenic score calculation | This paper | https://cnsgenomics.com/content/data |
| Ulcerative colitis and Crohn's disease summary statistics | de Lange et al., 201721 | https://www.ebi.ac.uk/gwas/publications/28067908 |
| V2G score | Koscielny et al., 201756 | https://genetics.opentargets.org |
| Human Phenotype Ontology gene sets | Köhler et al., 202157 | http://www.gsea-msigdb.org/gsea/msigdb/human/collections.jsp |
| Software and algorithms | ||
| PLINK | Chang et al., 201558 | https://www.cog-genomics.org/plink |
| BOLT-LMM | Loh et al., 201859 | https://alkesgroup.broadinstitute.org/BOLT-LMM |
| GCTA | Yang et al., 201160 | https://cnsgenomics.com/content/software |
| SAIGE | Zhou et al., 201861 | https://saigegit.github.io/SAIGE-doc |
| METAL | Willer et al., 201062 | https://genome.sph.umich.edu/wiki/METAL_Documentation |
| LocusZoom | Pruim et al., 201063 | http://locuszoom.org |
| Univariate LD score regression | Bulik-Sullivan et al., 201564 | https://github.com/bulik/ldsc/wiki/Heritability-and-Genetic-Correlation |
| Stratified LD score regression | Finucane et al., 201517 | https://github.com/bulik/ldsc/wiki/Partitioned-Heritability |
| Specific expressed gene LD score regression | Finucane et al., 201820 | https://github.com/bulik/ldsc/wiki/Cell-type-specific-analyses |
| R package “EWCE” | Skene et al., 201665 | https://github.com/NathanSkene/EWCE |
| PolyFun | Weissbroad et al., 202066 | https://github.com/omerwe/polyfun |
| SuSiE | Zou et al., 202167 | https://github.com/stephenslab/susieR |
| Bivariate LD score regression | Bulik-Sullivan et al., 201525 | https://github.com/bulik/ldsc/wiki/Heritability-and-Genetic-Correlation |
| SBayesR | Lloyd-Jones et al., 201923 | https://cnsgenomics.com/content/software |
Resource availability
Lead contact
Further information and requests for resources and reagents should be directed to and will be fulfilled by the lead contact, Yeda Wu (yeda.wu@uq.net.au).
Materials availability
This study did not generate new unique reagents.
Method details
The United Kingdom Biobank study
Approved by the North West Multicentre Research Ethnics Service Committee, the United Kingdom Biobank (UKB) is a large population-based prospective study with deep genetic and phenotypic data collected on approximately 500,000 individuals.68 Additional study and quality control details are described in Bycroft et al.68 UKB genotyped individuals were used for analyses. We applied a two-stage approach to infer the genetic ancestry for UKB individuals, as shown in ref.69 and 70. Briefly, the first step consisted of projecting each UKB individuals onto the genotypic principal components (PCs) calculated in the 1000 genomes project (1KGP) participants71 of European (EUR) ancestry, South Asian (SAS) ancestry, East Asian (EAS) ancestry and African (AFR) ancestry. The second step assigned each UKB individual to the closest ancestry based on their ancestry PCs, giving 456,426 EUR, 11,906 SAS, 2,486 EAS and 9,184 AFR. Details for ancestry inference settings, including EUR and others (SAS, EAS and AFR), have been described elsewhere.69,70 For individuals of EUR ancestry, we used the imputed genotype data centrally processed by the UKB team, as described in Bycroft et al.68 The reference panels used for imputation include the Haplotype Reference Consortium (HRC) and UK10K. Genotype probabilities were converted to hard-call genotypes using PLINK258 (--hard-call 0.1). Variants with Hardy-Weinberg Equilibrium (HWE) test p value <1.0E-5, missing genotype rate >0.05, imputation score <0.3 and minor allele frequency (MAF) <0.01 were excluded, and the remaining variants (hereafter SNPs but could include small insertion/deletions) were available for further analyses. Detailed genotype quality control process for non-European ancestry in UKB has been described in Wang et al.70 Quality-controlled SNPs with MAF ≥0.01 within each ancestry were available for the following analyses.
Two main phenotypes were derived from the UKB, diverticular disease (DivD) of intestine diagnosis and estimated DivD age of onset (AgeO). DivD phenotype was defined using diverticular disease diagnosis data (UKB data field: 131637). Briefly, individuals with either a primary care, hospital admission or death register records that could be mapped to the International Classification of Diseases 10th version (ICD10) code K57 (diverticular disease of intestine) were assigned as cases (note these individuals may also have a K57 record from self-report source at the same time). Individuals with only self-reported diverticular disease record (1,619 of total 61,908 cases, data were downloaded on Oct 2020) were excluded, and the remaining individuals were assigned as controls. The DivD dataset was divided into four phenotypes based on the UKB individual ancestry group, namely EUR (56,355 cases and 398,413 controls), SAS (760 cases and 11,136 controls), EAS (57 cases and 2,426 controls), and AFR (596 cases and 8,579 controls). The AgeO phenotype was generated for DivD case individuals by calculating year difference between estimated date of birth and first reported date for diverticular disease (UKB data field: 131636). There is actual date of birth information in UKB data field 33, but these data are restricted, thus we combined year of birth (UKB data field: 34), month of birth (UKB data field: 52), together with the first for day of month to generate the estimated date of birth. Individuals whose first reported date of DivD is from self-report DivD date record were removed to avoid the potential self-report inaccuracy. Given that the number of DivD cases of other ancestries is small, we only generated AgeO phenotype of EUR ancestry (53,658 individuals) for the downstream analyses.
To estimate the heritability of DivD based on the UKB data, we first calculated the full-sibling relative risk and then applied the liability distribution theory72,73,74 to get the DivD heritability estimate, under the assumption that the increased risk only reflects shared genetic factors. To compare the DivD heritability estimate with the heritability estimates of other GI disorders, we adopted results from Wu et al.,13 which applied the same procedure to estimate heritability for GI disorders based on UKB data. We then performed case-control GWAS analysis for DivD phenotype of EUR ancestry and quantitative GWAS analysis for AgeO phenotype using BOLT-LMM59 with sex, age and 20 PCs as covariates. For these two phenotypes, 543,919 SNPs generated by linkage disequilibrium (LD) pruning (r2 < 0.9) from European-relevant HapMap3 SNPs were used to control population structure and polygenic effects, including genetic relatedness between individuals. For case-control GWAS, the effect size for SNPs from BOLT-LMM on the observed 0–1 scale were transformed to odds ratio (OR) using the following equation75: , where is the proportion of sample that are cases, and is the allele frequency in the full UKB ancestry-specific cohort. The standard errors () for were then calculated based on the and value from the initial GWAS using the formula . Considering the sample size for DivD phenotypes of the other three ancestries (SAS, EAS and AFR), GWASs were conducted using GCTA-MLMA76 fitting the polygenic effect (the corresponding genetic relatedness effect matrix [GRM]) in the mixed linear model. To better improve the computational efficiency, covariates were not included in the analyses, as recommended in GCTA-MLMA tutorial (https://cnsgenomics.com/software/gcta/#MLMA). The 7,263,094 autosome SNPs were used for association analyses, including 4,853,455 SNPs shared across UKB, FinnGen and BioVU Biobank and 2,409,639 SNPs shared only between UKB and FinnGen Biobank. We also conducted X chromosome association analysis using the UKB v3 imputation release BGEN files. 199,292 SNPs with MAF ≥0.01 overlapped with FinnGen genotypes were analyzed. For DivD GWAS of other ancestries, the SNPs with MAF ≥0.01 within each ancestry cohort were analyzed.
FinnGen Biobank
The FinnGen Biobank, a nationwide study launched in Finland in 2017, combines both genetic information and healthcare data to improve personalized health care. Diverticular disease GWAS summary statistics were downloaded from the freeze 5 release of FinnGen GWAS results. Briefly, the phenotype consists of 14,357cases and 182,423 controls. The case definition was defined as individuals with diverticular disease of intestine record (K57 for ICD10 and 562 for ICD9 and ICD8) from hospital discharge and cause of death data. The FinnGen GWAS was conducted on 16,962,023 SNPs using SAIGE,61 fitting sex, age, 10 PCs and genotyping batch as covariates. Detailed information, including genotypes and GWAS settings, are described in https://finngen.gitbook.io/documentation. SNPs with MAF <0.01 were filtered out and genome build of the remaining SNPs were converted from hg38 to hg19 using LiftOver tool from UCSC human genome browser.77 Non-biallelic SNPs were further removed and a total of 7,263,094 autosome SNPs and 199,292 X chromosome SNPs were selected based on the overlap with other cohorts’ genotype.
BioVU Biobank
BioVU, a biobank launched by Vanderbilt University Medical Center (VUMC), uses information documented in the electronic health records of patients.78 Patients were provided the BioVU consent form in the outpatient clinic environment at VUMC. Through genotype information and ancestry inference, a total of 72,824 individuals of European ancestry were identified. Individuals with clinical records 562 and K57, based on the International Classification of Diseases 9th and 10th editions (ICD9 and ICD10), respectively, were assigned case status, and the remaining individuals were assigned as controls. A total of 7,687 cases and 65,137 controls were used for GWAS analysis. To minimize differences in the GWAS procedures, the analyses were conducted following similar settings as those in UKB. Briefly, GWAS was conducted using BOLT-LMM,59 together with age, sex and genetic principal components 1–10 as covariates. A total of 4,853,455 autosome SNPs with MAF ≥0.01, which are overlapped with both UKB and FinnGen DivD EUR summary statistics, were used for association analyses. Given the non-availability of X chromosome data, we did not conduct X chromosome association analysis. Details about VUMC BioVU data quality control have been described previously.78
GWAS meta-analysis of UKB, FinnGen and BioVU for DivD
We applied an inverse-variance-based method METAL,62 together with UKB, FinnGen and BioVU DivD GWAS summary statistics of EUR ancestry, to conduct a meta-analysis. 7,263,094 autosome SNPs and 199,292 X chromosome SNPs were analyzed. Among the 7,263,094 autosome SNPs, 4,853,455 SNPs are shared across all three cohorts’ genotype. The weighted average frequency of alleles for each SNP across the summary statistics used for meta-analysis is the reported allele frequency for each SNP in the meta-analysed GWAS summary statistics. The meta-analysed summary statistics (abbreviated as DivD-EUR), together with UKB AgeO summary statistics of EUR ancestry (abbreviated as AgeO-EUR), were used for the follow-up analyses. DivD GWASs of other ancestries, including DivD-SAS and DivD-AFR, were used as supplementary analyses.
Independent lead SNPs and loci identification
We used GCTA14,60 (--cojo-slct) to identify independent SNPs for DivD-EUR and AgeO-EUR. We set p value threshold as 5.0E-8. Other parameters were set as default. The obtained SNPs were reported as genome-wide significant SNPs. To investigate the MAF and OR relationship for DivD-EUR-associated SNPs, we repeated the analysis using a p value threshold of 1.0E-5 to obtain more SNPs. The genotype data (SNPs with MAF ≥ 0.01) of 20,000 random sampled unrelated UKB European individuals were used to provide a LD reference. Due to the complexity of the major histocompatibility complex (MHC) region (25-34 Mb), only the most statistically significant SNP across that region was reported. To obtain the number of independent loci for DivD-EUR and AgeO-EUR, we pruned the independently associated SNPs obtained from GCTA by taking 1000 kb as window size threshold and 0.01 as LD r2 threshold. Regional visualization plots were produced using LocusZoom63. To calculate the variance explained by each DivD-EUR-associated SNP, we first applied a logistic regression model to predict the diverticular disease status in UKB European individuals based on the genotype information of these SNPs and then used the NagelkerkeR2() function of R package “fmsb”.
DivD reported SNPs identification and pleiotropy analyses
We used results from the three published DivD GWAS8,9,10 to count the number of independent genome-wide significant SNPs from the current study that have been previously reported to be associated with DivD. Briefly, we checked the LD relationship between our DivD-EUR and AgeO-EUR associated SNPs and the variants reported from the Table 1 of Sigurdsson et al.8, Table 1 of Maguire et al.,9 and Tables 2, 3 and Supplementary Table 1 of Schafmayer et al.10. Supplementary Table 2 of ref 9 also listed variants with association p value < 1E-5, which were also included in our analyses. A DivD-EUR and AgeO-EUR SNP was classified as previously reported if it is LD correlated with the variants in the aforementioned tables from the three published DivD GWASs.8,9,10 The LD information were obtained from LDlink (https://ldlink.nci.nih.gov/?tab=ldpair) by selecting EUR population. We also checked if the DivD-EUR associated SNPs have been reported to be associated with other traits (pleiotropy analyses). Briefly, we downloaded published GWAS associations from the GWAS Catalog79 on Feb 22nd, 2022. We first selected SNPs from the GWAS Catalog SNPs that are within ±1000 kb window size of the index SNP. We reported a pleiotropic association if the selected GWAS Catalog SNP is in LD (r2 > 0.6) with the index SNP as well as the reported association p value < 5.0E-8.
Cross-ancestry effect comparison
We compared the effect of independent SNPs (obtained from DivD-EUR GWAS summary statistics) on diverticular disease of EUR ancestry with the effect of these SNPs on diverticular disease of each of SAS and AFR ancestry. Only allele-matched SNPs that are common between DivD-EUR and each of the DivD-SAS and DivD-AFR GWAS summary statistics were used.
SNP-based heritability estimation
Univariate LD score regression (LDSC)64 was used to estimate SNP-based heritability () from the DivD-EUR and AgeO-EUR summary statistics. For DivD-EUR GWAS summary statistics, the estimated on the observed scale were transformed to the liability scale taking the sample lifetime risk (proportion of sample that are cases) as the disease lifetime risk estimate, i.e., 10.8% for DivD-EUR. The summary statistics for each phenotype were filtered using the LDSC default file, w_hm3.snplist, with the default LD scores (eur_w_ld_chr) computed using 1000 Genomes European data as a reference.
Partitioning DivD by publicly available annotations
Following the estimation of of DivD-EUR GWAS , we applied the LDSC method to partition the by cell-type group annotations to prioritize tissues and cell types.17 The annotations were provided by ref. 17. Briefly, genetic variants were annotated to histone marks (H3K4me1, H3K4me3, H3K9ac and H3K27ac) by cell-type-specific classes and these annotations were allocated to ten groups: adrenal and pancreas, central nervous system (CNS), cardiovascular, connective and bone, gastrointestinal, immune and hematopoietic, kidney, liver, skeletal muscle, and other. The method evaluates the contribution of each functional category to the overall of a trait. A category is enriched for if the variants with high LD to that category have elevated χ2 association statistics, compared to the expectation given the number of SNPs in that category. Given that DivD showed enrichment in all ten cell-type group annotations, we also used LDSC specific expressed gene (SEG)20 analysis to test the enrichment of in 489 publicly available tissue-specific chromatin-based annotations derived from DNase I hypersensitivity (DHS) and five activating histone marks (H3K27ac, H3K4me3, H3K4me1, H3K9ac and H3K36me3).20
Partitioning DivD by manually derived annotations
We further derived annotations based on gene expression datasets from different studies, with a main focus on gastrointestinal tissues and cells. These datasets include 1) bulk-tissue RNA-seq gene expression data from 54 tissues (v8, median across samples) from the GTEx consortium18 (abbreviated as GTEx). 2) single-cell (sc) and single-nucleus (sn) RNA-seq gene expression datasets from human colon cells, human colon glia, human colon neurons, mouse colon cells, mouse colon glia, mouse colon neurons, mouse ileum cells, mouse ileum glia, and mouse ileum neurons (abbreviated as Drokhlyanhsky, note that the study applied two sequencing methods for mouse colon glia and neuron, thus there are two datasets for each of mouse colon glia and neurons).19 3) 39 broad categories (level 4) from the entire mouse nervous system (19 regions), including enteric glia and neurons category (abbreviation as Zeisel).80 In summary, there are 13 datasets, i.e., 4 from human (1 from GTEx, 3 from Drokhlyanhsky) and 9 from mouse (8 from Drokhlyanhsky and 1 from Zeisel).
GTEx data (GTEx_Analysis_2017-06-05_v8_RNASeQCv1.1.9_gene_median_tpm.gct.gz) were downloaded from GTEx portal (https://www.gtexportal.org/home/datasets/). Drokhlyanhsky data (SCP1038), including colon and ileum data from both human and mouse, were downloaded from the Single Cell portal (https://singlecell.broadinstitute.org/single cell). Zeisel data (L5 All.loom) were downloaded from http://mousebrain.org/downloads.html. The data processing procedures followed those of Bryois et al.55 All data were processed uniformly. First, for each gene in each cell type, the mean expression was computed based on the information from corresponding single-cell expression data. We applied the generate.celltype.data() function from R package ‘EWCE’65 for Drokhlyanhsky data. For the GTEx data, we used the pre-computed median expression across individuals. Genes with non-unique names, not expressed in any cell types, non-protein-coding genes, and for mouse datasets, genes that had no expert-curated 1:1 orthologs between mice and human (Mouse Genome Informatics, The Jackson Laboratory, version 11/22/2016) were filtered out. The gene expression was then scaled to a total of 1 million UMIs (or TPM) for each tissue or cell type. Gene expression in each tissue or cell type was divided by the total expression of that gene in all cell types to show gene expression specificity, of which the metric ranges from 0 to 1 (0 means that there is no expression in the cell type while 1 means that 100% of the expression is in the cell type). The 10% most specific genes in each tissue or cell type were used for generating tissue or cell-type-specific annotations. Briefly, for each tissue or cell type, we created an annotation file using the 10% genes most expressed in that cell type and then computed the LD scores using the created annotation file with default settings.
We then tested the enrichment of in each tissue and cell type.17 As a comparison, we also used the published Crohn's disease (CD) and ulcerative colitis (UC) GWAS summary statistics21 as these two diseases are well-studied by the GWAS paradigm and well statistically powered. The GWAS summary statistics were restricted to SNPs with minor allele frequency ≥0.01 with UKB as a reference.
Gene prioritization
To prioritize candidate causal genes for DivD-EUR, we used various gene prioritization approaches. Given we only described the in silico gene prioritization results without characterizing the actual functional activity in vitro or in vivo, we aimed to provide a systematic approach to nominate potential causal gene(s) in a locus using the following criteria:
-
1)
The nearest gene: a gene that is closest to a lead SNP by distance to the gene body. Information was directly obtained from the Open Targets Genetics platform (https://www.opentargets.org/genetics) when inputting the DivD-EUR lead SNPs.
-
2)
Genes in the LD region: genes within ±1 Mb of a lead SNP and containing any SNPs that in LD (r2 ≥ 0.6) with a lead SNP. For LD estimation, we used the genotype data (SNPs with MAF ≥ 0.01) of 20,000 random sampled unrelated UKB European individuals as reference.
-
3)
V2G score: a gene with the highest overall score from the Open Target Genetics platform56. For each SNP, the overall V2G score integrates differentially weighted evidence of variant-gene associations from several data resources, including molecular cis quantitative trait loci (QTL) data, interaction-based datasets, genomic distance and variant effect predictions from Ensembl. Details of the resources and weights are in the platform (https://genetics-docs.opentargets.org/our-approach/data-pipeline).
-
4)Fine-mapped genes: genes with a fine-mapped cis QTL SNP (posterior inclusion probability, PIP ≥ 0.1) of which the PIP is also ≥ 0.1 for DivD-EUR.
-
a.We first fine-mapped SNPs for DivD-EUR using a combination of PolyFun66 and SuSiE.67 PolyFun computes prior causal probabilities based on functional annotations and SuSiE fine-maps SNPs and provides PIP and credible sets of SNPs. We used the precomputed per-SNP heritability for UKB SNPs based on functional annotations and then used this metric as prior causal probability in SuSiE for fine-mapping. We set ±1 Mb of DivD-EUR lead SNPs as the window size and SNP with PIP ≥ 0.1 were reported. Other parameters were set as default.
-
b.The fine-mapped QTL results for different quantification measures of genes were downloaded from eQTL Catalogue (http://www.ebi.ac.uk/eqtl/Data_access/, release 5). Detailed information for data quality control are provided in ref. 81. Briefly, raw gene expression and genotype data from various studies were downloaded and uniformly processed. Four gene quantification measures, including gene expression (ge), exon expression (exon), transcript usage (tx) and promoter, splicing and 3′-end usage even (txrev), were used for association testing. Statistical fine-mapping for different QTLs were further performed using SuSiE. SNPs with PIP ≥0.1 for different quantification measures of genes were retained.
-
c.For each DivD-EUR lead SNP, we further checked the overlap between fine-mapped QTLs for genes from eQTL Catalogue and fine-mapped SNPs for DivD-EUR according to a previous study.82 If an overlap was found, the corresponding gene, along with the quantification measure, was reported.
-
a.
-
5)
Bowel genes: genes from bowel-related gene sets from Human Phenotype Ontology57 that are within ±1 Mb of a lead variant. The 40 bowel-related gene sets include "Bowel Diverticulosis", "Malrotation of Small Bowel", "Abnormal Bowel Sounds", "Colonic Diverticula", "Colon Cancer", "Aplasia Hypoplasia Of The Colon", "Aganglionic Megacolon", "Adenomatous Colonic Polyposis", "Neoplasm Of The Colon", "Abnormal Intestine Morphology", "Functional Abnormality Of The Gastrointestinal Tract", "Abnormal Large Intestine Morphology", "Abnormality Of The Small Intestine", "Neoplasm Of The Gastrointestinal Tract", "Intestinal Hypoplasia", "Inflammation Of The Large Intestine", "Intestinal Polyp", "Intestinal Atresia", "Gastrointestinal Dysmotility", "Intestinal Pseudo Obstruction", "Abnormal Large Intestine Physiology", "Gastrointestinal Inflammation", "Abnormality Of Small Intestinal Villus Morphology", "Gastrointestinal Eosinophilia", "Large Intestinal Polyposis", "Intestinal Malrotation", "Gastrointestinal Atresia", "Neoplasm Of The Large Intestine", "Gastrointestinal Obstruction", "Gastrointestinal Haemorrhage", "Intestinal Carcinoid", "Intestinal Fistula", "Adenocarcinoma Of The Large Intestine", "Adenocarcinoma Of The Intestines", "Gastrointestinal Stroma Tumor", "Gastrointestinal Infarctions", "Gastrointestinal Carcinoma", "Recurrent Infection Of The Gastrointestinal Tract", "Neoplasm Of The Small Intestine", "Intestinal Bleeding".
For each DivD-EUR-associated lead SNP, genes from the above 1) – 5) were ranked based on the number of sources and only genes with the highest number of sources were prioritized. If there are multiple genes with the same number of sources, genes with 3) V2G score and 4) fine-mapped genes were chosen to report. In any case, genes with evidence solely from 5) bowel genes were used to complement other lines of evidence and cannot be solely relied upon.
Polygenic score analyses
We first used SBayesR23 and DivD-EUR GWAS summary statistics to derive SNP weights for polygenic score (PGS) calculation. We used the banded matrix provided from https://cnsgenomics.com/software/gctb/#Download as LD reference. We then calculated the PGS for participants of EUR ancestry from CARTaGENE Biobank24 and of SAS and AFR ancestry from UKB. Those individuals are independent of cohorts for constructing DivD-EUR GWAS summary statistics. The CARTaGENE Biobank is a population-based study, targeting the segment of the population that is most at risk of developing chronic disorders. Detailed health and sociodemographic information, together with biological samples, were collected for individuals aged 40–69 years across 12 assessment sites. For CARTaGENE Biobank, participants were projected onto the genetic principal components 1–20 calculated using HapMap3 SNPs in 1KGP individuals. The ancestry information was predicted based on the 1KGP individual information using R package “randomForest”. A total of 7,696 participants of EUR ancestry were identified. Among these participants, 146 individuals answered “yes” to the diverticular disease choice for the question “has a doctor ever told you that you suffer from a bowel disorder such as Crohn's disease, ulcerative colitis, irritable bowel syndrome, polyps or diverticular disease?”. We conducted the following analyses to assess the PGS prediction accuracy and stratification ability: 1)The p value of case-control PGS difference was calculated by Student’s t test; 2) Area under the curve (AUC) and R2 on the liability scale83 of the prediction model. We used four models to assess the prediction accuracy, including “phenotype ∼ PGS”, “phenotype ∼ age + sex”, “phenotype ∼ PGS + age + sex” and “phenotype ∼ PGS + age + sex + family history”. The relative weight of each term included in each model was also estimated. 3) PGS was further discretised into quintiles (1 = lowest, 5 = highest) and the odds ratio and 95% CIs for the 2nd and 5th PGS quintiles compared with the 1st quintile were estimated using “DivD status ∼ PGS quintile” model. 4) Instead of quintile, we also discretised the PGS into percentiles and calculated the odds ratio by comparing those with high PGS against the remainder of the population (the top 0.5% vs. the remaining 99.5%, the top 1% vs. the remaining 99%, the top 5% vs. the remaining 95%, the top 10% vs. the remaining 90%, and the top 20% vs. the remaining 80%) in a logistic regression model. 5) Further, we took DivD AgeO into consideration and compared the cumulative risk between the 1st quintile and the 5th quintile using Kaplan-Meier method and log-rank test (“DivD status ∼ PGS quintiles” model). For UKB participants of SAS and AFR ancestry, we calculated the PGS using the SBayesR-derived weights and estimated the AUC of PGS predicting DivD risk model. We then compared these AUCs based on non-EUR ancestries with AUC based on EUR ancestry. Details for DivD PGS association with common diseases and laboratory measurements in BioVU cohort are provided in ref 78. The UKB DivD GWAS summary statistics were used to construct PGS for BioVU individuals.
Genetic correlation analyses
We investigated the genetic relationship between DivD and a range of complex traits using bivariate LDSC25, which estimated genetic correlations (rg) between pairs of traits using GWAS summary statistics while accounting for the sample overlap. We first estimated the rg between DivD-EUR and AgeO-EUR. We next uploaded DivD-EUR GWAS summary statistics to LD Hub, a platform applying bivariate LDSC to estimate rg between the uploaded trait and those already-collected traits. A total of 258 traits rather than rapid GWAS of LD Hub were selected for analyses as in previous study13.
Given our interests in the genetic relationship of DivD with food intake, we used summary statistics from Cole et al.,84 a genetic study focusing on dietary habits. In that study, 60 of 85 PCs generated by the dietary patterns showed statistically significant SNP-based heritability. We used these 60 PCs for our rg analyses. In addition to these PCs, we also included other 50 traits across meat, fiber and other dietary habits from that study to estimate the rg with DivD. Meddens et al.85 conducted GWAS on diet composition (fat, protein, sugar and carbohydrate) and we used the corresponding four GWAS summary statistics to explore the genetic relationship between diet composition and DivD. We also included four anthropometric traits: body mass index (BMI),86 hip circumstance adjusted for BMI,87 waist circumstance adjusted for BMI87 and waist-hip-ratio adjusted for BMI.87
We previously showed that gastro-esophageal reflux disease, peptic ulcer disease and irritable bowel syndrome were genetically correlated and these gastrointestinal disorders were also genetically correlated with major depression and attention deficit hyperactivity disorder (ADHD).13 Motivated by these analyses, we also investigated the genetic relationship between DivD and a range of GI traits and psychiatric disorders. For GI traits, we included one stool frequency trait16 and 19 GI disorders (UKB unpublished). For the UKB unpublished data, we first conducted GWAS using data from UKB data categories 2411 and 153 and then conducted bivariate LDSC analyses. Note that data category 153 was used to derive ROME III criteria-based IBS phenotype. For psychiatric disorders, we included ADHD,88 schizophrenia,89 posttraumatic stress disorder,90 bipolar disorder,91 autism spectrum disorder,92 depression,93,94,95 anxiety (published study96 and unpublished data) and reaction to severe stress and adjustment disorders (unpublished data). We incorporated 10 GWAS summary statistics for depression given the different definitions, including one major depression from Wray et al.,93 one antidepressants usage from Wu et al.,94 and eight other definitions from Cai et al.95 (GPpsy, Psypsy, DepAll, SelfRepDep, ICD10Dep, LifetimeMDD, MDDRecur, and GPNoDep). Detailed descriptions for these abbreviations are in Figure 1 of Cai et al.95 For two psychiatric disorders labeled with "unpublished data", we conducted GWAS using data filed 130907 and 130911 from UKB data categories 2405 with same settings as described above and further investigated the genetic relationship.
Supplemental notes
The effect of BMI as a covariate in UKB DivD GWAS analysis
While there is evidence to suggest that obesity is associated with colonic diverticulosis and diverticular disease,97 the exact nature of the relationship (causal or pleiotropy) is not clear. A previous study has shown that adjusting for heritable covariate when the causality relationship between the covariate and the phenotype is unclear could bias effect estimates of genetic variants from GWAS analysis.98 In case unwanted bias could be induced, we did not fit BMI as a covariate in our primary analysis (DivD-EUR). However, we conducted sensitivity analyses to investigate the effect of BMI as a covariate in DivD GWAS analysis using UKB data, as the individual-level genotype and phenotype information is available. Briefly, we repeated GWAS in UKB fitting BMI as a covariate on the basis of previous covariates (age, sex, genetic principal components 1-20). The BMI information (UKB Data Field: 21001) was first separated into male and female groups and then normalized and combined. The DivD GWAS without BMI as a covariate was referred to as “No BMI”, while the GWAS with BMI as a covariate was referred to as “BMI”. “No BMI” GWAS identified 104 independent significant SNPs and “BMI” GWAS identified 101 independent significant SNPs, with significance (p value < 5E-8) and independence assessed using the conditional and joint GCTA-COJO14 analysis. As shown in Figure S2, the effect of the 104 SNPs (same allele) from “No BMI” GWAS are highly concordant with the effects of these SNPs from “BMI” GWAS (the regression estimate is 0.995 with s.e. of 2.4E-03, Table S3). Moreover, using bivariate LDSC, the genome-wide genetic correlation is 0.988 with s.e. of 8.0E-4 (Table S4). These results suggest that the effect of BMI as a covariate in UKB DivD GWAS analysis is little in the current study and further large-scale studies are needed to investigate whether BMI is causal for diverticulosis and diverticular disease.
Incorporating cell-type-specific enrichment results by partitioning ulcerative colitis and Crohn’s disease using annotations derived in the current study
A previous study has shown that ulcerative colitis (UC) and Crohn’s disease (CD) are enriched in regions containing genes specifically expressed in T cells20. To validate our derived annotations, we conducted the same partitioning analyses using GWAS summary statistics from UC and CD21 and our T cell annotation. We found T cell enrichment of UC and CD , supporting the validation of our annotations indirectly. Among the derived bulk-tissue annotations, the most significant tissue was the terminal ileum of small intestine,99 providing further support for the validity of the approach. Among the other derived cell-type annotations, different specific cell types were identified (Table S14. Partitioning SNP-based heritability of DivD, UC, and CD by cell-type-specific annotations derived from human colon gene expression data, related to Figure 3 and STAR Methods, Table S15. Partitioning SNP-based heritability of DivD, UC, and CD by cell-type-specific annotations derived from mouse colon gene expression data, related to Figure 3 and STAR Methods, Table S16. Partitioning SNP-based heritability of DivD, UC, and CD by cell-type-specific annotations derived from mouse ileum gene expression data, related to Figure 3 and STAR Methods, Table S17. Partitioning SNP-based heritability of DivD, UC, and CD by cell-type-specific annotations derived from mouse nervous system gene expression data, related to Figure 3 and STAR Methods, Figures 3 and S6–S8), which were also consistent with their clinical presentation20,55,100. This, once again, reinforces the validity of the bioinformatic method used for investigating disease mechanisms.
DivD bulk-tissue enrichment results in esophagus gastric junction and muscularis
In addition to the enrichment of DivD in colon sigmoid bulk tissue, esophagus gastric junction and esophagus muscularis were also significantly implicated by these analyses (Figure 3). Notably, 1,081 genes are shared among the top 10% most specific genes (1,737 genes in total) for colon sigmoid and esophagus muscularis from the GTEx database. We also note that in the GTEx study mucosa of the sigmoid colon was discarded and only muscularis was obtained (https://gtexportal.org/home/samplingSitePage). Hence, these results may reflect the similarity in anatomical and physiological characteristics among these tissues. Same interpretation could be also applied to enrichment of multiple cell types of DivD (or UC and CD ), as some of these cell types are histologically similar and the top 10% most specific genes are highly overlapped across these cell types.
Quantification and statistical analysis
Details regarding statistical tests, significance thresholds, sample sizes and p value can be found in the tables and figure legends, as well as in the relevant sections above.
Acknowledgments
This research was supported by the Australian National Health and Medical Research Council (grant numbers 1113400 and 1173790). This study was carried out under the generic approval from the NHS National Research Ethics Service and conducted using the UKB resource under project 12505. We thank the UKB participants and the UKB research teams for their generous contributions to generating an important research resource. This study used the FinnGen GWAS summary statistics, and we would like to acknowledge the participants and investigators of the FinnGen study. The study used data from Vanderbilt University Medical Centre Biobank, and we thank the participants and staff for providing genomic and health information data. This research has been conducted using data from CARTaGENE Biobank (project ID 488635) and we thank participants and investigators of the CARTaGENE study. We thank all study participants whose data generated GWAS summary statistics. This includes the customers, research participants, and employees of 23andMe for making this work possible (major depression GWAS). The study protocol used by 23andMe was approved by an external AAHRPP-accredited institutional review board. Graphic abstract and Figure 1 were created using BioRender (https://www.biorender.com/, license GG25FKWVIZ and RF25FKNMIL, respectively), and Figure 7 was created on the basis of Figure 2 of Tursi et al.1 using BioRender (license EM25FL8W1N) and Adobe Illustrator. Y.W. is supported by the F.G. Meade Scholarship and the University of Queensland Research Training Scholarship.
Author contributions
Y.W. and N.R.W. conceived and designed the study. Y.W. performed the analysis with assistance and guidance from M.K., S.M., M.J.G., L.K.D., and N.R.W. S.B.G. and L.B.B. performed DivD of intestine GWAS and polygenic score analyses using BioVU data under the supervision of L.K.D. Y.W. and N.R.W. wrote the manuscript with the participation of all authors.
Declaration of interests
The authors declare no competing interests.
Inclusion and diversity
We support inclusive, diverse, and equitable conduct of research.
Published: June 5, 2023
Footnotes
Supplemental information can be found online at https://doi.org/10.1016/j.xgen.2023.100326.
Contributor Information
Yeda Wu, Email: yeda.wu@uq.net.au.
Naomi R. Wray, Email: naomi.wray@uq.edu.au.
Supplemental information
Data and code availability
-
•
GWAS association summary statistics for DivD-EUR and AgeO-EUR and SNP weights for polygenic score calculation have been deposited at https://cnsgenomics.com/content/data and are publicly available as of the date of publication. The data that support the findings of this study are available from UK Biobank (http://www.ukbiobank.ac.uk/). Restrictions apply to the availability of these data, which were used under license for the current study (ID: 12505). Data are available for bona fide researchers upon application to the UK Biobank. Data are available from the CARTaGENE Biobank (https://cartagene.qc.ca/en/index.html) for researchers who meet the criteria for access to de-identified CARTaGENE data. We used GWAS summary statistics for major depression that include data from 23andMe. These data can be obtained by qualified researchers under an agreement with 23andMe that protects the privacy of the 23andMe participants. Researchers can perform meta-analysis of 23andMe summary statistics and the other five-cohort results file, as described in Wray et al., to get major depression GWAS summary statistics.
-
•
This paper does not report original code.
-
•
Any additional information required to reanalyse the data reported in this paper is available from the lead contact upon request.
References
- 1.Tursi A., Scarpignato C., Strate L.L., Lanas A., Kruis W., Lahat A., Danese S. Colonic diverticular disease. Nat. Rev. Dis. Prim. 2020;6:20. doi: 10.1038/s41572-020-0153-5. [DOI] [PMC free article] [PubMed] [Google Scholar]
- 2.Peery A.F., Crockett S.D., Barritt A.S., Dellon E.S., Eluri S., Gangarosa L.M., Jensen E.T., Lund J.L., Pasricha S., Runge T., et al. Burden of gastrointestinal, liver, and pancreatic diseases in the United States. Gastroenterology. 2015;149:1731–1741.e3. doi: 10.1053/j.gastro.2015.08.045. [DOI] [PMC free article] [PubMed] [Google Scholar]
- 3.Reichert M.C., Lammert F. The genetic epidemiology of diverticulosis and diverticular disease: emerging evidence. United European Gastroenterol. J. 2015;3:409–418. doi: 10.1177/2050640615576676. [DOI] [PMC free article] [PubMed] [Google Scholar]
- 4.Delvaux M. Diverticular disease of the colon in Europe: epidemiology, impact on citizen health and prevention. Aliment. Pharmacol. Ther. 2003;18:71–74. doi: 10.1046/j.0953-0673.2003.01720.x. [DOI] [PubMed] [Google Scholar]
- 5.Peery A.F., Crockett S.D., Murphy C.C., Jensen E.T., Kim H.P., Egberg M.D., Lund J.L., Moon A.M., Pate V., Barnes E.L., et al. Burden and cost of gastrointestinal, liver, and pancreatic diseases in the United States: update 2021. Gastroenterology. 2022;162:621–644. doi: 10.1053/j.gastro.2021.10.017. [DOI] [PMC free article] [PubMed] [Google Scholar]
- 6.Tursi A. Diverticulosis today: unfashionable and still under-researched. Therap. Adv. Gastroenterol. 2016;9:213–228. doi: 10.1177/1756283X15621228. [DOI] [PMC free article] [PubMed] [Google Scholar]
- 7.Reddy V.B., Longo W.E. The burden of diverticular disease on patients and healthcare systems. Gastroenterol. Hepatol. 2013;9:21–27. [PMC free article] [PubMed] [Google Scholar]
- 8.Sigurdsson S., Alexandersson K.F., Sulem P., Feenstra B., Gudmundsdottir S., Halldorsson G.H., Olafsson S., Sigurdsson A., Rafnar T., Thorgeirsson T., et al. Sequence variants in ARHGAP15, COLQ and FAM155A associate with diverticular disease and diverticulitis. Nat. Commun. 2017;8 doi: 10.1038/ncomms15789. [DOI] [PMC free article] [PubMed] [Google Scholar]
- 9.Maguire L.H., Handelman S.K., Du X., Chen Y., Pers T.H., Speliotes E.K. Genome-wide association analyses identify 39 new susceptibility loci for diverticular disease. Nat. Genet. 2018;50:1359–1365. doi: 10.1038/s41588-018-0203-z. [DOI] [PMC free article] [PubMed] [Google Scholar]
- 10.Schafmayer C., Harrison J.W., Buch S., Lange C., Reichert M.C., Hofer P., Cossais F., Kupcinskas J., von Schönfels W., Schniewind B., et al. Genome-wide association analysis of diverticular disease points towards neuromuscular, connective tissue and epithelial pathomechanisms. Gut. 2019;68:854–865. doi: 10.1136/gutjnl-2018-317619. [DOI] [PubMed] [Google Scholar]
- 11.Granlund J., Svensson T., Olén O., Hjern F., Pedersen N.L., Magnusson P.K.E., Schmidt P.T. The genetic influence on diverticular disease--a twin study. Aliment. Pharmacol. Ther. 2012;35:1103–1107. doi: 10.1111/j.1365-2036.2012.05069.x. [DOI] [PubMed] [Google Scholar]
- 12.Strate L.L., Erichsen R., Baron J.A., Mortensen J., Pedersen J.K., Riis A.H., Christensen K., Sørensen H.T. Heritability and familial aggregation of diverticular disease: a population-based study of twins and siblings. Gastroenterology. 2013;144:736–742.e1. doi: 10.1053/j.gastro.2012.12.030. [DOI] [PubMed] [Google Scholar]
- 13.Wu Y., Murray G.K., Byrne E.M., Sidorenko J., Visscher P.M., Wray N.R. GWAS of peptic ulcer disease implicates Helicobacter pylori infection, other gastrointestinal disorders and depression. Nat. Commun. 2021;12:1146. doi: 10.1038/s41467-021-21280-7. [DOI] [PMC free article] [PubMed] [Google Scholar]
- 14.Yang, J., Ferreira, T., Morris, A.P., Medland, S.E., Genetic Investigation of, An.T.C., Replication, D. Ia.G., Meta-analysis, C., Madden, P.A.F., Heath, A.C., Martin, N.G., et al. (2012). Conditional and joint multiple-SNP analysis of GWAS summary statistics identifies additional variants influencing complex traits. Nat. Genet. 44, 369–375. 10.1038/ng.2213. [DOI] [PMC free article] [PubMed]
- 15.Zheng T., Ellinghaus D., Juzenas S., Cossais F., Burmeister G., Mayr G., Jørgensen I.F., Teder-Laving M., Skogholt A.H., Chen S., et al. Genome-wide analysis of 944 133 individuals provides insights into the etiology of haemorrhoidal disease. Gut. 2021;70:1538–1549. doi: 10.1136/gutjnl-2020-323868. [DOI] [PMC free article] [PubMed] [Google Scholar]
- 16.Bonfiglio F., Liu X., Smillie C., Pandit A., Kurilshikov A., Bacigalupe R., Zheng T., Nim H., Garcia-Etxebarria K., Bujanda L., et al. GWAS of stool frequency provides insights into gastrointestinal motility and irritable bowel syndrome. Cell Genom. 2021;1 doi: 10.1016/j.xgen.2021.100069. [DOI] [PMC free article] [PubMed] [Google Scholar]
- 17.Finucane H.K., Bulik-Sullivan B., Gusev A., Trynka G., Reshef Y., Loh P.-R., Anttila V., Xu H., Zang C., Farh K., et al. Partitioning heritability by functional annotation using genome-wide association summary statistics. Nat. Genet. 2015;47:1228–1235. doi: 10.1038/ng.3404. [DOI] [PMC free article] [PubMed] [Google Scholar]
- 18.GTEx Consortium Genetic effects on gene expression across human tissues. Nature. 2017;550:204–213. doi: 10.1038/nature24277. [DOI] [PMC free article] [PubMed] [Google Scholar]
- 19.Drokhlyansky E., Smillie C.S., Van Wittenberghe N., Ericsson M., Griffin G.K., Eraslan G., Dionne D., Cuoco M.S., Goder-Reiser M.N., Sharova T., et al. The human and mouse enteric nervous system at single-cell resolution. Cell. 2020;182:1606–1622.e23. doi: 10.1016/j.cell.2020.08.003. [DOI] [PMC free article] [PubMed] [Google Scholar]
- 20.Finucane H.K., Reshef Y.A., Anttila V., Slowikowski K., Gusev A., Byrnes A., Gazal S., Loh P.-R., Lareau C., Shoresh N., et al. Heritability enrichment of specifically expressed genes identifies disease-relevant tissues and cell types. Nat. Genet. 2018;50:621–629. doi: 10.1038/s41588-018-0081-4. [DOI] [PMC free article] [PubMed] [Google Scholar]
- 21.de Lange K.M., Moutsianas L., Lee J.C., Lamb C.A., Luo Y., Kennedy N.A., Jostins L., Rice D.L., Gutierrez-Achury J., Ji S.-G., et al. Genome-wide association study implicates immune activation of multiple integrin genes in inflammatory bowel disease. Nat. Genet. 2017;49:256–261. doi: 10.1038/ng.3760. [DOI] [PMC free article] [PubMed] [Google Scholar]
- 22.Heinz-Erian P., Müller T., Krabichler B., Schranz M., Becker C., Rüschendorf F., Nürnberg P., Rossier B., Vujic M., Booth I.W., et al. Mutations in SPINT2 cause a syndromic form of congenital sodium diarrhea. Am. J. Hum. Genet. 2009;84:188–196. doi: 10.1016/j.ajhg.2009.01.004. [DOI] [PMC free article] [PubMed] [Google Scholar]
- 23.Lloyd-Jones L.R., Zeng J., Sidorenko J., Yengo L., Moser G., Kemper K.E., Wang H., Zheng Z., Magi R., Esko T., et al. Improved polygenic prediction by Bayesian multiple regression on summary statistics. Nat. Commun. 2019;10:5086. doi: 10.1038/s41467-019-12653-0. [DOI] [PMC free article] [PubMed] [Google Scholar]
- 24.Awadalla P., Boileau C., Payette Y., Idaghdour Y., Goulet J.-P., Knoppers B., Hamet P., Laberge C., CARTaGENE Project. on behalf of the CARTaGENE Project Cohort profile of the CARTaGENE study: quebec’s population-based biobank for public health and personalized genomics. Int. J. Epidemiol. 2013;42:1285–1299. doi: 10.1093/ije/dys160. [DOI] [PubMed] [Google Scholar]
- 25.Bulik-Sullivan B., Finucane H.K., Anttila V., Gusev A., Day F.R., Loh P.R., Duncan L. ReproGen Consortium; Psychiatric Genomics Consortium; Genetic Consortium for Anorexia Nervosa of the Wellcome Trust Case Control Consortium 3, Duncan L., et al. An atlas of genetic correlations across human diseases and traits. Nat. Genet. 2015;47:1236–1241. doi: 10.1038/ng.3406. [DOI] [PMC free article] [PubMed] [Google Scholar]
- 26.Jung H.-K., Choung R.S., Locke G.R., Schleck C.D., Zinsmeister A.R., Talley N.J. Diarrhea-predominant irritable bowel syndrome is associated with diverticular disease: a population-based study. Am. J. Gastroenterol. 2010;105:652–661. doi: 10.1038/ajg.2009.621. [DOI] [PMC free article] [PubMed] [Google Scholar]
- 27.Khera A.V., Chaffin M., Aragam K.G., Haas M.E., Roselli C., Choi S.H., Natarajan P., Lander E.S., Lubitz S.A., Ellinor P.T., Kathiresan S. Genome-wide polygenic scores for common diseases identify individuals with risk equivalent to monogenic mutations. Nat. Genet. 2018;50:1219–1224. doi: 10.1038/s41588-018-0183-z. [DOI] [PMC free article] [PubMed] [Google Scholar]
- 28.Ferreira M.A.R., Vonk J.M., Baurecht H., Marenholz I., Tian C., Hoffman J.D., Helmer Q., Tillander A., Ullemar V., Lu Y., et al. Age-of-onset information helps identify 76 genetic variants associated with allergic disease. PLoS Genet. 2020;16 doi: 10.1371/journal.pgen.1008725. [DOI] [PMC free article] [PubMed] [Google Scholar]
- 29.Kuchenbaecker K.B., McGuffog L., Barrowdale D., Lee A., Soucy P., Dennis J., Domchek S.M., Robson M., Spurdle A.B., Ramus S.J., et al. Evaluation of polygenic risk scores for breast and ovarian cancer risk prediction in BRCA1 and BRCA2 mutation carriers. J. Natl. Cancer Inst. 2017;109:djw302. doi: 10.1093/jnci/djw302. [DOI] [PMC free article] [PubMed] [Google Scholar]
- 30.Wedel T., Barrenschee M., Lange C., Cossais F., Böttner M. Morphologic basis for developing diverticular disease, diverticulitis, and diverticular bleeding. Viszeralmedizin. 2015;31:76–82. doi: 10.1159/000381431. [DOI] [PMC free article] [PubMed] [Google Scholar]
- 31.Matrana M.R., Margolin D.A. Epidemiology and pathophysiology of diverticular disease. Clin. Colon Rectal Surg. 2009;22:141–146. doi: 10.1055/s-0029-1236157. [DOI] [PMC free article] [PubMed] [Google Scholar]
- 32.Rood J.E., Maartens A., Hupalowska A., Teichmann S.A., Regev A. Impact of the human cell atlas on medicine. Nat. Med. 2022;28:2486–2496. doi: 10.1038/s41591-022-02104-7. [DOI] [PubMed] [Google Scholar]
- 33.Hellwig I., Böttner M., Barrenschee M., Harde J., Egberts J.-H., Becker T., Wedel T. Alterations of the enteric smooth musculature in diverticular disease. J. Gastroenterol. 2014;49:1241–1252. doi: 10.1007/s00535-013-0886-y. [DOI] [PubMed] [Google Scholar]
- 34.Whiteway J., Morson B.C. Elastosis in diverticular disease of the sigmoid colon. Gut. 1985;26:258–266. doi: 10.1136/gut.26.3.258. [DOI] [PMC free article] [PubMed] [Google Scholar]
- 35.Broad J.B., Wu Z., Clark T.G., Musson D., Jaung R., Arroll B., Bissett I.P., Connolly M.J. Diverticulosis and nine connective tissue disorders: epidemiological support for an association. Connect. Tissue Res. 2019;60:389–398. doi: 10.1080/03008207.2019.1570169. [DOI] [PubMed] [Google Scholar]
- 36.Erdmann J. What can we learn from common variants associated with unexpected phenotypes in rare genetic diseases? Orphanet J. Rare Dis. 2021;16:41. doi: 10.1186/s13023-021-01684-w. [DOI] [PMC free article] [PubMed] [Google Scholar]
- 37.Armulik A., Genové G., Betsholtz C. Pericytes: developmental, physiological, and pathological perspectives, problems, and promises. Dev. Cell. 2011;21:193–215. doi: 10.1016/j.devcel.2011.07.001. [DOI] [PubMed] [Google Scholar]
- 38.Parks T.G., Connell A.M. Motility studies in diverticular disease of the colon. Gut. 1969;10:534–542. doi: 10.1136/gut.10.7.534. [DOI] [PMC free article] [PubMed] [Google Scholar]
- 39.Bassotti G., Battaglia E., Spinozzi F., Pelli M.A., Tonini M. Twenty-four hour recordings of colonic motility in patients with diverticular disease: evidence for abnormal motility and propulsive activity. Dis. Colon Rectum. 2001;44:1814–1820. doi: 10.1007/BF02234460. [DOI] [PubMed] [Google Scholar]
- 40.Böttner M., Barrenschee M., Hellwig I., Harde J., Egberts J.-H., Becker T., Zorenkov D., Schäfer K.H., Wedel T. The GDNF system is altered in diverticular disease – implications for pathogenesis. PLoS One. 2013;8 doi: 10.1371/journal.pone.0066290. [DOI] [PMC free article] [PubMed] [Google Scholar]
- 41.Bassotti G., Battaglia E., Bellone G., Dughera L., Fisogni S., Zambelli C., Morelli A., Mioli P., Emanuelli G., Villanacci V. Interstitial cells of Cajal, enteric nerves, and glial cells in colonic diverticular disease. J. Clin. Pathol. 2005;58:973–977. doi: 10.1136/jcp.2005. 026112. [DOI] [PMC free article] [PubMed] [Google Scholar]
- 42.Wedel T., Büsing V., Heinrichs G., Nohroudi K., Bruch H., Roblick U.J., Böttner M. Diverticular disease is associated with an enteric neuropathy as revealed by morphometric analysis. Neuro Gastroenterol. Motil. 2010;22:407-e94. doi: 10.1111/j.1365-2982.2009.01445.x. [DOI] [PubMed] [Google Scholar]
- 43.Jin B., Ha S.E., Wei L., Singh R., Zogg H., Clemmensen B., Heredia D.J., Gould T.W., Sanders K.M., Ro S. Colonic motility is improved by the activation of 5-HT2B receptors on interstitial cells of cajal in diabetic mice. Gastroenterology. 2021;161:608–622.e7. doi: 10.1053/j.gastro.2021.04.040. [DOI] [PMC free article] [PubMed] [Google Scholar]
- 44.Sugisawa E., Takayama Y., Takemura N., Kondo T., Hatakeyama S., Kumagai Y., Sunagawa M., Tominaga M., Maruyama K. RNA sensing by gut Piezo1 is essential for systemic serotonin synthesis. Cell. 2020;182:609–624.e21. doi: 10.1016/j.cell.2020.06.022. [DOI] [PubMed] [Google Scholar]
- 45.Alcaino C., Knutson K.R., Treichel A.J., Yildiz G., Strege P.R., Linden D.R., Li J.H., Leiter A.B., Szurszewski J.H., Farrugia G., Beyder A. A population of gut epithelial enterochromaffin cells is mechanosensitive and requires Piezo2 to convert force into serotonin release. Proc. Natl. Acad. Sci. USA. 2018;115:E7632–E7641. doi: 10.1073/pnas.1804938115. [DOI] [PMC free article] [PubMed] [Google Scholar]
- 46.Klein S., Seidler B., Kettenberger A., Sibaev A., Rohn M., Feil R., Allescher H.-D., Vanderwinden J.-M., Hofmann F., Schemann M., et al. Interstitial cells of Cajal integrate excitatory and inhibitory neurotransmission with intestinal slow-wave activity. Nat. Commun. 2013;4:1630. doi: 10.1038/ncomms2626. [DOI] [PubMed] [Google Scholar]
- 47.Corfield A.P. The interaction of the gut microbiota with the mucus barrier in health and disease in human. Microorganisms. 2018;6 doi: 10.3390/microorganisms6030078. [DOI] [PMC free article] [PubMed] [Google Scholar]
- 48.Williams S.J., McGuckin M.A., Gotley D.C., Eyre H.J., Sutherland G.R., Antalis T.M. Two novel mucin genes down-regulated in colorectal cancer identified by differential display. Cancer Res. 1999;59:4083–4089. [PubMed] [Google Scholar]
- 49.Grondin J.A., Kwon Y.H., Far P.M., Haq S., Khan W.I. Mucins in intestinal mucosal defense and inflammation: learning from clinical and experimental studies. Front. Immunol. 2020;11:2054. doi: 10.3389/fimmu.2020.02054. [DOI] [PMC free article] [PubMed] [Google Scholar]
- 50.Barbara G., Scaioli E., Barbaro M.R., Biagi E., Laghi L., Cremon C., Marasco G., Colecchia A., Picone G., Salfi N., et al. Gut microbiota, metabolome and immune signatures in patients with uncomplicated diverticular disease. Gut. 2017;66:1252–1261. doi: 10.1136/gutjnl-2016-312377. [DOI] [PubMed] [Google Scholar]
- 51.Lindén S.K., Sheng Y.H., Every A.L., Miles K.M., Skoog E.C., Florin T.H.J., Sutton P., McGuckin M.A. MUC1 limits Helicobacter pylori infection both by steric hindrance and by acting as a releasable decoy. PLoS Pathog. 2009;5 doi: 10.1371/journal.ppat.1000617. [DOI] [PMC free article] [PubMed] [Google Scholar]
- 52.Jenkin K.A., Han Y., Lin S., He P., Yun C.C. Nedd4-2-dependent ubiquitination potentiates the inhibition of human NHE3 by cholera toxin and enteropathogenic Escherichia coli. Cell. Mol. Gastroenterol. Hepatol. 2022;13:695–716. doi: 10.1016/j.jcmgh.2021.11.006. [DOI] [PMC free article] [PubMed] [Google Scholar]
- 53.Yuan S., Larsson S.C. Genetically predicted adiposity, diabetes, and lifestyle factors in relation to diverticular disease. Clin. Gastroenterol. Hepatol. 2022;20:1077–1084. doi: 10.1016/j.cgh.2021.06.013. [DOI] [PubMed] [Google Scholar]
- 54.Davies N.M., Holmes M.V., Davey Smith G. Reading Mendelian randomisation studies: a guide, glossary, and checklist for clinicians. Br. Med. J. Int. Ed. 2018;362 doi: 10.1136/bmj.k601. [DOI] [PMC free article] [PubMed] [Google Scholar]
- 55.Bryois J., Skene N.G., Hansen T.F., Kogelman L.J.A., Watson H.J., Liu Z. Eating Disorders Working Group of the Psychiatric Genomics Consortium, International Headache Genetics Consortium, 23andMe Research Team, Brueggeman L., Breen G., et al. Genetic identification of cell types underlying brain complex traits yields insights into the etiology of Parkinson’s disease. Nat. Genet. 2020;52:482–493. doi: 10.1038/s41588-020-0610-9. [DOI] [PMC free article] [PubMed] [Google Scholar]
- 56.Koscielny G., An P., Carvalho-Silva D., Cham J.A., Fumis L., Gasparyan R., Hasan S., Karamanis N., Maguire M., Papa E., et al. Open Targets: a platform for therapeutic target identification and validation. Nucleic Acids Res. 2017;45:D985–D994. doi: 10.1093/nar/gkw1055. [DOI] [PMC free article] [PubMed] [Google Scholar]
- 57.Köhler S., Gargano M., Matentzoglu N., Carmody L.C., Lewis-Smith D., Vasilevsky N.A., Danis D., Balagura G., Baynam G., Brower A.M., et al. The human phenotype ontology in 2021. Nucleic Acids Res. 2021;49:D1207–D1217. doi: 10.1093/nar/gkaa1043. [DOI] [PMC free article] [PubMed] [Google Scholar]
- 58.Chang C.C., Chow C.C., Tellier L.C., Vattikuti S., Purcell S.M., Lee J.J. Second-generation PLINK: rising to the challenge of larger and richer datasets. GigaScience. 2015;4:7. doi: 10.1186/s13742-015-0047-8. [DOI] [PMC free article] [PubMed] [Google Scholar]
- 59.Loh P.-R., Kichaev G., Gazal S., Schoech A.P., Price A.L. Mixed-model association for biobank-scale datasets. Nat. Genet. 2018;50:906–908. doi: 10.1038/s41588-018-0144-6. [DOI] [PMC free article] [PubMed] [Google Scholar]
- 60.Yang J., Lee S.H., Goddard M.E., Visscher P.M. GCTA: a tool for genome-wide complex trait analysis. Am. J. Hum. Genet. 2011;88:76–82. doi: 10.1016/j.ajhg.2010.11.011. [DOI] [PMC free article] [PubMed] [Google Scholar]
- 61.Zhou W., Nielsen J.B., Fritsche L.G., Dey R., Gabrielsen M.E., Wolford B.N., LeFaive J., VandeHaar P., Gagliano S.A., Gifford A., et al. Efficiently controlling for case-control imbalance and sample relatedness in large-scale genetic association studies. Nat. Genet. 2018;50:1335–1341. doi: 10.1038/s41588-018-0184-y. [DOI] [PMC free article] [PubMed] [Google Scholar]
- 62.Willer C.J., Li Y., Abecasis G.R. METAL: fast and efficient meta-analysis of genomewide association scans. Bioinformatics. 2010;26:2190–2191. doi: 10.1093/bioinformatics/btq340. [DOI] [PMC free article] [PubMed] [Google Scholar]
- 63.Pruim R.J., Welch R.P., Sanna S., Teslovich T.M., Chines P.S., Gliedt T.P., Boehnke M., Abecasis G.R., Willer C.J. LocusZoom: regional visualization of genome-wide association scan results. Bioinformatics. 2010;26:2336–2337. doi: 10.1093/bioinformatics/btq419. [DOI] [PMC free article] [PubMed] [Google Scholar]
- 64.Bulik-Sullivan B.K., Loh P.-R., Finucane H.K., Ripke S., Yang J., Schizophrenia Working Group of the Psychiatric Genomics Consortium. Patterson N., Daly M.J., Price A.L., Neale B.M. LD Score regression distinguishes confounding from polygenicity in genome-wide association studies. Nat. Genet. 2015;47:291–295. doi: 10.1038/ng.3211. [DOI] [PMC free article] [PubMed] [Google Scholar]
- 65.Skene N.G., Grant S.G.N. Identification of vulnerable cell types in major brain disorders using single cell transcriptomes and expression weighted cell type enrichment. Front. Neurosci. 2016;10:16. doi: 10.3389/fnins.2016.00016. [DOI] [PMC free article] [PubMed] [Google Scholar]
- 66.Weissbrod O., Hormozdiari F., Benner C., Cui R., Ulirsch J., Gazal S., Schoech A.P., van de Geijn B., Reshef Y., Márquez-Luna C., et al. Functionally informed fine-mapping and polygenic localization of complex trait heritability. Nat. Genet. 2020;52:1355–1363. doi: 10.1038/s41588-020-00735-5. [DOI] [PMC free article] [PubMed] [Google Scholar]
- 67.Zou Y., Carbonetto P., Wang G., Stephens M. Fine-mapping from summary data with the “sum of single effects” model. PLoS Genet. 2022;18:e1010299. doi: 10.1371/journal.pgen.1010299. [DOI] [PMC free article] [PubMed] [Google Scholar]
- 68.Bycroft C., Freeman C., Petkova D., Band G., Elliott L.T., Sharp K., Motyer A., Vukcevic D., Delaneau O., O’Connell J., et al. The UK Biobank resource with deep phenotyping and genomic data. Nature. 2018;562:203–209. doi: 10.1038/s41586-018-0579-z. [DOI] [PMC free article] [PubMed] [Google Scholar]
- 69.Yengo L., Sidorenko J., Kemper K.E., Zheng Z., Wood A.R., Weedon M.N., Frayling T.M., Hirschhorn J., Yang J., Visscher P.M., GIANT Consortium Meta-analysis of genome-wide association studies for height and body mass index in ∼700000 individuals of European ancestry. Hum. Mol. Genet. 2018;27:3641–3649. doi: 10.1093/hmg/ddy271. [DOI] [PMC free article] [PubMed] [Google Scholar]
- 70.Wang Y., Guo J., Ni G., Yang J., Visscher P.M., Yengo L. Theoretical and empirical quantification of the accuracy of polygenic scores in ancestry divergent populations. Nat. Commun. 2020;11:3865. doi: 10.1038/s41467-020-17719-y. [DOI] [PMC free article] [PubMed] [Google Scholar]
- 71.1000 Genomes Project Consortium. Auton A., Brooks L.D., Durbin R.M., Garrison E.P., Kang H.M., Korbel J.O., Marchini J.L., McCarthy S., McVean G.A., Abecasis G.R. A global reference for human genetic variation. Nature. 2015;526:68–74. doi: 10.1038/nature15393. [DOI] [PMC free article] [PubMed] [Google Scholar]
- 72.Wray N.R., Gottesman I.I. Using summary data from the Danish national registers to estimate heritabilities for schizophrenia, bipolar disorder, and major depressive disorder. Front. Genet. 2012;3:118. doi: 10.3389/fgene.2012.00118. [DOI] [PMC free article] [PubMed] [Google Scholar]
- 73.Falconer D.S. The inheritance of liability to certain diseases, estimated from the incidence among relatives. Ann. Hum. Genet. 1965;29:51–76. doi: 10.1111/j.1469-1809.1965.tb00500.x. [DOI] [Google Scholar]
- 74.REICH T., JAMES J.W., MORRIS C.A. The use of multiple thresholds in determining the mode of transmission of semi-continuous traits. Ann. Hum. Genet. 1972;36:163–184. doi: 10.1111/j.1469-1809.1972.tb00767.x. [DOI] [PubMed] [Google Scholar]
- 75.Lloyd-Jones L.R., Robinson M.R., Yang J., Visscher P.M. Transformation of summary statistics from linear mixed model association on all-or-none traits to odds ratio. Genetics. 2018;208:1397–1408. doi: 10.1534/genetics.117.300360. [DOI] [PMC free article] [PubMed] [Google Scholar]
- 76.Yang J., Zaitlen N.A., Goddard M.E., Visscher P.M., Price A.L. Advantages and pitfalls in the application of mixed-model association methods. Nat. Genet. 2014;46:100–106. doi: 10.1038/ng.2876. [DOI] [PMC free article] [PubMed] [Google Scholar]
- 77.Kent W.J., Sugnet C.W., Furey T.S., Roskin K.M., Pringle T.H., Zahler A.M., Haussler D. The human genome browser at UCSC. Genome Res. 2002;12:996–1006. doi: 10.1101/gr.229102. [DOI] [PMC free article] [PubMed] [Google Scholar]
- 78.Dennis J.K., Sealock J.M., Straub P., Lee Y.H., Hucks D., Actkins K., Faucon A., Feng Y.-C.A., Ge T., Goleva S.B., et al. Clinical laboratory test-wide association scan of polygenic scores identifies biomarkers of complex disease. Genome Med. 2021;13:6. doi: 10.1186/s13073-020-00820-8. [DOI] [PMC free article] [PubMed] [Google Scholar]
- 79.MacArthur J., Bowler E., Cerezo M., Gil L., Hall P., Hastings E., Junkins H., McMahon A., Milano A., Morales J., et al. The new NHGRI-EBI Catalog of published genome-wide association studies (GWAS Catalog) Nucleic Acids Res. 2017;45:D896–D901. doi: 10.1093/nar/gkw1133. [DOI] [PMC free article] [PubMed] [Google Scholar]
- 80.Zeisel A., Hochgerner H., Lönnerberg P., Johnsson A., Memic F., van der Zwan J., Häring M., Braun E., Borm L.E., La Manno G., et al. Molecular architecture of the mouse nervous system. Cell. 2018;174:999–1014.e22. doi: 10.1016/j.cell.2018.06.021. [DOI] [PMC free article] [PubMed] [Google Scholar]
- 81.Kerimov N., Hayhurst J.D., Peikova K., Manning J.R., Walter P., Kolberg L., Samoviča M., Sakthivel M.P., Kuzmin I., Trevanion S.J., et al. A compendium of uniformly processed human gene expression and splicing quantitative trait loci. Nat. Genet. 2021;53:1290–1299. doi: 10.1038/s41588-021-00924-w. [DOI] [PMC free article] [PubMed] [Google Scholar]
- 82.Hormozdiari F., van de Bunt M., Segrè A.V., Li X., Joo J.W.J., Bilow M., Sul J.H., Sankararaman S., Pasaniuc B., Eskin E. Colocalization of GWAS and eQTL signals detects target genes. Am. J. Hum. Genet. 2016;99:1245–1260. doi: 10.1016/j.ajhg.2016.10.003. [DOI] [PMC free article] [PubMed] [Google Scholar]
- 83.Lee S.H., Goddard M.E., Wray N.R., Visscher P.M. A better coefficient of determination for genetic profile analysis. Genet. Epidemiol. 2012;36:214–224. doi: 10.1002/gepi.21614. [DOI] [PubMed] [Google Scholar]
- 84.Cole J.B., Florez J.C., Hirschhorn J.N. Comprehensive genomic analysis of dietary habits in UK Biobank identifies hundreds of genetic associations. Nat. Commun. 2020;11:1467. doi: 10.1038/s41467-020-15193-0. [DOI] [PMC free article] [PubMed] [Google Scholar]
- 85.Meddens S.F.W., de Vlaming R., Bowers P., Burik C.A.P., Linnér R.K., Lee C., Okbay A., Turley P., Rietveld C.A., Fontana M.A., et al. Genomic analysis of diet composition finds novel loci and associations with health and lifestyle. Mol. Psychiatr. 2021;26:2056–2069. doi: 10.1038/s41380-020-0697-5. [DOI] [PMC free article] [PubMed] [Google Scholar]
- 86.Locke A.E., Kahali B., Berndt S.I., Justice A.E., Pers T.H., Day F.R., Powell C., Vedantam S., Buchkovich M.L., Yang J., et al. Genetic studies of body mass index yield new insights for obesity biology. Nature. 2015;518:197–206. doi: 10.1038/nature14177. [DOI] [PMC free article] [PubMed] [Google Scholar]
- 87.Shungin D., Winkler T.W., Croteau-Chonka D.C., Ferreira T., Locke A.E., Mägi R., Strawbridge R.J., Pers T.H., Fischer K., Justice A.E., et al. New genetic loci link adipose and insulin biology to body fat distribution. Nature. 2015;518:187–196. doi: 10.1038/nature14132. [DOI] [PMC free article] [PubMed] [Google Scholar]
- 88.Demontis D., Walters R.K., Martin J., Mattheisen M., Als T.D., Agerbo E., Baldursson G., Belliveau R., Bybjerg-Grauholm J., Bækvad-Hansen M., et al. Discovery of the first genome-wide significant risk loci for attention deficit/hyperactivity disorder. Nat. Genet. 2019;51:63–75. doi: 10.1038/s41588-018-0269-7. [DOI] [PMC free article] [PubMed] [Google Scholar]
- 89.Pardiñas A.F., Holmans P., Pocklington A.J., Escott-Price V., Ripke S., Carrera N., Legge S.E., Bishop S., Cameron D., Hamshere M.L., et al. Common schizophrenia alleles are enriched in mutation-intolerant genes and in regions under strong background selection. Nat. Genet. 2018;50:381–389. doi: 10.1038/s41588-018-0059-2. [DOI] [PMC free article] [PubMed] [Google Scholar]
- 90.Duncan L.E., Ratanatharathorn A., Aiello A.E., Almli L.M., Amstadter A.B., Ashley-Koch A.E., Baker D.G., Beckham J.C., Bierut L.J., Bisson J., et al. Largest GWAS of PTSD (N=20 070) yields genetic overlap with schizophrenia and sex differences in heritability. Mol. Psychiatr. 2018;23:666–673. doi: 10.1038/mp.2017.77. [DOI] [PMC free article] [PubMed] [Google Scholar]
- 91.Stahl E.A., Breen G., Forstner A.J., McQuillin A., Ripke S., Trubetskoy V., Mattheisen M., Wang Y., Coleman J.R.I., Gaspar H.A., et al. Genome-wide association study identifies 30 loci associated with bipolar disorder. Nat. Genet. 2019;51:793–803. doi: 10.1038/s41588-019-0397-8. [DOI] [PMC free article] [PubMed] [Google Scholar]
- 92.Grove J., Ripke S., Als T.D., Mattheisen M., Walters R.K., Won H., Pallesen J., Agerbo E., Andreassen O.A., Anney R., et al. Identification of common genetic risk variants for autism spectrum disorder. Nat. Genet. 2019;51:431–444. doi: 10.1038/s41588-019-0344-8. [DOI] [PMC free article] [PubMed] [Google Scholar]
- 93.Wray N.R., Ripke S., Mattheisen M., Trzaskowski M., Byrne E.M., Abdellaoui A., Adams M.J., Agerbo E., Air T.M., Andlauer T.M.F., et al. Genome-wide association analyses identify 44 risk variants and refine the genetic architecture of major depression. Nat. Genet. 2018;50:668–681. doi: 10.1038/s41588-018-0090-3. [DOI] [PMC free article] [PubMed] [Google Scholar]
- 94.Wu Y., Byrne E.M., Zheng Z., Kemper K.E., Yengo L., Mallett A.J., Yang J., Visscher P.M., Wray N.R. Genome-wide association study of medication-use and associated disease in the UK Biobank. Nat. Commun. 2019;10:1891. doi: 10.1038/s41467-019-09572-5. [DOI] [PMC free article] [PubMed] [Google Scholar]
- 95.Cai N., Revez J.A., Adams M.J., Andlauer T.F.M., Breen G., Byrne E.M., Clarke T.K., Forstner A.J., Grabe H.J., Hamilton S.P., et al. Minimal phenotyping yields genome-wide association signals of low specificity for major depression. Nat. Genet. 2020;52:437–447. doi: 10.1038/s41588-020-0594-5. [DOI] [PMC free article] [PubMed] [Google Scholar]
- 96.Otowa T., Hek K., Lee M., Byrne E.M., Mirza S.S., Nivard M.G., Bigdeli T., Aggen S.H., Adkins D., Wolen A., et al. Meta-analysis of genome-wide association studies of anxiety disorders. Mol. Psychiatr. 2016;21:1391–1399. doi: 10.1038/mp.2015.197. [DOI] [PMC free article] [PubMed] [Google Scholar]
- 97.Peery A.F., Keil A., Jicha K., Galanko J.A., Sandler R.S. Association of obesity with colonic diverticulosis in women. Clin. Gastroenterol. Hepatol. 2020;18:107–114.e1. doi: 10.1016/j.cgh.2019.04.058. [DOI] [PMC free article] [PubMed] [Google Scholar]
- 98.Aschard H., Vilhjálmsson B.J., Joshi A.D., Price A.L., Kraft P. Adjusting for heritable covariates can bias effect estimates in genome-wide association studies. Am J Hum Genet. 2015;96:329–339. doi: 10.1016/j.ajhg.2014.12.021. [DOI] [PMC free article] [PubMed] [Google Scholar]
- 99.Caprilli R. Why does Crohn’s disease usually occur in terminal ileum? J. Crohns Colitis. 2008;2:352–356. doi: 10.1016/j.crohns.2008.06.001. [DOI] [PubMed] [Google Scholar]
- 100.Graham D.B., Xavier R.J. Pathway paradigms revealed from the genetics of inflammatory bowel disease. Nature. 2020;578:527–539. doi: 10.1038/s41586-020-2025-2. [DOI] [PMC free article] [PubMed] [Google Scholar]
Associated Data
This section collects any data citations, data availability statements, or supplementary materials included in this article.
Supplementary Materials
Data Availability Statement
-
•
GWAS association summary statistics for DivD-EUR and AgeO-EUR and SNP weights for polygenic score calculation have been deposited at https://cnsgenomics.com/content/data and are publicly available as of the date of publication. The data that support the findings of this study are available from UK Biobank (http://www.ukbiobank.ac.uk/). Restrictions apply to the availability of these data, which were used under license for the current study (ID: 12505). Data are available for bona fide researchers upon application to the UK Biobank. Data are available from the CARTaGENE Biobank (https://cartagene.qc.ca/en/index.html) for researchers who meet the criteria for access to de-identified CARTaGENE data. We used GWAS summary statistics for major depression that include data from 23andMe. These data can be obtained by qualified researchers under an agreement with 23andMe that protects the privacy of the 23andMe participants. Researchers can perform meta-analysis of 23andMe summary statistics and the other five-cohort results file, as described in Wray et al., to get major depression GWAS summary statistics.
-
•
This paper does not report original code.
-
•
Any additional information required to reanalyse the data reported in this paper is available from the lead contact upon request.