

Abstract
Spinocerebellar ataxias (SCAs) are progressive neurodegenerative disorders, but there is no metric that predicts disease severity over time. We hypothesized that by developing a new metric, the Severity Factor (S-Factor) using immutable disease parameters, it would be possible to capture disease severity independent of clinical rating scales. Extracting data from the CRC-SCA and READISCA natural history studies, we calculated the S-Factor for 438 participants with symptomatic SCA1, SCA2, SCA3, or SCA6, as follows: ((length of CAG repeat expansion – maximum normal repeat length) /maximum normal repeat length) × (current age – age at disease onset) × 10). Within each SCA type, the S-Factor at the first Scale for the Assessment and Rating of Ataxia (SARA) visit (baseline) was correlated against scores on SARA and other motor and cognitive assessments. In 281 participants with longitudinal data, the slope of the S-Factor over time was correlated against slopes of scores on SARA and other motor rating scales. At baseline, the S-Factor showed moderate-to-strong correlations with SARA and other motor rating scales at the group level, but not with cognitive performance. Longitudinally the S-Factor slope showed no consistent association with the slope of performance on motor scales. Approximately 30% of SARA slopes reflected a trend of non-progression in motor symptoms. The S-Factor is an observer-independent metric of disease burden in SCAs. It may be useful at the group level to compare cohorts at baseline in clinical studies. Derivation and examination of the S-factor highlighted challenges in the use of clinical rating scales in this population.
Keywords: Spinocerebellar ataxia, Disease progression, Natural history, Scale for the Assessment, Rating of Ataxia
Inherited neurodegenerative spinocerebellar ataxias (SCAs) become clinically more manifest over time, degrading quality of life and often shortening lifespan. There are multiple biological pathways leading to neuronal dysfunction and cell death in the SCAs, even amongst the glutamine encoding CAG repeat disorders, or polyglutamine ataxias. Emerging therapeutic approaches to these disorders include disease-specific interventions, such as antisense oligonucleotides (ASO) and gene editing techniques, and symptomatic treatments aimed at disrupting down-stream mechanisms of disease or ameliorating downstream effects on common targets including mitochondrial damage and neuronal excitotoxicity. The ability to measure disease severity and change over time or in response to intervention is a key metric in the development and monitoring of novel treatment strategies. Observer administered ataxia rating scales have been the mainstay of the evaluation process, but this has proven to be challenging, and these scales are now complemented by patient reported measures including the PROM-Ataxia ([35]), the emergence of quantitative instrumented assessments of motor control [11, 37, 43], imaging parameters including morphometric MRI and MR spectroscopy [28, 31], and fluid biomarkers such as NfL [4].
SCA types 1, 2, 3, and 6, caused by heterozygous expansion of CAG repeats in their respective genes, are the most prevalent SCAs worldwide [15], and the subject of natural history studies and clinical trials. Longer CAG repeat length in the expanded allele in these disorders is associated with earlier age of disease onset (AO) [7, 10, 14, 41]. Missing from this comprehensive set of evaluations of the inherited ataxias, however, is a metric that is independent of the clinical rating scales, automated measures of clinical phenomenology, or image-based assessments, and that has the power to predict disease burden at the group level, or at the individual level at any point along the course of the illness. We hypothesized that immutable disease factors unique to each individual can predict the trajectory and severity of disease over time. If such a metric existed, it may guide and validate clinical and other biomarkers, and help determine whether novel interventions attenuate the arc of the predicted trajectory.
To test this hypothesis, we introduce and examine a potential new metric of disease burden in SCA 1, 2, 3, and 6, the Severity Factor (S-Factor), predicated both on an individual’s genetic burden and the duration of disease. We correlated the S-Factor with ataxia rating scales, notably the Scale for Assessment and Rating of Ataxia (SARA; [36]), that are widely used as proxy measures of disease severity. We show that the S-Factor and baseline SARA scores are moderate to strongly correlated at the group level, and have a weak correlation at the individual level. The S-Factor, however, does not predict the trajectory of the SARA score over time at either the group or the individual level. We investigate the possible reasons for the success and failure of the S-Factor, and in so doing, provide critical insights into the natural history of the polyglutamine ataxias and underscore the challenges inherent in their clinical assessment, in terms of natural history studies and the determination of outcome measures for clinical trials.
Methods
Data were extracted from the US databases of two ongoing natural history studies: the Clinical Research Consortium for the Study of Cerebellar Ataxia (CRC-SCA; 2009-) and Clinical Trial Readiness for SCA1 and SCA3 (READISCA; 2018-) [21]. Participants undertook a series of clinical assessments at approximately 6-month intervals for CRC-SCA and annually for READISCA. Both studies had ongoing participant enrolment at the time of our analysis.
The examinations of interest in this analysis were the Scale for the Assessment and Rating of Ataxia (SARA), Brief Ataxia Rating Scale (BARS), the Cerebellar Cognitive Affective/Schmahmann Syndrome Scale (CCAS-S), the Composite Cerebellar Functional Severity Score (CCFS), the 25-foot walk test, and the Functional Staging of Ataxia Scale.
The SARA (Schmitz-Hubsch et al., 2006) is an 8-item neurological examination. The total scale score ranges from 0 to 40, with higher scores indicating greater motor impairment. The scale comprises examiner ratings of performance for gait, stance, sitting, speech, finger chase, nose-finger, fast alternating hand movements, and heel-shin slide.
The BARS [34] is a 5-item neurological examination evaluating gait, heel-to-shin, finger-to-nose, speech, and oculomotor performance. The total scale score ranges from 0 to 30, with higher scores indicating greater motor impairment.
The CCAS-S [13] is a 10-domain cognitive screening assessment designed to identify the Cerebellar Cognitive Affective Syndrome (CCAS) in individuals with a known cerebellar disease or injury. The total scale raw score ranges from 0 to 120, with higher scores indicating better cognitive performance. There is additionally a Pass/Fail score for each domain (fail score range = 0–10), with lower fail scores indicating better cognitive performance.
The Functional Staging of Ataxia Scale is a 1-item scale included in the Friedreich Ataxia Rating Scale [38] which indicates an individual’s overall functional ability based on motor symptoms. Scores range from 0 (normal) to 6 (total disability).
The CCFS [39] was administered in the READISCA study only, and combines performances from two upper-limb tasks completed with the dominant hand: the nine-hole pegboard test (inserting pegs into a board with nine holes), and the click test (using the index finger to alternately press two buttons, 10 times). A CCFS score is calculated based on participant age and the time taken to complete the tasks [39]. A higher CCFS reflects poorer performance.
The 25-foot walk test involves two trials of walking a 25-foot distance, with the use of an assistive device permitted. The time taken to complete each trial is recorded.
Participants
Participants in the databases were eligible for inclusion in our analysis if they were symptomatic for SCA1, SCA2, SCA3, or SCA6 and had completed at least one SARA assessment. Of the 605 subjects in the database matching these criteria, two were excluded because the reported disease history was deemed clinically implausible based on the available data. Of the remaining 603 subjects, 165 had missing or invalid AO, age, or genetic data. The remaining 438 eligible participants were included in the S-Factor analyses. Characteristics of those eligible participants at the first SARA visit within this dataset (the “baseline” visit) are in Table 1. The earliest baseline visit took place in April 2010, and the latest in November 2021. Twenty study sites contributed data to the current study (see Supplementary Fig. 1).
Table 1.
Baseline characteristics of the S-Factor sample
| SCA1 (N=82) | SCA2 (N=81) | SCA3 (N=203) | SCA6 (N=72) | Overall (N=438) | |
|---|---|---|---|---|---|
| Age (years) | 50.0 (12.5), [25.4, 82.7] | 46.2 (12.4), [14.5, 67.4] | 49.6 (12.0), [18.0, 74.4] | 62.8 (9.89), [31.2, 80.2] | 51.2 (13.0), [14.5, 82.7] |
| Gender (female;male) | 47;35 | 43;38 | 106;97 | 40;32 | 236;202 |
| Total SARA score | 11.8 (7.18), [0.5, 34.0] | 14.4 (5.97), [1.0, 34.0] | 11.4 (7.34), [0, 33.0] | 13.3 (7.21), [0.5, 32.0] | 12.4 (7.13), [0, 34.0] |
| Age at disease onset (years) | 41.3 (11.1), [19.0, 65.0] | 36.4 (11.9), [4.00, 62.0] | 39.8 (11.7), [10.0, 69.0] | 52.8 (9.65), [25.0, 70.0] | 41.6 (12.4), [4.00, 70.0] |
| Disease duration (years) | 8.67 (6.30), [0.0100, 26.8] | 9.77 (5.90), [0.320, 26.9] | 9.74 (8.45), [0, 48.2] | 10.0 (9.13), [0.500, 43.1] | 9.59 (7.78), [0, 48.2] |
| CAG expansion repeat length | 46.6 (4.63), [39.0, 60.0] | 39.8 (3.68), [34.0, 60.0] | 71.5 (4.51), [55.0, 83.0] | 22.3 (0.813), [21.0, 26.0] | 52.9 (19.2), [21.0, 83.0] |
| Maximum healthy repeat length ^ | 35 | 32 | 44 | 14 | - |
IRB approval was obtained for study procedures at all sites, and all participants gave informed consent.
Age at Disease Onset Evaluation
AO data points (i.e., the ages at onset of different symptoms) were reviewed for each participant. Age at onset of ataxia was defined as the age at onset of “walking problems,” where this information was available (428/438 participants). In 10 other cases, the AO of walking problems was not reported, and AO of ataxia was defined instead by age at onset of speech problems (n = 2), balance problems (n = 6), falling (n = 1), or hand problems (n = 1).
Statistical Analyses
Statistical analyses and graphical outputs were generated using RStudio Server Pro (R Version 3.5.3).
Baseline Analysis: Formulation and Analysis of the S‑Factor
In developing the S-Factor equation, we initially adopted the a priori assumption that disease burden would be impacted by the amount of genetic pathology (length of the CAG repeat expansion), length of time with the clinical manifestations of disease (disease duration), and AO because of the established correlation between expansion length and AO. To test this assumption, we determined the strength of each variable by correlating it against disease severity as measured by SARA total score. As described in the “Results” section, we observed that whereas CAG expansion (in the case of SCA1) and disease duration (for SCA1, SCA2, SCA3, and SCA6) correlated with SARA score, AO did not. We therefore designed the S-Factor equation of disease burden to incorporate CAG expansion and length of clinically manifest disease, but not AO as an independent variable. The S-Factor equation represents the genetic burden (number of CAG repeats in the expanded allele, , relative to the maximum repeat length in an unaffected allele, i.e., the upper limit of repeat lengths in controls,), multiplied by disease duration. The result is multiplied by 10 for practical purposes.
is the number of repeats in the CAG repeat expansion, is the maximum number of repeats in the normal, non-expanded allele, and AO is the age at disease onset.
The S-Factor was then correlated against baseline SARA total score for each of the four SCA types, as well as the CCAS-S total raw score, BARS total score, Functional Staging of Ataxia score, CCFS, and the mean of the two 25-foot walk trial times (where these examinations were conducted within 31 days of the SARA examination date).
The ability of the clinically-derived S-Factor to predict baseline SARA score across individuals was also compared to the ability of CAG, AO, disease duration, and gender to predict SARA when combined in a multivariate linear regression, within each SCA type. This allowed insights into the independent contribution of each of these variables, to SARA performance. Further details of the methodology (k-fold cross-validation method) are provided in the Supplementary Materials.
Longitudinal Analyses
Amongst the 603 participants in the database who were symptomatic for SCA1, SCA2, SCA3, or SCA6, the total number of study visits involving a SARA examination ranged from 1 to 9. There were 356 participants with ≥ 2 SARA visits. Of these, 281 were included in longitudinal analyses involving the S-Factor because they had the requisite variables for the S-Factor calculation (baseline characteristics summarized in Table 2), while 75 were excluded because of missing or invalid data for AO, current age, or CAG repeat length.
Table 2.
Characteristics of the longitudinal S-Factor cohort
| SCA1 (N=54) | SCA2 (N=56) | SCA3 (N=121) | SCA6 (N=50) | Overall (N=281) | |
|---|---|---|---|---|---|
| Baseline age | 49.2 (10.6), [25.4, 68.9] | 47.0 (12.3), [14.5, 67.4] | 49.9 (11.0), [19.6, 73.5] | 62.4 (10.3), [31.2, 80.2] | 51.4 (12.2), [14.5, 80.2] |
| Gender (female;male) | 32;22 | 32;24 | 59;62 | 29;21 | 152;129 |
| Baseline total SARA score | 9.68 (5.25), [1.00, 28.5] | 14.6 (5.27), [5.50, 28.0] | 11.2 (7.64), [0.500, 33.0] | 12.9 (7.09), [2.00, 32.0] | 11.9 (6.88), [0.500, 33.0] |
| Age at disease onset | 41.4 (10.2), [24.0, 65.0] | 36.7 (12.1), [4.00, 62.0] | 40.3 (11.6), [15.0, 68.0] | 52.8 (10.5), [25.0, 70.0] | 42.0 (12.4), [4.00, 70.0] |
| Baseline disease duration | 7.73 (5.12), [0.0100, 25.0] | 10.3 (6.03), [0.320, 26.9] | 9.56 (8.72), [0, 48.2] | 9.56 (9.58), [0.500, 43.1] | 9.36 (7.84), [0, 48.2] |
| CAG expansion repeat length | 46.4 (3.68), [41.0, 56.0] | 39.9 (4.12), [34.0, 60.0] | 71.6 (4.01), [60.0, 81.0] | 22.4 (0.942), [21.0, 26.0] | 51.7 (19.2), [21.0, 81.0] |
| Number of visits with a SARA assessment | 3.17 (1.34), [2.00, 7.00] | 2.98 (1.00), [2.00, 5.00] | 3.24 (1.29), [2.00, 9.00] | 3.34 (1.26), [2.00, 7.00] | 3.19 (1.24), [2.00, 9.00] |
| Duration of follow-up | 2.57 (2.74), [0.364, 11.1] | 2.19 (2.22), [0.460, 9.27] | 2.12 (2.16), [0.384, 10.7] | 2.34 (2.50), [0.499, 9.95] | 2.26 (2.34), [0.364, 11.1] |
Mean (standard deviation), [range]
For each participant, the slope of SARA scores over time was calculated as the coefficient of the linear regression of total SARA score against the number of years since the baseline visit, across all available SARA visits. Similarly, the slope of S-Factor scores over time was calculated as the coefficient of the linear regression of S-Factor score against the number of years since the baseline visit, across all available SARA visits. To evaluate the covariance of S-Factor and SARA trajectories, we correlated the slope of SARA scores over time, against the slope of S-Factor values over time. The relationship between CAG repeat length and SARA slope was also evaluated as a comparison, given evidence of faster progression with longer CAG repeat length [20]. We then repeated these analyses with BARS and Functional Staging of Ataxia performance in place of the SARA.
Following this analysis, we undertook an additional investigation of the trajectories of SARA scores, using data from all participants with at least two SARA visits, regardless of whether the S-Factor could be calculated (n = 356; see Supplementary Table 1 for cohort characteristics). Similar investigations were undertaken for the trajectory of available BARS scores (n = 46) and Functional Staging of Ataxia Scores (n = 330) within the same cohort.
The statistical significance threshold was set at α = .05 for all analyses. For all correlation coefficients, effect sizes were interpreted per Cohen [5], with r = 0.1 to 0.29 considered a small effect size, r = 0.3 to 0.49 considered a medium effect size, and r = 0.5 or above considered a large effect size.
Results
Analysis at Baseline
AO vs. CAG Repeat Length
We confirmed in our baseline cohort the established negative relationship between CAG repeat length in the expanded allele and AO, in SCA1 (r(80) = −0.728, p < .001), SCA2 (r(79) = −0.656, p < .001), SCA3 (r(201) = −0.623, p < .001), and SCA6 (r(70) = −0.328, p = .005). Scatterplots are provided in Fig. 1a.
Fig. 1.
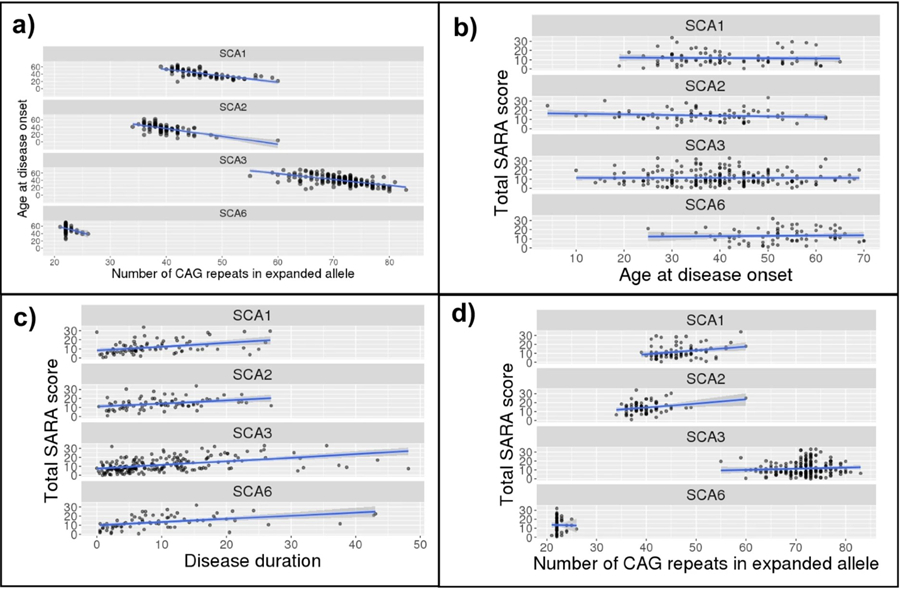
Scatterplots of the relationship between (a) number of CAG repeats in the expanded allele and age at disease onset, and between SARA score and (b) number of CAG repeats in the expanded allele, (c) age at disease onset, and (d) disease duration. Linear model (blue) and 95% confidence interval (grey) overlaid
AO vs. Baseline SARA Score (Fig. 1b)
To evaluate the relevance of AO to a measure of disease severity, we correlated AO against baseline SARA score. No correlation was observed between AO and baseline total SARA score in any SCA type: SCA1: r(80) = −0.036, p = .746; SCA2: r(79) = −0.150, p = .182; SCA3: r(201) = −0.003, p = .969; and SCA6: r(70) = 0.041, p = .731. Given these findings, AO was not included as an independent component in the S-Factor equation and was included only to calculate disease duration.
Age vs. Baseline SARA Score and Disease Duration
To investigate the relevance of current age to the S-Factor, we conducted correlations between baseline age and (a) disease duration and (b) baseline SARA score. Age showed moderate, positive correlations with disease duration across all SCA types: SCA1: r(80) = 0.461, p < .001; SCA2: r(79) = 0.320, p = .004; SCA3: r(201) = 0.391, p < .001; SCA6: r(70) = 0.488, p < .001. In contrast, age at baseline SARA did not correlate with baseline SARA score in SCA1 (r(80) = 0.154, p = .168) or SCA2 (r(79) = 0.020, p = .862), but showed moderate, positive correlations in SCA3 (r(201) = 0.320, p < .001) and SCA6 (r(70) = 0.450, p < .001). Given that age consistently correlated with disease duration, it was not included as an independent component of the S-Factor.
Disease Duration vs. Baseline SARA Score (Fig. 1c)
We correlated disease duration and baseline SARA score to evaluate the relevance of disease duration to a measure of disease severity. Disease duration was significantly, positively correlated with baseline total SARA score amongst participants with all SCA types: SCA1 (r(80) = 0.370, p < .001); SCA2 (r(79)= 0.342, p = .002; SCA3 (r(201) = 0.459, p < .001); and SCA6 (r(70) = 0.443, p < .001).
CAG Repeat Expansion vs. Baseline SARA Score (Fig. 1d)
There was a small but significant relationship between CAG repeat length in the expanded allele and baseline total SARA score in SCA1 (r(80) = 0.277, p = .012). In SCA2, a significant correlation was observed (r(79) = 0.278, p = .012) but this appeared to be driven by an outlier with a high repeat length; the correlation was no longer significant after removal of this outlier (r(78) = 0.201, p = .074). No correlation was observed for SCA3 (r(201) = 0.074, p = .296) or SCA6 (r(70) = −0.015, p = .898). Based on the SCA1 finding, CAG expansion was included in the S-Factor.
S‑Factor vs SARA
At the group level, the S-Factor correlated significantly with baseline SARA score in all SCA types: SCA1: r(80) = 0.544, p < .001; SCA2: r(79) = 0.412, p < .001; SCA3: r(201) = 0.524, p < .001; SCA6: r(70) = 0.442, p < .001. Scatterplots are in Fig. 2. Table 3 shows the correlations between SARA and S-Factor, AO, CAG repeat length, and disease duration. As can be seen in the table, correlation coefficients for the S-Factor were larger than those for AO, CAG repeat length, and disease duration, except in the case of SCA6, where the S-Factor and disease duration had very similar coefficients.
Fig. 2.
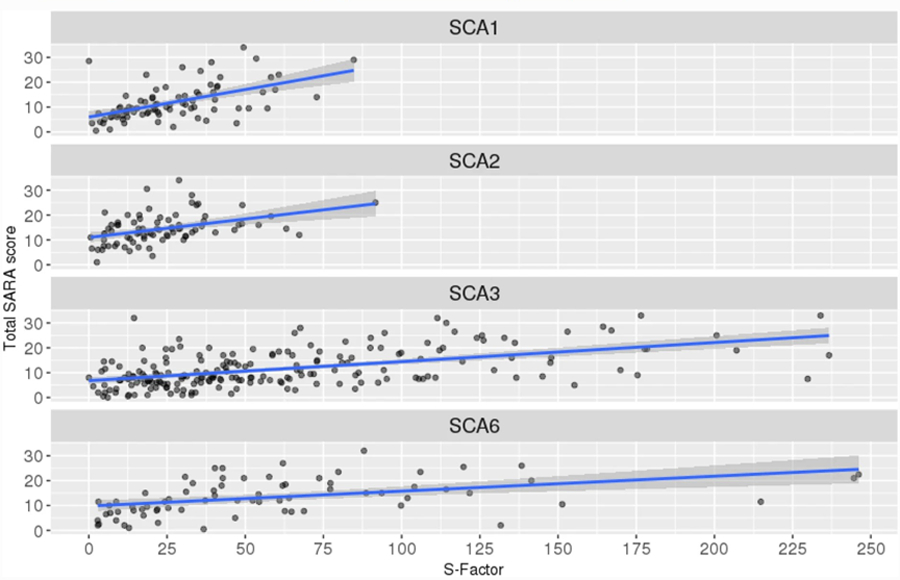
Scatterplots of S-Factor vs. total SARA score, with linear regression (blue) and 95% confidence interval (grey) overlaid
Table 3.
Correlations against SARA score
| SCA1 | SCA2 | SCA3 | SCA6 | |
|---|---|---|---|---|
| CAG repeat length | r(80) = 0.277, p = .012* | r(78) = 0.201, p = .074 | r(201) = 0.074, p = .296 | r(70) = −0.015, p = .898 |
| AO | r(80) = −0.036, p = .746 | r(79) = −0.150, p = .182 | r(201) = −0.003, p = .969 | r(70) = 0.041, p = .731 |
| Disease duration | r(80) = 0.370, p < .001 *** | r(79) = 0.342, p = .002** | r(201) = 0.459, p < .001*** | r(70) = 0.443, p < .001*** |
| S-Factor | r(80) = 0.544, p < .001*** | r(79) = 0.412, p < .001*** | r(201) = 0.524, p < .001*** | r(70) = 0.442, p < .001*** |
p < .001
p < .01
p < .05. Note: AO, age of ataxia onset
Given the moderate to strong positive correlations between the S-Factor and SARA score at the group level, we investigated the utility of the S-Factor in predicting an individual’s SARA score. We binned S-Factor scores as follows: 0–9, 10–19, 20–29, 30–39, 40–49, 50–59, 60–69, 70–79, 80–89, 90–99, 100–149, 150–199, and 200+. The histograms in Fig. 3 indicate, within each S-Factor bin and for each SCA type, the distribution of SARA scores (further statistics provided in Supplementary Table 2). There was a wide range of SARA scores within each S-Factor band, and the range of SARA scores overlapped between bands, indicating that the S-Factor does not precisely predict SARA score at the individual level. For example, assuming normal distribution of SARA scores within each S-Factor band, 95% of individuals with an S-Factor of 0–9 would be expected to have a SARA score between 0 and 19.13 (2 standard deviations from the mean), and 95% of individuals with an S-Factor of 100–149 would be expected to have a SARA score between 2.42 and 32.58. This wide range of SARA scores within each S-Factor band indicates that the S-Factor does not provide a clinically useful prediction of the baseline SARA score at the level of the individual subject.
Fig. 3.
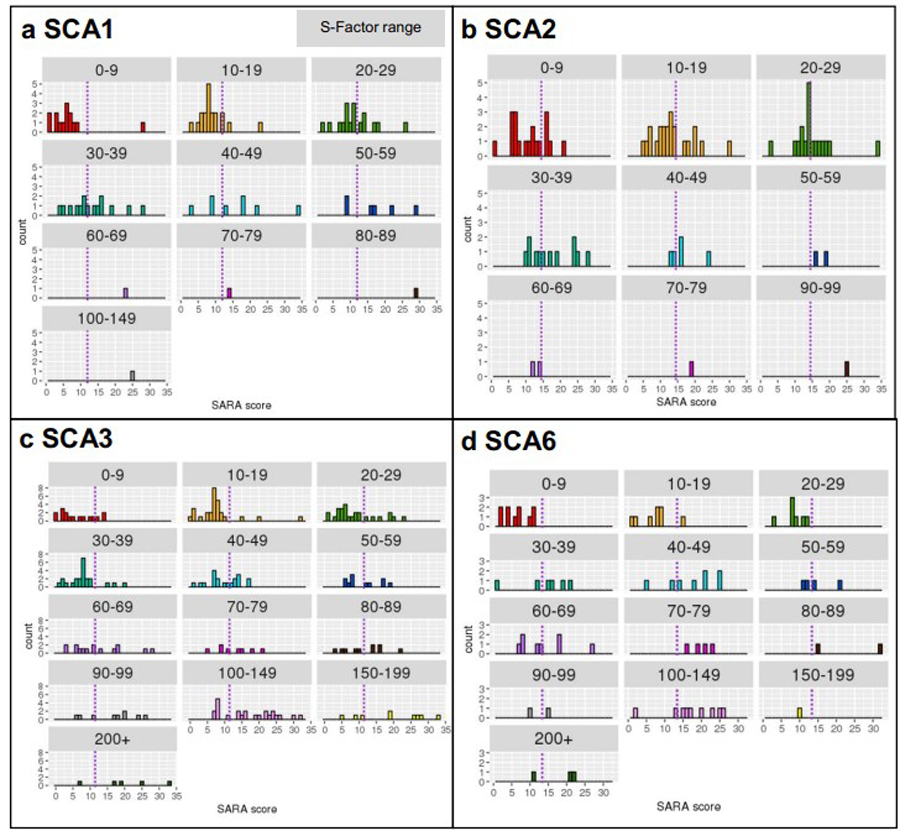
SARA distribution by S-Factor bin (represented by the cells), within (a) SCA1, (b) SCA2, (c) SCA3, and (d) SCA6. The purple dashed line represents the mean SARA score within each SCA type
Combining CAG repeat length, AO, disease duration, and gender in a multivariate model to predict SARA score revealed that when all other predictors were held constant, AO was now a significant predictor of SARA in SCA1, SCA3, and SCA6. To compare the ability of the multivariate model and the S-Factor alone to predict unseen SARA scores (i.e., SARA scores from a test sample independent of the sample used to fit the model), the average R-squared, across 10 iterations of using different one-tenths of the data as the test sample, was compared (see Supplementary Materials). Across all SCA types, the average R-squared was higher for the multivariate model than for the S-Factor. This reflected the multivariate equation accounting for, on average, approximately 13.8%, 2.5%, 3.4%, and 12.9% more variance than the S-Factor in SCA1, 2, 3, and 6, respectively. However, the estimated regression coefficient for AO was of positive valence in all cases, indicating that an increase in AO (later onset) was associated with an increase in SARA score, when other predictors were held constant. This was not readily interpretable in the context of clinical knowledge that, all else being equal, an earlier AO should be associated with worse ataxia severity and hence a greater SARA score.
S‑Factor Correlations with Other Clinical Examinations (See Table 4, Fig. 4)
Table 4.
Correlations against the S-Factor
| SCA1 | SCA2 | SCA3 | SCA6 | |
|---|---|---|---|---|
| SARA | r(80)=0.544, p<.001 | r(79)=0.412, p<.001 | r(201)=0.524, p<.001 | r(70)=0.442, p<.001 |
| BARS | r(12)=0.485, p=.079 | r(15)=0.554, p=.021 | r(27)=0.430, p=.020 | r(11)=0.764, p=.002 |
| Functional stage | r(66)=0.479, p<.001 | r(76)=0.259, p=.022 | r(167)=0.562, p<.001 | r(70)=0.495, p<.001 |
| CCFS | r(15)=−0.046, p=.860 | N/A | r(46)=0.361, p=.012 | N/A |
| 25-foot walk test | r(65)=0.269, p=.028^ | r(60)=0.116, p=.369^ | r(164)=0.268, p<.001 | r(60)=0.323, p=.011 |
| CCAS-S raw | r(24)=−0.129, p=.529 | r(15)=−0.372, p=.141 | r(62)=−0.129, p=.308 | r(13)=-0.05, p=.860 |
| CCAS-S fail | r(24)=0.283, p=.161 | r(15)=0.303, p=.236 | r(60)=0.063, p=.627^ | r(13)=0.003, p=.992 |
Notes: Number in brackets refers to number of degrees of freedom for the correlation; number of participants included in the correlation is 2 more than this value. SARA, Scale for the Assessment and Rating of Ataxia; BARS, Brief Ataxia Rating Scale; CCFS, Composite Cerebellar Functional Severity Score; CCAS-S, Cerebellar Cognitive Affective/Schmahmann Syndrome Scale
An outlier or outliers was excluded from the correlation due to having a notable influence on the analysis
Fig. 4.
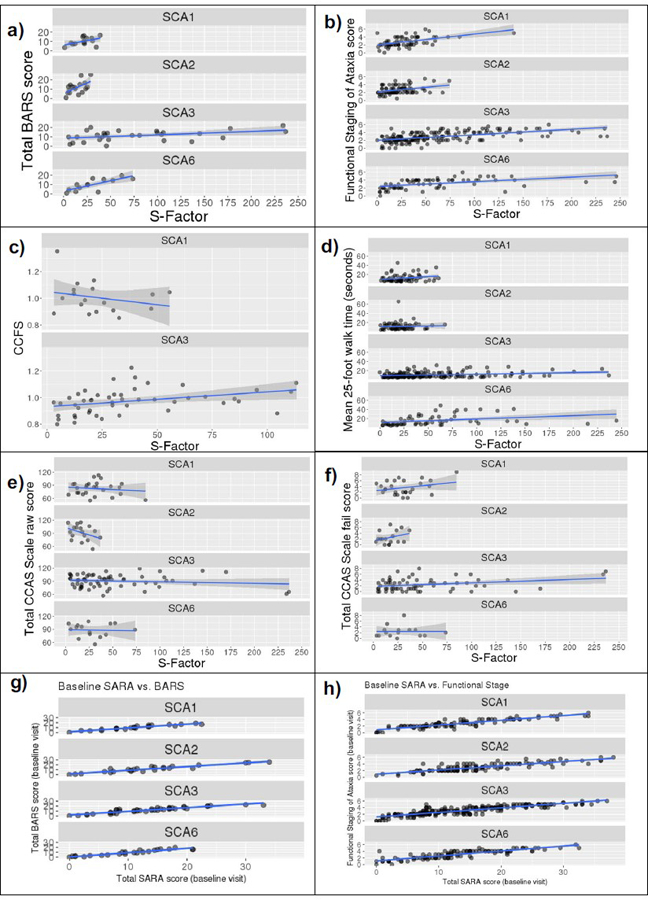
Scatterplots of the relationship between S-Factor and (a) BARS total score, (b) Functional Staging of Ataxia score, (c) CCFS score, (d) 25-foot walk test mean time, (e) CCAS-S raw score, and (f) CCAS-S fail score, and between baseline SARA and (g) baseline BARS and (h) baseline Functional Staging of Ataxia score. Linear model (blue) and 95% confidence interval (grey) overlaid. BARS, Brief Ataxia Rating Scale; CCAS Scale, Cerebellar Cognitive Affective Syndrome Scale; CCFS, Composite Cerebellar Functional Severity Score
Functional Staging of Ataxia score correlated with the S-Factor in all SCAs, with moderate to large coefficients in SCA1, SCA3, and SCA6 (r = 0.479–0.562) and a small coefficient in SCA2 (r = 0.259).
Moderate to large correlation coefficients were observed between the S-Factor and the BARS for SCA2, SCA3, and SCA6. Correlation with SCA1 did not meet statistical significance.
25-foot walk mean test time correlated with the S-Factor in SCA1, SCA3, and SCA6. CCFS performance was correlated with the S-Factor in SCA3 but not SCA1 (not available for SCA2 or SCA6).
Total raw score and total fail score on the CCAS-S did not correlate with the S-Factor.
SARA vs. BARS and Functional Staging of Ataxia
We now describe the relationship between SARA performance and performance on the other neurological examinations within the baseline SARA cohort, in order to inform our comparison of the longitudinal trajectories of these measures (see next section).
Within this baseline cohort, there were 112 individuals with both a SARA and a BARS score conducted within 1 month of each other. Baseline SARA total scores and baseline BARS total scores correlated extremely highly in all SCA types: SCA1: r(21) = 0.950, p < .001; SCA2: r(23) = 0.937, p < .001; SCA3: r(38) = 0.930, p < .001; SCA6: r(22) = 0.948, p < .001 (Fig. 4g).
There were 541 individuals with both a SARA and a Functional Staging of Ataxia score conducted within one month of each other. Baseline SARA scores and baseline Functional Staging of Ataxia scores correlated highly in all SCA types: SCA1: r(95) = 0.900, p < .001; SCA2: r(112) = 0.835, p < .001; SCA3: r(223) = 0.870, p < .001; SCA6: r(103) = 0.850, p < .001 (Fig. 4h).
Longitudinal Analysis
A key reason for devising the S-Factor was the search for an independent metric that could predict and reflect disease severity over time. By design, therefore, the S-Factor increases in a linear fashion over time. Figure 5 illustrates a hypothetical individual’s S-Factor as a function of their age since disease onset, and it shows the effect of AO (panel a) and PolyQ expansion length (; panel b) on the shape of the S-Factor trajectory. The frequency distribution and summary statistics of S-Factor scores, at baseline within each SCA type, are presented in Fig. 6.
Fig. 5.
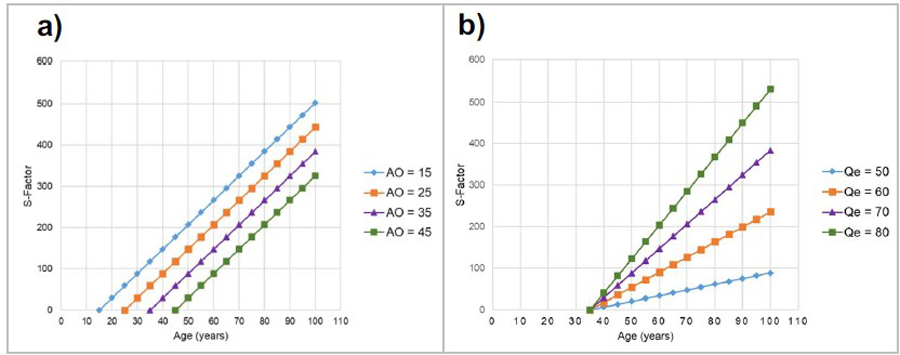
Illustrations of the revised S-Factor over time based on a hypothetical individual with SCA3 (maximum healthy repeat length = 44). AO, age at disease onset;, PolyQ expansion length. Panel (a):. Panel (b):
Fig. 6.
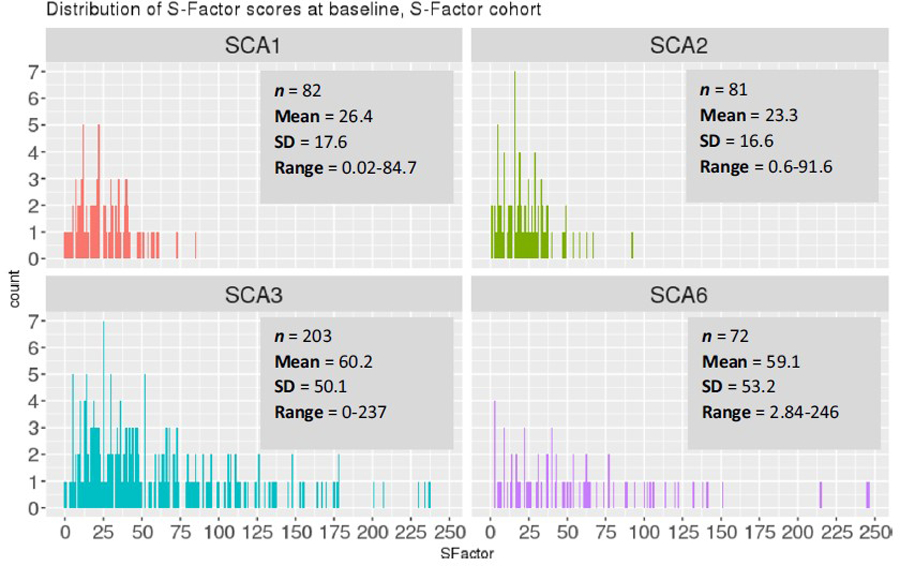
S-Factor distribution, baseline visit
CAG Expansion vs. SARA Slopes
We correlated CAG expansion length against SARA slopes to contrast the ability of the CAG repeat length and S-Factor to predict SARA progression. Across all participants, the correlation between CAG repeat length on the expanded allele and the SARA slope value was not significant, r(288)= 0.073, p = .213. Upon examining each SCA type separately, a significant CAG expansion vs. SARA slope correlation was observed for SCA1 (r(54)=0.285, p = .033) but not for SCA2 (r(59)=0.180, p = .166, SCA3 (r(119)=0.145, p=.113), or SCA6 (r(50)=−0.023, p =.869), see Fig. 7a and Table 5.
Fig. 7.
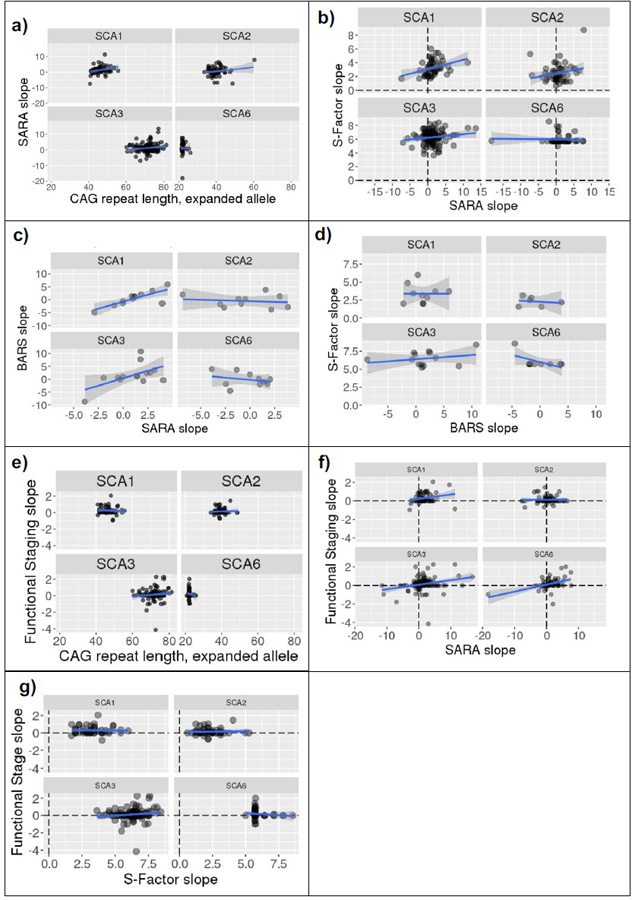
Correlations, split by SCA types, between (a) CAG repeat expansion length and SARA slope (annual change in SARA); (b) SARA slope and S-Factor slope; (c) BARS slope and SARA slope; (d) BARS slope and S-Factor slope; (e) CAG repeat expansion length and Functional Staging slope; (f) Functional Staging slope and SARA slope; (h) Functional Staging slope and S-Factor slope. Linear model line shown in blue with 95% confidence interval in gray. Note that extreme SARA slope values are accounted for by short follow-up durations (see Figure 9)
Table 5.
Correlations between CAG repeat length and S-Factor slopes against SARA slopes, BARS slopes, and Functional stage slopes; and SARA slope against BARS slope and Functional stage slopes
| Correlate 1 | Correlate 2 | SCA1 | SCA2 | SCA3 | SCA6 |
|---|---|---|---|---|---|
| CAG | SARA slope | r(54)=0.285, p=.033 | r(59)=0.18, p=.166 | r(119)=0.145, p=.113 | r(50)= −0.023, p=.869 |
| BARS slope | r(10)=−0.142, p=.661 | r(7)=0.230, p=.552 | r(11)=0.271, p=.370 | r(8)= −0.579, p=.079 | |
| Functional stage slope | r(48)= −0.088, p=.546 | r(53)=0.039, p=.780 | r(107)=0.123, p=.201 | r(50)= −0.128, p=0.365 | |
| S-Factor slope | SARA slope | r(52)=0.333, p=.014 | r(54)=0.217, p=.108 | r(119)=0.152, p=.096 | r(48)= −0.024, p=0.868 |
| BARS slope | r(8)=0.001, p=.999 | r(4)= −0.178, p=.735 | r(11)=0.268, p=.375 | r(7)= −0.582, p=.100 | |
| Functional stage slope | r(46)= −0.027, p=.856 | r(50)=0.031, p=.826 | r(107)=0.128, p=.185 | r(48)= −0.129, p=.370 | |
| SARA slope | BARS slope | r(10)=0.781, p=.003 | r(8)= −0.147, p=.685 | r(12)=0.564, p=.036 | r(8)= −0.272, p=.447 |
| Functional stage slope | r(58)=0.208, p=.110 | r(66)=0.021, p=.865 | r(132)=0.261, p=.002 |
r(66)=0.439, p<.001 r(65)=0.392, p=.001^ |
Correlation repeated after excluding outlier
S‑Factor Slopes vs. SARA Slopes
There was a significant but small correlation between S-Factor slopes and SARA slopes across the whole cohort, r(279) = 0.127, p = .033. Investigation of these correlations within individual SCA types revealed a significant, moderate correlation in SCA1 (r(52) = 0.333, p = .014), but no correlation in SCA2 (r(54)=0.217, p = .108), SCA3 (r(119) = 0.152, p = .100), or SCA6 (r(48)=-0.024, p = .868), Fig. 7b.
BARS Slopes vs. SARA Slopes
Within the longitudinal cohort, there were 46 participants with ≥2 BARS assessments conducted within 1 month of a SARA assessment. The slope of BARS scores and the slope of SARA scores were calculated across these assessments and correlated. Significant correlations were observed for SCA1 (r(10) = 0.781, p = .003) and SCA3 (r(12) = 0.564, p = .036) but not SCA2 (r(8) = −0.147, p = .685) or SCA6 (r(8) = −0.272, p = .447), Fig. 7c.
BARS Slopes vs. S‑Factor Slopes
Like SARA, there was no correlation between BARS slopes and S-Factor slopes in SCA2: r(4) = −0.178, p = .735; SCA3: r(11) = 0.268, p = .375; and SCA6: r(7) = −0.582, p = .100. Unlike SARA, BARS slopes also did not correlate with the S-Factor slope for SCA1: r(8) = 0.001, p = .999; Fig. 7d.
Functional Staging Slopes vs. CAG Expansion
We also examined whether the single Functional Stage question may reflect disease severity over time more accurately (i.e., consistent increases in severity over time) than the ataxia rating scales (SARA, BARS). In the longitudinal cohort, there were 330 individuals with ≥2 Functional Staging assessments conducted within 1 month of a SARA assessment. Firstly, CAG repeat length was not related to the slope of Functional Staging score in any SCA type: SCA1: r(48) = −0.088, p = .546; SCA2: r(53) = 0.039, p = .780; SCA3: r(107) = 0.123, p = .201; SCA6: r(50) = −0.128, p = .365, see Fig. 7e.
Functional Staging Slopes vs. SARA Slopes
Correlations between the slope of Functional Staging score and the slope of the SARA score across the same visits were observed in SCA3 (r(132) = 0.261, p = .002) and SCA6 (r(65) = 0.392, p < .001, following exclusion of a SARA slope outlier) but not in SCA1 (r(58) = 0.208, p = .110) or SCA2 (r(66) = 0.021), see Fig. 7f.
Functional Staging Slopes vs. S‑Factor Slopes
There were no correlations between Functional Staging slopes and S-Factor slopes: SCA1: r(46) = −0.027, p = .856; SCA2: r(50) = 0.031, p = .826; SCA3: r(107) = 0.128, p = .185; SCA6: r(48) = −0.129, p = .370, see Fig. 7g.
In summary, the slope of the S-Factor over time did not correlate with the slope of any of the neurological scales examined: SARA, BARS, or Functional Staging of Ataxia, with the exception of a significant correlation between S-Factor slope and SARA slope in SCA1 only.
Longitudinal Trajectories of SARA Performance
The above analyses demonstrated a general lack of concordance between the slope of the S-Factor over time, and the slope of measures used to capture the progression of motor symptoms (i.e., SARA, BARS, and the Functional Staging of Ataxia scores). Furthermore, some individuals had a negative slope across time on these motor assessments, reflecting improvement in motor symptoms. These unexpected findings motivated us to further investigate the nature of these motor assessment trajectories.
The trajectories of individual participants’ (a) SARA, (b) BARS, and (c) Functional Staging of Ataxia scores are shown in Fig. 8. When linear slopes were fitted across each participant’s study visits, some slopes had a positive value, referred to as “progression slopes” (left column), which indicated disease progression in the expected direction, i.e., worsening motor performance over time. Other slopes had a negative or zero value, referred to as “non-progression slopes” (right column), indicating an overall trend of stability or decline in ataxia severity over time.
Fig. 8.
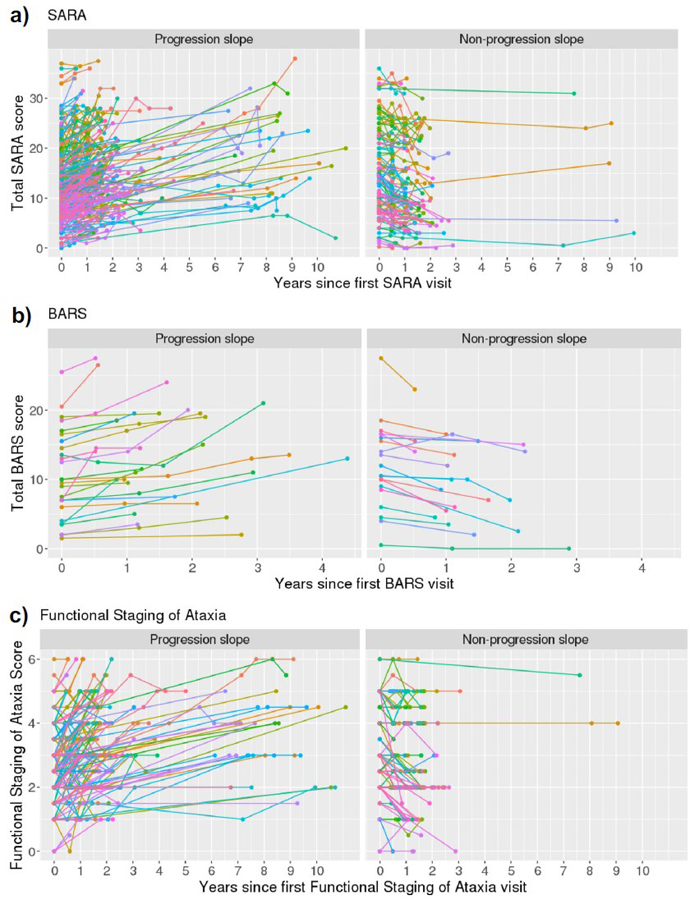
Trajectories of (a) SARA, (b) BARS, and (c) Functional Staging scores over time
Summary statistics for slope values on the SARA, BARS, and Functional Staging of Ataxia score across SCA types and for the overall sample are shown in Table 6, including the percentage of progression and non-progression slopes. Across the whole cohort, the average change in SARA score was an increase of 1.06 points per year. The two-sided 95% confidence interval for this value, assuming a normal distribution, was [0.72, 1.39]. Across all motor assessments, a proportion of individuals had a non-progression slope value. The size of this proportion varied between the assessments and across SCA types, but at the whole-group level was 110/356 (31%) for the SARA, 20/46 (44%) for the BARS, and 112/330 (34%) for the Functional Staging of Ataxia.
Table 6.
Summary statistics for SARA, BARS, and Functional Staging slopes (i.e., annual change)
| SCA1 | SCA2 | SCA3 | SCA6 | Overall | |
|---|---|---|---|---|---|
| SARA | |||||
| n | 67 | 74 | 147 | 68 | 356 |
| M (SD) | 1.542 (2.699) | 0.385 (2.909) | 1.2 (3.506) | 0.994 (3.353) | 1.056 (3.228) |
| 95%_CI | [0.884;2.201] | [−0.289;1.059] | [0.628;1.771] | [0.182;1.805] | [0.719;1.392] |
| Progression_slope_[n (%)] | 53 (79.1%) | 44 (59.5%) | 104 (70.7%) | 45 (66.2%) | 246 (69.1%) |
| Non-progression_slope_[n (%)] | 14 (20.9%) | 30 (40.5%) | 43 (29.3%) | 23 (33.8%) | 110 (30.9%) |
| BARS | |||||
| n | 12 | 10 | 14 | 10 | 46 |
| M (SD) | 0.427 (2.805) | −0.556 (2.476) | 1.533 (4.365) | −0.167 (2.637) | 0.421 (3.274) |
| 95%_CI | [−1.356;2.209] | [−2.327;1.215] | [−0.988;4.053] | [−2.054;1.719] | [−0.552;1.393] |
| Progression_slope_[n (%)] | 7 (58.3%) | 5 (50%) | 10 (71.4%) | 4 (40%) | 26 (56.5%) |
| Non-progression_slope_[n (%)] | 5 (41.7%) | 5 (50%) | 4 (28.6%) | 6 (60%) | 20 (43.5%) |
| Functional_staging | |||||
| n | 60 | 68 | 134 | 68 | 330 |
| M (SD) | 0.321 (0.527) | 0.137 (0.374) | 0.132 (0.674) | 0.164 (0.575) | 0.174 (0.578) |
| 95%_CI | [0.185;0.457] | [0.047;0.228] | [0.017;0.247] | [0.025;0.303] | [0.719;1.392] |
| Progression_slope_[n (%)] | 48 (80%) | 49 (72.1%) | 82 (61.2%) | 39 (57.4%) | 218 (66.1%) |
| Non-progression_slope_[n (%)] | 12 (20%) | 19 (27.9%) | 52 (38.8%) | 29 (42.6%) | 112 (33.9%) |
M (SD), mean (standard deviation); CI, confidence interval
Factors Underlying Non‑progression Trajectories
To explore the non-progression trajectories further, we focused on the SARA slopes and investigated factors that might explain variability in these slopes: duration of follow-up, inter-rater variability in SARA assessment, baseline SARA score, baseline ambulation status, Coenzyme Q10 exposure, and physical therapy history.
Follow‑up Duration
We investigated whether SARA slopes were influenced by total follow-up duration length. The scatterplot of total follow-up duration against SARA slope (Fig. 9) indicates that more extreme slope values (either positive or negative) were associated with shorter follow-up durations, whereas flatter slopes were associated with longer follow-up durations.
Fig. 9.
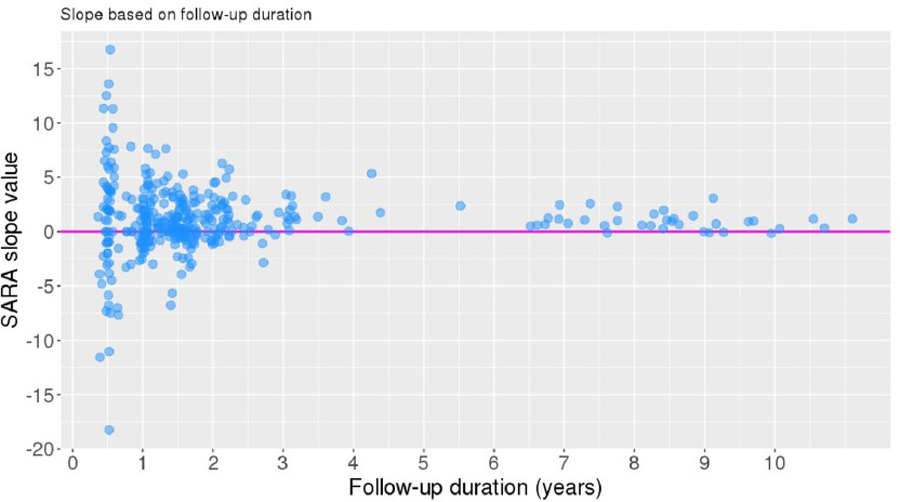
Follow-up duration vs. SARA slope (annual change). SARA slope = 0 represented by magenta line
The proportion of participants within the binary slope categories (progression and non-progression) was compared between individuals who had a total follow-up of < 5 years (n = 320) or ≥ 5 years (n = 36). A chi-squared test of independence indicated that slope category was significantly associated with follow-up duration group, χ2 (1, N = 356) = 4.577, p = .032. Individuals in the longer follow-up group were more likely to have a progression slope than those in the shorter follow-up group (Fig. 10a).
Fig. 10.
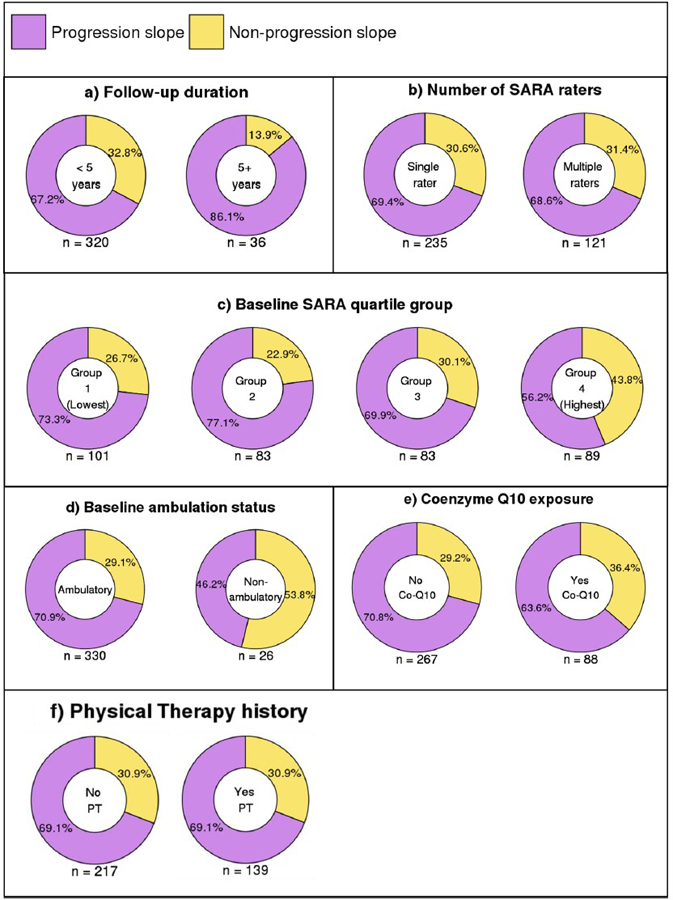
Percentage of individuals with progression and non-progression slopes by (a) total follow-up duration, (b) number of SARA raters, (c) baseline SARA quartile group, (d) baseline ambulation status, (e) Coenzyme-Q10 exposure, and (f) history of physical therapy
Inter‑rater Variability in SARA Assessment
To investigate whether the presence of non-progression slopes was related to inter-rater variability in SARA assessment, we evaluated the number of SARA examiners involved across each participant’s set of SARA assessments. Of the 356 participants, 235 had a single rater across all SARA assessments, 109 had two different raters, and 12 had three different raters.
A chi-squared test of independence indicated that the binary slope category (progression or non-progression) was unrelated to whether individuals had one SARA rater (n = 235) or multiple (2 or 3) raters (n = 121), χ2 (1, N = 356) = 0.001, p = .978, see Fig. 10b.
Baseline SARA Score
There was no linear correlation between baseline SARA score and SARA slope value, r(354) = −0.102, p = .054.
We examined whether baseline SARA score influenced the likelihood of having a non-progression versus a progression slope. We divided the cohort into quartiles based on baseline SARA score, and set the SARA score cut-off points for the quartiles at 7.5 (25th percentile), 11.5 (50th percentile), and 17.625 (75th percentile). This resulted in four groups with the following SARA ranges: group 1 (n = 101): 0.0–7.5; group 2 (n = 83): 7.75–11.5; group 3 (n = 83): 12.0–17.625; group 4 (n = 89): 18.5–37.0.
A chi-squared test of independence indicated that slope category (progression or non-progression) was significantly associated with baseline SARA group, χ2 (3, N = 356) = 10.297, p = .016. A post hoc analysis using Bonferroni correction for multiple comparisons revealed that participants in group 4 (highest baseline SARA scores) were less likely to have a progression slope (standardized residual = 3.046, p = .019), Fig. 10c.
Ambulation Status at Baseline
Next we compared the proportion of individuals within each binary slope category who were ambulatory (SARA Gait score < 8; n = 330) versus non-ambulatory (SARA Gait score = 8; n = 26) at the baseline SARA assessment. A chi-squared test of independence indicated that slope category (progression or non-progression) was significantly associated with baseline ambulation status, χ2 (1, N = 356) = 5.807, p = .016. Individuals who were ambulatory at baseline were more likely to have a progression slope than those who were non-ambulatory at baseline, Fig. 10d. All individuals who were non-ambulatory at baseline were in the highest baseline SARA group (group 4), constituting 29% of this group.
We sampled the data set for two therapies that may conceivably have influenced progression versus non-progression, based on published literature: the use of physical therapy in ataxia patients [24, 32] and the administration of mitochondrial cofactors including co-enzyme Q-10, which is reduced in cerebellar ataxia and which has been investigated in a cell culture model of SCA2 [6, 18].
Coenzyme Q10
We investigated whether the presence of non-progression slopes was related to exposure to Coenzyme Q10, as ascertained by the inclusion of Coenzyme Q10 in participants’ medication history. Of the 356 participants with 2 or more SARA visits, 88 individuals had the phrase “Q10” featured in their medication history at least once throughout their study participation. A total of 267 individuals did not have Q10 featured in their medication history, and one participant did not have a medication history.
Amongst the 355 individuals with a medication history, the proportion of participants within the binary slope categories (progression and non-progression) was compared between individuals who had a history of Coenzyme Q10 exposure (n = 88) and those who did not (n = 267). A chi-squared test of independence indicated that slope category was unrelated to whether or not individuals were exposed to Coenzyme Q10 during the study, χ2 (1, N = 355) = 1.266, p = .261 (Fig. 10e).
Physical Therapy
We investigated whether the presence of non-progression slopes was related to the presence of physical therapy in participant’s therapy history throughout the study. Of the 356 participants with 2 or more SARA visits, 139 individuals had a record of undertaking physical therapy during at least one of their study visits. The remaining 217 participants were regarded as having had no physical therapy.
The proportion of participants within the binary slope categories (progression and non-progression) was compared between individuals who had a history of physical therapy (n = 139) and those who did not (n = 217). The proportions were identical between the two groups (Fig. 10f).
Discussion
We introduce a novel metric, the S-Factor, to test the hypothesis that it is possible to quantify severity of disease burden over time in the autosomal dominant, neurodegenerative, polyglutamine spinocerebellar ataxias type 1, 2, 3, and 6 using immutable characteristics of disease unique to each individual. The S-Factor reflects the contributions to disease burden of the causative gene (the trinucleotide expansion beyond the upper limit of the range of normal for that gene) and the duration of manifest disease. The formula upon which the S-Factor is based mandates that it increases as a function of age. We predicted that this would match patient and clinician experience that the real-life burdens of these diseases progress over time because of their impact on the triad of clinical ataxiology (motor, cognitive, vestibular) and on other neural systems dictated by the specific gene (deficits including oculomotor slowing, dystonia, neuropathy, extrapyramidal dysfunction, and spasticity).
Metrics have been developed previously to better understand the risk of genetic burden in neurodegenerative diseases. In Huntington disease, Langbehn et al. [19] developed a parametric survival model based on CAG repeat length to predict the probability of disease onset based on motor symptoms at different ages for individual patients. Leotti et al. [20] calculated the rate of progression in SCA3 as measured by the International Cooperative Ataxia Rating Scale [42], and tested its relation to the length of the CAG repeat expansion and the residual age at onset, the difference between observed AO and AO predicted on the basis of the CAG repeat length. Notably, length of CAG expansion in SCA3 has been found to be inversely correlated with AO, explaining up to 55% of AO variability. The S-Factor differs from the Langbehn equation because it is applied to individuals with manifest disease and incorporates duration of disease; and unlike Leotti et al. [20], we use AO rather than residual AO, because of the inherent uncertainty in the prediction of AO by CAG length for a single individual.
The S‑Factor as an Independent Metric of Disease Severity in SCA 1, 2, 3, and 6
A key finding of our study providing partial support for our hypothesis was moderate to strong correlations between the novel metric, S-Factor, and baseline SARA score at the group level. In SCA1, SCA2, and SCA3, the S-Factor showed a stronger correlation at the cross-sectional level with baseline total SARA score than did CAG repeat length, AO, or disease duration alone. Duration of disease and the CAG repeat length both contribute to disease burden in the SCAs, and combining these two variables produced a metric of disease severity that is more closely related to symptom manifestation as measured by baseline SARA score than each parameter alone. In SCA6, the correlation coefficients were similar for S-Factor vs. SARA (r = 0.442) and disease duration vs. SARA (r = 0.443). SCA6 showed a slightly negative, non-significant correlation between CAG repeat length and SARA score (r = −0.015), which explains why combining CAG repeat length and disease duration via the S-Factor did not improve prediction of SARA score.
The lack of correlation between AO and baseline SARA score for all 4 SCAs, and between CAG repeat expansion and baseline SARA score (except for SCA1 which had a small correlation) was likely a reflection of the random timing of the baseline, i.e., the entry into the study of the patients in the CRC-SCA and READISCA cohorts. Disease duration had a significant, modest correlation with baseline SARA score, so if a patient entered the study very early or very late in the course of their natural history, it would not be expected that the degree of cerebellar ataxia at first contact would be predicted by the fixed AO and the essentially static CAG repeat expansion (somatic instability notwithstanding, [2]). Surprisingly, when disease duration, CAG repeat length, and gender were held constant, AO had a positive weighting in predicting SARA for all SCA types — a higher (older) age at onset was associated with a higher SARA score. The reason behind this finding is unclear.
Despite the moderate to large correlation between the S-Factor and baseline SARA performance at the group level, however, groups of individuals with a similar S-Factor score generally had a wide range of SARA scores, showing that the S-Factor did not accurately predict baseline SARA scores at the level of the individual subject. The reasons for this remain to be determined, and it is possible that other genetic or environmental factors still to be identified play an important role in disease severity.
We found no correlation between the S-Factor and CCAS-S performance at baseline. This is somewhat consistent with the emerging literature on the CCAS-S in SCAs which have not found that CAG repeat length is associated with CCAS-S performance [23, 33]. Longer duration of disease was associated with poorer cognitive performance amongst 20 individuals with SCA3 [23], but this relationship was not observed amongst 64 individuals with SCA2 [33]. The CCAS-S vs. S-Factor correlations were underpowered relative to the SARA vs. S-Factor correlations, and it remains to be shown whether the components of the S-Factor correlate with CCAS-S performance over time.
SARA Score, S‑Factor, and Disease Progression in SCAs
The relationship between CAG repeat length and natural history of the SCAs has varied in different studies. We confirm earlier reports that in SCA3, CAG repeat length correlates inversely with age of onset [14, 27, 40], but not with SARA scores adjusted for disease duration (SARA/Duration; [14]). In Jacobi et al. [15], larger expanded CAG repeats were associated with faster SARA progression in SCA1 and SCA2, but not in SCA3 and SCA6, and in Jacobi et al. [16], only SCA1 showed correlation between CAG length and rate of SARA progression.
We found no correlation between the slopes of the S-Factor and the SARA score, and thus the data provided no support for our prediction that the trajectory of the S-Factor over time would mirror that of the SARA score over time. The S-Factor, by definition, consistently increases over time, but the SARA score trajectories in our cohort did not always increase. When a linear regression was fitted to participants’ available longitudinal SARA scores, about 30% of the sample overall showed a stable or decreasing trend in SARA performance. This unexpected result arising from the evaluation of the S-Factor provided an opportunity to explore the natural history and evaluation of the SCAs over time.
Two key findings appeared to account for variability in SARA slopes. First, when individuals were followed up for a longer duration, their SARA scores were more likely to fit a linear increase over time. In contrast, individuals who were followed for a shorter period were more likely to have a non-progression slope. Notably, even in our longer-duration cohort, about 14% of individuals followed beyond 5 years still had a non-progression slope, although as this represented only 5/36 participants followed up for > 5 years, we cannot make firm conclusions about the prevalence of non-progression amongst individuals followed up for longer time periods. The most extreme slopes in both the positive and negative directions occurred in individuals who were followed up for only 0.5 years (corresponding to a baseline and single follow-up visit in the CRC-SCA study). Amongst individuals who were followed for longer and over more visits, such changes in SARA score may be averaged out; amongst individuals followed up for only 0.5 years, these values instead contribute to large slope values given the small denominator in the slope calculation. If these latter individuals were followed up for longer, it is possible that their slope would become less extreme. Changes in SARA score across a short-term period are thus not necessarily representative of longer-term trends in SARA score. This conclusion agrees with Jacobi et al. [16] who emphasized the importance of sufficiently long observation periods in natural history studies of progressive disorders, because their patients with SCA1 and SCA2 followed beyond the initial 3-year observation period showed slower progression than those with a shorter period of follow-up. Our findings also agree with Leotti et al. [20] who concluded that studies with long observation times and many complete observations are optimal for determining the impact of CAG repeat length on disease progression. We were unable to confirm the further conclusions of Leotti et al. [20], however, that the number of individual raters influenced this determination, and our data failed to show correlation between S-Factor slope that includes the degree of CAG expansion and rate of SARA score change over time. We note the conclusion of Monte et al. [25] that in SCA2, the rate of progression as measured by SARA and the Neurological Examination Score for Spinocerebellar Ataxia (NESSCA) is not uniform, and that it varies according to stage of disease.
Second, individuals were less likely to show progression slopes for the SARA if they were in the ≥75th percentile of baseline SARA score compared to individuals with lower SARA scores, or if they were non-ambulatory at baseline compared to those who were ambulatory at baseline. The ≥75th percentile group included all 26 non-ambulatory individuals and 62 others. SARA is therefore limited in its ability to capture progression of disease once a person is non-ambulatory or has reached a higher level of overall symptom severity. The highest SARA score in our cohort was 37 and therefore these effects occurred even though no participant reached the maximum scale score of 40. These findings are in accord with the study of SCA2 patients by Monte et al. [25] in which SARA score indicated slowing of progression after 20 years of disease, which the authors concluded reflected inability of the SARA to measure progression after a certain disease stage.
We showed that having a history of Coenzyme Q10 exposure did not influence whether individuals had a progressive vs. non-progressive slope of SARA performance over time. This is consistent with an earlier, but different analysis of the same natural history cohort [22].
A 30% non-progression rate of SARA score over time has not been reported in previous natural history studies of SCA1, SCA2, SCA3, and SCA6, although the presence of negative changes in SARA over time amongst some participants was demonstrated in the analysis of an earlier, smaller subset of the present cohort [1]. The natural histories of SCAs 1, 2, 3, and 6 were evaluated in a recent meta-analysis [9], which indicated variability amongst studies in the reported SARA progression rate; for example, in SCA2, annual rates of change ranged from 0.71 to 1.75 across 5 studies.
SARA is widely used as a proxy measure for severity of disease in the ataxias. Some measures of motor control in SARA are difficulty to quantify, such as centimeter over-reach in rapid finger following and end-point tremor. To test whether this may have accounted for the lack of expected correlations between SARA and S-Factor slopes, we compared results using BARS and conclude that the potential pitfalls in SARA are unlikely to account for its lack of correlation with the S-Factor over time. The BARS does not include these centimeter measures, it is tightly correlated with baseline SARA, and, like the SARA slopes, the BARS slopes also diverge from the S-Factor slopes. At the same time, we note the inconsistent statistical power between the correlations used to sample SARA and BARS, and caution against interpreting negative findings in the smaller sample size of individuals assessed using BARS.
The SCAs are complex disorders that include symptoms not captured in cerebellar-based motor assessments like the SARA (e.g., dystonia, parkinsonism, corticospinal features). Monte et al. [25] posed the question whether SARA may be unable to capture the full extent of disease impact in SCA2, and used the NESSCA [17) which explores multiple non-ataxia examination findings found in the SCA patient population. They found that the NESSCA also had a non-linear trajectory, with slower progression during the early and late stages of the illness.
When we tested whether the S-Factor correlated with overall functional ability assessed with the single composite Functional Staging of Ataxia score, we found moderate to large correlations at baseline between Functional Stage and S-Factor for SCA1, SCA3, and SCA6 and a small correlation in SCA2, and small to large correlations between Functional Stage and SARA score. In contrast, in the longitudinal analysis, there were no correlations between Functional Staging slopes and S-Factor slopes, while the slopes of Functional Stage and SARA score were mild to moderately correlated for SCA3 and SCA6, but not for SCA1 and SCA2.
Conclusions
At the baseline visit for patients with SCA1, 2, 3, and 6 in the CRC-SCA and READISCA cohorts, at the group level, the S-Factor is more accurate than AO, CAG repeat length, or disease duration alone as a predictor of severity of ataxia measured by SARA and BARS. At the level of the single individual with these disorders, however, the S-Factor is not able to predict degree of ataxia in a clinically meaningful manner because of the wide range of severities of ataxia for each S-Factor increment.
The CRC-SCA and READISCA cohorts provide no statistically significant support for prediction by the S-Factor of ataxia severity along the course of the disease as measured by SARA, BARS, or Functional Staging of Ataxia. There is prominent and unpredictable variability in SARA slope in the early stages of the longitudinal evaluation (<2 years) that is unrelated to the number of raters involved and which may reflect true biological variability in the core features of the SARA [12].
SARA scores stayed the same or improved in ~30% of patients in the short duration follow-up, and whereas rate of progression is more reliable in patients seen at regular intervals over a longer period (≥5 years), there were still some individuals who did not decline. This inertia in the clinical data and the variability in rate of change over time at the group and individual levels in natural history studies to date represent a considerable challenge for understanding these diseases and for clinical trial design.
Limitations and Future Directions
Given the moderate to strong correlations with SARA score at baseline, the S-Factor may be a useful metric for evaluating the equivalence in disease severity between treatment and control groups in clinical trials, where the mean, standard deviation, and range of S-Factor could be used to characterize the cohorts.
In the genetic ataxias, as in Huntington disease [19], it is important to determine ways to identify and quantify disease burden in gene positive pre-symptomatic individuals in the context of potential early intervention opportunities. The S-Factor formula does not assess pre-symptomatic individuals in real time because it relies on duration of manifest symptoms. Once at-risk individuals become symptomatic the S-Factor could be calculated retrospectively for a particular time frame using current age at the premanifest time in question, and the actual AO. This will yield a negative S-Factor value which may be useful in the future as a guide in biomarker studies of pre-symptomatic individuals, using techniques such as MR spectroscopy. There are currently insufficient subjects in the READISCA cohort who converted from premanifest to manifest to test this hypothesis.
Given the limitations of the SARA in capturing the full extent of the manifestations of progressive pathology in the SCAs, it will be important to evaluate the relationship of the S-Factor to emerging biometrics and biomarkers such as PROM-Ataxia, observer-independent movement sensor data, morphometric changes on MRI, neurotransmitter changes on MR spectroscopy, and fluid biomarkers such as NFL. Whereas morphometric and MR spectroscopy parameters were not predictive of SARA score in a study by Huang et al. [14], Deelchand et al. [8] found that both MRI and MRS were more sensitive to disease progression than SARA in SCA1. In the Deelchand study, pontine volume was most sensitive to change, and MRS appeared more sensitive at the premanifest stage and to have greater predictive value for disease progression. It will be interesting to ascertain whether the S-Factor could be a more accurate predictor of the imaging findings than the SARA score. Similarly, the 70-item PROM-Ataxia is an advance over the single question in the Functional Staging of Ataxia scale, and it will be interesting to examine a possible relationship between the longitudinal assessment of the PROM-Ataxia and the S-Factor slope.
This study was not able to control for the use of therapeutic interventions including physical, occupational, and speech therapy, nor for the use of agents that are ubiquitously used in some centers and less commonly prescribed in others, including antioxidant vitamins, mitochondrial cofactors, and off-label medications to improve the symptoms of ataxia. It is not possible from the data set to determine whether patients who were stable or improved were statistically more likely to receive these kinds of therapies. The prevalence of such interventions and their impact or lack thereof on trajectory of disease will need to be studied prospectively in cohorts planned through the CRC-SCA and the Global SCA network (ataxia-global-initiative.net).
Supplementary Material
Acknowledgements
The authors would like to thank Dr Gilbert J. L’Italien (Global Health Outcomes and Epidemiology, Biohaven Pharmaceuticals, New Haven, CT, USA) for guidance with the statistical approaches.
Funding
Supported in part by the National Ataxia Foundation and the MINDlink Foundation. LPS was supported by an Australian-American Fulbright Commission scholarship. The READISCA project was supported by the National Institute of Neurological Disorders and Stroke (NINDS) grant U01 NS104326.
Footnotes
Supplementary Information The online version contains supplementary material available at https://doi.org/10.1007/s12311-022-01424-1.
Declarations
Conflict of Interest E.M.R. serves on the BrainSpec Inc. Scientific Advisory Board. G.Ö. consults for IXICO Technologies Limited and uniQure biopharma B.V., serves on the Scientific Advisory Board of BrainSpec Inc., and receives research support from Biogen. J.D.S. is site PI for Biohaven Pharma, consults for Biogen and MedAvante, and holds the copyright with the General Hospital Corporation to the Brief Ataxia Rating scale, Patient Reported outcome Measure of Ataxia, and the Cerebellar Cognitive Affective/Schmahmann Syndrome Scale.
References
- 1.Ashizawa T, Figueroa KP, Perlman SL, Gomez CM, Wilmot GR, Schmahmann JD, Ying SH, Zesiewicz TA, Paulson HL, Shakkottai VG, Bushara KO, Kuo S-H, Geschwind MD, Xia G, Mazzoni P, Krischer JP, Cuthbertson D, Holbert A, Ferguson JH, et al. Clinical characteristics of patients with spinocerebellar ataxias 1, 2, 3 and 6 in the US; a prospective observational study. Orphanet Journal of Rare Diseases 2013;8(1):177. 10.1186/1750-1172-8-177. [DOI] [PMC free article] [PubMed] [Google Scholar]
- 2.Cancel G, Gourfinkel-An I, Stevanin G, Didierjean O, Abbas N, Hirsch E, Agid Y, Brice A. Somatic mosaicism of the CAG repeat expansion in spinocerebellar ataxia type 3/Machado-Joseph disease. Hum Mutat 1998;11(1):23–7. [DOI] [PubMed] [Google Scholar]
- 3.Casey HL, Gomez CM (1993). Spinocerebellar Ataxia Type 6. In Adam MP, Ardinger HH, Pagon RA, Wallace SE, Bean LJ, Mirzaa G, & Amemiya A (Eds.), GeneReviews®. University of; Washington, Seattle. http://www.ncbi.nlm.nih.gov/books/NBK1140/ [PubMed] [Google Scholar]
- 4.Coarelli G, Darios F, Petit E, Dorgham K, Adanyeguh I, Petit E, Brice A, Mochel F, Durr A. Plasma neurofilament light chain predicts cerebellar atrophy and clinical progression in spinocerebellar ataxia. Neurobiol Dis 2021;153:105311. 10.1016/j.nbd.2021.105311. [DOI] [PubMed] [Google Scholar]
- 5.Cohen J (1988). Statistical Power Analysis for the Behavioral Sciences (2nd ed.). Routledge. 10.4324/9780203771587 [DOI] [Google Scholar]
- 6.Cornelius N, Wardman JH, Hargreaves IP, Neergheen V, Bie AS, Tümer Z, Nielsen JE, Nielsen TT. Evidence of oxidative stress and mitochondrial dysfunction in spinocerebellar ataxia type 2 (SCA2) patient fibroblasts: effect of coenzyme Q10 supplementation on these parameters. Mitochondrion 2017;34:103–14. 10.1016/j.mito.2017.03.001. [DOI] [PubMed] [Google Scholar]
- 7.de Mattos EP, Kolbe Musskopf M, Bielefeldt Leotti V, Saraiva-Pereira ML, Jardim LB. Genetic risk factors for modulation of age at onset in Machado-Joseph disease/spinocerebellar ataxia type 3: a systematic review and meta-analysis. J Neurol Neurosurg Psychiatry 2019;90(2):203–10. 10.1136/jnnp-2018-319200. [DOI] [PubMed] [Google Scholar]
- 8.Deelchand DK, Joers JM, Ravishankar A, Lyu T, Emir UE, Hutter D, Gomez CM, Bushara KO, Lenglet C, Eberly LE, Öz G. Sensitivity of volumetric magnetic resonance imaging and magnetic resonance spectroscopy to progression of spinocerebellar ataxia type 1. Movement Disorders Clinical Practice 2019;6(7):549–58. 10.1002/mdc3.12804. [DOI] [PMC free article] [PubMed] [Google Scholar]
- 9.Diallo A, Jacobi H, Tezenas du Montcel S, Klockgether T. Natural history of most common spinocerebellar ataxia: a systematic review and meta-analysis. J Neurol 2021;268(8):2749–56. 10.1007/s00415-020-09815-2. [DOI] [PubMed] [Google Scholar]
- 10.Figueroa KP, Coon H, Santos N, Velazquez L, Mederos LA, Pulst SM. Genetic analysis of age at onset variation in spinocerebellar ataxia type 2. Neurology Genetics 2017;3(3):e155. 10.1212/NXG.0000000000000155. [DOI] [PMC free article] [PubMed] [Google Scholar]
- 11.Gajos KZ, Reinecke K, Donovan M, Stephen CD, Hung AY, Schmahmann JD, Gupta AS. Computer mouse use captures ataxia and parkinsonism, enabling accurate measurement and detection. Mov Disord 2020;35(2):354–8. 10.1002/mds.27915. [DOI] [PMC free article] [PubMed] [Google Scholar]
- 12.Grobe-Einsler M, Taheri Amin A, Faber J, Schaprian T, Jacobi H, Schmitz-Hübsch T, Diallo A, Tezenas du Montcel S, Klockgether T. Development of SARA home, a new video-based tool for the assessment of ataxia at home. Mov Disord 2021;36(5):1242–6. 10.1002/mds.28478. [DOI] [PubMed] [Google Scholar]
- 13.Hoche F, Guell X, Vangel MG, Sherman JC, Schmahmann JD. The cerebellar cognitive affective/Schmahmann Syndrome Scale. Brain 2018;141(1):248–70. 10.1093/brain/awx317. [DOI] [PMC free article] [PubMed] [Google Scholar]
- 14.Huang S-R, Wu Y-T, Jao C-W, Soong B-W, Lirng J-F, Wu H-M, Wang P-S. CAG repeat length does not associate with the rate of cerebellar degeneration in spinocerebellar ataxia type 3. Neuro-Image: Clinical 2017;13:97–105. 10.1016/j.nicl.2016.11.007. [DOI] [PMC free article] [PubMed] [Google Scholar]
- 15.Jacobi H, Bauer P, Giunti P, Labrum R, Sweeney MG, Charles P, Durr A, Marelli C, Globas C, Linnemann C, Schols L, Rakowicz M, Rola R, Zdzienicka E, Schmitz-Hubsch T, Fancellu R, Mariotti C, Tomasello C, Baliko L, et al. The natural history of spinocerebellar ataxia type 1, 2, 3, and 6: a 2-year follow-up study. Neurology 2011;77(11):1035–41. 10.1212/WNL.0b013e31822e7ca0. [DOI] [PMC free article] [PubMed] [Google Scholar]
- 16.Jacobi H, du Montcel ST, Bauer P, Giunti P, Cook A, Labrum R, Parkinson MH, Durr A, Brice A, Charles P, Marelli C, Mariotti C, Nanetti L, Panzeri M, Rakowicz M, Sulek A, Sobanska A, Schmitz-Hübsch T, Schöls L, et al. Long-term disease progression in spinocerebellar ataxia types 1, 2, 3, and 6: a longitudinal cohort study. The Lancet Neurology 2015;14(11):1101–8. 10.1016/S1474-4422(15)00202-1. [DOI] [PubMed] [Google Scholar]
- 17.Kieling C, Rieder CRM, Silva ACF, Saute JAM, Cecchin CR, Monte TL, Jardim LB. A neurological examination score for the assessment of spinocerebellar ataxia 3 (SCA3). Eur J Neurol 2008;15(4):371–6. 10.1111/j.1468-1331.2008.02078.x. [DOI] [PubMed] [Google Scholar]
- 18.Lamperti C, Naini A, Hirano M, De Vivo DC, Bertini E, Servidei S, Valeriani M, Lynch D, Banwell B, Berg M, Dubrovsky T, Chiriboga C, Angelini C, Pegoraro E, DiMauro S. Cerebellar ataxia and coenzyme Q10 deficiency. Neurology 2003;60(7):1206–8. 10.1212/01.WNL.0000055089.39373.FC. [DOI] [PubMed] [Google Scholar]
- 19.Langbehn D, Brinkman R, Falush D, Paulsen J, Hayden M, on behalf of an International Huntington’s Disease Collaborative Group. A new model for prediction of the age of onset and penetrance for Huntington’s disease based on CAG length: prediction of the age of onset and penetrance for HD. Clin Genet 2004;65(4):267–77. 10.1111/j.1399-0004.2004.00241.x. [DOI] [PubMed] [Google Scholar]
- 20.Leotti VB, Vries JJ, Oliveira CM, Mattos EP, Te Meerman GJ, Brunt ER, Kampinga HH, Jardim LB, Verbeek DS. CAG repeat size influences the progression rate of spinocerebellar ataxia type 3. Ann Neurol 2021;89(1):66–73. 10.1002/ana.25919. [DOI] [PubMed] [Google Scholar]
- 21.Lin C-C, Ashizawa T, Kuo S-H. Collaborative efforts for spinocerebellar ataxia research in the United States: CRC-SCA and READISCA. Front Neurol 2020;11:902. 10.3389/fneur.2020.00902. [DOI] [PMC free article] [PubMed] [Google Scholar]
- 22.Lo RY, Figueroa KP, Pulst SM, Lin C-Y, Perlman S, Wilmot G, Gomez C, Schmahmann J, Paulson H, Shakkottai VG, Ying S, Zesiewicz T, Bushara K, Geschwind M, Xia G, Subramony SH, Ashizawa T, Kuo S-H. Coenzyme Q10 and spinocerebellar ataxias: coenzyme Q10 and spinocerebellar ataxias. Mov Disord 2015;30(2):214–20. 10.1002/mds.26088. [DOI] [PMC free article] [PubMed] [Google Scholar]
- 23.Maas RPPWM, Killaars S, van de Warrenburg BPC, Schutter DJLG. The cerebellar cognitive affective syndrome scale reveals early neuropsychological deficits in SCA3 patients. J Neurol 2021;268(9):3456–66. 10.1007/s00415-021-10516-7. [DOI] [PMC free article] [PubMed] [Google Scholar]
- 24.Miyai I, Ito M, Hattori N, Mihara M, Hatakenaka M, Yagura H, Sobue G, Nishizawa M. Cerebellar ataxia rehabilitation trial in degenerative cerebellar diseases. Neurorehabil Neural Repair 2012;26(5):515–22. 10.1177/1545968311425918. [DOI] [PubMed] [Google Scholar]
- 25.Monte TL, da Reckziegel ER, Augustin MC, Locks-Coelho LD, Santos ASP, Furtado GV, de Mattos EP, Pedroso JL, Barsottini OP, Vargas FR, Saraiva-Pereira M-L, Camey SA, Leotti VB, Jardim LB, on behalf of Rede Neurogenética. The progression rate of spinocerebellar ataxia type 2 changes with stage of disease. Orphanet Journal of Rare Diseases 2018;13(1):20. 10.1186/s13023-017-0725-y. [DOI] [PMC free article] [PubMed] [Google Scholar]
- 26.Opal P, & Ashizawa T (1993). Spinocerebellar ataxia type 1. In Adam MP, Ardinger HH, Pagon RA, Wallace SE, Bean LJ, Mirzaa G, & Amemiya A (Eds.), GeneReviews®. University of; Washington, Seattle. http://www.ncbi.nlm.nih.gov/books/NBK1184/ [PubMed] [Google Scholar]
- 27.Orr HT, Zoghbi HY. Trinucleotide repeat disorders. Annu Rev Neurosci 2007;30(1):575–621. 10.1146/annurev.neuro.29.051605.113042. [DOI] [PubMed] [Google Scholar]
- 28.Öz G, Iltis I, Hutter D, Thomas W, Bushara KO, Gomez CM. Distinct neurochemical profiles of spinocerebellar ataxias 1, 2, 6, and cerebellar multiple system atrophy. Cerebellum 2011;10(2):208–17. 10.1007/s12311-010-0213-6. [DOI] [PMC free article] [PubMed] [Google Scholar]
- 29.Paulson H, Shakkottai V (1993). Spinocerebellar ataxia type 3. In Adam MP, Ardinger HH, Pagon RA, Wallace SE, Bean LJ, Mirzaa G, & Amemiya A (Eds.), GeneReviews®. University of Washington, Seattle. http://www.ncbi.nlm.nih.gov/books/NBK1196/ [PubMed] [Google Scholar]
- 30.Pulst SM (1993). Spinocerebellar ataxia type 2. In Adam MP, Ardinger HH, Pagon RA, Wallace SE, Bean LJ, Mirzaa G, & Amemiya A (Eds.), GeneReviews®. University of Washington, Seattle. http://www.ncbi.nlm.nih.gov/books/NBK1275/ [Google Scholar]
- 31.Reetz K, Costa AS, Mirzazade S, Lehmann A, Juzek A, Rakowicz M, Boguslawska R, Schöls L, Linnemann C, Mariotti C, Grisoli M, Dürr A, van de Warrenburg BP, Timmann D, Pandolfo M, Bauer P, Jacobi H, Hauser T-K, Klockgether T, et al. Genotype-specific patterns of atrophy progression are more sensitive than clinical decline in SCA1, SCA3 and SCA6. Brain 2013;136(3):905–17. 10.1093/brain/aws369. [DOI] [PubMed] [Google Scholar]
- 32.Rodríguez-Díaz JC, Velázquez-Pérez L, Rodríguez Labrada R, Aguilera Rodríguez R, Laffita Pérez D, Canales Ochoa N, Medrano Montero J, Estupiñán Rodríguez A, Osorio Borjas M, Góngora Marrero M, Reynaldo Cejas L, González Zaldivar Y, Almaguer Gotay D. Neurorehabilitation therapy in spinocerebellar ataxia type 2: a 24-week, rater-blinded, randomized, controlled trial: neurorehabilitation in SCA2. Mov Disord 2018;33(9):1481–7. 10.1002/mds.27437. [DOI] [PubMed] [Google Scholar]
- 33.Rodríguez-Labrada R, Batista-Izquierdo A, González-Melix Z, Reynado-Cejas L, Vázquez-Mojena Y, Sanz YA, Canales-Ochoa N, González-Zaldívar Y, Dogan I, Reetz K, Velázquez-Pérez L (2021). Cognitive decline is closely associated with ataxia severity in spinocerebellar ataxia type 2: a validation study of the Schmahmann Syndrome Scale. The Cerebellum 10.1007/s12311-021-01305-z [DOI] [PubMed]
- 34.Schmahmann JD, Gardner R, MacMore J, Vangel MG. Development of a brief ataxia rating scale (BARS) based on a modified form of the ICARS: Brief Ataxia Rating Scale. Mov Disord 2009;24(12):1820–8. 10.1002/mds.22681. [DOI] [PMC free article] [PubMed] [Google Scholar]
- 35.Schmahmann JD, Pierce S, MacMore J, L’Italien GJ (2021). Development and validation of a patient-reported outcome measure of ataxia. Movement Disorders, mds.28670 10.1002/mds.28670 [DOI] [PubMed]
- 36.Schmitz-Hübsch T, du Montcel ST, Baliko L, Berciano J, Boesch S, Depondt C, Giunti P, Globas C, Infante J, Kang J-S, Kremer B, Mariotti C, Melegh B, Pandolfo M, Rakowicz M, Ribai P, Rola R, Schols L, Szymanski S, et al. Scale for the assessment and rating of ataxia: development of a new clinical scalet Neurology 2006;66(11):1717–20. 10.1212/01.wnl.0000219042.60538.92. [DOI] [PubMed] [Google Scholar]
- 37.Shah VV, Rodriguez-Labrada R, Horak FB, McNames J, Casey H, Hansson Floyd K, El-Gohary M, Schmahmann JD, Rosenthal LS, Perlman S, Velázquez-Pérez L, Gomez CM. Gait variability in spinocerebellar ataxia assessed using wearable inertial sensors. Mov Disord 2021;36(12):2922–31. 10.1002/mds.28740. [DOI] [PubMed] [Google Scholar]
- 38.Subramony SH, May W, Lynch D, Gomez C, Fischbeck K, Hallett M, Taylor P, Wilson R, Ashizawa T, for the Cooperative Ataxia Group. Measuring Friedreich ataxia: interrater reliability of a neurologic rating scale. Neurology 2005;64(7):1261–2. 10.1212/01.WNL.0000156802.15466.79. [DOI] [PubMed] [Google Scholar]
- 39.Tezenas du Montcel S, Charles P, Ribai P, Goizet C, Le Bayon A, Labauge P, Guyant-Maréchal L, Forlani S, Jauffret C, Vandenberghe N, N’Guyen K, Le Ber I, Devos D, Vincitorio C-M, Manto M-U, Tison F, Hannequin D, Ruberg M, Brice A, Durr A. Composite cerebellar functional severity score: validation of a quantitative score of cerebellar impairment. Brain 2008;131(5):1352–61. 10.1093/brain/awn059. [DOI] [PubMed] [Google Scholar]
- 40.Tezenas du Montcel S, Durr A, Bauer P, Figueroa KP, Ichikawa Y, Brussino A, Forlani S, Rakowicz M, Schöls L, Mariotti C, van de Warrenburg BPC, Orsi L, Giunti P, Filla A, Szymanski S, Klockgether T, Berciano J, Pandolfo M, Boesch S, et al. Modulation of the age at onset in spinocerebellar ataxia by CAG tracts in various genes. Brain 2014a;137(9):2444–55. 10.1093/brain/awu174. [DOI] [PMC free article] [PubMed] [Google Scholar]
- 41.Tezenas du Montcel S, Durr A, Rakowicz M, Nanetti L, Charles P, Sulek A, Mariotti C, Rola R, Schols L, Bauer P, Dufaure-Garé I, Jacobi H, Forlani S, Schmitz-Hübsch T, Filla A, Timmann D, van de Warrenburg BP, Marelli C, Kang J-S, et al. Prediction of the age at onset in spinocerebellar ataxia type 1, 2, 3 and 6. J Med Genet 2014b;51(7):479–86. 10.1136/jmedgenet-2013-102200. [DOI] [PMC free article] [PubMed] [Google Scholar]
- 42.Trouillas P, Takayanagi T, Hallett M, Currier RD, Subramony SH, Wessel K, Bryer A, Diener HC, Massaquoi S, Gomez CM, Coutinho P, Hamida MB, Campanella G, Filla A, Schut L, Timann D, Honnorat J, Nighoghossian N, Manyam B. International Cooperative Ataxia Rating Scale for pharmacological assessment of the cerebellar syndrome. J Neurol Sci 1997;145(2):205–11. 10.1016/S0022-510X(96)00231-6. [DOI] [PubMed] [Google Scholar]
- 43.Zhou H, Nguyen H, Enriquez A, Morsy L, Curtis M, Piser T, Kenney C, Stephen CD, Gupta AS, Schmahmann JD, Vaziri A. (2021). Assessment of gait and balance impairment in people with spinocerebellar ataxia using wearable sensors. Neurological Sciences 10.1007/s10072-021-05657-6 [DOI] [PubMed]
Associated Data
This section collects any data citations, data availability statements, or supplementary materials included in this article.