

Abstract

ortho-Nitrobenzaldehyde (oNBA) is a well-known photoactivated acid and a prototypical photolabile nitro-aromatic compound. Despite extensive investigations, the ultrafast relaxation dynamics of oNBA is still not properly understood, especially concerning the role of the triplet states. In this work, we provide an in-depth picture of this dynamics by combining single- and multireference electronic structure methods with potential energy surface exploration and nonadiabatic dynamics simulations using the Surface Hopping including ARbitary Couplings (SHARC) approach. Our results reveal that the initial decay from the bright ππ* state to the S1 minimum is barrierless. It involves three changes in electronic structure from ππ* (ring) to nπ* (nitro group), to nπ* (aldehyde group), and then to another nπ* (nitro group). The decay of the ππ* takes 60–80 fs and can be tracked with time-resolved luminescence spectroscopy, where we predict for the first time a short-lived coherence of the luminescence energy with a 25 fs period. Intersystem crossing can occur already during the S4 → S1 deactivation cascade but also from S1, with a time constant of about 2.4 ps and such that first a triplet ππ* state localized on the nitro group is populated. The triplet population first evolves into an nπ* and then quickly undergoes hydrogen transfer to form a biradical intermediate, from where the ketene is eventually produced. The majority of the excited population decays from S1 through two conical intersections of equal utilization, a previously unreported one involving a scissoring motion of the nitro group that leads back to the oNBA ground state and the one involving hydrogen transfer that leads to the ketene intermediate.
Introduction
The first studies on the rich photochemistry of nitro-aromatic compounds date back to the early 20th century.1 Shortly after the discovery of those kinds of photoreactions, comprehensive investigations followed to identify potential applications such as photosensitive protecting groups.2−4ortho-Nitrobenzaldehyde (oNBA) is one of these early-discovered photosensitive nitro-aromatic molecules, acting as a photoactivated acid. This characteristic of oNBA is commonly applied, e.g., in different pH-controlled processes,5−8 as a photoactivatable proton source.
The photoisomerization of oNBA to nitrosobenzoic acid occurs through a γ-hydrogen abstraction,9,10 leading to a ketene intermediate. From this stage, the reaction is irreversible and the photoproduct is formed.11,12 The reaction happens with an overall quantum yield of about 50%,11,13 which appears to be rather insensitive to the nature of the available solvent.14 Early investigations of the fundamental relaxation pathway raised the important question regarding the nature of the photoreactive state:14−17 Is the ketene formed via triplet or singlet excited states? Further investigations16,17 suggested that the singlet excited state mechanism is the key pathway for the photorearrangement. However, these investigations did not exclude the presence of a triplet excited state, which is either formed in low yield or happens to be short-lived (less than 35 ps).
As spectroscopic techniques and quantum chemistry programs improved,
it became possible to observe the ultrafast kinetic components and
obtain additional insights into the early events in the relaxation
mechanism of oNBA.12,18−26 The application of fluorescence spectroscopy19,21 enabled detection of two important time constants. Initially, a
significant amount of the fluorescence signal decays within 100 fs
(τ1), which was assigned to the relaxation from the 1ππ* to lower-lying dark 1nπ* states via internal conversion (IC). The second time constant
in the red wing of the signal (τ2 = ∼400 fs)19 τ2 was assigned to the depletion
of the nπ* states, which was suggested to occur
through three different deactivation channels. First, the excited
wave packet could reach a conical intersection (CI) between the ground
state and the first excited state to nonradiatively relax back to
the ground state with a quantum yield of approximately 50%.20 Second, the molecule can relax to the ketene
ground state.20,27 The signal of the ketene intermediate
in the infrared (IR) experiments20 is observed
within a few 100 fs, which indicates that a hot ketene is formed rapidly.
Subsequently, during vibrational cooling, the IR band of the ketene
adopts a room-temperature position and width on a 10 ps time scale
(τ3).20,21,28 Third, another decay channel was found, the delayed rise of the
ketene intermediate (about one-third of the ketene yield) with a time
constant of 220 ps (τ4),27 much longer than vibrational cooling. The phosphorescence spectrum29 of oNBA provides a direct evidence
of the presence of triplet states; therefore, this third channel was
suggested to involve intersystem crossing (ISC) to the triplet manifold.
Based on τ4 and on the assumption that the ketene
is formed in a high yield from the triplet states, the ISC rate constant27 was estimated to be kISC = (2.7 ps)−1, comparable with that found in nitrobenzene.30,31 The ISC is expected27 to take place from
a low-lying 1nπ* state. Thus, based
on El-Sayed’s rule,32 the populated
triplet state is expected to have 3ππ* character.
However, earlier studies on nitrobenzene derivates showed that the
lowest triplet state has an nπ* character.
Consequently, ISC should be followed by IC to lower triplet state(s)
( ).21
).21
Several theoretical investigations12,22−25 in 2008–2011 shed some light on the underlying electronic structure and on possible singlet relaxation pathways of oNBA. Basic assignment of excitation characters of the experimental absorption spectrum was performed by Leyva et al.22,24 with excited state calculations using several different electronic structure methods. More recently, we33 provided a more comprehensive investigation of the vertically excited states of oNBA using several correlated single-reference methods and complete active space second-order perturbation theory (CASPT2), aided by extensive state-of-the-art wave function analysis. The broad tail of the oNBA spectrum—around 300 nm—is due to several nπ* excitations localized on the carbonyl and nitro groups. The higher-energy region (270–240 nm) is composed mainly of states with ππ* and charge-transfer (CT) contributions. A schematic overview of the vertical positions of these states33 is provided in Figure 1 (see the beginning of the Results and Discussion Section for a discussion of these states as well as the triplets).
Figure 1.

Relevant low-lying and bright singlet excited states of oNBA according to ref (33).
Leyva et al.12 investigated two possible deactivation channels that could occur within the singlet manifold after excitation into one of the bright ππ*/CT states. The dominant path involves sequential IC, starting from either the ππ* (La) or ππ* (Lb) state (S5 or S4, respectively, according to ref (33))—depending on the initial excitation wavelength—and ending in the minimum of the S1 (lowest-lying nπ* state localized on the nitro group33). Subsequently, an S1/S0 crossing with a long carbonyl C–H bond length can be reached, preparing the hydrogen transfer (HT) reaction, driven by the hole in the nitro lone pair orbital of the nπ* state.22 From that S1/S0 crossing point, the molecule can either react back to the oNBA ground state or form the ketene intermediate. The second deactivation channel to the ketene intermediate was suggested to start already in the higher excited states (e.g., S3) followed by IC along the HT coordinate. For the sake of comparison of the two pathways, the energy barrier for reaching the HT coordinates was computed, leading to the conclusion that the main pathway includes first the IC cascade and subsequently the ketene formation from the lowest-lying excited state. However, Leyva et al.12 did not include the triplet states in the proposed deactivation channels, instead assuming that the second channel competes with the population of the triplet manifold.
In the present study, we aim at answering several relevant questions about the oNBA photorelaxation that are still open. Regarding the earliest phase of the dynamics, we scrutinize how long-lived the initially excited ππ* states are and whether the system first relaxes to one of the nπ* states or activates the HT/ketene formation process already before. Here, we also clearly assign the experimental 50–100 fs time constant (τ1) obtained from time-resolved fluorescence. We then investigate the fate of the nπ* (S1) gateway state, scrutinizing which deactivation channels exist, their relative importance, their corresponding products, and whether they are specific to oNBA or are inherited from parent compounds. Moreover, we analyze the role of the triplet states and investigate whether ISC occurs from S1 or already from higher-lying states, which electronic characters are involved, how large the ISC yield can be expected to be, and what its time scale is. Additionally, the type of formed triplet state and its possible decay routes and times are revisited. To answer this set of questions, we have explored the potential energy surfaces (PESs) at a high level of theory, including the triplet PESs, in terms of relevant critical geometries. Subsequently, we have performed nonadiabatic dynamics simulation to reinforce our findings and to understand better the time scales, yields, and time-resolved spectra observed after excitation.
Methods
The computations are divided into two steps. In the first step, minima, minimum-energy conical intersections (MECI), and minimum-energy singlet–triplet crossing points (MECP) were optimized and connected through interpolation scans to obtain an overview of the relevant deactivation pathways. In the second step, we performed nonadiabatic dynamics simulations using the Surface Hopping including ARbitary Couplings (SHARC) package.34−36 This step was primarily focused on understanding the initial relaxation from the bright singlet states to the S1 and whether ISC could play a role during this relaxation.
The calculations of the first step were performed side-by-side with the multistate complete active space second-order perturbation theory (MS-CASPT2)37,38 and algebraic diagrammatic construction scheme to second order for the polarization propagator (ADC(2))39−41 methods. Details are given below. These two methods were chosen as appropriate multi- and single-reference levels of theory based on our previous work on the vertical excitation energies of oNBA.33 We employ ADC(2) for its attractive computational cost and its ability to describe the bright ππ* states in the Franck–Condon region accurately. MS-CASPT2 has a much higher computational demand—especially if the bright ππ* states are targeted33—but allows the investigations of the bond reformation steps during ketene formation, which is not doable with ADC(2). The nonadiabatic dynamics simulations in the second step were only performed with ADC(2), due to the high cost and unavailability of gradients of MS-CASPT2. All ADC(2) calculations were performed with TURBOMOLE 7.0,42 all MS-CASPT2 calculations with OpenMolcas 18.0.43
Electronic Structure Level of Theory
The MS-CASPT2 calculations used in the PES exploration employ the cc-pVTZ basis set44 and a complete active space (CAS) with 18 electrons in 14 orbitals (CAS(18,14)), which is the same as used in our previous study.33 The active orbitals are presented in Figure 2. They include six π/π* orbitals of the aromatic ring, three π/π* orbitals of the NO2 group, two lone pair orbitals of the NO2 group, two π/π* orbitals of the carbonyl group, and one lone pair orbital of the carbonyl group. All state-averaging and multistate treatments in our calculations were carried out with either 12 singlet33 or 12 triplet states, denoted as MS(12,12)-CASPT2. The Cholesky decomposition technique43,45 was employed to speed up the calculations. The imaginary level shift46 was set to 0.2 a.u., and the ionization potential-electron affinity (IPEA) shift47 was set to 0.25 a.u., as is recommended for triple-zeta basis sets.48 Further discussion on the MS-CASPT2 level of theory and on its accuracy and robustness in treating the low-lying excited states of oNBA can be found in ref (33).
Figure 2.

Active space employed for the vertical excitation calculations. The top right image shows the atom numbering used below. This active space was already discussed in ref (33).
The ADC(2) calculations used for PES exploration and nonadiabatic dynamics simulations employ the smaller cc-pVDZ basis set. The default auxiliary basis set assigned by Turbomole was used for the resolution-of-identity technique.
Potential Energy Surface Exploration
Table 1 gives an overview of all critical points considered in this work. Because the excited state PESs are quite closely spaced, we only optimized minima on the S0, S1, and T1 adiabatic PESs. Optimization attempts for an S2 or S3 minimum failed. Based on the identified bright singlet state (S4 for ADC(2)), MECIs for the full relaxation cascade S4 → S1 were optimized. For ISC, we optimized two S1/T2 MECPs and a T2/T1 MECI. Finally, to investigate the relaxation and ketene formation processes, we optimized three S1/S0 MECIs and three analogous T1/S0 MECPs.
Table 1. Overview of Considered Critical Points of oNBA and Their Numerical Labels Used Below.
| label | geom. | label | geom. |
|---|---|---|---|
| 1 | S0min | 12 | S1/T2P |
| 2 | S5/S4 | 13 | S1/T2 |
| 3 | S4/S3 | 14 | T2/T1 |
| 4 | S3/S2 | 15 | T1min |
| 5 | S2/S1P | 16 | T1/S0CO |
| 6 | S2/S1 | 17 | T1/S0NO |
| 7 | S1min | 18 | T1/S0HT |
| 8 | S1/S0CO | 19 | T1birmin |
| 9 | S1/S0NO | ||
| 10 | S1/S0HT | ||
| 11 | S0birmin |
The excited state minima, MECIs, and MECPs were optimized through the SHARC package,34−36 using the external optimizer feature of ORCA 4.2.1,49 which was provided with gradients from ADC(2), CASSCF, or MS-CASPT2 through SHARC. CASSCF was only used for preoptimizations. Gradients for MECI optimizations were computed with a penalty-function approach50 and for MECP calculations with the Bearpark–Robb–Schlegel algorithm.51 All optimizations used the smaller cc-pVDZ basis set (see Tables S1 and S2 in the Supporting Information (SI) for a comparison with the larger cc-pVTZ basis). We attempted to optimize most of the structures with both MS-CASPT2 and ADC(2), with few exceptions, as detailed in Table S3 in the SI. Note that the MS-CASPT2 optimizations were generally done with two smaller ASs—a CAS(12,9) with five nitro group orbitals and four π system orbitals and a CAS(12,10) with two nitro group orbitals, four π system orbitals, three aldehyde group orbitals, and the aldehyde σCH orbital.
The optimized geometries were connected through linear interpolation of internal coordinates (LIIC), using Gaussian Z-matrix coordinates (via OpenBabel52) to construct relevant PES segments. These were used to check for AS consistency and to estimate activation barriers, where the barriers found in the LIIC scans are upper limits to the true barriers. All PES segments were recomputed with ADC(2)/cc-pVDZ and MS(12,12)-CASPT2(18,14)/cc-pVTZ (imaginary shift increased to 0.2 a.u.) to obtain consistent energy profiles of the proposed reaction pathways.
Nonadiabatic Dynamics Simulations
Nonadiabatic dynamics simulations including IC and ISC were carried out with the SHARC package.34−36 1000 initial conditions were sampled from the ground state Wigner distribution53,54 computed from an MP2/cc-pVDZ frequency calculation. At each initial geometry, an ADC(2)/cc-pVDZ vertical excitation calculation of 12 excited singlet and 12 triplet states was performed to generate an ensemble-broadened absorption and density-of-state spectra. The initially excited singlet state for each initial condition was selected stochastically55 from the energy window of 4.5–4.7 eV (264–276 nm), which is centered on the second absorption band in analogy to previous transient absorption experiments.19 96 trajectories—86 (90%) of them starting in S4, 9 (9%) in S3, and 1 (1%) in S2—were propagated for 300 fs at ADC(2)/cc-pVDZ level of theory including six singlet (five + ground state) and eight triplet states (chosen based on the density-of-state spectrum). This smaller set of initial conditions still samples the ground state minimum well, as shown in Figure S1. The nuclear dynamics time step was 0.5 fs and 25 substeps were employed for the integration of the electronic equation of motion (0.02 fs) with the local diabatization method,56 using wave function overlaps computed with the WFoverlap program.57 Spin-orbit couplings (SOCs) were computed as previously reported.58 To conserve the total energy, the entire velocity vector was rescaled. An energy-based decoherence correction was applied.59
Trajectories were analyzed in terms of electronic spin-free populations,35 CT character using TheoDORE,60,61 and relevant geometric parameters. The CT numbers were computed for three fragments (C6H4, NO2, CHO) for each trajectory, combined with the electronic coefficients, and finally averaged over all trajectories. Furthermore, the energies and oscillator strengths (relative to S0) from all trajectories and time steps were used to compute a time-dependent luminescence spectrum via Gaussian convolution (full width at half-maximum of 0.25 eV).
Results and Discussion
Vertical Excitations
The vertical excitation energies and characters of the electronic states of oNBA are described in detail in ref (33). Here, we only briefly recapitulate the most relevant information needed for the subsequent discussion. Table 2 shows the vertical excitation results with ADC(2) and MS-CASPT2(18,14); Table S4 in the SI provides some additional wave function descriptors. Figures S2 and S3 show the transition densities. Table 2 also compares the experimental absorption spectrum, which contains four progressively more intense absorption bands/shoulders at about 3.7 eV (least intense), 4.4 eV, 5.2 eV, and 5.7 eV (most intense).24
Table 2. Vertical Excitation Energies (ΔE, in eV), Oscillator Strengths (fosc), and Leading Characters of the Different States of oNBA33a.
| ADC(2)/cc-pVTZ |
MS(12,12)-CASPT2(18,14)/cc-pVTZ |
bexp.24 | ||||||
|---|---|---|---|---|---|---|---|---|
| state | ΔE | fosc | characterc | state | ΔE | fosc | characterd | ΔE |
| S1 | 3.48 | 0.001 | nCOπ* | S1 | 3.58 | 0.001 | nCOπ* | |
| S2 | 3.63 | 0.008 | nNO2–π* | S2 | 3.77 | 0.004 | nNO2–π* | 3.7 |
| S3 | 4.17 | 0.001 | nNO2+π* | S3 | 4.20 | 0.001 | nNO2+π* | |
| S4 | 4.66 | 0.024 | ππ* (Lb) | S4 | 4.54 | 0.003 | ππ* (Lb) | 4.4 |
| S5 | 5.14 | 0.006 | nCOπ* (CT) | S6 | 6.10 | 0.001 | nCOπ* (CT) | |
| S6 | 5.42 | 0.149 | ππ* (La) | S5 | 5.58 | 0.058 | ππ* (La) | 5.2 |
| T1 | 3.14 | nCOπ* | T1 | 3.37 | nCOπ* | |||
| T2 | 3.31 | nNO2–π*/ππ* (La) | T2 | 3.49 | ππ*(NO2) | |||
| T3 | 3.67 | ππ* (NO2) | T3 | 3.53 | nNO2–π*/ππ* (La) | |||
| T4 | 3.87 | nNO2+π*/ππ* (La) | T4 | 3.70 | nNO2+π*/ππ* (La) | |||
More details on state characters and weights can be found in Table S4 and Figures S2 and S3 in the SI.
Experimental results from Gaussian fits to the absorption spectrum.24
See transition densities in Figure S2 in the SI.
See transition densities in Figure S3 in the SI.
The three lowest excited singlet states all have local nπ* character. At the Franck–Condon geometry the S1 is an excitation of the carbonyl lone pair (nCOπ*), whereas S2 and S3 are linear combinations of excitations from the two lone pairs of the nitro group (nNO2–π* and nNO2π*). Due to the nonplanarity of oNBA in the ground state, these states acquire small ππ* contributions and some nonzero oscillator strengths, giving rise to the weak experimental absorption at 3.7 eV. The description of these states is robust regarding the details of the electronic structure calculation,33 considerably simplifying the elucidation of the ketene formation mechanism.
The S4 state is the lowest predominantly ππ* state (the Lb state in Platt’s nomenclature62) of oNBA at an energy of about 4.5 eV (assigned to the absorption band at 4.4 eV). The S5 and S6 states are a charge-transfer nCOπ* and the second ππ* state (La), with different ordering between ADC(2) and MS-CASPT2, but a decent agreement of the ππ* energy with experiment (5.2 eV). The inconsistent description of the charge-transfer nCOπ* between the two methods was already observed in our previous study,33 where we argued that ADC(2) fails in describing this dark state due to its substantial double excitation contributions. We estimate that the charge-transfer nCOπ* is actually located at 6–7 eV,33 too high to affect the processes studied in the present work. While the two methods qualitatively agree on the state characters and energies, they predict rather different oscillator strengths—with ADC(2) predicting the absorption spectrum much better.33 The reason is that the SA(12)-CASSCF results underlying the MS-CASPT2 calculation are missing several bright ππ* states, which diminishes the oscillator strengths of the MS-CASPT2 solutions. Recovering the oscillator strengths would require performing XMS-CASPT2 on the order of 40 states, which is computationally too demanding for the present study. Thus, for the description of the decay from the bright ππ* states to the low-lying states we rely predominantly on ADC(2). The investigation of the ketene formation within the low-lying states is not affected by the shortcomings of MS(12)-CASPT2 to describe the high-lying ππ* states.
The lowest triplet states are found to be of nCOπ*, ππ* (NO2), nNO2π*, and ππ* (La) characters. A particularly interesting state here is the local ππ* (NO2) character, whose singlet state has a very high energy above 6 eV,33 while the triplet state has low energy and plays an important role in the ISC dynamics (see below). The large difference in energy between the singlet and triplet states can be explained by the self-repulsion of the transition density, which is zero for the triplet state.63 Overall, the two methods predict comparable triplet states, albeit with slightly different ordering due to the small energy differences of the T2 and T3. Nonetheless, both methods provide energies in good agreement with each other, so we are confident that the accuracy of the triplet states is sufficient to study ISC, relaxation, and ketene formation.
Optimized Excited State Minima and Crossing Points
Figure 3 provides a roadmap of the 19 critical geometries optimized in the present work. For ease of reference, the schematic is divided into four stages (called “Paths”). Path I represents the near-barrierless relaxation cascade from the initially populated bright states. For ADC(2), we only considered S4 as the initial state, whereas for MS-CASPT2, we considered both S4 and S5 as potential initial states. Path II subsumes all deactivation paths of the S1 minimum through several MECIs, leading either back to the initial oNBA geometry or to the biradical intermediate. Alternatively, Path III describes ISC from S1, followed by triplet IC, and ends at the T1 minimum. Finally, Path IV collects the different deactivation channels from the T1 minimum, which to some extent mirror the channels in Path II. Energies at all minima and geometric parameters for all structures obtained with ADC(2) and MS-CASPT2 are collected in Tables S5 to S8 in the SI. Corresponding transition densities are given in Figures S4 and S5.
Figure 3.

Schematic roadmap that provides an overview of the critical geometries optimized with ADC(2) and MS-CASPT2, as well as paths between them. Colored squares denote some of the optimized geometries that appear in more than one PES scan in Figure 4.
The ground state geometry (optimized with MP2/cc-pVDZ) agrees with previous X-ray64 and computational12,22,23,25 findings, exhibiting nonzero dihedral angles of the aldehyde (∼8°) and nitro groups (∼35°) with the ring due to steric effects. The nonplanarity induces mixing between n and π orbitals, contributing to the mixed electronic structure encountered for the vertically excited states discussed previously.33
The obtained crossing points in Path I—S5/S4 (MS-CASPT2 only), S4/S3, S3/S2, and two S2/S1 crossings (all optimized with ADC(2))—show relatively little variation in their geometries. The crossing between ππ* (Lb) and nNO2+π* states (S4/S3) exhibits nitro and aldehyde groups in the molecular plane. The lower crossing points—between nNO2π*, nNO2–π*, and nCOπ* (S3/S2 and both S2/S1)—are characterized by a planar ring and a nitro group rotated out of the molecular plane. The two S2/S1 crossings differ in their geometry and wave function characters—at the S2/S1 (P for planar) with a planar (i.e., nonpyramidalized) nitro group the nCOπ* and nNO2–π* states cross. The other S2/S1 crossing (without superscript) exhibits a pyramidalized nitro group but is energetically less favorable. No true minima on the adiabatic PESs of the S2 to S5 states could be located—in contrast to ref (12) who reported a ππ* minimum on the S3 PES—as all optimization attempts ended at crossing points. Path I ends at the S1 minimum (nNO2π*), which is fully planar, with the aldehyde hydrogen atom (H12) in the same plane as the nitro oxygen atom (O8), prearranging oNBA for the HT reaction.12
Within Path II, we have identified three relevant S1/S0 MECIs. The first intersection, S1/S0CO (Path IIa), is planar and exhibits an elongated C10–O11 bond but no sign of HT. It is a crossing point of the nCOπ* state with the closed-shell ground state. While the ADC(2) geometry has a rather low energy, the MS-CASPT2 optimized geometry is energetically inaccessible with a barrier of almost 2 eV (Table S7), supposedly due to a very short O11–H13 distance (distance between carbonyl O and aromatic H). The S1/S0 crossing (Path IIb)—involving the nNO2–π* and closed-shell states—is also planar and shows no sign of HT, but is distinguished by an acute O8–N7–O9 bond angle of about 90° and a shortened N7–C5 bond. This crossing is reminiscent of a S1/S0 CI of nitrobenzene,65 which has been predicted to lead to recovery of the ground state nitro species. However, for oNBA the S1/S0 crossing was not reported previously to the best of our knowledge. The third crossing is termed S1/S0HT and corresponds to the HT pathway first reported by Migani et al.12 in 2011. The geometry is planar, with an elongated C10–H12 bond and a newly formed O8–H12 bond (see Tables S6 and S8in the SI). The optimized geometries show good agreement between the two levels of theory. At this crossing, the transition density shows excitations between the nCO, σCH (aldehyde), and πNO2 orbitals. From each of the three S1/S0 MECIs, oNBA could potentially return back to the S0 minimum or (with different propensities) continue toward the biradical structure in the S0, as discussed below.
As indicated in Path III in Figure 3, from the S1 minimum, there are also two potential pathways for ISC, given by the two MECPs S1/T2P (“planar”) and S1/T2. Both geometries feature a nitro group that is rotated out of the molecular plane (by about 19 °); however, in the latter point, the nitro group is also pyramidalized. In that sense, they resemble the S1/S2P and S1/S2 MECIs. The S1/T2P MECP enables the transition between the 1nNO2–π* and 3nCOπ* characters, with negligible SOCs (7 cm–1 at ADC(2) level). This point could not be located with MS-CASPT2. The S1/T2 MECP couples the 1nNO2π* and 3πNO2π* characters via sizable SOCs of 50 or 70 cm–1 (ADC(2) or MS-CASPT2), as shown in Tables S9 and S10 in the SI. We also tried optimizing various other singlet–triplet crossings for higher states (S2 with T3 and T4, S3 with T5 and T6, S4 with T7), but we did not obtain any with relevant SOCs. Hence, we assume that ISC would predominantly occur from the S1 minimum via the S1/T2 MECP. Once in the T2 state, IC via a T2/T1 crossing leads efficiently to the T1 minimum (3nNO2–π* character). This minimum somewhat resembles the S1 minimum but is not fully planar at ADC(2) level (the nitro group is rotated and slightly pyramidalized) and thus might be less efficient for HT.
From the T1 minimum (Path IV), we identified three T1/S0 MECPs that each resembles one of the three S1/S0 MECIs of Path II. T1/S0CO features a strong C10–O11 bond elongation and a very high MS-CASPT2 energy. T1/S0 displays a very acute O8–N7–O9 bond angle, and additional pyramidalization of the nitro group (unlike the corresponding S1/S0 crossing). T1/S0HT is planar, with the aldehyde H half-way between the aldehyde C and the nitro O atoms. Hence, the T1/S0 crossing might enable HT with a certain probability after ISC to the S0 occurred. Alternatively, the molecule could stay in the triplet during HT.
Additionally, we investigated the possibility of HT occurring either in the singlet (Path II) or the triplet manifold (Path IV), guided by previous theoretical investigations.12,65 This channel was only studied with MS-CASPT2, as the ground state acquires a strong biradical character during the aldehyde-ketene transformation.12 We optimized two structures, S0bir min and T1 min, which are the singlet and triplet versions of the “Bir” structure of ref (12). Both geometries exhibit elongated C10–H12 bonds and a large a11,10,6 bond angle (C–C–O), which is characteristic of the ketene formation. As S0bir min is located on the S0 adiabatic surface, it is photochemically accessed from an S1/S0 CI, and we investigated all three intersections. The T1 min is formally accessible from the T1 min via a transition state. However, instead of optimizing such a transition state, we assumed that the T1 min–T1bir min conversion pathway passes close to a T1/S0 crossing.
Excited State Potential Energy Surfaces
Figure 4 presents LIIC scans of all pathways presented in Figure 3. The scans were computed side-by-side with ADC(2) and MS-CASPT2(18,14). The main goals of this comparison are (i) scrutinizing the relative importance of the different relaxation pathways and (ii) mutually validating the two methods and scrutinizing their robustness. We expect that ADC(2) is reliable for Paths I and III, but not for Paths II and IV due to the presence of near-degeneracies of S0 with the excited states. In turn, Path I might not be reliably described with MS-CASPT2 due to the difficulties in describing the higher-lying states;33 MS-CASPT2 is expected to describe Paths II, III, and IV appropriately.
Figure 4.

Relaxation pathways obtained at ADC(2)/cc-pVDZ (a) and MS(12,12)-CASPT2(18,14)/cc-pVTZ (b, c) levels of theory. Green indicates the S0, blue excited singlet states, and red triplet states. The numeric labels indicate the different geometries along the scan, as given in Figure 3 (and Table 1). The reaction coordinate is given by LIIC scan segments between the geometries indicated by the numerical labels. Colored squares indicate geometries that are shown in multiple panels. Note that the ADC(2) and MS-CASPT2 scans are based on different geometries, as given in Table S3.
ADC(2)
The relaxation pathway from the initially excited S4 (ππ*) state to the S1 minimum (Path I) is shown in Figure 4a (leftmost segment). Since this path is barrierless and no true minima in S2, S3, or S4 were found, we expect very rapid decay to the S1 minimum. This is consistent with findings from femtosecond fluorescence spectroscopy,21,27 where the first time constant (τ1 < 100 fs) was assigned to the depletion of the bright ππ* state. The transition from S2 to S1 can occur via two different MECIs, S2/S1P (geometry 5) or S2/S1 (geometry 6), which are compared in Figure S6a,b. Based on the slope of the PESs and the required nuclear motion, we estimate that S2/S1P dominates decay to S1, even though it involves one additional change of character (nNO2+π* → nCOπ* → nNO2π*).
As depicted in Figure 4a, Path I exhibits a number of singlet–triplet crossings (S3/T6, S3/T5, S2/T4, S2/T3), which potentially could enable early ISC before reaching the S1. Examination of these crossing points revealed only small SOCs (<15 cm–1). Also considering the absence of any true minima in S2, S3, or S4, based on the scans we expect that IC to S1 is predominant over ISC from the higher singlet states.
Path II entails three PES segments (Figure 4a, Paths IIa, IIb, IIc) to reach the respective S1/S0 MECI, from where the system could return to the oNBA ground state or continue to the ketene form. These segments involve energy barriers of 0.51 eV (S1/S0CO), 0.18 eV (S1/S0), and ≤0.11 eV (S1/S0HT). However, as the MECIs are not properly described with ADC(2), we discuss these crossings in the MS-CASPT2 Section.
Alternatively, from the S1 minimum two S1/T2 MECPs can be reached. One of these two pathways is shown in Figure 4, whereas both are compared in Figure S6c,d. The pathway via the S1/T2 shown in Figure 4 involves the larger barrier from the S1 minimum (0.47 eV) but also larger SOCs (50 cm–1), leading to a higher probability to switch from the singlet to the triplet manifold. The alternative pathway via S1/T2P involves a smaller barrier (0.39 eV) but much smaller SOCs (7 cm–1). These findings indicate that ISC from the S1 minimum is probably not very efficient and will likely be inferior to IC to the S0, at least in the gas phase. However, based on our results, S1 → T2 ISC is the most likely explanation for the experimentally observed triplet yield.27 Once in the triplet manifold, the T1 minimum can be reached barrierlessly from T2.
As the S1 and T1 PESs are rather similar, Path IV is a close analogue of Path II. The energy barriers from the T1 minimum to the T1/S0 MECPs are 0.64 eV (T1/S0CO), 0.08 eV (T1/S0), and < 0.15 eV (T1/S0HT) at ADC(2) level. As there are no SOCs for the S0 available in Turbomole, the importance of these crossings is discussed below with the MS-CASPT2 results.
MS-CASPT2
The MS-CASPT2(18,14) scans of Path I are shown in Figure 4b. Unfortunately, due to the usage of a smaller active space in the optimization, no accurate S5/S4 MECI could be optimized (energy gap of 0.3 eV). Thus, the additional PES segment from the S5 state (initially excited state with MS-CASPT2) to the S4/S3 crossing is shown in Figure S6e. In any case, the experimental observation of a fast ππ* decay (τ1 < 100 fs)21,27,28 indicates that decay from the bright state should be easily possible. Starting in the S4, MS-CASPT2 predicts an essentially barrierless pathway to the S1 minimum, just like ADC(2).
One of the main motivations for employing MS-CASPT2(18,14) was to ensure a proper description of the S1/S0 and T1/S0 crossing points (Paths II and IV) that are critical for the description of oNBA’s photochemistry. MS-CASPT2 shows that the S1/S0CO deactivation channel (Path IIa) that was predicted by ADC(2) is actually inoperative in oNBA, due to an energy barrier of more than 2 eV. Similar results for other carbonyls have been reported previously in the literature.66 The S1/S0 (IIb) and S1/S0HT (IIc) crossing points exhibit much smaller barriers of 0.28 and ≤0.22 eV, respectively, at MS-CASPT2 level—consistent with ADC(2). As previously reported for nitrobenzene,65 the S1/S0 CI leads to the regeneration of the initial nitro species because of the “sloped” topography of the intersection.67 On the contrary, the S1/S0HT CI is “peaked” (the S0 and S1 surfaces are sloped in different directions in Figure 4b, IIc) and therefore enables photoproduct formation. The barrier heights for S1/S0 and S1/S0HT are very similar, which could be a reason for the approximately 50% quantum yield of ketene formation after photoexcitation.11,13
The barrier for ISC in Path III is found to be about 0.37 eV at MS-CASPT2 level, with an impressive SOC of 70 cm–1, consistent with ADC(2). Considering that the ISC activation barrier is larger than the one for IC to the S0, it is easily understandable that ISC is only a minor process in oNBA. The further IC within the triplet states is barrierless with MS-CASPT2, just like at ADC(2) level.
The last segments in Figure 4b show Path IV, the pathways from the T1 minimum to the T1/S0 MECIs. As with ADC(2), at the MS-CASPT2 level Path IV is very similar to Path II. The T1/S0CO is shown to be energetically unreachable (1.6 eV above T1 minimum), whereas T1/S0 and T1/S0HT are both accessible (barriers of 0.44 and 0.20 eV, respectively). The SOCs at the two latter MECPs are very large (64 cm–1 for T1/S0, 35 cm–1 for T1/S0HT), which indicates that reverse ISC might remove a small fraction of the triplet population before it can react toward the biradical structure.
The extended Paths IIa–c in Figure 4c (left) show how the singlet biradical structure could be formed from the S1/S0 MECIs. Here, both Path IIb and IIc in principle allow the formation of this biradical structure; however, Path IIb involves a second barrier and thus is more likely to lead back to the S0 minimum of oNBA. In Figure 4c (right), a similar picture is given for the triplet Paths IVa–c. Due to a rather high barrier in the T1 in Path IVb, in the triplet, only Path IVc seems viable. Along this path, the triplet biradical structure can form quickly from the 3nNO2–π* minimum after crossing a small barrier and without any nonadiabatic transition, unlike in the singlet pathway. Assuming that the molecule only stays for short times close to the T1/S0 MECPs, we expect that most triplet population eventually ends up in the biradical T1 minimum. This latter minimum can be identified as the basin where the triplet population is trapped for 220 ps27 before forming the ketene, due to the slow reverse ISC from the triplet to the closed-shell singlet ketene ground state. A similar mechanism was already discussed previously68 for ortho-nitrobenzylacetate.
Nonadiabatic Dynamics Simulations
In this section, we present dynamics simulations using the SHARC method34−36 at the ADC(2)/cc-pVDZ level of theory, primarily to describe the IC processes from the initially excited state to the S1 minimum and any concurrent ISC processes (Paths I and III). As discussed above, the single-reference method ADC(2) cannot accurately describe the pathways where the S0 becomes degenerate with the excited states, so Paths II and IV are not the focus of these simulations. We discuss below in a separate section the trajectories that attempted to follow these paths.
Simulated Absorption Spectrum
The simulated absorption spectrum of oNBA at ADC(2) level is shown in Figure 5 (black line). Apart from a systematic energy shift of 0.3 eV, the spectrum exhibits excellent agreement with the experimental one (green), reproducing the energy gaps, relative intensities, and bandwidths of the four absorption bands (at 340, 290, 240, and 210 nm).24 As already discussed previously,33 this shows that ADC(2) provides a good description of the excited singlet states of oNBA in the Franck–Condon region.
Figure 5.

Computed absorption spectrum (black) of oNBA at ADC(2)/cc-pVDZ level of theory, based on 1000 initial conditions sampled from a Wigner distribution. Individual state contributions are given as shaded areas. The gray box denotes the excitation window (4.5–4.7 eV), primarily exciting the S4 state (ππ* Lb). The dark-green line shows the experimental absorption spectrum.24
For the nonadiabatic dynamics simulations, we excite oNBA in the second absorption band, corresponding to the excitation of the lowest ππ* state,33 respectively, to the 260–270 nm (4.7 eV) excitation wavelength used in previous experiments.18−21,27 To obtain a sufficient number of trajectories, we set the excitation window to 4.5 eV (276 nm) to 4.7 eV (264 nm). In this window, the brightest state is the one with ππ* (Lb) character, which at most initial condition geometries is the S4 adiabatic state. From the 1000 initial conditions, 96 were selected55 (86 starting in S4, 9 in S3, 1 in S2).
Electronic Evolution
The 96 selected initial conditions were propagated with SHARC for 300 fs. 67 trajectories successfully ended at 300 fs, whereas 29 trajectories terminated earlier. The majority of crashes were due to convergence problems close to near-degeneracies with the S0 (see Path II in Figure 4a). We will first discuss the initial decay and ISC as represented by the entire swarm of trajectories. Subsequently, the crashed trajectories will be discussed separately with respect to potential relaxation channels to S0.
In Figure 6, we show the evolution of the adiabatic electronic populations based on all 96 trajectories (including the crashed ones). The net number of hops between the different adiabatic states (panel (a)) clearly show that the majority (≥80%) of the trajectories is initially excited to S4 and sequentially decays through S3 and S2 to S1. This confirms the predominant initial relaxation pathway of oNBA to be S4 → S3 → S2 → S1 (in terms of adiabatic states). Additionally, it can be seen that four trajectories returned to the ground state, although the S1–S0 coupling is not correctly described at ADC(2) level (these four trajectories crash soon after switching to S0 due to convergence issues).
Figure 6.

(a) Net population transfers extracted from the dynamics simulation. (b–d) Electronic populations (thin lines) fitted with three different unimolecular first-order kinetic models. (e–g) Representations of the three kinetic models and fitted time constants (in fs, with uncertainty from bootstrapping69). Singlets are given in shades of blue and triplets in shades of red.
Overall, only seven of 96 trajectories (7%) underwent ISC to the triplet states within 300 fs, at various different singlet–triplet crossings: S4/T7, S3/T4, S2/T3, and S1/T2. All of these crossing points were found in the course of the potential energy surface exploration as well; however, the PES scans (Figure 4) suggested that ISC from higher singlets is probably less relevant than ISC from S1. The dynamics results instead provide evidence that ISC can occur with small probability during the entire initial relaxation cascade, although no dominant MECP/ISC channel can be identified due to the small number of singlet–triplet-hops. In any case, trajectories undergoing ISC eventually end up in T1 due to a deactivation cascade similar to the one shown in Path I in Figure 4a.
In order to estimate a confidence
interval for the ISC yield of
our calculations, we employ the Wilson score interval.70 The interval is given by 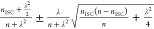 , where n = 96 is the number
of trajectories, nISC = 7 is the number
of trajectories undergoing ISC, and λ = 1.96 is a parameter
that corresponds to a 95 % confidence level. We thus estimate the
ISC yield as 9 ± 5%. This should be regarded as a lower bound,
as more trajectories might undergo ISC later than 300 fs after excitation.
This statistical analysis shows that even with our relatively small
number of trajectories undergoing ISC, we can say with high confidence
that ISC in oNBA does occur. By applying the equation
separately to ISC from higher states (5 trajectories, 7 ± 5 %)
and from S1 (2 trajectories, 3 ± 3 %), we find that
our simulations do not allow estimating whether ISC from higher states
or from S1 will dominate.
, where n = 96 is the number
of trajectories, nISC = 7 is the number
of trajectories undergoing ISC, and λ = 1.96 is a parameter
that corresponds to a 95 % confidence level. We thus estimate the
ISC yield as 9 ± 5%. This should be regarded as a lower bound,
as more trajectories might undergo ISC later than 300 fs after excitation.
This statistical analysis shows that even with our relatively small
number of trajectories undergoing ISC, we can say with high confidence
that ISC in oNBA does occur. By applying the equation
separately to ISC from higher states (5 trajectories, 7 ± 5 %)
and from S1 (2 trajectories, 3 ± 3 %), we find that
our simulations do not allow estimating whether ISC from higher states
or from S1 will dominate.
Next, we extracted time constants for the population transfer in oNBA from the adiabatic populations, as shown in Figure 6b,d. For each of the three panels, we performed a global population fit using the first-order sequential kinetic models shown in panels (e–g). The first model (panels (b) and (e)) allows extracting time constants for the relaxation cascade from adiabatic S4 to S1; these time constants are about 40 fs (S4 → S3), 25 fs (S3 → S2), and 65 fs (S2 → S1). The first of these time constants is an approximation to the decay time of the initially populated bright ππ* state.
In the second kinetic model (Figure 6c,f), we obtain the overall decay time constant of the higher singlet states—which is equivalent to the rise time of S1—as about 140 fs. We are not aware of an experimental time constant that directly probes the appearance of the lowest nπ* state. The time constant for ketene formation is reported to be a few 100 fs20 (τ2, typically about 400 fs18,19,21). This is consistent with a mechanism where first the nπ* minimum is reached in 140 fs and subsequently the ketene is accessed via the small barrier in Path IIc (see Figure 4c).
The third kinetic model (Figure 6d,g) provides an estimate for the overall ISC time scale in oNBA. Due to the small number of trajectories undergoing ISC and the short simulation time, the ISC time constant of 2.4 ps has a rather large uncertainty of 0.8 ps. Nonetheless, the simulations provide strong evidence that the IC cascade from S4 to S1 is significantly faster than ISC. The obtained few-ps time constant is also consistent with results reported for other nitro-aromatic compounds71 and nicely matches an experimental estimate of the ISC time constant in oNBA (2.7 ps).27
Oftentimes, the time constants obtained from fitting the adiabatic populations cannot be mapped one-to-one to the experimentally measured time constants.72,73 Thus, in Figure 7a, we present a simulated fluorescence spectrum, based on the energy differences and oscillator strengths between active state and ground state along all of the trajectories. Note that this spectrum was not convoluted along the time axis and thus cannot be directly compared with experimental time-resolved fluorescence spectra with a broad instrument response function. However, the simulated spectrum allows extracting a time constant for the fluorescence decay, shown in panel (b) by a monoexponential fit of the spectral data integrated between 3.4 and 5.5 eV. The resulting time constant of 85 fs is slightly longer than the lifetime of the adiabatic S4 state. This computed fluorescence decay constant is fully consistent with the 50–100 fs experimental time constants (τ1) reported previously for femtosecond fluorescence and transient absorption experiments.19−21 This very good agreement is a clear indication that our ADC(2) trajectories correctly represent the early deactivation cascade of oNBA from the initial ππ* state to the S1 state. Unfortunately, due to the limited length of our simulations (300 fs) and the incorrect S1/S0 crossing topology with ADC(2), the simulations do not allow pinpointing the origin of the second experimental time constant (τ2) of about 400 fs.19
Figure 7.

(a) Simulated fluorescence spectrum based on energy differences and oscillator strengths between active state and ground state. The data was convoluted with Gaussians of 0.25 eV full width at half-maximum, but not convoluted along the time axis. (b) Integrated fluorescence signal between 3.4 and 5.5 eV and monoexponential fit with τ = 85 fs. (c) Time evolution of the CT character of the electronic wave function in terms of local excitations on the ring, NO2, CHO, and CT excitations. The local excitation character decays monoexponentially with τ = 67 fs.
We note that, interestingly, we find coherent oscillations in the emission energy as well as integrated intensity of the fluorescence spectrum (see Figure 7a,b). These oscillations have a period of approx. 25 fs. No experimental evidence of such early coherences in oNBA have been reported before, presumably due to the temporal resolution of previous experiments. The experimental observation of this coherent signal would provide further evidence that our picture of the early deactivation cascade of oNBA is accurate.
To obtain some insight into the evolution of the electronic wave function character, we computed the average CT numbers60,74 for the active state, shown in panel (c). Initially, the electronic state is mostly described as localized on the aromatic ring with some CT contributions, consistent with the ππ* (Lb) state as given in Table S4. The excitation contributions localized on the ring decay with a time constant of 67 fs and exhibit slight oscillations with a period of about 25 fs. This suggests that the fluorescence signal in Figure 7b stems predominantly from the initially excited ππ* (Lb) state. At later times, the electronic excitation localizes predominantly on the NO2 group, consistent with the nNO2–π* character of the S1 minimum.
Nuclear Motion
In Figure 8, we plot the evolution of various geometric parameters of oNBA. In panels (a–c), we show the average of the ring C–C distances, the C–N distances, and the distance between aromatic C and aldehyde C. All three show strongly coherent oscillations (i.e., occurring in phase in all trajectories) in the first part of the simulation. Intriguingly, these oscillations have about the same 25 fs oscillation period that we found above (Figure 7) for the fluorescence emission and excitation character (localized on the ring). Thus, it appears that excitation to the ππ* (Lb) state induces coherent ring breathing and a strong contraction of the C–N and C–Caldehyde distances that modulate emission energy and intensity. This is consistent with the bonding character of the excited πNO2* orbital between the C–N and C–Caldehyde atoms, as shown in Figure 2. Panel (d) shows that also the N–O bonds stretch after excitation, but they do not exhibit coherent oscillations. On the contrary, the C–C–O and O–N–O bond angles (panels (e) and (f)) also exhibit similar, albeit weaker, oscillations. The O–N–O bond angle also decreases significantly while moving from the Franck–Condon region (125°) to the S1 minimum (115°). This is relevant because the S1/S0 crossing point is located at small O–N–O bond angles.
Figure 8.

Time evolution of nuclear geometry parameters. Black lines indicate the average. (a) Average ring C–C distance. (b) C–N distance. (c) C–Caldehyde distance. (d) Average N–O distance. (e) C–C–O angle. (f) O–N–O angle. (g) Average dihedral between NO2 group and ring. (h) Average dihedral between CHO group and ring. (i) ONO2–Haldehyde distance.
Figure 8g,h represents the dihedrals between the functional groups and the aromatic ring. As discussed above, some critical points including the S1/T1 minima and the S1/S0 and T1/S0 crossing points are fully planar, and consequently the initially out-of-plane functional groups (NO2: −33°; CHO: −10°) start to rotate after excitation. The NO2 group becomes planar after about 150 fs, but rotates further and reaches a dihedral of about +15° at 300 fs. The CHO group planarizes significantly faster (reaching 0° after about 50 fs), rotates slightly further, and then reverses the rotation direction. It thus seems to follow the nitro group. As shown in Figure 8i, the concerted rotations of the two functional groups shorten the distance between the aldehyde H atom and the closer nitro O atom. This prepares the molecule for HT (to form the ketene). As shown in the lower part of panel (i), a small number of trajectories indeed perform such HT, leading to O–H bond lengths of about 1 Å. The trajectories show that such short O–H distances only occur in S1, S0, or T1.
We present additional plots of the time evolution of geometry parameters in Figure S7 in the SI. Findings from these plots are: (i) the C=O and aldehyde C–H bonds do not oscillate notably but stretch occasionally, (ii) the six C atoms of aromatic ring stay (quite strictly) in one plane during the entire dynamics, and (iii) the nitro group becomes less rigid after excitation and can pyramidalize to some extent. Figure S8 further illustrates how rigid the aromatic ring is during the entire dynamics—the most mobile atoms are the aldehyde H and the nitro O atoms. Figure S9 demonstrates that the S2/S1P crossing is the preferred MECI for the decay to S1, as suggested above.
In order to scrutinize the relevance of the optimized MECIs and MECPs for the actual dynamics, we performed some additional analysis. A plot of the adiabatic energies and energy gaps at all hopping events is given in Figure S10, showing that hops tend to occur at much higher energies than the MECIs/MECPs. Additionally, Figure S11 shows the distribution of the geometry parameters of the hopping points relative to the corresponding MECIs and MECPs. It can be seen that the hopping geometries are distributed rather broadly around the optimized points. This reproduces the typical finding in surface hopping trajectories that the optimized crossing points are not the places where hops actually occur due to the internal energy of the molecule, although the optimized crossings are still useful in predicting the dynamics. Note that these figures only consider the excited state–excited state crossings, as the interaction with the ground state is discussed below.
Decay to the Ground State
As mentioned earlier, ADC(2) is a single-reference method that does not properly represent the crossing seams between the S0 reference state and the excited states. In particular, this leads to very small hopping probabilities from the open-shell S1 to the closed-shell S0. Instead of hopping, most of the trajectories with small S0–S1 gaps encounter severe convergence problems, usually if the underlying Hartree–Fock becomes near-degenerate with the lowest configuration interaction singles excited state. These convergence problems typically lead to the early termination of the affected trajectory. Some trajectories instead propagate for some time in the S1 state at “negative” excitation energies (i.e., where the ADC(2) open-shell state is lower than the MP2 closed-shell state) before terminating. Thus, ADC(2)-based trajectories cannot provide quantitative results about the decay from S1 to S0. However, we can still obtain some qualitative understanding of the likelihood of the different decay pathways by analyzing at which geometries the trajectories stopped or where they spend more time.
Out of the 29 trajectories that terminated early, 27 stopped while their active state was the S0, S1, or T1 state, mostly with very small energy gaps between the S0 and the excited states. Only two trajectories stopped in S2 or T3 for other convergence-related reasons. Hence, generally, the trajectories first went through the relaxation cascade from the initial bright state down to S1 before they attempted decay to S0 or T1 and encountered convergence issues.
In Figure 9, we show the time evolution of four important degrees of freedom for early-terminated trajectories. We plot degrees of freedom that were identified (see Tables S6 and S8) to lead to the three different S1/S0 crossing points. In panels (a) and (b), we show the distance of the aldehyde H atom to the neighboring nitro O atom and the aldehyde C atom. It can be seen that a significant number of the crashed trajectories terminated while in the process of HT (i.e., with short OH and long CH distances). Some other trajectories stopped while the carbonyl C=O bond length was significantly extended, to about 1.6 Å, as shown in panel (c). It can be seen that such long C=O bond lengths start to appear earlier than long aldehyde C–H bond lengths. Panel (d) shows that some trajectories terminated with rather small ONO bond angles. Hence, the figure shows that trajectories were terminating early either because they were attempting HT or otherwise attempting to relax to S0. Lastly, panel (e) presents the relevant energy gaps between S1 and S0. It can be observed that nearly all of the crashed trajectories exhibit energy gaps that are very small or negative, as mentioned above. The early-terminated trajectories showed that there are only three crossing regions with the S0—indicated with the superscripts CO, NO, and HT—and our PES exploration did not miss any relevant crossing region.
Figure 9.

(a–d) Time evolution of the bond lengths O8–H12, C10–H12, and C10–O11 for trajectories that terminated early (i.e., did not reach 300 fs). (e) Energy gaps between S1 and S0. Dots indicate the last point of each trajectory.
Investigating the early-terminated trajectories is a useful strategy to identify potential decay pathways, but it is less useful to estimate the relative importance of the decay pathways. As ADC(2) does not describe the decay to the S0 correctly, we provide an estimation of the relative importance of the decay channels based on how often regions of zero/negative S1–S0 gap are visited. Figure 10 shows a scatter plot of the C10–O11 and C10–H12 bond lengths as well as the O8–N7–O9 bond angle. Faint gray dots show the full distribution of the swarm of trajectories over all time steps. Stronger black dots mark those geometries where the S1–S0 gap is zero or negative, and decay to S0 might be very likely.
Figure 10.

(a–c) Scatter plots of the C10–O11 and C10–H12 bond lengths and the O8–N7–O9 bond angle. Gray dots show the distribution of the entire swarm of 96 trajectories over all time steps. Black dots are all time steps where the S1 energy is below the S0 for any of those trajectories. Colored dots indicate the position of the S1/S0NO (blue) and S1/S0 (yellow) and S1/S0HT (red) crossing points optimized with ADC(2).
There are three clearly distinguishable clusters of such geometries. The first cluster can be identified by an aldehyde C–H bond that is longer than approx. 1.3 Å—hence, this cluster is related to the S1/S0HT decay channel. 47% of all black dots fulfill this bond length criterion. Notably, the termination points have much longer C–H bond lengths than the S1/S0 crossing point, indicating that ADC(2) can actually describe the first part of the HT process. A second cluster is found for ONO angles below 100°, located close to the S1/S0NO crossing point and accounting for another 47% of all points with negative S1–S0 gaps. The third—much smaller cluster—is distinguished by C=O bond lengths that are longer than 1.6 Å. This cluster can be assigned to the S1/S0 crossing point and includes 4% of the black dots. The remaining 2% of black dots are not captured by these simple thresholds because they fall in between the clusters. Note that the trajectories undergoing ISC are included in these percentages.
The relative occurrence of the three negative-energy regions in the trajectories matches well with the information that we have obtained from the optimizations. At ADC(2) level of theory, both the S1/S0HT and S1/S0 crossing points are easily accessible from the S1 minimum, with barriers of about 0.1 and 0.2 eV, respectively. On the contrary, the S1/S0CO crossing point is located much higher, with a barrier of about 0.5 eV. These barriers roughly explain why the latter crossing point is much less populated than the S1/S0 and S1/S0NO crossing points. Moreover, our MS-CASPT2 calculations showed that ADC(2) severely underestimates the energy of the S1/S0 crossing point, which should be about 2 eV above the S1 minimum. Consequently, this crossing point should be excluded from our analysis. The remaining data in our simulations then shows that there should be two decay pathways in oNBA with roughly equal likelihood. These are (i) the decay back to the ground state via the S1/S0NO crossing point that involves a scissoring motion of the nitro group and (ii) the transfer of the aldehyde H atom to the nitro group to form the ketene intermediate. The ratio between these paths that we obtain is 47:47, which explains the experimental value of approximately 50% for the quantum yield of nitrosobenzoic acid.
Photophysics of oNBA
The findings regarding the photophysics of oNBA from the present work are summarized in Figure 11, divided into three main processes.
Figure 11.

Overview scheme over the likely photophysics of oNBA after excitation to the ππ* (Lb) state.
The nonadiabatic dynamics of oNBA is initiated by the vertical excitation to the ππ* (Lb) state—which is the lowest-energy ππ* state (although it is not particularly bright)—or a higher state. This excitation first launches an ultrafast, barrierless singlet decay cascade of the molecule via the nNO2+π* and nCOπ* states to the minimum of the nNO2π* state on the S1 adiabatic potential energy surface. Our dynamics simulations show that this process occurs with near-unity yield, although some ISC might occur already on the way to the S1 minimum. The decay can be observed with time-resolved luminescence spectroscopy, where we find an 85 fs decay of the ππ* emission, compared to a value of 100 fs from experiment (τ1).19,21 Furthermore, we predict a short-lived coherent oscillation in the fluorescence energy with a period of about 25 fs that has not been reported before to the best of our knowledge. The oscillations arise from coherent bond vibrations induced by populating the ππ* state and vanish within the lifetime of that state. The decay cascade leads to a rise time of the S1 population of about 140 fs.
The second significant process is ISC. Our dynamics simulations predict an ISC yield of at about 9% after 300 fs and an ISC time constant of 2.4 ± 0.8 ps, providing computational confirmation of the experimental estimate of 2.7 ps.27 ISC was found to take place to some extent during the S4 → S1 cascade as well as from the S1, although our simulations do not allow pinpointing the predominant ISC channel due to the small number of ISC events. Large SOC matrix elements are only found among the singlet and triplet excitations localized on the nitro group, so it is possible that the population of the low-lying aldehyde nCOπ* state slightly slows down ISC compared to nitrobenzene. We expect that the triplet state involved in ISC is the 3πNO2π* state (the ππ* state localized on the nitro group), from which the lower 3nNO2–π* is immediately reached. However, only a small barrier needs to be overcome to leave the 3nNO2π* minimum and either access T1/S0 crossings or undergo HT in the T1. This HT in the triplet state leads to a biradical intermediate that is relatively long-lived because of very small SOCs (0.5 cm–1), but eventually undergoes ISC back to the S0, forming the closed-shell ketene. This slow process was already previously suggested20 to explain the delayed rise time of the ketene of about 200 ps (τ4).
The third important decay process is the direct IC from the S1 minimum back to the S0. We identified three potential MECIs, but the S1/S0CO intersection is not energetically feasible according to MS-CASPT2. The two remaining MECIs are the S1/S0 and S1/S0HT intersections. The S1/S0 intersection is reached by a scissoring motion of the nitro group, exhibits a barrier of about 0.2–0.3 eV, and leads back to the oNBA ground state with near-unity efficiency due to the sloped shape of the conical intersection. The S1/S0HT intersection is due to HT from the aldehyde group to the nitro group. The simulations show that such HT can only occur in S1, S0, or T1, but not in higher states. A barrier of 0.1–0.2 eV has to be overcome for HT, which is slightly smaller than for S1/S0, but according to the dynamics simulations, the S1/S0NO and S1/S0 regions are visited with approximately equal probabilities. From the S1/S0HT crossing, we expect that a significant fraction of the trajectories continue with HT,25 form the biradical structure and eventually the ketene. However, the peaked shape of the S1/S0 MECI might allow some fraction of the molecules to return back to the oNBA ground state.
Conclusions
In this work, we present an extensive theoretical study on the excited state relaxation mechanisms of ortho-nitrobenzaldehyde (oNBA), with focus on the initial internal conversion, the possibility of intersystem crossing, and the formation of the ketene intermediate. We employed two electronic structure methods: ADC(2), a single-reference method that enables us to efficiently explore the excited state potential energy surfaces, and MS-CASPT2, a multireference method that provides expensive yet reliable results where ADC(2) is unreliable. The two methods agree very well, except for the higher-lying excited states and for one deactivation side channel.
Our results are summarized in full detail in Figure 11 and the Photophysics of oNBA Section. We fully characterized the decay cascade from the initially excited ππ* (Lb) state (S4) to the nNO2–π* minimum (S1), providing information on all relevant conical intersections (CIs), involved electronic states, deactivation time scales, and expected spectroscopic signals. From the S1 minimum, we characterized both intersystem crossing and internal conversion. Intersystem crossing can occur with low probability either during the initial decay cascade or from the S1 minimum, but is significantly slower than internal conversion processes. Once in the triplet state, the molecule quickly reaches the T1 minimum of oNBA and from there forms a long-lived biradical structure via HT. Eventually, the triplet crosses back to a singlet state and then forms a ketene. The investigation of the internal conversion pathways from the S1 minimum showed that two CIs are responsible for the decay. One CI that involves a scissoring motion of the nitro group leads to the recovery of the oNBA ground state. The other CI is connected with HT from the aldehyde to the nitro group. It likely leads to the formation of the ketene intermediate, but we cannot exclude that some fraction of HTs are reversed and lead back to the oNBA ground state. The two CIs will be activated with roughly equal probability, explaining the 40–50% quantum yield of ketene formation.75
Acknowledgments
The authors thank Leticia González for suggesting the topic and fruitful discussions as well as Veronica Leyva and Inés Corral Perez for their inspiring previous works on ortho-nitrobenzaldehyde. They acknowledge the Austrian Science Fund (FWF) for funding (Doctoral College Advanced Functional Materials, project number DOC85), the University of Vienna for continuous support, and the Vienna Scientific Cluster (VSC4) for the generous allocation of computational resources.
Supporting Information Available
The Supporting Information is available free of charge at https://pubs.acs.org/doi/10.1021/acs.jpca.3c02899.
Additional details on the basis set comparison and optimization settings; results on vertical excitation calculations; optimized geometries; potential energy surfaces and dynamics; and cartesian coordinates of all optimized geometries (PDF)
Open Access is funded by the Austrian Science Fund (FWF).
The authors declare no competing financial interest.
Special Issue
Published as part of The Journal of Physical Chemistry Avirtual special issue “Roland Lindh Festschrift”.
Supplementary Material
References
- Ciamician G.; Silber P. Chemische Lichtwirkungen. Ber. Dtsch. Chem. Ges. 1901, 34, 2040–2046. 10.1002/cber.190103402118. [DOI] [Google Scholar]
- Patchornik A.; Amit B.; Woodward R. B. Photosensitive protecting groups. J. Am. Chem. Soc. 1970, 92, 6333–6335. 10.1021/ja00724a041. [DOI] [Google Scholar]
- Kaplan J. H.; Forbush B.; Hoffman J. F. Rapid photolytic release of adenosine 5’-triphosphate from a protected analog: utilization by the sodium:potassium pump of human red blood cell ghosts. Biochemistry 1978, 17, 1929–1935. 10.1021/bi00603a020. [DOI] [PubMed] [Google Scholar]
- Barltrop J. A.; Plant P. J.; Schofield P. Photosensitive protective groups. Chem. Commun. 1966, 822 10.1039/c19660000822. [DOI] [Google Scholar]
- Causgrove T. P.; Dyer R. B. Nonequilibrium protein folding dynamics: laser-induced pH-jump studies of the helix-coil transition. Chem. Phys. 2006, 323, 2–10. 10.1016/j.chemphys.2005.08.032. [DOI] [Google Scholar]
- Abbruzzetti S.; Viappiani C.; Small J. R.; Libertini L. J.; Small E. W. Kinetics of Local Helix Formation in Poly-L-Glutamic Acid Studied by Time-Resolved Photoacoustics: Neutralization Reactions of Carboxylates in Aqueous Solutions and Their Relevance to the Problem of Protein Folding. Biophys. J. 2000, 79, 2714–2721. 10.1016/S0006-3495(00)76509-X. [DOI] [PMC free article] [PubMed] [Google Scholar]
- Abbruzzetti S.; Grandi E.; Viappiani C.; Bologna S.; Campanini B.; Raboni S.; Bettati S.; Mozzarelli A. Kinetics of Acid-Induced Spectral Changes in the GFPmut2 Chromophore. J. Am. Chem. Soc. 2005, 127, 626–635. 10.1021/ja045400r. [DOI] [PubMed] [Google Scholar]
- Mikšovská J.; Larsen R. W. Photothermal Studies of pH Induced Unfolding of Apomyoglobin. J. Protein Chem. 2003, 22, 387–394. 10.1023/A:1025398325578. [DOI] [PubMed] [Google Scholar]
- De Mayo P.; Reid S. T. Photochemical rearrangements and related transformations. Q. Rev., Chem. Soc. 1961, 15, 393–417. 10.1039/qr9611500393. [DOI] [Google Scholar]
- Kuberski S.; Gȩbicki J. Evidence for a ketene intermediate in the photochemical transformation of matrix-isolated o-nitrobenzaldehyde. J. Mol. Struct. 1992, 275, 105–110. 10.1016/0022-2860(92)80185-K. [DOI] [Google Scholar]
- Leighton P. A.; Lucy F. A. The Photoisomerization of the o-Nitrobenzaldehydes I. Photochemical Results. J. Chem. Phys. 1934, 2, 756–759. 10.1063/1.1749391. [DOI] [Google Scholar]
- Migani A.; Leyva V.; Feixas F.; Schmierer T.; Gilch P.; Corral I.; González L.; Blancafort L. Ultrafast irreversible phototautomerization of o-nitrobenzaldehyde. Chem. Commun. 2011, 47, 6383–6385. 10.1039/c1cc11085c. [DOI] [PubMed] [Google Scholar]
- Sugimori A.; Nakata K.; Hirai H. A Comparison of the Radiation-Induced Reaction with Photochemical and Thermal Reactions. I. The Radiation-Induced Isomerization of o-Nitrobenzaldehyde in the Solid State. Bull. Chem. Soc. Jpn. 1966, 39, 2613–2615. 10.1246/bcsj.39.2613. [DOI] [Google Scholar]
- George M. V.; Scaiano J. C. Photochemistry of o-nitrobenzaldehyde and related studies. J. Phys. Chem. A 1980, 84, 492–495. 10.1021/j100442a007. [DOI] [Google Scholar]
- Filby W. G.; Günther K. The Photoreactive State in the o-Nitrobenzaldehyde Rearrangement. Z. Phys. Chem. 1975, 95, 289–292. 10.1524/zpch.1975.95.4-6.289. [DOI] [Google Scholar]
- Filby W. G.; Günther K. ESR Studies of the o-Nitrobenzaldehyde Rearrangement: Estimation of the Quantum Yields of Radical Formation. Z. Phys. Chem. 1981, 125, 21–26. 10.1524/zpch.1981.125.1.021. [DOI] [Google Scholar]
- Yip R. W.; Sharma D. K. The reactive state in the photo-rearrangement of o-nitrobenzaldehyde. Res. Chem. Intermed. 1989, 11, 109–116. 10.1163/156856789X00014. [DOI] [Google Scholar]
- Laimgruber S.; Schreier W. J.; Schrader T.; Koller F.; Zinth W.; Gilch P. The Photochemistry of o-Nitrobenzaldehyde as Seen by Femtosecond Vibrational Spectroscopy. Angew. Chem., Int. Ed. 2005, 44, 7901–7904. 10.1002/anie.200501642. [DOI] [PubMed] [Google Scholar]
- Heinz B.; Schmierer T.; Laimgruber S.; Gilch P. Excited state processes of nitrobenzaldehydes probed by ultrafast fluorescence and absorption spectroscopy. J. Photochem. Photobiol., A 2008, 199, 274–281. 10.1016/j.jphotochem.2008.06.011. [DOI] [Google Scholar]
- Schmierer T.; Schreier W. J.; Koller F. O.; Schrader T. E.; Gilch P. Impact of vibrational excitation on the kinetics of a nascent ketene. Phys. Chem. Chem. Phys. 2009, 11, 11596–11607. 10.1039/b915451e. [DOI] [PubMed] [Google Scholar]
- Fröbel S.; Gilch P. Femtochemistry of selected di-substituted benzenes. J. Photochem. Photobiol., A 2016, 318, 150–159. 10.1016/j.jphotochem.2015.05.036. [DOI] [Google Scholar]
- Leyva V.; Corral I.; Schmierer T.; Heinz B.; Feixas F.; Migani A.; Blancafort L.; Gilch P.; González L. Electronic states of o-nitrobenzaldehyde: a combined experimental and theoretical study. J. Phys. Chem. A 2008, 112, 5046–5053. 10.1021/jp711949j. [DOI] [PubMed] [Google Scholar]
- Leyva V.; Corral I.; González L. Ortho-Nitrobenzaldehyde 1:1 Water Complexes. The Influence of Solute Water Interactions in the Vertical Excited Spectrum. Z. Phys. Chem. 2008, 222, 1263–1278. 10.1524/zpch.2008.5387. [DOI] [Google Scholar]
- Leyva V.; Corral I.; Schmierer T.; Gilch P.; González L. A comparative analysis of the UV/Vis absorption spectra of nitrobenzaldehydes. Phys. Chem. Chem. Phys. 2011, 13, 4269–4278. 10.1039/c0cp01372b. [DOI] [PubMed] [Google Scholar]
- Leyva V.; Corral I.; Feixas F.; Migani A.; Blancafort L.; González-Vázquez J.; González L. A non-adiabatic quantum-classical dynamics study of the intramolecular excited state hydrogen transfer in ortho-nitrobenzaldehyde. Phys. Chem. Chem. Phys. 2011, 13, 14685–14693. 10.1039/c1cp20620f. [DOI] [PubMed] [Google Scholar]
- Leyva V.The Excited State Intramolecular Hydrogen Transfer Mechanism of ortho-Nitrobenzaldehyde: a Quantum Chemical and Molecular Dynamics Study. Ph.D. thesis; Friedrich Schiller University Jena, 2012. [Google Scholar]
- Laimgruber S.; Schmierer T.; Gilch P.; Kiewisch K.; Neugebauer J. The ketene intermediate in the photochemistry of ortho-nitrobenzaldehyde. Phys. Chem. Chem. Phys. 2008, 10, 3872–3882. 10.1039/b800616d. [DOI] [PubMed] [Google Scholar]
- Schmierer T.; Ryseck G.; Villnow T.; Regner N.; Gilch P. Kasha or state selective behavior in the photochemistry of ortho-nitrobenzaldehyde?. Photochem. Photobiol. Sci. 2012, 11, 1313–1321. 10.1039/c2pp25057h. [DOI] [PubMed] [Google Scholar]
- Cheng S.; Song P.; Yang S.; Yin H.; Han K. Fluorescence and solvent-dependent phosphorescence studies of o-nitrobenzaldehyde: A combined experimental and theoretical investigation. Phys. Chem. Chem. Phys. 2010, 12, 9067–9074. 10.1039/c002270e. [DOI] [PubMed] [Google Scholar]
- Takezaki M.; Hirota N.; Terazima M.; Sato H.; Nakajima T.; Kato S. Geometries and Energies of Nitrobenzene Studied by CAS-SCF Calculations. J. Phys. Chem. A 1997, 101, 5190–5195. 10.1021/jp970937v. [DOI] [Google Scholar]
- He Y.; Gahlmann A.; Feenstra J.; Park S.; Zewail A. Ultrafast Electron Diffraction: Structural Dynamics of Molecular Rearrangement in the NO Release from Nitrobenzene. Chem. Asian J. 2006, 1, 56–63. 10.1002/asia.200600107. [DOI] [PubMed] [Google Scholar]
- El-Sayed M. A. Spin-Orbit Coupling and the Radiationless Processes in Nitrogen Heterocyclics. J. Chem. Phys. 1963, 38, 2834–2838. 10.1063/1.1733610. [DOI] [Google Scholar]
- Vörös D.; Mai S. Excited states of ortho-nitrobenzaldehyde as a challenging case for single- and multi-reference electronic structure theory. J. Comput. Chem. 2023, 1381–1394. 10.1002/jcc.27093. [DOI] [PubMed] [Google Scholar]
- Richter M.; Marquetand P.; González-Vázquez J.; Sola I.; González L. SHARC: ab initio molecular dynamics with surface hopping in the adiabatic representation including arbitrary couplings. J. Chem. Theory Comput. 2011, 7, 1253–1258. 10.1021/ct1007394. [DOI] [PubMed] [Google Scholar]
- Mai S.; Marquetand P.; González L. Nonadiabatic dynamics: The SHARC approach. WIREs Comput. Mol. Sci. 2018, 8, e1370 10.1002/wcms.1370. [DOI] [PMC free article] [PubMed] [Google Scholar]
- Mai S.; Richter M.; Heindl M.; Menger M. F. S. J.; Atkins A.; Ruckenbauer M.; Plasser F.; Ibele L. M.; Kropf S.; Oppel M.. et al. SHARC2.1: Surface Hopping Including Arbitrary Couplings — Program Package for Non-Adiabatic Dynamics. sharc-md.org 2019.
- Finley J.; Malmqvist P.-Å.; Roos B. O.; Serrano-Andrés L. The multi-state CASPT2 method. Chem. Phys. Lett. 1998, 288, 299–306. 10.1016/S0009-2614(98)00252-8. [DOI] [Google Scholar]
- Andersson K.; Malmqvist P. A.; Roos B. O.; Sadlej A. J.; Wolinski K. Second-order perturbation theory with a CASSCF reference function. J. Phys. Chem. A 1990, 94, 5483–5488. 10.1021/j100377a012. [DOI] [Google Scholar]
- Trofimov A. B.; Schirmer J. An efficient polarization propagator approach to valence electron excitation spectra. J. Phys. B: At., Mol. Opt. Phys. 1995, 28, 2299–2324. 10.1088/0953-4075/28/12/003. [DOI] [Google Scholar]
- Trofimov A.; Krivdina I.; Weller J.; Schirmer J. Algebraic-diagrammatic construction propagator approach to molecular response properties. Chem. Phys. 2006, 329, 1–10. 10.1016/j.chemphys.2006.07.015. [DOI] [Google Scholar]
- Dreuw A.; Wormit M. The algebraic diagrammatic construction scheme for the polarization propagator for the calculation of excited states. Wiley Interdiscip. Rev.: Comput. Mol. Sci. 2015, 5, 82–95. 10.1002/wcms.1206. [DOI] [Google Scholar]
- TURBOMOLE V7.0 2015, a development of University of Karlsruhe and Forschungszentrum Karlsruhe GmbH, 1989–2023, TURBOMOLE GmbH, 2007–2023. http://www.turbomole.com. (last accessed June 14, 2023).
- Galván I. F.; Vacher M.; Alavi A.; Angeli C.; Aquilante F.; Autschbach J.; Bao J. J.; Bokarev S. I.; Bogdanov N. A.; Carlson R. K.; et al. OpenMolcas: From source code to insight. J. Chem. Theory Comput. 2019, 15, 5925–5964. 10.1021/acs.jctc.9b00532. [DOI] [PubMed] [Google Scholar]
- Dunning T. H. Gaussian basis sets for use in correlated molecular calculations. I. The atoms boron through neon and hydrogen. J. Chem. Phys. 1989, 90, 1007–1023. 10.1063/1.456153. [DOI] [Google Scholar]
- Aquilante F.; Lindh R.; Pedersen T. B. Unbiased auxiliary basis sets for accurate two-electron integral approximations. J. Chem. Phys. 2007, 127, 114107 10.1063/1.2777146. [DOI] [PubMed] [Google Scholar]
- Forsberg N.; Malmqvist P.-Å. Multiconfiguration perturbation theory with imaginary level shift. Chem. Phys. Lett. 1997, 274, 196–204. 10.1016/S0009-2614(97)00669-6. [DOI] [Google Scholar]
- Ghigo G.; Roos B. O.; Malmqvist P.-Å. A modified definition of the zeroth-order Hamiltonian in multiconfigurational perturbation theory (CASPT2). Chem. Phys. Lett. 2004, 396, 142–149. 10.1016/j.cplett.2004.08.032. [DOI] [Google Scholar]
- Zobel J. P.; Nogueira J. J.; González L. The IPEA dilemma in CASPT2. Chem. Sci. 2017, 8, 1482–1499. 10.1039/C6SC03759C. [DOI] [PMC free article] [PubMed] [Google Scholar]
- Neese F. The ORCA program system. Wiley Interdiscip. Rev.: Comput. Mol. Sci. 2012, 2, 73–78. 10.1002/wcms.81. [DOI] [Google Scholar]
- Levine B. G.; Coe J. D.; Martínez T. J. Optimizing Conical Intersections without Derivative Coupling Vectors: Application to Multistate Multireference Second-Order Perturbation Theory (MS-CASPT2)†. J. Phys. Chem. B 2008, 112, 405–413. 10.1021/jp0761618. [DOI] [PubMed] [Google Scholar]
- Bearpark M. J.; Robb M. A.; Schlegel H. B. A direct method for the location of the lowest energy point on a potential surface crossing. Chem. Phys. Lett. 1994, 223, 269–274. 10.1016/0009-2614(94)00433-1. [DOI] [Google Scholar]
- O’Boyle N. M.; Banck M.; James C. A.; Morley C.; Vandermeersch T.; Hutchison G. R. Open Babel: An open chemical toolbox. J. Cheminf. 2011, 3, 33 10.1186/1758-2946-3-33. [DOI] [PMC free article] [PubMed] [Google Scholar]
- Schinke R.Photodissociation Dynamics: Spectroscopy and Fragmentation of Small Polyatomic Molecules; Cambridge University Press, 1995. [Google Scholar]
- Dahl J. P.; Springborg M. The Morse oscillator in position space, momentum space, and phase space. J. Chem. Phys. 1988, 88, 4535–4547. 10.1063/1.453761. [DOI] [Google Scholar]
- Barbatti M.; Granucci G.; Persico M.; Ruckenbauer M.; Vazdar M.; Eckert-Maksić M.; Lischka H. The on-the-fly surface-hopping program system Newton-X: Application to ab initio simulation of the nonadiabatic photodynamics of benchmark systems. J. Photochem. Photobiol. A 2007, 190, 228–240. 10.1016/j.jphotochem.2006.12.008. [DOI] [Google Scholar]
- Granucci G.; Persico M.; Toniolo A. Direct semiclassical simulation of photochemical processes with semiempirical wave functions. J. Chem. Phys. 2001, 114, 10608–10615. 10.1063/1.1376633. [DOI] [Google Scholar]
- Plasser F.; Ruckenbauer M.; Mai S.; Oppel M.; Marquetand P.; González L. Efficient and Flexible Computation of Many-Electron Wave Function Overlaps. J. Chem. Theory Comput. 2016, 12, 1207–1219. 10.1021/acs.jctc.5b01148. [DOI] [PMC free article] [PubMed] [Google Scholar]
- Mai S.; Plasser F.; Pabst M.; Neese F.; Köhn A.; González L. Surface Hopping Dynamics Including Intersystem Crossing using the Algebraic Diagrammatic Construction Method. J. Chem. Phys. 2017, 147, 184109 10.1063/1.4999687. [DOI] [PubMed] [Google Scholar]
- Granucci G.; Persico M.; Zoccante A. Including quantum decoherence in surface hopping. J. Chem. Phys. 2010, 133, 134111 10.1063/1.3489004. [DOI] [PubMed] [Google Scholar]
- Plasser F.; Lischka H. Analysis of Excitonic and Charge Transfer Interactions from Quantum Chemical Calculations. J. Chem. Theory Comput. 2012, 8, 2777–2789. 10.1021/ct300307c. [DOI] [PubMed] [Google Scholar]
- Plasser F. TheoDORE: A toolbox for a detailed and automated analysis of electronic excited state computations. J. Chem. Phys. 2020, 152, 084108 10.1063/1.5143076. [DOI] [PubMed] [Google Scholar]
- Platt J. R. Classification of Spectra of Cata-Condensed Hydrocarbons. J. Chem. Phys. 1949, 17, 484–495. 10.1063/1.1747293. [DOI] [Google Scholar]
- Kimber P.; Plasser F. Toward an understanding of electronic excitation energies beyond the molecular orbital picture. Phys. Chem. Chem. Phys. 2020, 22, 6058–6080. 10.1039/D0CP00369G. [DOI] [PubMed] [Google Scholar]
- Coppens P.; Schmidt G. M. J. X-ray diffraction analysis of o-nitrobenzaldehydes. Acta Crystallogr. 1964, 17, 222–228. 10.1107/S0365110X64000585. [DOI] [Google Scholar]
- Mewes J.-M.; Jovanović V.; Marian C. M.; Dreuw A. On the molecular mechanism of non-radiative decay of nitrobenzene and the unforeseen challenges this simple molecule holds for electronic structure theory. Phys. Chem. Chem. Phys. 2014, 16, 12393–12406. 10.1039/C4CP01232A. [DOI] [PubMed] [Google Scholar]
- Marsili E.; Prlj A.; Curchod B. F. E. Caveat when using ADC(2) for studying the photochemistry of carbonyl-containing molecules. Phys. Chem. Chem. Phys. 2021, 23, 12945–12949. 10.1039/D1CP02185K. [DOI] [PMC free article] [PubMed] [Google Scholar]
- Atchity G. J.; Xantheas S. S.; Ruedenberg K. Potential energy surfaces near intersections. J. Chem. Phys. 1991, 95, 1862–1876. 10.1063/1.461036. [DOI] [Google Scholar]
- Mewes J.-M.; Dreuw A. On the role of singlet versus triplet excited states in the uncaging of ortho-nitrobenzyl caged compounds. Phys. Chem. Chem. Phys. 2013, 15, 6691–6698. 10.1039/c3cp44338h. [DOI] [PubMed] [Google Scholar]
- Nangia S.; Jasper A. W.; Miller T. F.; Truhlar D. G. Army Ants Algorithm for Rare Event Sampling of Delocalized Nonadiabatic Transitions by Trajectory Surface Hopping and the Estimation of Sampling Errors by the Bootstrap Method. J. Chem. Phys. 2004, 120, 3586–3597. 10.1063/1.1641019. [DOI] [PubMed] [Google Scholar]
- Wilson E. B. Probable Inference, the Law of Succession, and Statistical Inference. J. Am. Stat. Assoc. 1927, 22, 209–212. 10.1080/01621459.1927.10502953. [DOI] [Google Scholar]
- Zobel J. P.; González L. Nonadiabatic Dynamics Simulation Predict Intersystem Crossing in Nitroaromatic Molecules on a Picosecond Time Scale. ChemPhotoChem 2019, 3, 833–845. 10.1002/cptc.201900108. [DOI] [PMC free article] [PubMed] [Google Scholar]
- Mai S.; González L. Unconventional two-step spin relaxation dynamics of [Re(CO)3(im)(phen)]+ in aqueous solution. Chem. Sci. 2019, 10, 10405–10411. 10.1039/C9SC03671G. [DOI] [PMC free article] [PubMed] [Google Scholar]
- Valverde D.; Mai S.; Canuto S.; Borin A. C.; González L. Ultrafast Intersystem Crossing Dynamics of 6-Selenoguanine in Water. JACS Au 2022, 2, 1699–1711. 10.1021/jacsau.2c00250. [DOI] [PMC free article] [PubMed] [Google Scholar]
- Mai S.; Plasser F.; Dorn J.; Fumanal M.; Daniel C.; González L. Quantitative wave function analysis for excited states of transition metal complexes. Coord. Chem. Rev. 2018, 361, 74–97. 10.1016/j.ccr.2018.01.019. [DOI] [Google Scholar]
- Galbavy E. S.; Ram K.; Anastasio C. 2-Nitrobenzaldehyde as a chemical actinometer for solution and ice photochemistry. J. Photochem. Photobiol., A 2010, 209, 186–192. 10.1016/j.jphotochem.2009.11.013. [DOI] [Google Scholar]
Associated Data
This section collects any data citations, data availability statements, or supplementary materials included in this article.