Abstract
Ionic liquid viscosity is one of the most important properties to consider for practical applications. Yet, the connection between local structure and viscosity remains an open question. This article explores the structural origin of differences in the viscosity and viscoelastic relaxation across several ionic liquids, including cations with alkyl, ether, and thioether tails, of the imidazolium and pyrrolidinium families coupled with the NTf2– anion. In all cases, for the systems studied here, we find that pyrrolidinium-based ions are “harder” than their imidazolium-based counterparts. We make a connection between the chemical concept of hardness vs softness and specific structural and structural dynamic quantities that can be derived from scattering experiments and simulations.
Introduction
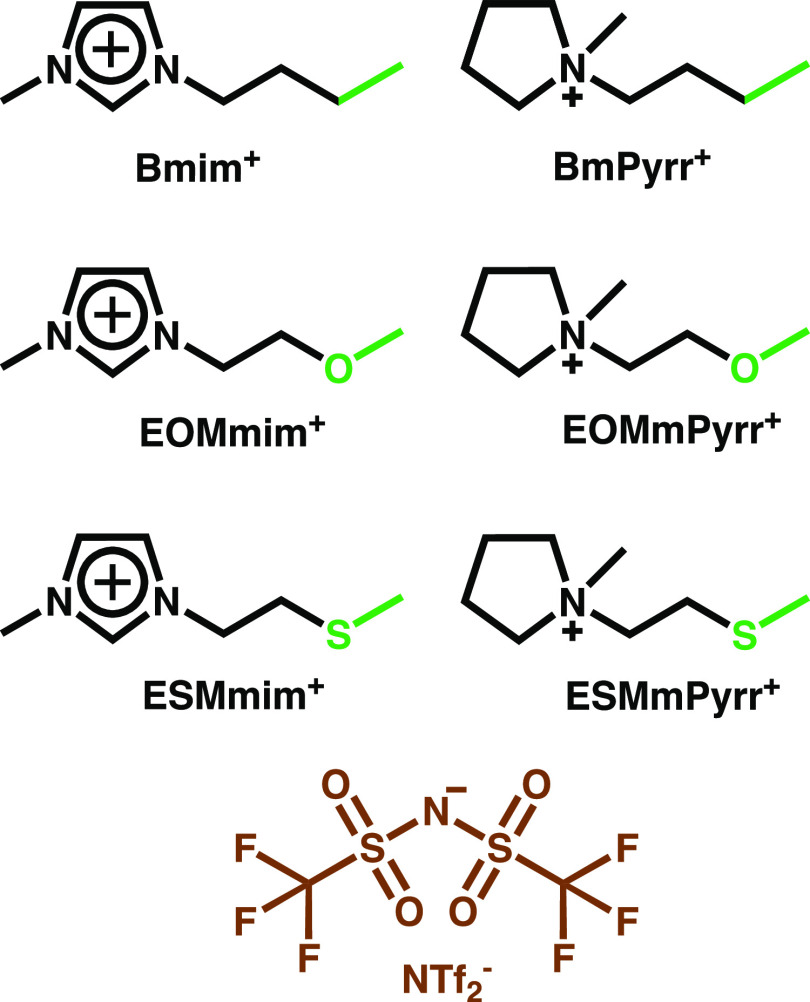
In contrast to conventional solvents or their mixtures, where friction in different liquid locations is expected to be homogeneous, ionic liquids show remarkable frictional heterogeneity.1−8 For example, small neutral probes will undergo random walks where the “step distance” very much depends on their proximity to charges. On a short time scale, even intramolecular components of ILs will show differences in mobility depending on whether these are charge-depleted or part of charge networks. Understanding the interplay between liquid structure, friction, and ultimately the macroscopic viscosity of ILs is important because of technical and economic implications. Such considerations affect applications in separations, batteries, heat transfer, and tribology, to mention just a few.9−16 Efforts have been underway to better understand the role that specific chemical substitutions including the introduction of ether and thioether moieties have on transport properties.17−21 Our experimental and computational work in this article focuses on ionic liquids (ILs) based on the popular imidazolium and pyrrolidinium cations coupled with the NTf2– anion, which are expected to have good mobilities22 and reasonably low viscosities.23−29 We include the prototypical alkyl-tail versions of these, and also ether- and thioether-substituted analogues as shown in Figure 1. Data on density, conductivity, viscosity, and Tg are compared for all of these systems, and their structure is characterized via X-ray scattering. Simulations help us go beyond what we can measure by connecting the static structure of these ILs as well as their structural dynamics1−4,30−37 with the viscosity and viscoelastic relaxation. We will show that this exercise will help us further our chemical intuition on the concept of harder and softer ions. Our goal is to connect a set of physical functions and quantities, including the intensity of subcomponents of S(q), the time relaxation of subcomponents of S(q, t), the time-dependent Green–Kubo expressions for the viscoelastic relaxation, and the macroscopic viscosity, with simple chemical concepts. Ultimately, in the simplest possible terms, we want to answer how ion hardness manifests in structural dynamic and transport-related properties that we can measure or compute, with the idea of being able to recognize such patterns for other systems in the future.
Figure 1.
Ionic liquids comprising the imidazolium and pyrrolidinium cations paired with the NTf2– anion. The color scheme highlights the definition used in subsequent sections for cationic-head, cationic-tail, and anion; the figure also defines our naming convention for the different species.
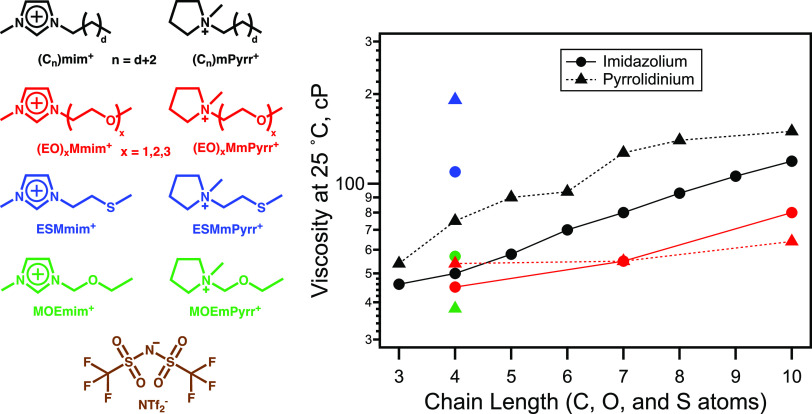
To motivate our discussion, we note from Figure 2 that at room temperature, each member in the family of the alkylated pyrrolidinium-based ILs (Cnmpyrr+/NTf2–) is more viscous than the corresponding imidazolium-based (Cnmim+/NTf2–) counterpart. With limited experimental data, this also appears to be true for shorter-chain ethyl ether- and thioether-substituted cations (red and blue points, respectively). Notice that in the case of repeating ethyl ether units, or in the case where only one methylene group separates the ring and the oxygen substituent, the cation order is reversed.
Figure 2.
Ionic structures (left) corresponding to ILs for which the viscosities at 25 °C (calculated from VTF fits) vs chain length are plotted on the right. Colors on the left match those of the symbols on the right. Alkylimidazolium NTf2– viscosities are from Tariq et al.24 Alkylpyrrolidinium NTf2– viscosities for n = 3, 6, and 10 are from Jin et al.,25 the one for n = 4 is from Funston et al.,26 and those for n = 5, 7, and 8 are from Lall-Ramnarine et al.27 Ether imidazolium and pyrrolidinium NTf2– viscosities with an ethylene bridge for n = 7 and 10, as well as for n = 4 for imidazolium, are from Lall-Ramnarine et al.27 while n = 4 for pyrrolidinium is from Funston et al.28 Ether imidazolium and pyrrolidinium NTf2– viscosities with a methylene bridge are from Chen et al.29
As is well established,5,27,38−46 often ionic liquids can be described as systems with a fully percolating charge network with tails that act as spacers between charge alternating strands. In a set of prior articles,1,2 we explored hypotheses as to which structural motifs common to all ILs contributed the most to the viscoelastic relaxation. For example, for C8mim+/NTf2– and C2mim+/NTf2– kept at the same viscosity value, about 65% of the viscoelastic relaxation could be ascribed to positive-negative charge network dynamics.1 Even when intermediate range order (across-charge strand correlations) was significant, such as in the case of C8mim+/NTf2–, the dynamics of ions at these intermediate ranges associated with the pre-peak only modestly contributed to this relaxation by about 6%. Instead, correlations at shorter distance, what we call adjacency correlations, made up the second largest contribution to the viscoelastic relaxation. Given the importance that the charge network appears to have in defining viscosity and the viscoelastic relaxation,1−3,34,37 this article is set to explore differences in the static structure and its relaxation of imidazolium-based and pyrrolidinium-based ILs coupled with NTf2–; the goal is to establish simple principles that explain the observed trends across these.
Methods
Materials
All chemicals used in the syntheses were of reagent grade obtained from commercial sources and used as received. 1-Methylimidazole, 1-methylpyrrolidine, and 2-chloroethyl methyl sulfide were purchased from Sigma-Aldrich. Lithium bis(trifluoromethylsulfonyl)imide was obtained from IoLiTec, Inc. Dimethyl sulfoxide-d6 was purchased from Cambridge Isotope Laboratories. 1H and 13C NMR spectra were recorded on a Bruker 400 MHz NMR spectrometer with Topspin software.
Synthesis of Thioether Chloride Salt Precursors
Synthesis of 1-Methyl-1-(2-(methylthio)ethyl)pyrrolidinium Chloride (ESMmPyrrCl)
1-Methylpyrrolidine (5.00 g, 0.0587 mol) was reacted with one equivalent of 2-chloroethyl methyl sulfide (7.32 g, 0.0587 mol) in a round-bottom flask with 30 mL of acetonitrile. The reactants were added under N2, and the flask was then sealed. The reaction was set up in an ice bath and stirred for 10 days at room temperature. The reaction mixture was then rotary evaporated to remove residual solvent, and the resulting pale-yellow crystals were isolated by vacuum filtration while washing with 200 mL of ethyl acetate and 40 mL of diethyl ether in a moisture-free tent. The resulting product was an ivory-colored crystalline solid (10.20 g, 89%, molar mass 195.01 g/mol). 1H (400 MHz; DMSO-d6) δ 2.09 (s, 4H), 2.15 (s, 3H), 2.87–2.92 (t, 2H), 3.01 (s, 3H), 3.48 (t, 4H), 3.53–3.57 (t, 2H); 13C (100 MHz; DMSO-d6) δ 14.60, 21.04, 26.07, 47.54, 61.93, 63.43.
Synthesis of 1-Methyl-3-(2-(methylthio)ethyl)imidazolium Chloride (ESMmimCl)
1-Methylimidazole (9.92 g, 0.121 mol) was reacted with 1.2 equivalents of 2-chloroethyl methyl sulfide (16.03 g, 0.145 mol) in a three-neck round-bottom flask with 60 mL of acetonitrile. The reaction was stirred for 30 min at 0 °C while purging with N2. It was then left to stir at 55 °C for 2 weeks. The reaction mixture was concentrated in vacuo. The resulting product was a pale-yellow liquid (23.67 g, >99%, molar mass 192.71 g/mol). 1H (400 MHz; DMSO-d6) δ 2.10 (s, 3H), 2.94–2.97 (t, 2H), 3.89 (s, 3H), 4.39–4.42 (t, 2H), 7.75 (d, 1H), 7.85 (d, 1H), 9.35 (s, 1H); 13C (100 MHz; DMSO-d6) δ 14.17, 32.92, 35.73, 47.35, 122.44, 123.49, 136.94.
Synthesis of Thioether Ionic Liquids
Synthesis of 1-Methyl-1-(2-(methylthio)ethyl)pyrrolidinium Bis(trifluoromethylsulfonyl)imide (ESMmPyrrNTf2)
1-Methyl-1-(2-(methylthio)ethyl)pyrrolidinium chloride (12.32 g, 0.0632 mol) was reacted with 5% excess of lithium bis(trifluoromethylsulfonyl)imide (19.05 g, 0.0663 mol) dissolved in 30 mL of distilled water. The reaction mixture was left to stir at room temperature for 24 h. The product was washed with distilled water until the wash tested negative for chloride with 50 mM aqueous silver nitrate. The product was then rotary evaporated and placed in a high-vacuum oven at 55 °C for several days. The final product was a golden-colored liquid (10.69 g), 60%, molar mass 437.17 g/mol, water content: 82.6 ppm 1H (400 MHz; DMSO-d6) δ 2.08(s, 4H), 2.14 (s, 3H), 2.87–2.91 (t, 2H), 3.01 (s, 3H), 3.47 (t, 4H), 3.51-3.55 (t, 2H); 13C (100 MHz; DMSO-d6) δ 14.57, 21.04, 26.06, 47.51, 47.55, 61.95, 63.45, 117.86, 121.06.
Synthesis of 1-Methyl-3-(2-(methylthio)ethyl)imidazolium Bis(trifluoromethylsulfonyl)imide (ESMmimNTf2)
1-Methyl-3-(2-(methylthio)ethyl)imidazolium chloride (9.09 g, 0.0472 mol) was reacted with an equivalent of lithium bis(trifluoromethylsulfonyl)imide (13.5 g, 0.0472 mol) dissolved in 30 mL of distilled water. The reaction mixture was left to stir at room temperature for 24 h. The product was washed with distilled water until the wash tested negative for chloride with 50 mM aqueous silver nitrate. The product was then rotary evaporated and placed in a high-vacuum oven at 55 °C for 2 weeks. The final product was a colorless liquid (17.0 g), 83%, 437.42 g/mol, water content: 44.78 ppm, 1H (400 MHz; DMSO-d6) δ 2.09 (s, 3H), 2.93–2.96 (t, 2H), 3.88 (s, 3H), 4.36–4.40 (t, 2H), 7.70–7.71 (d, 1H), 7.77–7.78 (d, 1H), 9.14 (s, 1H); 13C (100 MHz; DMSO-d6) δ 14.10, 32.91, 35.71, 47.39, 114.64, 117.84, 121.04, 122.41, 123.52, 124.24, 136.80. Elemental analysis, calculated (%) for C9H13N3S3F6O4 (437.4 g/mol): C 24.75, H 3.27, N 9.52, F 25.87, S 22.00; Found: C 24.71, H 3.00, N 9.61, F 26.06, S 21.99.
Physical Measurements
The water contents of the ionic liquids were measured with a Mettler Toledo DL39 coulometric Karl Fischer titrator. The water contents of the samples used for the property measurements ranged from 44 to 97 ppm.
Viscosities
Viscosities were measured with a Cambridge Applied Systems ViscoLab 4100 electromagnetic reciprocating piston viscometer that was temperature-regulated by a Lauda RM-6 circulating bath with a 70/30 v/v propylene glycol/water mixture, as described in ref (27). Viscosities for each IL were recorded at intervals between 1 and 95 °C in ascending and descending order within their liquid ranges. The data were fit using the logarithmic form of the Vogel–Tammann–Fulcher relation
| 1 |
in order to obtain better fitting of points in the low-viscosity range. Each data set included a value of 1 × 10¹³ cP at the liquid’s glass-transition onset temperature (Tg), as described in ref (27). Values of ln(η0), D, and T0 are provided in the Results and Discussion section.
Ionic Conductivities
Conductivity measurements were performed with a YSI model 3200 conductivity instrument fitted with a YSI model 3253 probe, housed within the same moisture-controlled dry box used for the viscosity measurements.
Thermal Profiles
A PerkinElmer Pyris Diamond differential scanning calorimeter (DSC) with a liquid nitrogen cooling system was used to determine thermal profiles and glass-transition onset temperatures. Scan rates were 5 °C/min. The data were analyzed using Pyris software. The two thioether ionic liquids reported here were not observed to crystallize during triplicate DSC scans down to 153 K.
Densities
Densities were measured gravimetrically using calibrated 1 mL volumetric flasks.
Small-Angle X-ray Scattering (SAXS) Measurements
Approximately
0.2 mL of each IL sample was loaded into NMR tubes inside a glovebox
(Ar Atmosphere). These NMR tubes are made with borosilicate glass,
type 1 class A, and have an outer diameter of 2.99 ± 0.03 mm
and were purchased from Sigma-Aldrich. Tubes were sealed with Teflon
tape, removed from the glovebox, and immediately flame-sealed. SAXS
experiments were carried out at Advanced Photon Source (APS) beamline
11-ID-C (Argonne National Laboratory, Lemont, IL), using an X-ray
beam of energy 105 keV (λ = 0.1173 Å). The beam size of
0.5 mm × 0.5 mm was collimated by using a Laue monochromator.
The diffraction images were collected using a PerkinElmer XRD1621
amorphous silicon 2D area detector. The sample detector distance for
the experiments was set at a distance of 1600 mm, which covered a q-range from 0.2 to 6.5 Å–1, respectively,
and was calibrated by using standard reference material (Si SRM640c).
Here, q is the magnitude of momentum transfer X-ray scattering wave
vector and is defined as  , where 2θ represents the scattering
angle and λ is the X-ray wavelength. The X-ray exposure time
for each sample was 1 s per frame, and a total of 180 frames were
collected. All of the measurements were performed at 300 K. We used
the GSAS-II software47 to integrate the
raw data to obtain intensity vs q.
The raw X-ray scattering intensity from each sample was corrected by subtracting the background intensity from an empty tube, as well as contributions from Compton, multiple, and diffuse scattering to obtain a coherent intensity it Icoh(q) using PDFgetX2.48S(q) was calculated using the equation
| 2 |
where i, xi, and fi represent the atomic species, atomic fraction, and X-ray form factor,49 respectively.42,46,50
Computational Methods
All molecular dynamics simulations were carried out using the GROMACS software package version 4.5.5.51 For all our trajectories, the cutoff for all nonbonded interactions (Lennard Jones and Electrostatic) was set to 1.5 nm. The particle mesh Ewald52,53 method with a sixth-order interpolation and Fourier spacing of 0.08 nm was used for the long-range Electrostatic interactions. 3D periodic boundary conditions were used as coded in the GROMACS software. The force field parameters used in modeling the ionic liquids were based on OPLS-AA,54 Canongia Lopes and Pádua,55−57 Shimizu et al.,58 and Köddermann59 modifications of the Lennard Jones parameters for the anion and the imidazolium cation ring carbons and hydrogens. The bonds, angles, and torsion parameters involving oxygen and sulfur atoms were taken from OPLS-AA,54 Weiner,60 and Cornell et al.61 Alkane torsions were taken from Price et al.62 The atomic partial charges for the ether and thioether cations were fitted to the electrostatic potential surface in CHELPG using the DFT method and the B3LYP/6-311G(d,p) basis set in Gaussian-09;63 charges on equivalent atoms were averaged. Parameters are provided in sample GROMACS topology files in the Supporting Information.
Cubic configuration simulation boxes each containing 512 ion pairs were packed and energy-minimized. Our system size was chosen to balance the cost of computing dynamical properties and structural properties for systems where low-q features are not expected. Three equilibration steps were carried out in the NPT ensemble using the V-rescale thermostat64 and Berendsen barostat65 with 0.2 and 1.0 ps time constants, respectively. The first step, run at a pressure of 50 bar and with charges scaled to 1% of their target value was 0.2 ns in duration; the second period was 2 ns in duration with a pressure of 50 bar and charges at 10% of their target value, whereas the third period was 2 ns in duration, the pressure was 1 bar, and charges were set to 100% of their target value. This was followed by an 8 ns simulated annealing in the same ensemble from 300 to 600 K and back to the target temperature of 400 K. The final configuration of the annealing step was used for a 5 ns production run in the NPT ensemble using the Nose–Hoover thermostat66 and Parrinello–Rahman barostat67 with 0.2 and 1.0 ps time constants, respectively. Static structure functions S(q) were computed using the last 1 ns of the 5 ns production run.
To compute the cationic head–anion subcomponent of S(q, t) (vide infra), a 20 ns production run in the NVE ensemble was carried out, and to calculate the viscosity (η), for each system, 75 independent trajectories (7 ns each) were simulated in the NVT ensemble with the average temperature of the NVE run. These NVT simulations used the Nose–Hoover thermostat66 with a time constant of 0.5 ps and the velocity-verlet68 MD integrator. We used the protocol of Maginn et al.69 in which the Green–Kubo expression for the viscosity in eq 3 is used to generate an ensemble of functions ζ(t), where ⟨λzx(0)λzx(t′)⟩ corresponds to the stress tensor correlation function70
| 3 |
These functions are used in two ways, first to obtain an average ⟨ζ(t)⟩ and second to obtain the time-dependent standard deviation of ζ(t), σ(t), across trajectories. A fit of σ(t) to the form σFit(t) = ÷tb is then carried out, as the Maginn algorithm69 to obtain the most accurate value of the shear viscosity requires finding first tcut, the time point at which the error σFit(t) is about 40% of an estimated viscosity value derived from the flat portion of ⟨ζ(t)⟩. The value of tcut together with the function σFit(t) are then used as the upper bound and as the error for an error-weighted fit of ⟨ζ(t)⟩ using the expression in eq 4 from which the long time value is taken as the computed value of the shear viscosity η. In the Results and Discussion section where we refer to a normalized plot of the viscosity, what is meant is ⟨ζ(t)⟩Fit/η.
| 4 |
All of the simulation work described in this article was carried out at a target temperature of 400 K except that to compare with experimental viscosity values at 325 K for the imidazolium-based ILs an extra set of 50 NVT trajectories equilibrated using the same protocols were run.
| 5 |
Here, ρ0 is the total number density of the IL, xi and xj are atomic mole fractions, and the fi(q) and fj(q) functions are the corresponding X-ray atomic form factors. In all our calculations, we use a Lorch-type function,71,72W(r), to account for the fact that box sizes are not infinite, resulting in reciprocal space oscillations due to cutoff errors in the normalized distinct van Hove function, gdij(r, t), at the edge of the box. gd(r, t) was computed including periodic boundary conditions using an in-house modified version of the LiquidLib toolbox.73 The radial distribution function gij(r) used for static structural calculations is simply gdij(r, t = 0). gd(r, t) is equal to 1 at long times, and at any time it goes to 1 at long distances. Just as we have done in several prior publications, S(q) and S(q, t) can be partitioned into useful subcomponents.1−3,5,38−41,43,45,46,74−85 These allow us to follow the structural dynamics of liquid structural motifs at specific q values. In the Results and Discussion section, we will plot the time integral of the head–anion subcomponent of S(q, t) squared (SH–A(q, t)2). When describing these integrals as normalized, this will correspond to the function αH–A(q, t) defined in eq 6:
| 6 |
A plot of αH–A(q, t) goes to 1 at long times, and its functional form can be directly compared with ⟨ζ(t)⟩Fit/η to establish connections between structural and viscoelastic relaxation times.1,2
Results and Discussion
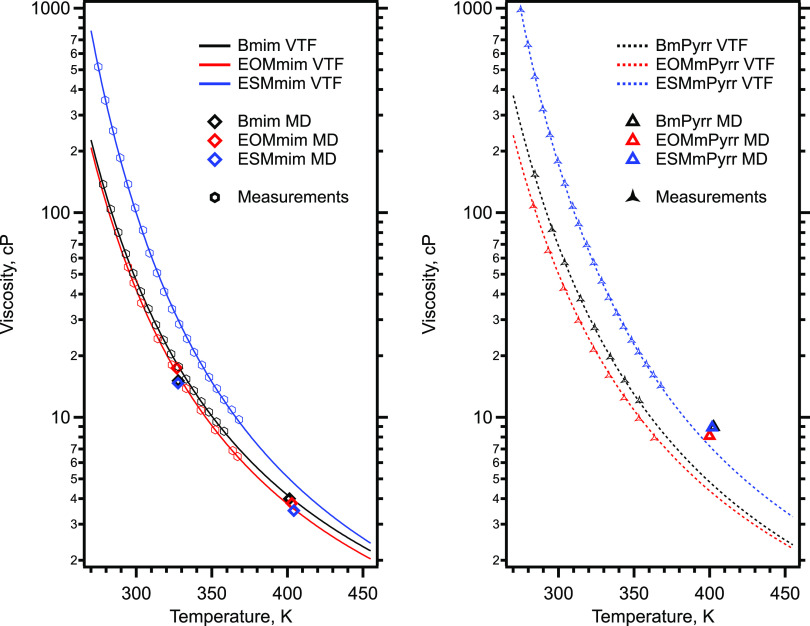
The current study specifically focuses on NTf2–-based ILs coupled with the Bmim+, BmPyrr+, EOMmim+, ESMmim+, EOMmPyrr+, and ESMmPyrr+ cations (a schematic view of which is presented in Figure 1). Table 1 shows experimentally derived viscosity values at different temperatures as well as those obtained from our simulations; conductivities, Tg, densities, as well as parameters to fit the viscosity dependence with temperature (see eq 1) are provided in Table 2. The data shows that for the six systems studied here, the pyrrolidinium-based ILs are more viscous than their imidazolium-based counterparts. Viscosity is one of the hardest quantities to converge in simulations of ILs (see the Methods section for a description of how costly these computations are in order to achieve accurate results) and for the most part, using the Maginn et al.69 methodology to predict these, the models used here appear to do a good job at capturing viscosity values. The key trend that we are seeking to study, which is the difference in viscosity across unsubstituted imidazolium and pyrrolidinium ILs or those with the exact same substitution, is always correctly captured by our simulations giving confidence in our analysis. To put this into perspective, Figure 3 shows experimentally measured values of the viscosity, fitted curves, and simulated results.
Table 1. Ionic Liquid Dynamic Viscosities Calculated from MD Simulation Trajectories Compared with Fits of Experimental Measurements Calculated at T = ⟨TNVE⟩a.
|
TSim. (K) |
η
(cP) |
|||
|---|---|---|---|---|
| cation | Ttarget | ⟨TNVE⟩ | ηSim. | ηExpt-Fit |
| Bmim+ | 325 | 327.7 | 15.1 | 17.8 |
| 400 | 401.3 | 4.0 | 4.1 | |
| EOMmim+ | 325 | 326.7 | 17.4 | 16.6 |
| 400 | 402.8 | 3.8 | 3.7 | |
| ESMmim+ | 325 | 327.6 | 14.7 | 30.0 |
| 400 | 404.2 | 3.5 | 4.8 | |
| BmPyrr+ | 400 | 402.6 | 9.0 | 4.7 |
| EOMmPyrr+ | 400 | 399.9 | 8.1 | 4.4 |
| ESMmPyrr+ | 400 | 401.6 | 8.9 | 7.0 |
Table 2. Physical Properties of the Ionic Liquids and the VTF Parameters Used for Fitting the Dynamic Viscosity.
| cation | Tg (K) | viscosity (cP, 25 °C) | conductivity (mS/cm, 25 °C) | density (g/cm3, 22 °C) | ln(η0) (cP) | D | T0 (K) |
|---|---|---|---|---|---|---|---|
| Bmim+ | 186 | 50 | 3.3 | 1.44 | –1.93 | 4.99 | 160.8 |
| EOMmim+ | 188 | 45 | 4.6 | 1.45 | –1.95 | 4.74 | 163.7 |
| ESMmim+a | 198 | 110 | 2.0b | 1.50 | –2.21 | 5.17 | 170.6 |
| BmPyrr+ | 184 | 75 | 2.7 | 1.39c | –2.28 | 6.11 | 154.1 |
| EOMmPyrr+ | 184 | 54 | 3.9 | 1.46d | –2.06 | 5.59 | 155.1 |
| ESMmPyrr+a | 200 | 191 | 1.2b | 1.45e | –2.21 | 5.73 | 168.7 |
This work. For all other data, see ref (27).
Measured at 24 °C.
Measured at 23 °C.
Measured at 20 °C.
Measured at 25 °C.
Figure 3.
(Left) For the family of imidazolium-based ILs coupled with NTf2–, experimentally determined viscosity values, VTF fits of the experimental data that are extrapolated out to the temperature of the MD simulations, and the simulated viscosities. Measurements for Bmim are from Tariq et al.24 (Right) Same as left but for the pyrrolidinium-based ILs coupled with NTf2–.
Perhaps a surprising finding is that while still following this trend, the S-substituted ILs are significantly more viscous than the O-substituted and the unsubstituted (alkyl) analogues. This is a trend that the simulations do not appear to capture. It is likely that the issue stems from the fact that the S atom in ESMmim+ and ESMmPyrr+ is polarizable and fixed-charge models simply do not capture its fluctuating charge. Empirically speaking, the higher viscosities of the thioether congeners that are observed in the range of normal working temperatures are related to the fact that their glass-transition temperatures are 10–16 K higher than the alkyl and ether derivatives for a given cation family. Within each family, the fragilities (deviations from Arrhenius behavior as quantified by the D parameter in VTF fitting) and limiting viscosities at infinite temperature (η0) only vary over small ranges, but the differences in Tg (and consequently T0) significantly influence the respective viscosity behaviors with temperature. The thioether groups apparently have a very large impact on the conformational dynamics of the cations at low temperatures, which would be very interesting but difficult to simulate because of the ergodicity problems associated with the high viscosity.
From a static structural perspective,
the ILs studied here share
many similarities, as can be gleaned from a comparison of the SAXS
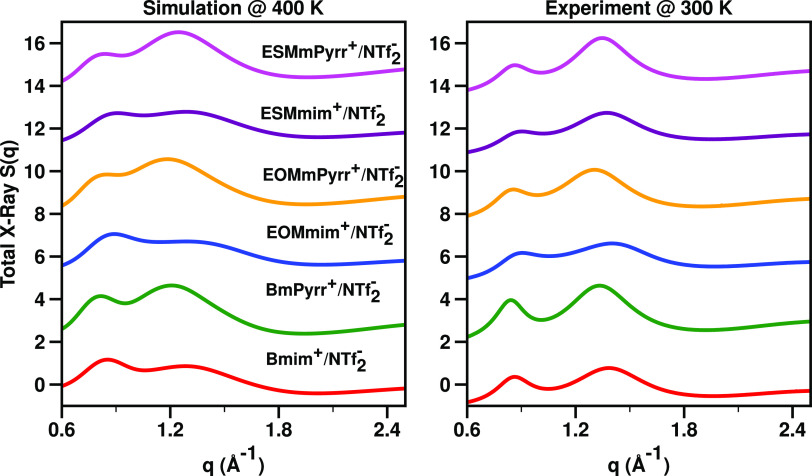
and simulated structure functions S(q) in Figure 4. None
of these systems have large tails that would cause significant charge-tail
segregation, and a pre-peak is not expected. For all of the ILs studied
here, the peak at about 0.8 Å–1 is due to the  and
and  motif along charge networks,
i.e., it corresponds to the typical separation between the cationic
heads (or the anions) spaced by ions of opposite charge (the anions
or the cationic heads, respectively). In contrast, the peak above
1 Å–1 is due to all sorts of inter- and intramolecular
adjacency correlations.5,38−41,43,45,46,74−79
Figure 4.
(Right) Experimental small-angle X-ray scattering total structure function S(q) at 300 K. (Left) Simulated S(q) at 400 K. Both figures show in the region above 1 Å–1 and below 1.8 Å–1 what we call an adjacency peak; they also show at around 0.8 Å–1 the charge alternation peak associated with the charge trio discussed in Figure 5.
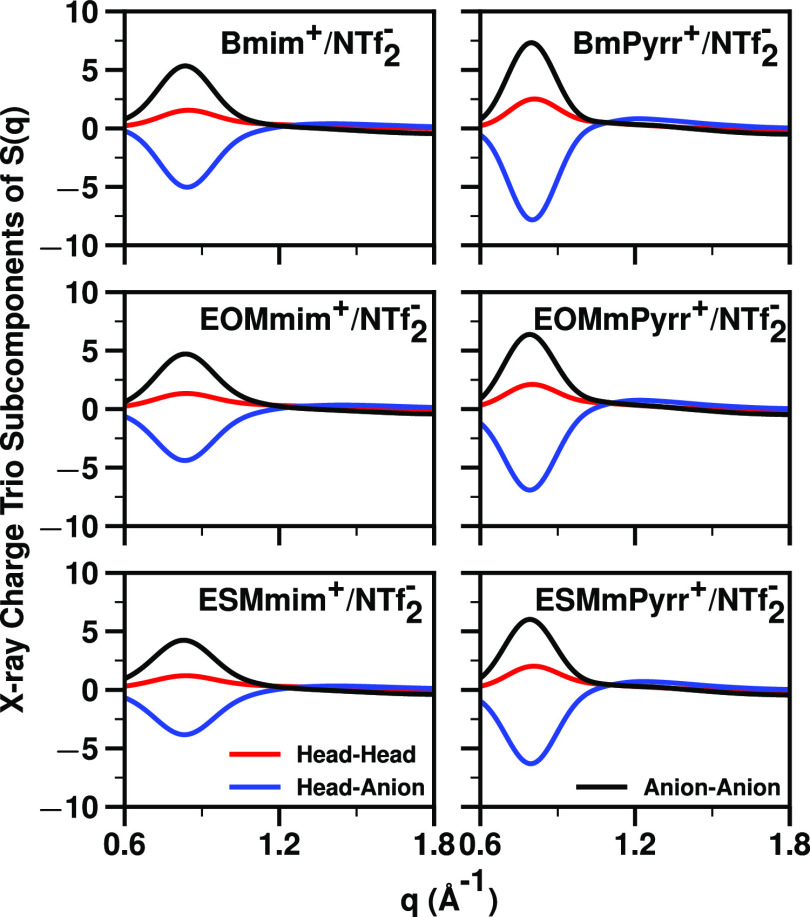
Figure 5 shows sets of computationally derived subcomponents
of S(q), specifically the “charge
trio” head–head (SH–H(q)), anion–anion (SA–A(q)), and head–anion (SH–A(q)) with species
defined in Figure 1; for a description of the many ways one can partition the total S(q) of ILs into subcomponents, see refs5,38−41,43,45,46,74−79 and citations therein. The charge trio subcomponents of S(q) are particularly important because
at about 0.8 Å–1 they carry information about
the structure of the charge network ( and
and  correlations).5,38−41,43,45,46,74−86 In the region 1–1.8 Å–1, only one
of these three subcomponents, namely, SH–A(q), is most relevant as it provides direct information
about the very important adjacency correlations associated with positive
and negative
  interactions
along the charge network. SH–H(q) and SA–A(q) are less important in the q-regime associated with adjacency correlations
because, except for intramolecular interactions, species with identical
charge are not expected to be adjacent. The first thing to notice
in Figure 5 is that
in the charge alternation regime around 0.8 Å–1 the intensities of the subcomponents, particularly those involving
the high X-ray contrast anion (SA–A(q) and SH–A(q)) are very large compared to that of the overall S(q) in the same q-regime.
In this regime, SA–A(q) and SH–H(q)
always show as peaks, whereas SH–A(q) always shows as an antipeak; for all ionic liquids
and molten salts, this behavior is the hallmark of charge alternation.5,38−41,43,45,46,74−85 In this q-regime, the overall S(q) signal is to a large extent the result of massive cancellations
due to the interference of SA–A(q), SH–H(q), and SH–A(q). Because of these cancellations of large numbers, it
is not uncommon to find in this q-region that small
flaws in force fields give rise to inaccuracies in the overall S(q) compared to experiments.
Figure 5.
For all ILs, charge trio subcomponents of S(q) in the relevant charge alternation q-regime at 400 K.
Most interesting in Figure 5 is that when we compare each imidazolium-based IL with the analogous pyrrolidinium-based system, the peaks and antipeaks associated with this trio at around 0.8 Å–1 are more pronounced for pyrrolidinium across the whole series (for each IL, compare the left and right panels in Figure 5). Since (i) the anion in all cases is the same, (ii) H atoms have small X-ray contrast, and (iii) the contrast difference between a single C atom and a N atom is not large, we cannot but conclude that such differences in intensity must be due to bonafide liquid structural differences and not due to trivial issues of contrast. In other words, the significant differences going from left to right in each panel of Figure 5 must arise because the pyrrolidinium-based cations have a better-defined/structured charge network.
For the case of Bmim+/NTf2– and BmPyrr+/NTf2–, in Figure 6 we show spatial distribution functions of atoms in the anion around the cationic ring. Figure 6 shows that for a fixed large value of the anionic isodensity (in units of atoms per unit volume), the anions are very asymmetrically distributed around the imidazolium ring, covering only the side where the most acidic proton is located, between the two nitrogen atoms. If we choose an even larger value of the isodensity, we still see significant space covering for the imidazolium-based IL, but almost no covering in the case of the pyrrolidinium-based IL. In other words, anions are spatially spread in the case of BmPyrr+/NTf2– with the anionic density distribution around the pyrrolidinium ring looking somewhat tetrahedral; no particular spot around the cation carries a distinctly large isodensity associated with highly directional accumulation of anions, and the opposite is true for the case of Bmim+/NTf2–. We do not know if this specific topological difference is associated with differences in viscosity or the viscoelastic relaxation, but it certainly is suggestive of very different orientational requirements in each case. Seen as a whole, Figure 6 shows that for BmPyrr+/NTf2–, anions can anchor the cation in multiple directions, whereas in the case of Bmim+/NTf2–, the charge network is highly constrained to accommodate directional ordering.
Figure 6.
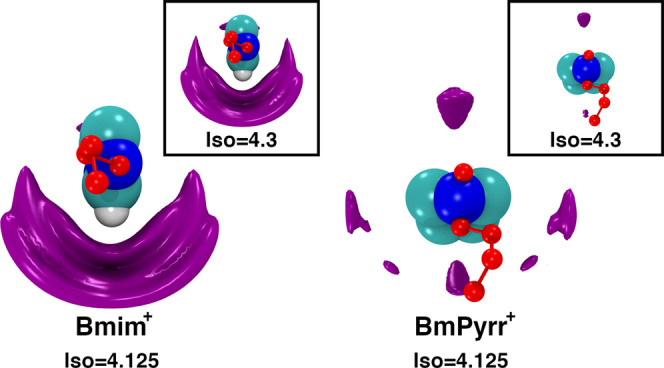
Spatial distribution functions computed with the TRAVIS software87 for atoms in NTf2– around Bmim+ and BmPyrr+ at 400 K. Left and right panels are at the same isovalue. We see from these figures that there is a large and directional probability of finding anions on one side of the Bmim+ ring, but the distribution around BmPyrr+ is much more symmetrical and multidirectional. When the isovalue is increased in the inset, the figure for Bmim+ almost does not change, whereas BmPyrr+ has almost no contributions at this level highlighting the difference in the angular accumulation of the anions around each of the cations.
We now discuss the time dependence of the charge
alternation and
adjacency structural motifs and attempt to link these to the viscoelastic
relaxation. In previous studies,1−3 we have shown that the simplest
and best way to do this is by following the structural dynamics of
the cationic head–anion subcomponent SH–A(q, t).
Because simulations do not accurately capture the viscosity trend
for the S-substituted ILs along a family (the trend between families
is well captured), we focus our attention on the ILs with the Bmim+, BmPyrr+, EOMmim+, and EOMmPyrr+ cations. Through prior work, we have learned1−3 that the relaxation time of SH–A(q, t) in the different
relevant q-regimes associated with adjacency and charge alternation
closely matches that of the overall S(q, t) but SH–A(q, t) has the unique advantage
that its interpretation in terms of the IL structural motifs is clear
and not polluted by a myriad of other contributions that are difficult
to disentangle. This function captures in its most accurate form the
dynamics of charge alternation as well as the specific adjacency correlations
associated with cationic heads and anions. If an IL were to also have
a first sharp diffraction peak due to tail-charge network alternations,
at low q, SH–A(q, t) would capture the  and
and  dynamics that are representative
of across-charge-network processes, as opposed to along-charge-network
dynamics. Such across-network processes include rare-event network
swaps and other slow events.
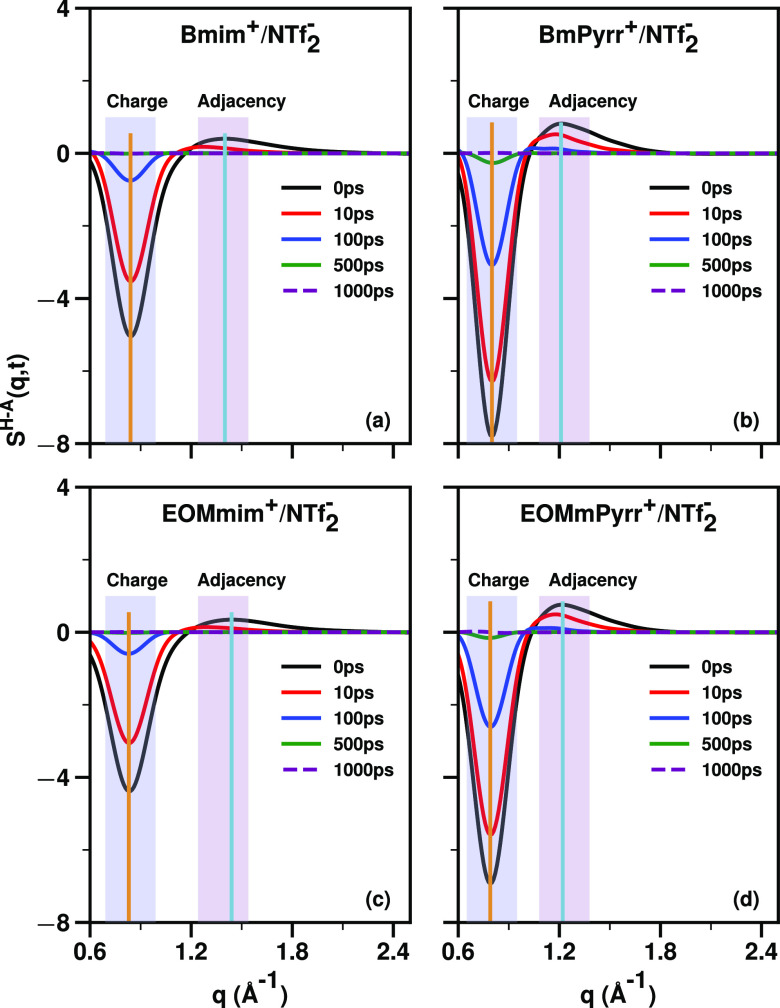
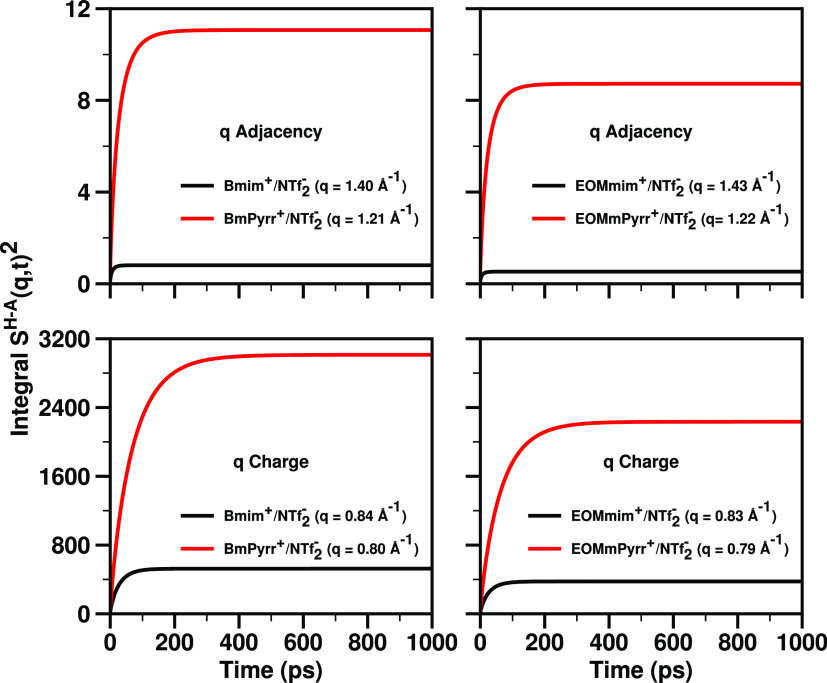
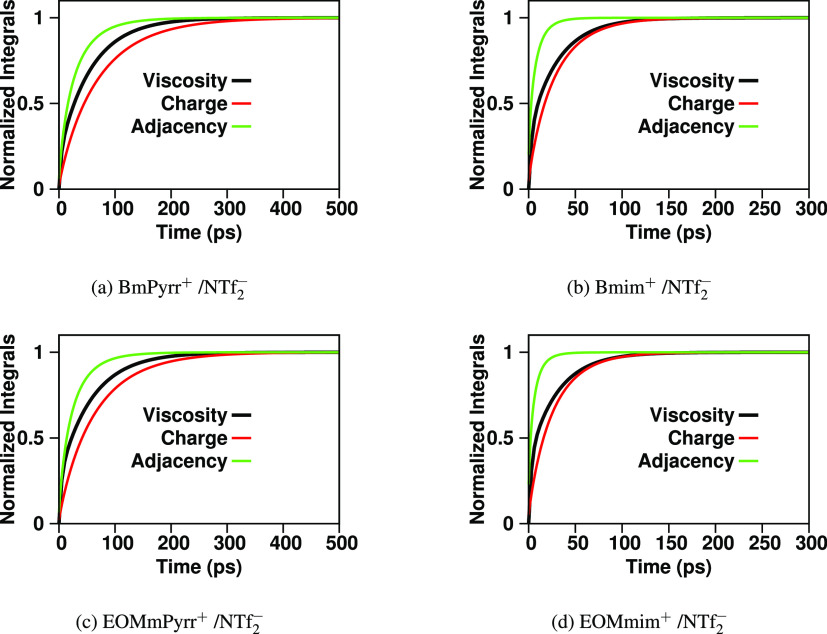
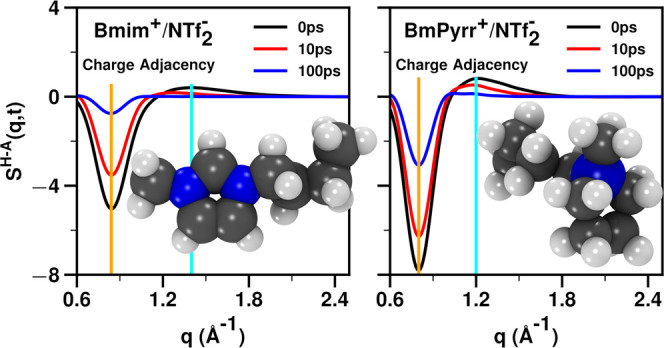
Figure 7 unequivocally shows that in the most relevant q-regime for viscosity (the “within-charge-network” structural relaxation region where q is ∼0.8 Å–1), SH–A(q, t) relaxes significantly faster for the imidazolium-based IL compared to the pyrrolidinium-based IL, and we see this also from the time at which the running integrals of the square of SH–A(q, t) become flat in Figure 8. These findings appear to provide a quantifiable physical perspective on what hard and soft ions do differently on a structural basis. In this case, the pyrrolidinium-based cations are harder, resulting in: (1) ILs with a larger magnitude of the charge alternation trio, as can be gleaned from Figure 5, (2) slower in-network structural relaxation as seen from the time it takes to flatten the curves in Figure 7 and to converge those in Figure 8, as well as (3) having higher dynamic viscosity.
Figure 7.
For NTf2– coupled with Bmim+, BmPyrr+, EOMmim+, and EOMmPyrr+, the SH–A(q, t) subcomponent of S(q, t) at 400 K.
Figure 8.
For ILs of Bmim+, BmPyrr+, EOMmim+, and EOMmPyrr+ coupled with NTf2–, the running integral at 400 K of SH–A(q, t)2 (∫0tSH–A(q, t′)2 dt′) at q values corresponding to the adjacency and the charge alternation structural motif as defined in Figure 7.
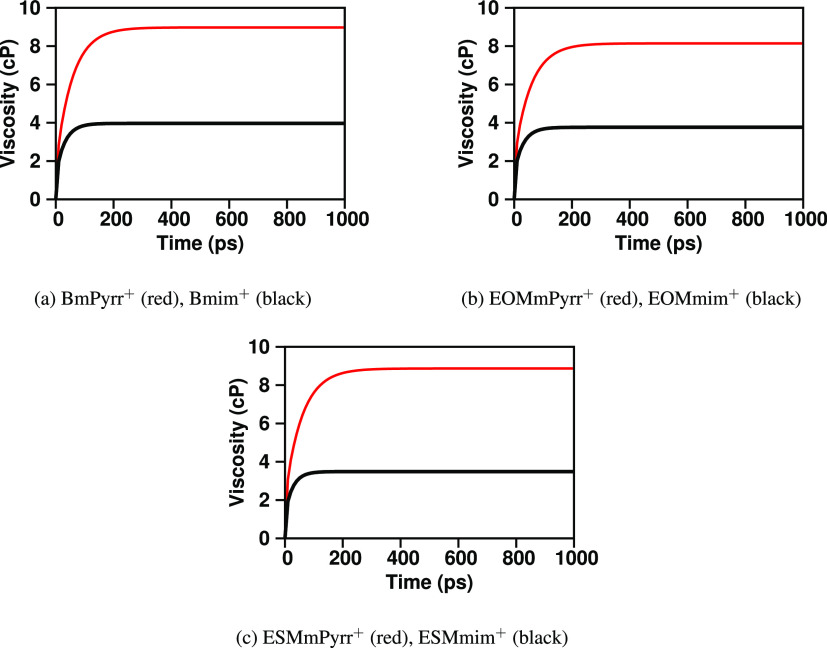
To also see this from the point of view of the viscoelastic relaxation, Figure 9 shows ⟨ζ(t)⟩Fit, our best estimate of the running integral corresponding to the Green–Kubo expression for the viscosity (see the Methods section for a detailed description of the error-weighted fitting scheme by Maginn and co-workers69). In all cases, not only is the actual viscosity larger for the pyrrolidinium family of ILs compared to the analogous imidazolium family member (the asymptotic value at a long time in Figure 9) but also the time to reach this asymptotic value is longer. This is exactly the same behavior we observe for the integrals of SH-A(q, t)2. Notice that slower viscoelastic relaxation does not always necessarily mean larger viscosity, but in this case, it does. To put this last finding into context, Figure 10 plots the normalized running integral of the viscosity, ⟨ζ(t)⟩Fit/η, together with those of SH–A(q, t)2 (the function αH–A(q, t) defined in the Methods section). As expected, the viscoelastic relaxation always falls somewhere between that of the fastest and slowest relevant structural IL motif; in our case, these are the relaxation of adjacency correlations and that of charge alternation. The most important point in this plot is how significantly longer each relaxation is in the case of the pyrrolidinium-based ILs compared to the same quantity or process for the imidazolium-based ILs. Each of our findings associated (1) with the viscoelastic relaxation, (2) the actual viscosity, (3) the dynamics of SH–A(q, t)2, and (4) the static magnitude of the trio components of SH–A(q) in the charge alternation regime is an alternative way to present a rigorous atomistic view of the hard/soft ionic concept.
Figure 9.
For NTf2–-based ILs coupled with different cations of the imidazolium and pyrrolidinium families, running integrals of the Green–Kubo expression, ⟨ζ(t)⟩Fit, for the viscosity using the Maginn et al. method69 of calculation at 400 K. The most important finding, besides the actual viscosity value derived at a long time in each case, is the time it takes for each of these functions to converge to a flat value. In all cases, not only is the viscosity higher for the pyrrolidinium-based ILs but also the time it takes them to approach asymptotic values is always longer than for the imidazolium ILs.
Figure 10.
αH–A(q, t) (the normalized integral of SH–A(q, t)2 as defined in the Methods section), compared to the normalized viscoelastic relaxation ⟨ζ(t)⟩Fit/η at 400 K. In all cases, the relaxation of the viscosity falls in between that of adjacency and charge alternation correlations indicating that its origin is a combination of processes associated with both.
Conclusions
This article discusses a set of NTf2–-based ILs where the cations are Bmim+, EOMmim+, ESMmim+, BmPyrr+, EOMmPyrr+, and ESMmPyrr+ and provides novel physical data for the S-substituted ILs. An important finding from this work is that for ILs with similar X-ray contrast, we are able to make a link between cationic hardness and the intensity of certain subcomponents of S(q) in the charge alternation regime, the difference in structural relaxation times, the difference in viscoelastic relaxation times and also in their actual dynamic viscosities. We conclude that the combination of patterns for the pyrrolidinium-based ILs physically identifies them as the harder cations that necessarily create stiffer charge networks. Interestingly, the S-substituted ILs are more viscous than their counterparts, and there is evidence that trends we have described can be reversed if a single methylene bridge instead of an ethyl bridge is included separating the ring and the substituent. We plan to explore these intriguing differences in the pattern of viscosity in a future publication.
Acknowledgments
This work was supported by NSF Grant No. CHE-1954358 awarded to the University of Iowa and CHE-1954373 awarded to Rutgers University, through which summer support was provided to S.I.L.-R., S.N., and N.Z. (in 2022). The work at BNL was supported by the U.S. Department of Energy (DOE), Office of Science, Office of Workforce Development for Teachers and Scientists under the CCI and SULI programs (for H.M.Y. and M.M.), and for J.F.W. and F.W., by the DOE Office of Basic Energy Sciences, Division of Chemical Sciences, Geosciences and Biosciences, under Contract DE-SC0012704. The work at QCC was supported by the PSC-CUNY Research Award 64249-00-52A. The authors gratefully acknowledge internship support from the CUNY Research Scholars Program (M.M. and H.M.Y.) and the NSF S-STEM program (H.M.Y.). This research used resources of the Center for Functional Nanomaterials (CFN), which is a U.S. DOE Office of Science Facility, at Brookhaven National Laboratory under Contract No. DE-SC0012704. F.W. and J.F.W. thank Dr. Gregory Doerk of the CFN for assistance with the DSC measurements. Use of Advanced Photon Source was supported by U.S. Department of Energy, Office of Science, Office of Basic Energy Sciences, under Contract DE-AC02-06CH11357. The authors thank Dr. Andrey Andreevich Yakovenko for assisting in the data collection at ANL-APS beamline 11-ID-C. Researchers at Iowa acknowledge a generous allocation of high-performance computing resources at the Iowa HPC cluster.
Supporting Information Available
The Supporting Information is available free of charge at https://pubs.acs.org/doi/10.1021/acs.jpcb.3c02604.
Bmim.itp, Bmim-NTf2.top, BmPyrr.itp, BmPyrr-NTf2.top, EOMmim.itp, EOMmim-NTf2.top, EOMmPyrr.itp, EOMmPyrr-NTf2.top, ESMmim.itp, ESMmim-NTf2.top, ESMmPyrr.itp, ESMmPyrr-NTf2.top, and NTf2.itp with parameters for ILs to be used with the software GROMACS (ZIP)
The authors declare no competing financial interest.
Supplementary Material
References
- Amith W. D.; Araque J. C.; Margulis C. J. Relationship between the Relaxation of Ionic Liquid Structural Motifs and That of the Shear Viscosity. J. Phys. Chem. B 2021, 125, 6264–6271. 10.1021/acs.jpcb.1c03105. [DOI] [PMC free article] [PubMed] [Google Scholar]
- Amith W. D.; Araque J. C.; Margulis C. J. Ether tails make a large difference for the structural dynamics of imidazolium-based ionic liquids. J. Ionic Liq. 2022, 2, 100012. 10.1016/j.jil.2021.100012. [DOI] [Google Scholar]
- Amith W. D.; Araque J. C.; Margulis C. J. A Pictorial View of Viscosity in Ionic Liquids and the Link to Nanostructural Heterogeneity. J. Phys. Chem. Lett. 2020, 11, 2062–2066. 10.1021/acs.jpclett.0c00170. [DOI] [PubMed] [Google Scholar]
- Araque J. C.; Margulis C. J. In an Ionic Liquid, High Local Friction is Determined by the Proximity to the Charge Network. J. Chem. Phys. 2018, 149, 144503. 10.1063/1.5045675. [DOI] [PubMed] [Google Scholar]
- Araque J. C.; Hettige J. J.; Margulis C. J. Modern Room Temperature Ionic Liquids, a Simple Guide to Understanding Their Structure and How It May Relate to Dynamics. J. Phys. Chem. B 2015, 119, 12727–12740. 10.1021/acs.jpcb.5b05506. [DOI] [PubMed] [Google Scholar]
- Araque J. C.; Daly R. P.; Margulis C. J. A Link between Structure, diffusion and rotations of hydrogen bonding tracers in ionic liquids. J. Chem. Phys. 2016, 144, 204504. 10.1063/1.4951012. [DOI] [PubMed] [Google Scholar]
- Daly R. P.; Araque J. C.; Margulis C. J. Communication: Stiff and Soft Nano-Environments and the “Octopus Effect” are the Crux of Ionic Liquid Structural and Dynamical Heterogeneity. J. Chem. Phys. 2017, 147, 061102. 10.1063/1.4990666. [DOI] [PubMed] [Google Scholar]
- Rumble C. A.; Kaintz A.; Yadav S. K.; Conway B.; Araque J. C.; Baker G. A.; Margulis C.; Maroncelli M. Rotational Dynamics in Ionic Liquids from NMR Relaxation Experiments and Simulations: Benzene and 1-Ethyl-3-Methylimidazolium. J. Phys. Chem. B 2016, 120, 9450–9467. 10.1021/acs.jpcb.6b06715. [DOI] [PubMed] [Google Scholar]
- Hayes R.; Warr G. G.; Atkin R. Structure and Nanostructure in Ionic Liquids. Chem. Rev. 2015, 115, 6357–6426. 10.1021/cr500411q. [DOI] [PubMed] [Google Scholar]
- Minami I. Ionic Liquids in Tribology. Molecules 2009, 14, 2286–2305. 10.3390/molecules14062286. [DOI] [PMC free article] [PubMed] [Google Scholar]
- Liu W.; Ye C.; Gong Q.; Wang H.; Wang P. Tribological Performance of Room-Temperature Ionic Liquids as Lubricant. Tribol. Lett. 2002, 13, 81–85. 10.1023/A:1020148514877. [DOI] [Google Scholar]
- Cowie S.; Cooper P. K.; Atkin R.; Li H. Nanotribology of Ionic Liquids as Lubricant Additives for Alumina Surfaces. J. Phys. Chem. C 2017, 121, 28348–28353. 10.1021/acs.jpcc.7b09879. [DOI] [Google Scholar]
- Li H.; Wood R. J.; Rutland M. W.; Atkin R. An ionic liquid Lubricant Enables Superlubricity to be “Switched On” in situ using an Electrical Potential. Chem. Commun. 2014, 50, 4368. 10.1039/c4cc00979g. [DOI] [PubMed] [Google Scholar]
- Wadekar V. V. Ionic Liquids as Heat Transfer Fluids – An Assessment using Industrial Exchanger Geometries. Appl. Therm. Eng. 2017, 111, 1581–1587. 10.1016/j.applthermaleng.2016.04.156. [DOI] [Google Scholar]
- França J. M. P.; Lourenço M. J. V.; Murshed S. M. S.; Pádua A. A. H.; de Castro C. A. N. Thermal Conductivity of Ionic Liquids and IoNanofluids and Their Feasibility as Heat Transfer Fluids. Ind. Eng. Chem. Res. 2018, 57, 6516–6529. 10.1021/acs.iecr.7b04770. [DOI] [Google Scholar]
- Wang K.; Adidharma H.; Radosz M.; Wan P.; Xu X.; Russell C. K.; Tian H.; Fan M.; Yu J. Recovery of Rare Earth Elements with Ionic Liquids. Green Chem. 2017, 19, 4469–4493. 10.1039/C7GC02141K. [DOI] [Google Scholar]
- Shirota H.; Takahashi K.; Ando M.; Kakinuma S. Liquid Properties of Ionic Liquids based on Phosphonium Cations with (Alkylthio)alkyl Groups. J. Chem. Eng. Data 2019, 64, 4701–4707. 10.1021/acs.jced.9b00033. [DOI] [Google Scholar]
- Fischer P. J.; Do M. P.; Reich R. M.; Nagasubramanian A.; Srinivasan M.; Kühn F. E. Synthesis and Physicochemical Characterization of Room Temperature Ionic Liquids and their Application in Sodium Ion Batteries. Phys. Chem. Chem. Phys. 2018, 20, 29412–29422. 10.1039/C8CP06099A. [DOI] [PubMed] [Google Scholar]
- Fei Z.; Zhu D.-R.; Yan N.; Scopelliti R.; Katsuba S. A.; Laurenczy G.; Chisholm D. M.; McIndoe J. S.; Seddon K. R.; Dyson P. J. Electrostatic and Non-covalent Interactions in Dicationic Imidazolium-Sulfonium Salts with Mixed Anions. Chem. – Eur. J. 2014, 20, 4273–4283. 10.1002/chem.201303520. [DOI] [PubMed] [Google Scholar]
- Ando M.; Ohta K.; Ishida T.; Koido R.; Shirota H. Physical Properties and Low-Frequency Polarizability Anisotropy and Dipole Responses of Phosphonium Bis(fluorosulfonyl)amide Ionic Liquids with Pentyl, Ethoxyethyl, or 2-(Ethylthio)ethyl Group. J. Phys. Chem. B 2023, 127, 542–556. 10.1021/acs.jpcb.2c07466. [DOI] [PubMed] [Google Scholar]
- Sato T.; Maruo T.; Marukane S.; Takagi K. Ionic liquids containing carbonate solvent as electrolytes for lithium ion cells. J. Power Sources 2004, 138, 253–261. 10.1016/j.jpowsour.2004.06.027. [DOI] [Google Scholar]
- Tsuzuki S. Factors Controlling the Diffusion of Ions in Ionic Liquids. ChemPhysChem 2012, 13, 1664–1670. 10.1002/cphc.201100870. [DOI] [PubMed] [Google Scholar]
- Tokuda H.; Ishii K.; Susan M. A. B. H.; Tsuzuki S.; Hayamizu K.; Watanabe M. Physicochemical Properties and Structures of Room-Temperature Ionic Liquids. 3. Variation of Cationic Structures. J. Phys. Chem. B 2006, 110, 2833–2839. 10.1021/jp053396f. [DOI] [PubMed] [Google Scholar]
- Tariq M.; Carvalho P. J.; Coutinho J. A.; Marrucho I. M.; Canongia Lopes J. N.; Rebelo L. P. Viscosity of (C2–C14) 1-alkyl-3-methylimidazolium bis(trifluoromethylsulfonyl)amide Ionic Liquids in an Extended Temperature Range. Fluid Phase Equilib. 2011, 301, 22–32. 10.1016/j.fluid.2010.10.018. [DOI] [Google Scholar]
- Jin H.; O’Hare B.; Dong J.; Arzhantsev S.; Baker G. A.; Wishart J. F.; Benesi A. J.; Maroncelli M. Physical properties of Ionic Liquids Consisting of the 1-butyl-3- methylimidazolium Cation with Various Anions and the bis(trifluoromethylsulfonyl)imide Anion with Various Cations. J. Phys. Chem. B 2008, 112, 81–92. 10.1021/jp076462h. [DOI] [PubMed] [Google Scholar]
- Funston A. M.; Fadeeva T. A.; Wishart J. F.; Castner E. W. Jr. Fluorescence Probing of Temperature-Dependent Dynamics and Friction in Ionic Liquid Local Environments. J. Phys. Chem. B 2007, 111, 4963–4977. 10.1021/jp068298o. [DOI] [PubMed] [Google Scholar]
- Lall-Ramnarine S. I.; Zhao M.; Rodriguez C.; Fernandez R.; Zmich N.; Fernandez E. D.; Dhiman S. B.; Castner E. W. Jr.; Wishart J. F. Connecting Structural and Transport Properties of Ionic Liquids with Cationic Oligoether Chains. J. Electrochem. Soc. 2017, 164, H5247–H5262. 10.1149/2.0371708jes. [DOI] [Google Scholar]
- Funston A. M.; Wishart J. F.. Ionic Liquids IIIA: Fundamentals, Progress, Challenges, and Opportunities, Properties and Structure; Rogers R. D.; Seddon K. R., Eds.; American Chemical Society: Washington, 2005; Vol. 901, pp 102–116. [Google Scholar]
- Chen Z.; Huo Y.; Cao J.; Xu L.; Zhang S. Physicochemical Properties of Ether-Functionalized Ionic Liquids: Understanding Their Irregular Variations with the Ether Chain Length. Ind. Eng. Chem. Res. 2016, 55, 11589–11596. 10.1021/acs.iecr.6b02875. [DOI] [Google Scholar]
- Kofu M.; Nagao M.; Ueki T.; Kitazawa Y.; Nakamura Y.; Sawamura S.; Watanabe M.; Yamamuro O. Heterogeneous Slow Dynamics of Imidazolium-based Ionic Liquids Studied by Neutron Spin Echo. J. Phys. Chem. B 2013, 117, 2773–2781. 10.1021/jp312608r. [DOI] [PubMed] [Google Scholar]
- Yamamuro O.; Yamada T.; Kofu M.; Nakakoshi M.; Nagao M. Hierarchical Structure and Dynamics of an Ionic Liquid 1-octyl-3-methylimidazolium Chloride. J. Chem. Phys. 2011, 135, 054508. 10.1063/1.3622598. [DOI] [PubMed] [Google Scholar]
- Russina O.; Beiner M.; Pappas C.; Russina M.; Arrighi V.; Unruh T.; Mullan C. L.; Hardacre C.; Triolo A. Temperature Dependence of the Primary Relaxation in 1-Hexyl-3-methylimidazolium bis{(trifluoromethyl)sulfonyl}imide. J. Phys. Chem. B 2009, 113, 8469–8474. 10.1021/jp900142m. [DOI] [PubMed] [Google Scholar]
- Yamaguchi T.; Mikawa K.; Koda S.; Fujii K.; Endo H.; Shibayama M.; Hamano H.; Umebayashi Y. Relationship between Mesoscale Dynamics and Shear Relaxation of Ionic Liquids with Long Alkyl Chain. J. Chem. Phys. 2012, 137, 104511. 10.1063/1.4751547. [DOI] [PubMed] [Google Scholar]
- Yamaguchi T. Mode-Coupling Theoretical Study on the Roles of Heterogeneous Structure in Rheology of Ionic Liquids. J. Chem. Phys. 2016, 144, 124514. 10.1063/1.4944679. [DOI] [PubMed] [Google Scholar]
- Yamaguchi T. Experimental Study on the Relationship between the Frequency-Dependent Shear Viscosity and the Intermediate Scattering Function of Representative Viscous Liquids. J. Chem. Phys. 2016, 145, 194505. 10.1063/1.4968208. [DOI] [PubMed] [Google Scholar]
- Yamaguchi T.; Faraone A. Analysis of Shear Viscosity and Viscoelastic Relaxation of Liquid Methanol based on Molecular Dynamics Simulation and Mode-Coupling Theory. J. Chem. Phys. 2017, 146, 244506. 10.1063/1.4990408. [DOI] [PubMed] [Google Scholar]
- Yamaguchi T. Coupling between the Mesoscopic Dynamics and Shear Stress of a Room-Temperature Ionic Liquid. Phys. Chem. Chem. Phys. 2018, 20, 17809–17817. 10.1039/C8CP02814A. [DOI] [PubMed] [Google Scholar]
- Annapureddy H. V. R.; Kashyap H. K.; De Biase P. M.; Margulis C. J. What is the Origin of the Prepeak in the X-ray Scattering of Imidazolium-based Room-Temperature Ionic Liquids?. J. Phys. Chem. B 2010, 114, 16838–16846. 10.1021/jp108545z. [DOI] [PubMed] [Google Scholar]
- Hettige J. J.; Araque J. C.; Kashyap H. K.; Margulis C. J. Communication: Nanoscale Structure of tetradecyltrihexylphosphonium based Ionic Liquids. J. Chem. Phys. 2016, 144, 121102. 10.1063/1.4944678. [DOI] [PubMed] [Google Scholar]
- Kashyap H. K.; Margulis C. J. (Keynote) Theoretical Deconstruction of the X-ray Structure Function Exposes Polarity Alternations in Room Temperature Ionic Liquids. ECS Trans. 2013, 50, 301–307. 10.1149/05011.0301ecst. [DOI] [Google Scholar]
- Hettige J. J.; Kashyap H. K.; Annapureddy H. V. R.; Margulis C. J. Anions, the Reporters of Structure in Ionic Liquids. J. Phys. Chem. Lett. 2013, 4, 105–110. 10.1021/jz301866f. [DOI] [PubMed] [Google Scholar]
- Kashyap H. K.; Santos C. S.; Annapureddy H. V. R.; Murthy N. S.; Margulis C. J.; Castner E. W. Jr. Temperature-dependent Structure of Ionic Liquids: X-ray Scattering and Simulations. Faraday Discuss. 2012, 154, 133–143. 10.1039/C1FD00059D. [DOI] [PubMed] [Google Scholar]
- Kashyap H. K.; Hettige J. J.; Margulis C. J.; et al. SAXS Anti-Peaks Reveal the Length-Scales of Dual Positive–egative and Polar–polar Ordering in Room-Temperature Ionic Liquids. Chem. Commun. 2012, 48, 5103–5105. 10.1039/c2cc30609c. [DOI] [PubMed] [Google Scholar]
- Rocha M. A. A.; Neves C. M. S. S.; Freire M. G.; Russina O.; Triolo A.; Coutinho J. A. P.; Santos L. M. N. B. F. Alkylimidazolium based Ionic Liquids: Impact of Cation Symmetry on Their Nanoscale Structural Organization. J. Phys. Chem. B 2013, 117, 10889–10897. 10.1021/jp406374a. [DOI] [PubMed] [Google Scholar]
- Araque J. C.; Hettige J. J.; Margulis C. J. Ionic liquids–Conventional Solvent Mixtures, Structurally Different but Dynamically Similar. J. Chem. Phys. 2015, 143, 134505. 10.1063/1.4932331. [DOI] [PubMed] [Google Scholar]
- Santos C. S.; Annapureddy H. V. R.; Murthy N. S.; Kashyap H. K.; Castner E. W. Jr.; Margulis C. J. Temperature-dependent Structure of Methyltributylammonium bis(trifluoromethylsulfonyl)amide: X ray Scattering and Simulations. J. Chem. Phys. 2011, 134, 064501. 10.1063/1.3526958. [DOI] [PubMed] [Google Scholar]
- Toby B. H.; Von Dreele R. B. GSAS-II: The Genesis of a Modern Open-Source All Purpose Crystallography Software Package. J. Appl. Crystallogr. 2013, 46, 544–549. 10.1107/S0021889813003531. [DOI] [Google Scholar]
- Qiu X.; et al. PDFgetX2: a GUI-Driven Program to Obtain the Pair Distribution Function from X-ray Powder Diffraction Data. J. Appl. Crystallogr. 2004, 37, 678. 10.1107/S0021889804011744. [DOI] [Google Scholar]
- Brown P. J.; Fox A. G.; Maslen E. N.; O’Keefe M. A.; Willis B. T. M.. International Tables for Crystallography; IUC, 2006; Chapter 6.1, pp 554–595. [Google Scholar]
- Dhungana K. B.; Faria L. F. O.; Wu B.; Liang M.; Ribeiro M. C. C.; Margulis C. J.; Castner E. W. Jr. Structure of Cyano-Anion Ionic Liquids: X-ray Scattering and Simulations. J. Chem. Phys. 2016, 145, 024503. 10.1063/1.4955186. [DOI] [PubMed] [Google Scholar]
- Hess B.; Kutzner C.; Van Der Spoel D.; Lindahl E. GROMACS 4: Algorithms for Highly Efficient, Load-Balanced, and Scalable Molecular Simulation. J. Chem. Theory Comput. 2008, 4, 435–447. 10.1021/ct700301q. [DOI] [PubMed] [Google Scholar]
- Darden T.; York D.; Pedersen L. Particle Mesh Ewald: An N·log(N) Method for Ewald Sums in Large Systems. J. Chem. Phys. 1993, 98, 10089–10092. 10.1063/1.464397. [DOI] [Google Scholar]
- Essmann U.; Perera L.; Berkowitz M. L.; Darden T.; Lee H.; Pedersen L. G. A Smooth Particle Mesh Ewald Method. J. Chem. Phys. 1995, 103, 8577–8593. 10.1063/1.470117. [DOI] [Google Scholar]
- Jorgensen W. L.; Maxwell D. S.; Tirado-Rives J. Development and Testing of the OPLS All-Atom Force Field on Conformational Energetics and Properties of Organic Liquids. J. Am. Chem. Soc. 1996, 118, 11225–11236. 10.1021/ja9621760. [DOI] [Google Scholar]
- Canongia Lopes J. N.; Deschamps J.; Pádua A. A. H. Modeling Ionic Liquids Using a Systematic All-Atom Force Field. J. Phys. Chem. B 2004, 108, 2038–2047. 10.1021/jp0362133. [DOI] [Google Scholar]
- Canongia Lopes J. N.; Pádua A. A. H. Molecular Force Field for Ionic Liquids Composed of Triflate or Bistriflylimide Anions. J. Phys. Chem. B 2004, 108, 16893–16898. 10.1021/jp0476545. [DOI] [Google Scholar]
- Canongia Lopes J. N.; Pádua A. A. H.; Shimizu K. Molecular Force Field for Ionic Liquids IV: Trialkylimidazolium and Alkoxycarbonyl-Imidazolium Cations Alkylsulfonate and Alkylsulfate Anions. J. Phys. Chem. B 2008, 112, 5039–5046. 10.1021/jp800281e. [DOI] [PubMed] [Google Scholar]
- Shimizu K.; Almantariotis D.; Gomes M. F. C.; Pádua A. A. H.; Canongia Lopes J. N. Molecular Force Field for Ionic Liquids V: Hydroxyethylimidazolium, Dimethoxy-2- Methylimidazolium, and Fluoroalkylimidazolium Cations and Bis(Fluorosulfonyl)Amide, Perfluoroalkanesulfonylamide, and Fluoroalkylfluorophosphate Anions. J. Phys. Chem. B 2010, 114, 3592–3600. 10.1021/jp9120468. [DOI] [PubMed] [Google Scholar]
- Köddermann T.; Paschek D.; Ludwig R. Molecular Dynamic Simulations of Ionic Liquids: A Reliable Description of Structure, Thermodynamics and Dynamics. ChemPhysChem 2007, 8, 2464–2470. 10.1002/cphc.200700552. [DOI] [PubMed] [Google Scholar]
- Weiner S. J.; Kollman P. A.; Nguyen D. T.; Case D. A. An All Atom Force Field for Simulations of Proteins and Nucleic Acids. J. Comput. Chem. 1986, 7, 230–252. 10.1002/jcc.540070216. [DOI] [PubMed] [Google Scholar]
- Cornell W. D.; Cieplak P.; Bayly C. I.; Gould I. R.; Merz K. M.; Ferguson D. M.; Spellmeyer D. C.; Fox T.; Caldwell J. W.; Kollman P. A. A Second Generation Force Field for the Simulation of Proteins, Nucleic Acids, and Organic Molecule. J. Am. Chem. Soc. 1995, 117, 5179–5197. 10.1021/ja00124a002. [DOI] [Google Scholar]
- Price M. L. P.; Ostrovsky D.; Jorgensen W. L. Gas-phase and Liquid-State Properties of Esters, Nitriles, and Nitro Compounds with the OPLS-AA Force Field. J. Comput. Chem. 2001, 22, 1340–1352. 10.1002/jcc.1092. [DOI] [Google Scholar]
- Frisch M. J.; Trucks G. W.; Schlegel H. B.; Scuseria G. E.; Robb M. A.; Cheeseman J. R.; Scalmani G.; Barone V.; Mennucci B.; Petersson G. A.. et al. Gaussian 09, Revision D.01; Gaussian Inc.: Wallingford, CT, 2013.
- Bussi G.; Donadio D.; Parrinello M. Canonical Sampling Through Velocity Rescaling. J. Chem. Phys. 2007, 126, 014101. 10.1063/1.2408420. [DOI] [PubMed] [Google Scholar]
- Berendsen H. J. C.; Postma J. P. M.; van Gunsteren W. F.; DiNola A.; Haak J. R. Molecular Dynamics with Coupling to an External Bath. J. Chem. Phys. 1984, 81, 3684–3690. 10.1063/1.448118. [DOI] [Google Scholar]
- Nosé S. A Unified Formulation of the Constant Temperature Molecular Dynamics Methods. J. Chem. Phys. 1984, 81, 511–519. 10.1063/1.447334. [DOI] [Google Scholar]
- Parrinello M.; Rahman A. Polymorphic Transitions in Single Crystals: A New Molecular Dynamics Method. J. Appl. Phys. 1981, 52, 7182–7190. 10.1063/1.328693. [DOI] [Google Scholar]
- Verlet L. Computer “Experiments” on Classical Fluids. I. Thermodynamical Properties of Lennard-Jones Molecules. Phys. Rev. 1967, 159, 98–103. 10.1103/PhysRev.159.98. [DOI] [Google Scholar]
- Zhang Y.; Otani A.; Maginn E. J. Reliable Viscosity Calculation from Equilibrium Molecular Dynamics Simulations: A Time Decomposition Method. J. Chem. Theory Comput. 2015, 11, 3537–3546. 10.1021/acs.jctc.5b00351. [DOI] [PubMed] [Google Scholar]
- Balucani U.; Zoppi M.. Dynamics of the Liquid State; Oxford Science Publications, 1994. [Google Scholar]
- Lorch E. Neutron Diffraction by Germania, Silica and Radiation-Damaged Silica Glasses. J. Phys. C: Solid State Phys. 1969, 2, 229–237. 10.1088/0022-3719/2/2/305. [DOI] [Google Scholar]
- Du J.; Benmore C. J.; Corrales R.; Hart R. T.; Richard Weber J. K. A Molecular Dynamics Simulation Interpretation of Neutron and X-Ray Diffraction Measurements on Single Phase Y2O3-Al2O3 Glasses. J. Phys.: Condens. Matter 2009, 21, 205102. 10.1088/0953-8984/21/20/205102. [DOI] [PubMed] [Google Scholar]
- Walter N. P.; Jaiswal A.; Cai Z.; Zhang Y. LiquidLib: A Comprehensive Toolbox for Analyzing Classical and Ab Initio Molecular Dynamics Simulations of Liquids and Liquid-like Matter with Applications to Neutron Scattering Experiments. Comput. Phys. Commun. 2018, 228, 209–218. 10.1016/j.cpc.2018.03.005. [DOI] [Google Scholar]
- Kashyap H. K.; Santos C. S.; Daly R. P.; Hettige J. J.; Murthy N. S.; Shirota H. Jr.; EW C.; Margulis C. J. How Does the Ionic Liquid Organizational Landscape Change when Nonpolar Cationic Alkyl Groups Are Replaced by Polar Isoelectronic Diethers?. J. Phys. Chem. B 2013, 117, 1130–1135. 10.1021/jp311032p. [DOI] [PubMed] [Google Scholar]
- Amith W. D.; Hettige J. J. Jr.; EW C.; Margulis C. J. Structures of Ionic Liquids Having Both Anionic and Cationic Octyl Tails: Lamellar Vacuum Interface vs Sponge-Like Bulk Order. J. Phys. Chem. Lett. 2016, 7, 3785–3790. 10.1021/acs.jpclett.6b01763. [DOI] [PubMed] [Google Scholar]
- Hettige J. J.; Amith W. D. Jr.; Margulis E. W. C.; Ionic C. J. Liquids with Symmetric Diether Tails: Bulk and Vacuum-Liquid Interfacial Structures. J. Phys. Chem. B 2017, 121, 174–179. 10.1021/acs.jpcb.6b09148. [DOI] [PubMed] [Google Scholar]
- Hettige J. J.; Araque J. C.; Margulis C. J. Bicontinuity and Multiple Length Scale Ordering in Triphilic Hydrogen-Bonding Ionic Liquids. J. Phys. Chem. B 2014, 118, 12706–12716. 10.1021/jp5068457. [DOI] [PubMed] [Google Scholar]
- Hettige J. J.; Kashyap H. K.; Margulis C. J. Communication: Anomalous Temperature Dependence of the Intermediate Range Order in Phosphonium Ionic Liquids. J. Chem. Phys. 2014, 140, 111102. 10.1063/1.4867900. [DOI] [PubMed] [Google Scholar]
- Sharma S.; Ivanov A. S.; Margulis C. J. A Brief Guide to the Structure of High-Temperature Molten Salts and Key Aspects Making Them Different from Their Low-Temperature Relatives, the Ionic Liquids. J. Phys. Chem. B 2021, 125, 6359–6372. 10.1021/acs.jpcb.1c01065. [DOI] [PMC free article] [PubMed] [Google Scholar]
- Wu F.; Roy S.; Ivanov A. S.; Gill S. K.; Topsakal M.; Dooryhee E.; Abeykoon M.; Kwon G.; Gallington L. C.; Halstenberg P.; et al. Elucidating Ionic Correlations Beyond Simple Charge Alternation in Molten MgCl2-KCl Mixtures. J. Phys. Chem. Lett. 2019, 10, 7603–7610. 10.1021/acs.jpclett.9b02845. [DOI] [PubMed] [Google Scholar]
- Wu F.; Sharma S.; Roy S.; Halstenberg P.; Gallington L. C.; Mahurin S. M.; Dai S.; Bryantsev V. S.; Ivanov A. S.; Margulis C. J. Temperature Dependence of Short and Intermediate Range Order in Molten MgCl2 and Its Mixture with KCl. J. Phys. Chem. B 2020, 124, 2892–2899. 10.1021/acs.jpcb.0c00745. [DOI] [PubMed] [Google Scholar]
- Roy S.; Wu F.; Wang H.; Ivanov A. S.; Sharma S.; Halstenberg P.; Gill S. K.; Abeykoon A. M. M.; Kwon G.; Topsakal M.; et al. Structure and Dynamics of the Molten Alkali-Chloride Salts from an X-ray, Simulation, and Rate Theory Perspective. Phys. Chem. Chem. Phys. 2020, 22, 22900–22917. 10.1039/D0CP03672B. [DOI] [PubMed] [Google Scholar]
- Roy S.; Sharma S.; Karunaratne W. V.; Wu F.; Gakhar R.; Maltsev D. S.; Halstenberg P.; Abeykoon M.; Gill S. K.; Zhang Y.; et al. X-ray Scattering Reveals Ion Clustering of Dilute Chromium Species in Molten Chloride Medium. Chem. Sci. 2021, 12, 8026–8035. 10.1039/D1SC01224J. [DOI] [PMC free article] [PubMed] [Google Scholar]
- Roy S.; Brehm M.; Sharma S.; Wu F.; Maltsev D. S.; Halstenberg P.; Gallington L. C.; Mahurin S. M.; Dai S.; Ivanov A. S.; et al. Unraveling Local Structure of Molten Salts via X-ray Scattering, Raman Spectroscopy, and Ab Initio Molecular Dynamics. J. Phys. Chem. B 2021, 125, 5971–5982. 10.1021/acs.jpcb.1c03786. [DOI] [PubMed] [Google Scholar]
- Emerson M. S.; Sharma S.; Roy S.; Bryantsev V. S.; Ivanov A. S.; Gakhar R.; Woods M. E.; Gallington L. C.; Dai S.; Maltsev D. S.; Margulis C. J. Complete Description of the LaCl3–NaCl Melt Structure and the Concept of a Spacer Salt That Causes Structural Heterogeneity. J. Am. Chem. Soc. 2022, 144, 21751–21762. 10.1021/jacs.2c09987. [DOI] [PMC free article] [PubMed] [Google Scholar]
- Dhungana K. B.; Margulis C. J. Comparison of the Structural Response to Pressure of Ionic Liquids with Ether and Alkyl Functionalities. J. Phys. Chem. B 2017, 121, 6890–6897. 10.1021/acs.jpcb.7b04038. [DOI] [PubMed] [Google Scholar]
- Brehm M.; Thomas M.; Gehrke S.; Kirchner B. TRAVIS–A Free Analyzer for Trajectories from Molecular Simulation. J. Chem. Phys. 2020, 152, 164105. 10.1063/5.0005078. [DOI] [PubMed] [Google Scholar]
Associated Data
This section collects any data citations, data availability statements, or supplementary materials included in this article.


