

Abstract
Background:
New evidence suggests that bacteria-produced DNA toxins may have a role in the development or progression of prostate cancer. To determine the prevalence of these genes in a noninfection (i.e., colonized) state, we screened urine specimens in men before undergoing a biopsy for prostate cancer detection.
Methods:
We developed a multiplex polymerase chain reaction using three of the most described bacterial genotoxin gene primers: Colibactin (polyketone synthase [pks] gene island: clbN and clbB), cytotoxic necrotizing factor (cnf1) toxin, and cytolethal distending toxin B (cdtB) represented gene islands. After calibration on Escherichia coli samples of known genotypes, we used a training and validation cohort. We performed multiplex testing on a training cohort of previously collected urine from 45 men undergoing prostate biopsy. For the validation cohort, we utilized baseline urine samples from a previous randomized clinical trial (n = 263) with known prostate cancer outcomes.
Results:
The prevalence of four common bacterial genotoxin genes detected in the urine before prostate biopsy for prostate cancer is 8% (25/311). The prevalence of pks island (clbN and clbB), cnf1, and cdt toxin genes are 6.1%, 2.4%, and 1.7%, respectively. We found no association between urinary genotoxins and prostate cancer (p = 0.83). We did identify a higher proportion of low-grade cancer (92% vs. 44%) in those men positive for urinary genotoxin and higher-grade cancer in those genotoxin negative (8% vs. 56%, p = 0.001).
Conclusions:
The prevalence of urinary genotoxins is low and does not correspond to a prostate cancer diagnosis. The urine was taken at one point in time and does not rule out the possibility of previous exposure.
Keywords: E. coli, genotoxin, prostate cancer, urinary microbiome
1 |. INTRODUCTION
Microbial–human interaction leading to cancer initiation has led to profound progress and innovative prevention techniques in several cancers, yet a microbial cause for prostate cancer remains unproven.1 Identifying a specific cause of prostate cancer could focus countermeasures to favorably impact the second most common cancer in men worldwide.2 Studies have speculated a link between chronic bacterial infection to prostate cancer through subclinical inflammation or DNA damage,3,4 similar to gastric (Helicobacter pylori)5 and colon cancer (Escherichia coli [E. coli]).6
For example, colibactin is a bacterially produced toxin implicated as a cause of colon cancer. E. coli strains that produce colibactin carry a ∽50 kb polyketide synthase operon, which harbors polyketone synthase (pks+) genes.7,8 The mechanism by which colibactin causes colon cancer includes DNA cross-linking and DNA doubl-strand breaks (DSBs). Once two strands of DNA are broken, they can undergo reassembly leading to genomic rearrangements. One example is TMPRSS2:2ERG (T2:ERG) gene fusions, which occur in half of all prostate cancer patients.9,10 The colibactin concentration has been difficult to detect outside of active infection; therefore, detection relies on the identification of pks genes. Sfanos and collaborators confirmed the plausibility of pks+ E. coli to potentially initiate prostate cancer through DNA damage induction of T2:ERG rearragment.11 However, colibactin is not the only genotoxin implicated in causing genotoxic effects. Two other bacterial-produced genotoxins include cytotoxic necrotizing factor (cnf1) toxin and cytolethal distending toxin B (cdtB) commonly occur in uropathogenic E. coli.12,13 Although cdtB has not be shown to cause DNA DSBs, we have included it for completeness. The significance of the prevalence of oncogenic bacteria in the urine of asymptomatic men to determine its association with prostate cancer risk remains unknown. Herein, we developed a multiplex polymerase chain reaction (PCR) assay that was able to amplify bacterial pks+ markers (clbB and clbN), as well as genes for cdtB, and cnf1. In the same urine samples, we compared the T2:ERG gene fusion status in relation to genotoxin presence as an indicator of DNA DSBs.
2 |. METHODS
2.1 |. Multiplex PCR development
A pilot assay was first developed to determine sensitivity. A sample of pooled urine specimens was prepared and tested to confirm the absence of the cnf1, clbN, clbB, cdtB, and uidA markers. PCR reactions consisted of using individual primer pairs (see below) for each marker in a PCR reaction containing 1 ng of template DNA, 5 μL of 2mM dNTP, 0.5 μL KOD Xtreme Hot Start DNA polymerase (Sigma-Aldrich), 0.75 μL of a 10 μM stock of each primer, 12.5 μL of 2X buffer, and distilled water to 25 μL. Thermocycler conditions consisted of an initial activation step of 94°C for 2min, followed by 35 cycles of 98°C for 10 s, 68°C for 1min, and a final step of 68°C for 5min.
The multiplex PCR reaction was developed using a Multiplex PCR Kit (Qiagen Inc.). Sensitivity limits were determined using strains B1-5-1 and B3-1-4 as controls for all four markers (cnf1, clbN, clbB, and cdtB). They were grown overnight in Luria-Bertani broth and washed once with phosphate-buffered saline, then spiked into urine to give a starting OD600 = 1 (8 × 10⁸ colony-forming unit [CFU]/mL). Serial 10-fold dilutions were made in urine followed by extraction using the QIAamp DNA Micro Kit (Qiagen) according to the manufacturer’s instructions. The final multiplex reaction mix consisted of 12.5 μL of 2X Qiagen Multiplex PCR mix, 2.5 μL of a 2 μM stock primer mix containing each primer, 1.0 μL of template DNA extract, and 9.0 μL of water for a final reaction volume of 25 μL. The primer stock was made up of 2.0 μL of a 100 μM stock of each primer in a final volume of 100 μL. The multiplex mix consisted of primers for cnf1 (forward [For]: 5′-ATCTTATACTGGATGGGATCATCTTGG-3′, reverse [Rev]: 5′-CAGAACGACGTTCTTCATAAGTATC-3′), clbN (For: 5′-GTTTTGCTCGCCAGATAGTCATTC-3′, Rev: 5′-CAGTTCG GGTATGTGTGGAAGG-3′), clbB (For: 5′-GATTTGGATACTGGCGATAACCG-3′, Rev: 5′-CCATTTCCCGTTTGAGCACAC-3′), and cdtB (For: 5′-GAAAATAAATGGAACACACATGTCCG-3′, Rev: 5′-AAATCTCCTGCAATCATCCAGTTA-3′). uidA was used as an E. coli control but was not part of the multiplex reaction since we used it to prescreen samples that would later be tested with the multiplex mix. Primers for this gene were For: 5′-GCGTCTGTTGACTGGCA GGTGGTGG-3′, Rev: 5′-GTTGCCCGCTTCGAAACCAATGCCT-3′. Primer amplicon sizes were cnf1 974 bp, clbN 733 bp, clbB 579 bp, cdtB 466 bp, and uidA 508 bp, respectively. Primers were selected from previous studies.7,14–16 In addition to the positive controls, negative control E. coli strains used for assay development included B1-7-6, JJ0055, JJ1166, and JJ1167, which were used as negative controls for all markers except uidA. All strains were obtained from James Johnson.
2.2 |. Gel electrophoresis
Gel Electrophoresis of PCR samples was performed using a 1.6% combination gel of NuSieve 3:1 Agarose (Lonza Bioscience) and Certified Molecular Biology Agarose (Bio-Rad Laboratories Inc.) (1.2% NuSieve, 0.4% Certified Molecular Biology Agarose). The Invitrogen KB Plus ladder (Thermo Fischer Scientific) was used for fragment size comparison.
2.3 |. Urine sample processing
Previously collected urine samples were stored in 5 mL aliquots. Bacterial DNA was prepared for extraction from these samples by centrifuging 1.0 mL of urine in a 1.5 mL microfuge tube (Light Labs) at 6000g for 2 min. The supernatant was discarded, and the pellet was suspended in 500 μL of Buffer AE from the QIAamp DNA Micro Kit (Qiagen Inc.). The remaining steps were according to the manufacturer’s instructions. Samples were eluted at the final step with 50 μL of Buffer AE and stored at −20°C.
2.4 |. Training population
To test the multiplex in urine samples, we used previously collected urine samples from 45 men who consented and enrolled in our genitourinary urinary tissue bank (IRB#: HSC20050234H). Urine samples were collected after the digital rectal exam (DRE). The DRE is known to improve DNA concentrations specifically from prostate origin.17
2.5 |. Validation population
Stored urine samples were identified from the finasteride challenge study (n = 263) that randomized men to receive finasteride for 3 months before prostate biopsy (IRB#: HSC20100352H).18 Men were recruited between 2011 and 2016. The eligibility criteria specified men 55 years or older with or without prior negative prostate biopsy. At 90 ± 14 days, subjects underwent a 12-core prostate biopsy, and the samples were processed for pathologic assessment. We only analyzed those patients that consented to future studies with their specimens.
2.6 |. Associated data
Data were collected from the database that included demographics and pathologic assessment. In the validation cohort, we obtained PCA3 and T2:ERG status reported during the initial study. The T2:ERG status was blinded to the laboratory personnel processing the urine samples for genotoxin status.
2.7 |. Statistical analyses
We analyzed univariant data with χ2 and Fischer’s exact for categorical variables and Student’s test for continuous variables. We performed logistic regression for multivariant analyses with a primary outcome of prostate cancer. Secondary analysis was performed for clinically significant prostate cancer and T2:ERG status. We performed the analysis using SPSS v27 (IBM Corp.).
3 |. RESULTS
3.1 |. Optimization of PCR
Because we were interested in developing an assay that could incorporate a large number of markers and be flexible enough to switch out or add new markers, we chose the multiplex gel assay, which is qualitative due to the output being ethidium bromide-stained band patterns on an agarose gel. Quantitative real-time PCR would be a better choice for a quantitative assay, however, we only needed an assay that gave us + or − results, but could also be used to determine the presence or absence of individual markers in a single test. The overall comparisons of our PCR testing are confirmed using known samples shown in Table 1. Figure 1A shows the results of the optimized assay in which all four bands could be detected simultaneously to a level of 14 CFU. Figure 1B shows the results comparing E. coli strains for marker specificity and Figure 1C shows the results of the uidA E. coli control. Prescreening with an individual uidA PCR test was used to save the multiplex reagents rather than incorporate uidA into the multiplex reaction.
TABLE 1.
Optimization of PCR primers.
| Observed | Expected | |||||||||
|---|---|---|---|---|---|---|---|---|---|---|
| Johnson ID | clbN (733 bp) |
cdtB (466 bp) |
clbB (579 bp) |
cnf1 (974 bp) |
uidA (503 bp) |
clbN (733 bp) |
cdtB (466 bp) |
clbB (579 bp) |
cnf1 (974 bp) |
uidA (503 bp) |
| 1 | + | + | + | + | + | + | + | + | ||
| 2 | + | + | + | + | + | + | + | + | ||
| 3 | + | + | + | + | + | + | + | + | ||
| 4 | + | + | + | + | + | + | + | + | ||
| 5 | + | + | ||||||||
| 6 | + | + | ||||||||
| 7 | + | + | ||||||||
| 8 | + | + | + | + | + | + | ||||
| 9 | + | + | ||||||||
Note: Escherichia coli strains with listed genotypes, and results, were used to construct the multiplex assay. Strains were courtesy of Dr. James Johnson at the University of Minnesota.
Abbreviation: PCR, polymerase chain reaction.
FIGURE 1.
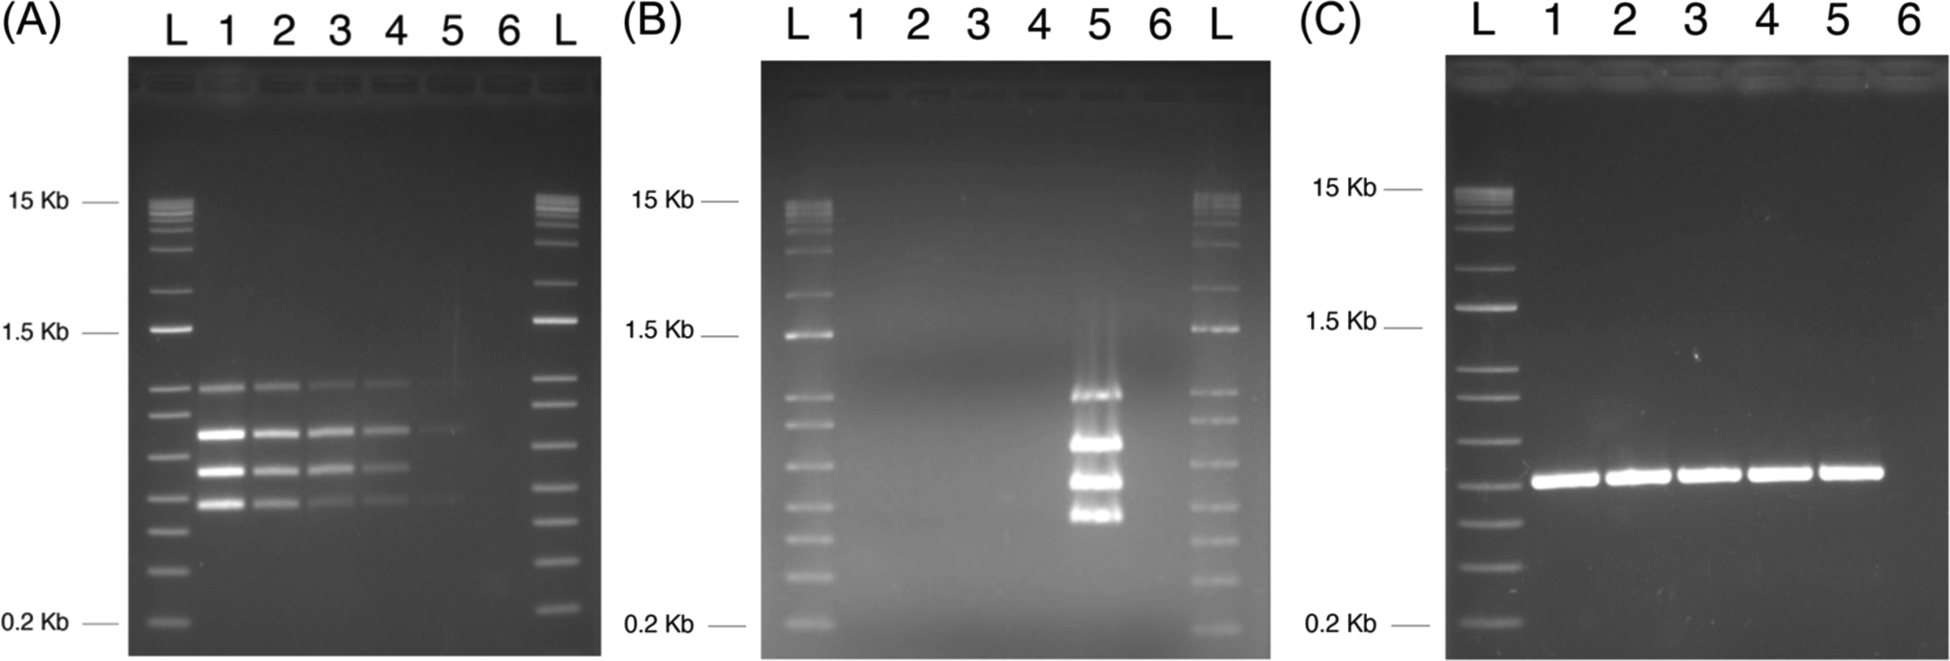
Sensitivity and specificity of the multiplex PCR test for genotoxic bacteria. Multiplex PCR assay development. (A) Assay sensitivity: lane 1 positive control containing 140 CFU/mL, lane 2 positive control containing 70 CFU/mL, lane 3 positive control containing 28 CFU/mL, lane 4 positive control containing 14 CFU/mL, lane 5 positive control containing 2 CFU/mL, and lane 6 no DNA control.
(B) Multiplex assay for marker specificity: lane 1 B1-7-6, lane 2 JJ0055, lane 3 JJ1166, lane 4 JJ1167, lane 5 positive Escherichia coli control for all four markers B1-5-1 and B3-1-4, and lane 6 no DNA control. (C) uidA controls: B1-7-6, lane 2 JJ0055, lane 3 JJ1166, lane 4 JJ1167, lane 5 positive B1-5-1 and B3-1-4, and lane 6 no DNA control. CFU, colony-forming unit; PCR, polymerase chain reaction. L, size ladder.
3.2 |. Demographics
Demographics are displayed in Table 2. We noted that the test cohort did have a higher prostate-specific antigen than the validation cohort (6.88 vs. 5.22, p < 0.001). However, there was no statistical difference in overall cancer detection (46.7% vs. 49.2%, p = 0.87) or the diagnosis of clinically significant prostate cancer (grade group ≥2, 52.4% vs. 52.7%, p = 0.98). We also noted a higher proportion of cdt genes in the test cohort compared to the validation cohort (p = 0.02, 8.9% vs. 2.3%, respectively). We tested a total of 263 unique urine samples in the validation cohort that had associated PCA3 and T2:ERG scores (Figure 2).
TABLE 2.
Demographics.
| Demographic | Training set (N = 45), median (IQR) or number (%) | Validation set (n = 266), median (IQR) or number (%) | p Value | Total (n = 311) |
|---|---|---|---|---|
| Age | 65 (61–70) | 65 (61–68) | 0.65 | 65 (61–68) |
| Race/ethnicity | 0.09 | |||
| Black | 11 (24.4%) | 34 (12.8%) | 45 (14.5%) | |
| Hispanic | 18 (40%) | 100 (37.6%) | 118 (37.9%) | |
| White | 16 (35%) | 132 (49.6%) | 148 (47.6%) | |
| Prostate-specific antigen | 6.88 (5.05–10.03) | 5.22 (4.30–6.63) | 0.001 | 5.4 (4.4–6.8) |
| Family history of prostate cancer | 11 (24.4%) | 47 (18%) | 0.22 | 58 (18.6%) |
| PCA3 score | 31.1 (13.8–60.3) | |||
| T2:ERG score | 4.78 (0.09–32.12) | |||
| Bacterial toxin genes | 6 (13.3%) | 18 (6.8%) | 0.16 | 24 (7.7%) |
| pks (clbN or clbB) | 3 (6.7%) | 15 (5.6%) | 0.78 | 18 (4.4%) |
| cdt | 0 (0%) | 7 (2.6%) | 0.27 | 7 (1.7%) |
| cnf-1 | 4 (8.9%) | 6 (2.3%) | 0.02 | 10 (2.4%) |
| Prostate cancer | 21 (46.7%) | 131 (49.2%) | 0.87 | 152 (48.9%) |
| Grade group 1 | 10 (22.2%) | 62 (23.3%) | 72 (23.2%) | |
| Grade group 2 | 2 (4.4%) | 32 (12%) | 34 (10.9%) | |
| Grade group 3 | 6 (13.3%) | 20 (7.5%) | 26 (8.4%) | |
| Grade group 4 | 2 (4.4%) | 16 (6%) | 18 (5.8%) | |
| Grade group 5 | 1 (2.2%) | 1 (0.4%) | 2 (0.6%) |
Abbreviation: IQR, interquartile range.
FIGURE 2.

Validation consort diagram.
3.3 |. Prevalence of urinary genotoxins
We identified 8% (25/311) of subjects with at least one of the three bacterial genotoxin genes present in the urine. The most common genotoxin genes identified was the pks+ (clbN or clbB) gene island which produces colibactin, with a total of 19 (6.1%) samples. cnf1 toxin and cdtB were detected less frequently for a total of 7 (1.7%) and 10 (2.4%), respectively. Eight of the 25 ((8/25, 32%) samples were positive for more than one gene. The cdtB gene was commonly accompanied by a pks gene (71%, 5/7).
3.4 |. Urinary genotoxin association with prostate cancer
Urinary genotoxin was not associated with prostate cancer (p = 0.83, Table 3). Low-risk prostate cancer was associated with the genotoxin group, whereas clinically significant cancer was more common in the group negative for urinary genotoxins (p = 0.001). The cancer rate of pks+ and pks− specifically was 44% (8/18) and 48% (145/288), and the difference between the two cancer rates was not statistically significant (p = 0.63).
TABLE 3.
Demographics of pks+ versus pks− subjects.
| Demographic | pks+ (N = 15) | pks− (N = 248) | p Value |
|---|---|---|---|
| Age | 64 (62–67) | 65 (61–68) | 0.82 |
| Race/ethnicity | 0.23 | ||
| Black | 0 (0%) | 34 (14%) | |
| Non-Black | 15 (100%) | 217 (87%) | |
| Prostate-specific antigen | 5.6 (4.5–6.5) | 5.2 (4.3–6.7) | 0.57 |
| Previous prostate biopsy | 3 (20%) | 40 (16%) | 0.71 |
| Prostate cancer family history | 2 (13%) | 45 (18%) | 1 |
| Prostate cancer prevention trial risk calculator (%) | 27% (24%−32%) | 28% (25%−32%) | 0.25 |
| PCA3 | 31.1 (8.5–42.6) | 31.1 (13.8–61.6) | 0.36 |
| T2:Erg | 5.5 (0.9–27.7) | 4.7 (0.1–34.2) | 0.6 |
| Any prostate cancer | 6 (40%) | 126 (51%) | 0.44 |
| Clinically significant prostate cancer (grade group >1) | 1 (7%) | 68 (27%) | 0.1 |
| Copresence with other genotoxins | |||
| cnfl | 4 (27%) | 2 (0.8%) | <0.001 |
| cdt | 5 (33%) | 2 (0.8%) | <0.001 |
3.5 |. Genotoxin associated with T2:ERG translocation
Only the validation cohort has T2:ERG and PCA3 scores to compare to genotoxin status.18 The urine T2:Erg amplification assay was published to be 92% concordant with fluorescence in situ hybridization testing in tissue.19 We found no association between urinary genotoxin with PCA3 or T2:ERG scores (p = 0.56 and p = 0.76, respectively). The T2:ERG score was more common in subjects that were diagnosed with prostate cancer (p < 0.001), but showed no significant difference in clinically significant prostate cancer (p = 0.11). The PCA3 score was more common in subjects that were diagnosed with prostate cancer (p = 0.023) but showed no significant difference in clinically significant prostate cancer (p = 0.30). Additionally, only 8.23% (7/85) of the T2:ERG+ prostate cancer participants were positive for urine pks.
4 |. DISCUSSION
The prevalence of the pks gene that produces the genotoxin colibactin was 5.6% (n = 15/266) in the urine of asymptomatic men before a prostate biopsy within our population (i.e., validation) cohort. We conclude that colibactin-producing bacteria are not colonized in prostates of men with prostate cancer. If colibactin is a contributor to prostate cancer, it is likely an infection event then the bacteria resolves (i.e., a high-and-run event). Other DNA-damaging genotoxins such as cnf1 toxin and cdtB were rare (n = 7, 1.7%) and 10 (2.4%). In an infection study using rats, the combination of pks+ and cnf1 caused the most severe genotoxic effects on the bladder and kidneys.20 We identified 32% (n = 8/25) of the samples that were positive for more than one genotoxic gene. We also found that the cdtB gene was more commonly accompanied by a pks gene (71%, 5/7) rather than the cnf1 gene.
Colibactin is known to cause DNA alkylation and crosslinking, leading to DNA DSBs.21–23 Sfanos et al. found that in prostatectomy samples with known inflammation, the presence of colibactin-producing bacteria may be associated with a common translocation (T2:ERG) in which a double stranded DNA break is requisite.11 Even though colibactin (pks genes) was implicated in the commonT2:ERG gene fusion in prostate cancer, we found that urinary pks genes were not associated with prostate cancer in this asymptomatic cohort undergoing prostate biopsy for cancer diagnosis. Although the findings were negative, we cannot conclude that there is no association between colibactin-producing E. coli and prostate cancer. The insult may be a “hit and run” mechanism associated with a brief bout of infection or inflammation that causes DNA damage, then the bacteria are treated or dissipate over time. E. coli may clear the urine yet may leave behind a DNA damage signature, similar to what has been shown in colorectal cancer, but this possibility has yet to be confirmed.24
cnf1 catalyzes the deamination of Rho family proteins inducing multinucleation in cultured eukaryotic cells.25 cnf1 is commonly associated with uropathogenic E. coli. Colibactin (produced by pks genes) and cnf1 genes are both bacterial genotoxins associated with the induction of colon cancer.26 Fabbri et al. showed that CNF1 induces mesenchymal transition in intestinal cells as a possible cancer-inducing mechanism.27 cdt also causes DNA damage throught dual DNase and phosphatase activities to induce DNA DSBs, cell cycle arrest, and apoptosis.28 Chronic exposure to sublethal doses of CDT promotes genetic instability and a defective DNA damage response.29 Both of these bacterial genes were rare in asymptomatic men.
Limitations of this study include the retrospective nature; however, in a prevalence study, our target was to have a known population of men with known tissue diagnoses of prostate cancer. We also limited our detection to only three genotoxins, although they are the most common colibactin genes known to cause DNA DSBs. T2:Erg status was not available on the testing cohort. The test cohort had post-prostate exam samples, and the validation population cohort did not, which could account for minor differences between cohorts. The most significant limitation is that the samples were taken at one point in time before a prostate biopsy. Serial sampling as well as infection history (urinary tract infection or prostatitis) would have been pertinent but was not available in the datasets.
In conclusion, The prevalence of the pks gene was 5.6% (n = 15/266) and not associated with a prostate cancer diagnosis. The prevalence of any genotoxin-detection bacteria in the urine of asymptomatic men is low (8%). Future studies include testing the feces as a gut reservoir for these organisms to allow intermittent infections not captured in the urine. Additionally, the DNA damage caused by bacterial genotoxins in prostate cells is unlikely to be the same as in colon cells. Therefore, investigating a gene signature related to genotoxin exposure may be helpful to explore possible previous exposures as a cause of prostate cancer.
ACKNOWLEDGMENTS
The authors would like to thank Eric Oswald, Université de Toulouse, France, for sharing the pks+ Escherichia coli samples as known isolates to test polymerase chain reaction testing. John Lee was supported by the American Urological Association Summer Medical Student Fellowship sponsored by the Herbert Brendler, MD Research Fund.
Funding information
AUA Summer Medical Student Fellowships; Los Padres
Footnotes
CONFLICT OF INTEREST STATEMENT
The authors declare no conflict of interest.
DATA AVAILABILITY STATEMENT
Data are available upon request.
REFERENCES
- 1.Helmink BA, Khan MAW, Hermann A, Gopalakrishnan V, Wargo JA. The microbiome, cancer, and cancer therapy. Nat Med. 2019;25: 377–388. [DOI] [PubMed] [Google Scholar]
- 2.Bray F, Ferlay J, Soerjomataram I, Siegel RL, Torre LA, Jemal A. Global cancer statistics 2018: GLOBOCAN estimates of incidence and mortality worldwide for 36 cancers in 185 countries. CA Cancer J Clin. 2018;68:394–424. [DOI] [PubMed] [Google Scholar]
- 3.Gao Y, Wei L, Wang C, et al. Chronic prostatitis alters the prostatic microenvironment and accelerates preneoplastic lesions in C57BL/6 mice. Biol Res. 2019;52:30. [DOI] [PMC free article] [PubMed] [Google Scholar]
- 4.Puhr M, De Marzo A, Isaacs W, et al. Inflammation, microbiota, and prostate cancer. Eur Urol Focus. 2016;2:374–382. [DOI] [PubMed] [Google Scholar]
- 5.Correa P, Haenszel W, Cuello C, Tannenbaum S, Archer M. A model for gastric cancer epidemiology. Lancet. 1975;2:58–60. [DOI] [PubMed] [Google Scholar]
- 6.Dejea CM, Fathi P, Craig JM, et al. Patients with familial adenomatous polyposis harbor colonic biofilms containing tumorigenic bacteria. Science. 2018;359:592–597. [DOI] [PMC free article] [PubMed] [Google Scholar]
- 7.Johnson JR, Johnston B, Kuskowski MA, Nougayrede JP, Oswald E. Molecular epidemiology and phylogenetic distribution of the Escherichia coli pks genomic island. J Clin Microbiol. 2008;46:3906–3911. [DOI] [PMC free article] [PubMed] [Google Scholar]
- 8.Nougayrède JP, Homburg S, Taieb F, et al. Escherichia coli induces DNA double-strand breaks in eukaryotic cells. Science. 2006;313: 848–851. [DOI] [PubMed] [Google Scholar]
- 9.Baca SC, Prandi D, Lawrence MS, et al. Punctuated evolution of prostate cancer genomes. Cell. 2013;153:666–677. [DOI] [PMC free article] [PubMed] [Google Scholar]
- 10.Tomlins SA, Rhodes DR, Perner S, et al. Recurrent fusion of TMPRSS2 and ETS transcription factor genes in prostate cancer. Science. 2005;310:644–648. [DOI] [PubMed] [Google Scholar]
- 11.Shrestha E, Coulter JB, Guzman W, et al. Oncogenic gene fusions in nonneoplastic precursors as evidence that bacterial infection can initiate prostate cancer. Proc Natl Acad Sci USA. 2021;118:e2018976118. [DOI] [PMC free article] [PubMed] [Google Scholar]
- 12.Kadhum HJ, Finlay D, Rowe MT, WILSON IG, BALL HJ. Occurrence and characteristics of cytotoxic necrotizing factors, cytolethal distending toxins and other virulence factors in Escherichia coli from human blood and faecal samples. Epidemiol Infect. 2008;136: 752–760. [DOI] [PMC free article] [PubMed] [Google Scholar]
- 13.Kurnick SA, Mannion AJ, Feng Y, Madden CM, Chamberlain P, Fox JG. Genotoxic Escherichia coli strains encoding colibactin, cytolethal distending toxin, and cytotoxic necrotizing factor in laboratory rats. Comp Med. 2019;69:103–113. [DOI] [PMC free article] [PubMed] [Google Scholar]
- 14.Tóth I, Hérault F, Beutin L, Oswald E. Production of cytolethal distending toxins by pathogenic Escherichia coli strains isolated from human and animal sources: establishment of the existence of a new cdt variant (type IV). J Clin Microbiol. 2003;41:4285–4291. [DOI] [PMC free article] [PubMed] [Google Scholar]
- 15.Chapman TA, Wu XY, Barchia I, et al. Comparison of virulence gene profiles of Escherichia coli strains isolated from healthy and diarrheic swine. Appl Environ Microbiol. 2006;72:4782–4795. [DOI] [PMC free article] [PubMed] [Google Scholar]
- 16.Johnson JR, Johnston BD, Gordon DM. Rapid and specific detection of the Escherichia coli sequence type 648 complex within phylogroup F. J Clin Microbiol. 2017;55:1116–1121. [DOI] [PMC free article] [PubMed] [Google Scholar]
- 17.Groskopf J, Aubin SM, Deras IL, et al. APTIMA PCA3 molecular urine test: development of a method to aid in the diagnosis of prostate cancer. Clin Chem. 2006;52:1089–1095. [DOI] [PubMed] [Google Scholar]
- 18.Hernandez J, Gelfond J, Goros M, et al. The effect of 3-month finasteride challenge on biomarkers for predicting cancer outcome on biopsy: results of a randomized trial. PLoS One. 2018; 13:e0204823. [DOI] [PMC free article] [PubMed] [Google Scholar]
- 19.Tomlins SA, Aubin SMJ, Siddiqui J, et al. Urine TMPRSS2:ERG fusion transcript stratifies prostate cancer risk in men with elevated serum PSA. Sci Transl Med. 2011;3:94ra72. [DOI] [PMC free article] [PubMed] [Google Scholar]
- 20.Morgan RN, Saleh SE, Farrag HA, Aboulwafa MM. Prevalence and pathologic effects of colibactin and cytotoxic necrotizing factor-1 (Cnf 1) in Escherichia coli: experimental and bioinformatics analyses. Gut Pathog. 2019;11:22. [DOI] [PMC free article] [PubMed] [Google Scholar]
- 21.Xue M, Kim CS, Healy AR, et al. Structure elucidation of colibactin and its DNA cross-links. Science. 2019;365:eaax2685. [DOI] [PMC free article] [PubMed] [Google Scholar]
- 22.Wilson MR, Jiang Y, Villalta PW, et al. The human gut bacterial genotoxin colibactin alkylates DNA. Science. 2019;363:eaar7785. [DOI] [PMC free article] [PubMed] [Google Scholar]
- 23.Li ZR, Li J, Cai W, et al. Macrocyclic colibactin induces DNA double-strand breaks via copper-mediated oxidative cleavage. Nat Chem. 2019;11:880–889. [DOI] [PMC free article] [PubMed] [Google Scholar]
- 24.PleguezueloŝManzano C, Puschhof J, Rosendahl Huber A, et al. Mutational signature in colorectal cancer caused by genotoxic pks+ E. coli. Nature. 2020;580:269–273. [DOI] [PMC free article] [PubMed] [Google Scholar]
- 25.Caprioli A, Falbo V, Ruggeri FM, et al. Cytotoxic necrotizing factor production by hemolytic strains of Escherichia coli causing extra-intestinal infections. J Clin Microbiol. 1987;25:146–149. [DOI] [PMC free article] [PubMed] [Google Scholar]
- 26.Cougnoux A, Dalmasso G, Martinez R, et al. Bacterial genotoxin colibactin promotes colon tumour growth by inducing a senescence-associated secretory phenotype. Gut. 2014;63: 1932–1942. [DOI] [PubMed] [Google Scholar]
- 27.Fabbri A, Travaglione S, Rosadi F, et al. The Escherichia coli protein toxin cytotoxic necrotizing factor 1 induces epithelial mesenchymal transition. Cell Microbiol. 2020;22:e13138. [DOI] [PubMed] [Google Scholar]
- 28.Graillot V, Dormoy I, Dupuy J, et al. Genotoxicity of cytolethal distending toxin (CDT) on isogenic human colorectal cell lines: potential promoting effects for colorectal carcinogenesis. Front Cell Infect Microbiol. 2016;6:34. [DOI] [PMC free article] [PubMed] [Google Scholar]
- 29.Guidi R, Guerra L, Levi L, et al. Chronic exposure to the cytolethal distending toxins of gramn-egative bacteria promotes genomic instability and altered DNA damage response. Cell Microbiol. 2013;15:98–113. [DOI] [PMC free article] [PubMed] [Google Scholar]
Associated Data
This section collects any data citations, data availability statements, or supplementary materials included in this article.
Data Availability Statement
Data are available upon request.