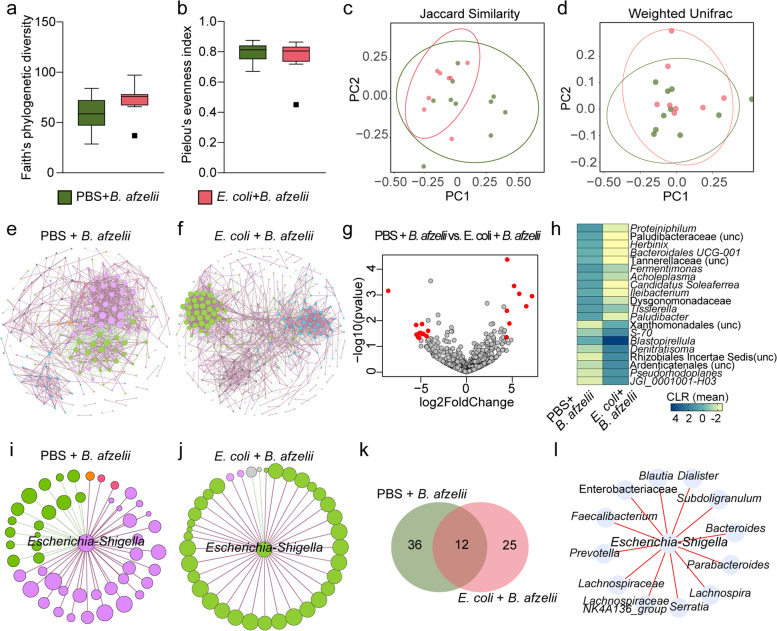
Fig. 4.
Impact of anti-microbiota vaccine and B. afzelii infection on tick microbiota diversity and community assembly. a Faith’s phylogenetic diversity and b Pielou’s evenness indexes were used to measure the richness and evenness, respectively, of microbiota of ticks fed on PBS + B. afzelii-infected and E. coli + B. afzelii mice (Kruskal–Wallis, p > 0.05). c, d Beta diversity of tick microbiota were analyzed with the c Jaccard and d Weighted Unifrac indexes to measure the similarity between the bacterial communities in the different experimental conditions (PERMANOVA, p > 0.05). e, f Bacterial co-occurrence networks were inferred from 16SrRNA sequences obtained from ticks fed on e mock-immunized and B. afzelii-infected mice and f E. coli-immunized and B. afzelii-infected mice. g Volcano plot showing the differential microbial abundance in tick microbiota from the PBS + B. afzelii-infected and E. coli + B. afzelii groups. Taxa with highest differential abundance between the two groups are presented in red. h Heatmap representing the abundance (expressed as CLR) of the top 20 taxa with the highest absolute value of log2foldchange. i, j Sub-networks of the local connectivity of Escherichia-Shigella were extracted from the i PBS + B. afzelii and j E. coli + B. afzelii co-occurrence networks. k Venn diagram showing the number of bacterial taxa that are common or unique among the neighbors directly connected to Escherichia-Shigella in the PBS + B. afzelii and E. coli + B. afzelii groups. l Direction of associations of common direct neighbor to the taxon Escherichia-Shigella between the PBS + B. afzelii and E. coli + B. afzelii groups. Red edges indicate positive co-occurrence associations in both groups. Rarified table of ASVs, used to measure the alpha and beta diversity, and taxonomic table were obtained from 16S rRNA gene sequences from ticks fed on mock-immunized and B. afzelii-infected mice (n = 10 individual larvae) and E. coli-immunized and B. afzelii-infected mice (n = 8 individual larvae). Nodes of co-occurrence networks and sub-networks represent bacterial taxa and edges stand for co-occurrence correlation (SparCC > 0.75 or < − 0.75). Node size is proportional to the eigenvector centrality value and node color is based on the modularity class. Thus, nodes with the same color belong to the same cluster. Positive and negative interactions between co-occurring bacteria are represented by the dark red and green edges, respectively. Only nodes with at least one connecting edge are displayed

