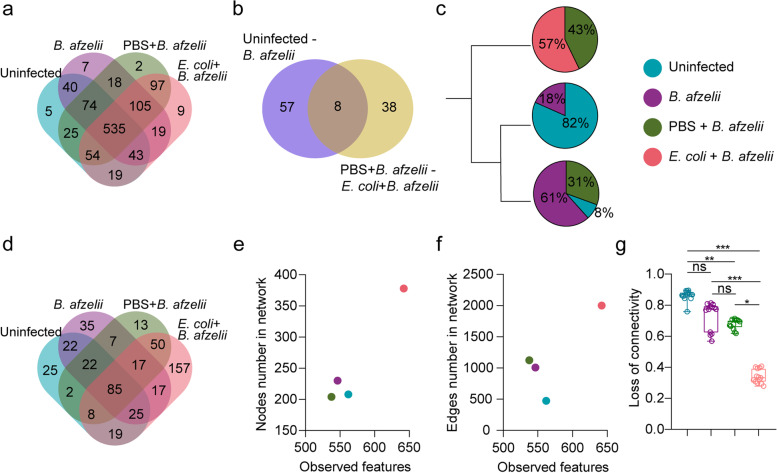
Fig. 8.
B. afzelii infection-refractory state of I. ricinus microbiota. Venn diagram showing a the common and unique bacterial taxa in tick microbiota for the uninfected, B. afzelii, PBS + B. afzelii, and E. coli + B. afzelii groups, b the shared and unique taxa whose abundance changed significantly between the uninfected-B. afzelii and PBS + B. afzelii-E. coli + B. afzelii comparisons. c Dendrogram of clustering for samples of tick microbiota from different experimental conditions. d Venn diagram showing the common and unique nodes found in microbial co-occurrence networks from all conditions. Scatter plot showing the mean of observed features versus number of e nodes and f edges found in the microbial co-occurrence networks and g Scatter plot showing the loss of connectivity when 5 to 7% of nodes are removed from the microbial co-occurrence network. Kruskal–Wallis test with Dunn’s multiple comparisons test, *p < 0.05, **p < 0.01, ***p < 0.001

