

Abstract
Neutral mutational drift is an important source of biological diversity that remains underexploited in fundamental studies of protein biophysics. This study uses a synthetic transcriptional circuit to study neutral drift in protein tyrosine phosphatase 1B (PTP1B), a mammalian signaling enzyme for which conformational changes are rate limiting. Kinetic assays of purified mutants indicate that catalytic activity, rather than thermodynamic stability, guides enrichment under neutral drift, where neutral or mildly activating mutations can mitigate the effects of deleterious ones. In general, mutants show a moderate activity‐stability tradeoff, an indication that minor improvements in the activity of PTP1B do not require concomitant losses in its stability. Multiplexed sequencing of large mutant pools suggests that substitutions at allosterically influential sites are purged under biological selection, which enriches for mutations located outside of the active site. Findings indicate that the positional dependence of neutral mutations within drifting populations can reveal the presence of allosteric networks and illustrate an approach for using synthetic transcriptional systems to explore these mutations in regulatory enzymes.
Keywords: neutral drift, protein allostery, protein evolutionary patterns, protein tyrosine phosphatases
1. INTRODUCTION
Neutral drift in proteins—gradual changes in amino acid sequence that preserve structure and function—is an important source of biological diversity (King, 1979). Mutations that are neutral with respect to a protein's primary biological function can yield differences in promiscuous activities that enhance its ability to adapt to new evolutionary pressures, an important source of ecological stability (Tenaillon & Matic, 2020; Khanal et al., 2015). In a quest to dissect the underlying mechanisms of molecular evolution, several research groups have used laboratory evolution to recreate neutral drift in proteins (Trudeau & Tawfik, 2019; Peisajovich & Tawfik, 2007; Akashi et al., 2012). In early work with TEM‐1 β‐lactamase, Tawfik and colleagues showed that neutral drift can enrich for back‐to‐consensus mutations that enhance thermodynamic stability and, by doing so, suppress the influence of deleterious mutations (Bershtein et al., 2008). In their study, diverse neutral ensembles containing both types of mutations—that is, suppressor mutations accompanying deleterious ones—exhibited a higher probability of acquiring new function than pools of random mutants. Arnold and colleagues observed a similar phenomenon in their analysis of P450 BM3, a cytochrome P450 from Bacillus megaterium (Bloom et al., 2007). In their study, mutants evolved neutrally with respect to activity on a single substrate exhibited activities that differed by as much as four‐fold on new substrates. These studies—and others since (Horns et al., 2019; Gupta & Tawfik, 2008; Kelley et al., 2016)—illustrate the enhanced adaptive potential of neutral mutants and suggest, by extension, that neutral drift can reveal functionally influential regions in proteins.
Protein tyrosine phosphatases (PTPs) are an important class of allosterically regulated enzymes for which mutational effects are challenging to predict. These enzymes use two primary catalytic loops to dephosphorylate tyrosine residues: The P‐loop binds phosphate moieties through a positively charged arginine, which enables nucleophilic attack by a nearby cysteine, and the WPD loop contains a general acid catalyst—an aspartate—that hydrolyzes the phosphoenzyme intermediate (Tautz & Critton, 2013; Barr et al., 2009; Jia et al., 1979). Two additional loops—the Q‐loop, which positions a water for phosphoenzyme hydrolysis, and the substrate‐binding loop, which selects for phosphotyrosine residues—play critical supporting roles. A comprehensive set of crystallographic studies, nuclear magnetic resonance (NMR) analyses, and molecular dynamics (MD) simulations of protein tyrosine phosphatase 1B (PTP1B) indicates that coordinated motion of its WPD loop and other active site loops controls the rate of catalysis and suggests that this motion is regulated by an allosteric network that extends to the C‐terminal α7 helix (Cui et al., 2019; Shen et al., 2022; Torgeson et al., 2020; Torgeson et al., 2022). This network allows mutations far from the active site to influence catalytic activity, though the nature of their influence—activating or inactivating—is often surprising (Hongdusit & Fox, 2021; Cui et al., 2017). Sequence‐based statistical analyses and supporting mutational studies suggest that allosteric regulation is a conserved—if compositionally distinct—feature of PTPs (Hjortness et al., 2018; Singh et al., 2021).
This study examines neutral drift in PTP1B, a well‐studied allosteric protein. Using a genetically encoded detection system for PTP1B activity, we selected neutral mutants from libraries generated under high mutational loads. These mutants allowed us to explore previously reported epistatic effects, notably the incidence of suppressor mutations, and to evaluate the positional dependence of mutational frequencies within a drifting population. Findings suggest that the catalytic activity of PTP1B guides enrichment under neutral mutational drift and show how allosteric networks can bias the enrichment of mutations across the protein.
2. RESULTS
2.1. A synthetic transcriptional system facilitates the identification of neutral mutants
We began by developing a dual selection system to find neutral mutants within large (i.e., 106 [Akashi et al., 2012]) mutant libraries. PTP1B is an important regulator of receptor tyrosine kinases in mammalian cells (Yip et al., 2010; Lessard et al., 2010), but it has no natural counterpart in Escherichia coli (E. coli). In prior work, we developed a bacterial two‐hybrid (B2H) system that links the inhibition of PTP1B from Homo sapiens (H. sapiens) to the expression of a gene for antibiotic resistance in E. coli (Sarkar et al., 2021). Our original study details the development of this system and describes each of its components, including the promoters and ribosome binding sites. In brief, the B2H system relies on the phosphorylation‐mediated dimerization of two protein fusions (Figure 1a): (i) a Src homology 2 (SH2) domain fused to the cI repressor, and (ii) a kinase substrate domain (MidT) fused to the omega subunit of RNA polymerase (RpoZ). In this system, Src‐mediated phosphorylation of the substrate domain enhances its affinity for the SH2 domain, and the resulting substrate‐SH2 complex activates transcription of a gene of interest (GOI); PTP1B‐mediated dephosphorylation of the substrate prevents activation. All B2H genes are constitutively expressed except the GOI, where transcriptional activation requires the substrate‐SH2 interaction. To permit positive and negative selection of active PTP1B variants—and reduce false positives—we modified the B2H system by adding two GOIs arranged in tandem: SacB, which confers sensitivity to sucrose, and SpecR, which confers resistance to spectinomycin (Figure 1a). In the final two‐plasmid design, active PTP1B enhanced growth in the presence of sucrose but reduced spectinomycin resistance (Figures 1b, c and S1).
FIGURE 1.
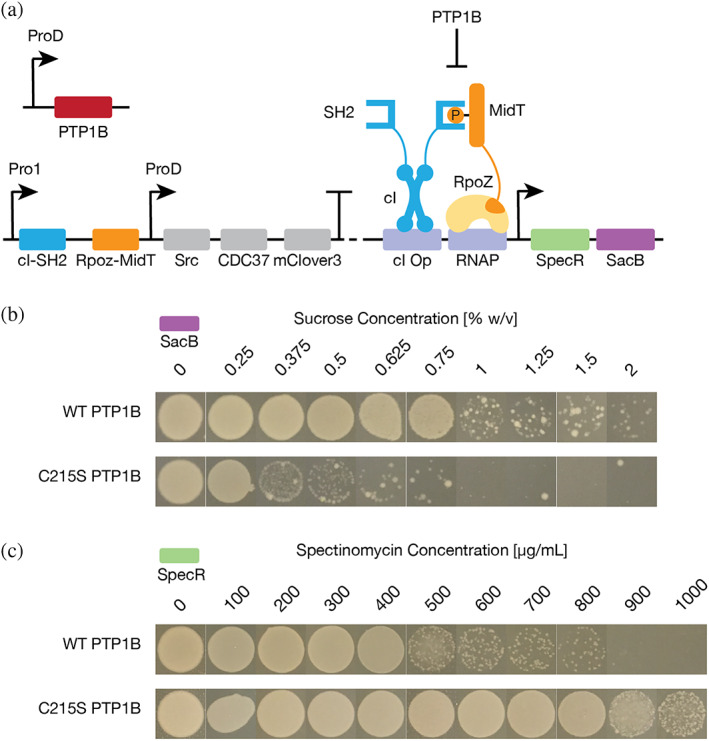
A dual selection system enables detection of intracellular PTP1B activity. (a) A bacterial two‐hybrid (B2H) system that links the inactivation of PTP1B to the transcriptional activation of genes that confer spectinomycin resistance (SpecR) and sucrose sensitivity (SacB). Major components include (i) a kinase substrate (MidT) fused to the omega subunit of RNA polymerase (RpoZ), (ii) a Src Homology 2 (SH2) domain fused to the 434 phage cI repressor (cI), (iii) an operator for 434cI (cI op), (iv) a binding site for RNA polymerase (RNAP), and (v) the remainder of RNA polymerase (yellow) (Sarkar et al., 2021). PTP1B is encoded by a separate plasmid. Src and PTP1B promote and inhibit SH2‐MidT binding via phosphorylation and dephosphorylation, respectively. (b, c) Images show the growth of B2H‐encoded E. coli cells on agar plates with different concentrations of (b) sucrose or (c) spectinomycin. Active PTP1B, which prevents transcriptional activation, confers (b) resistance to sucrose and (c) sensitivity to spectinomycin. Inactive PTP1B confers (b) sensitivity to sucrose and (c) resistance to spectinomycin.
We used our modified B2H system to find neutral mutants in a library of PTP1B variants generated under a high mutational load. To begin, we used error‐prone PCR (epPCR) to prepare a pool of mutants—hereafter, the R1 library—with an average mutation rate of 3.2 mutations per gene (~3.3 × 10⁻³ mutations per base; Table S7), which is as much as one million‐fold higher than the natural mutation rate of most contemporary organisms (~10−9 to 10−8 mutations per base per generation) (Lynch, 2010). We examined this library in two steps (Figure 2a): First, we selected mutant‐containing colonies that grew at sucrose concentrations matching or slightly exceeding those tolerated by wild‐type PTP1B. As expected, selected mutants had few mutations (1.5 mutations per gene; Table S7), a pruning consistent with the enrichment of active variants. Next, we re‐examined each hit by drop‐plating E. coli cells on solid media with varying concentrations of sucrose and spectinomycin (Figure S2) and selected hits that preserved or enhanced sucrose tolerance and spectinomycin sensitivity (Figures 2b and S3). To our satisfaction, selected variants, once purified, exhibited catalytic activities (i.e., k cat/K M, or catalytic efficiency) on p‐nitrophenyl phosphate (pNPP, a model substrate) that differed from wild‐type by two‐fold or less (Figure 2c). Changes in activity, when present, were isolated to k cat, rather than K M—an effect suggestive of shifts in protein dynamics, which control catalytic rates in PTPs (Torgeson et al., 2022). The intracellular activity of PTP1B is a function of both catalytic activity and enzyme concentration. To examine variability in protein abundance, we used quantitative proteomics to compare the intracellular concentrations of wild‐type PTP1B and two neutral mutants that conferred slightly different sensitivities to spectinomycin (Figure S13). Intracellular concentrations differed by less than 20%. This similarity, alongside our kinetic measurements, supports the use of our approach to find mutants with similar kinetic properties.
FIGURE 2.
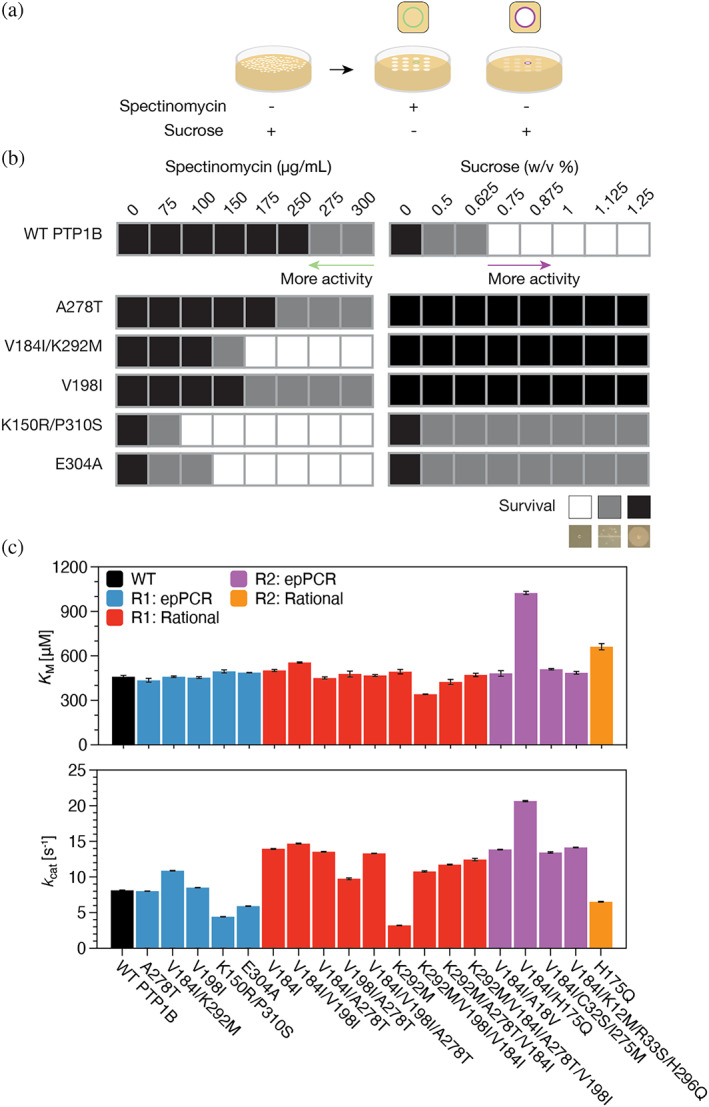
Error‐prone PCR yields neutral mutants of PTP1B. (a) We examined epPCR libraries for active PTP1B in four steps: (i) We plated cells containing the B2H system and library plasmids on plates with 0%–1% sucrose. (ii) We selected colonies that grew at sucrose concentrations matching or slightly exceeding those tolerated by wild‐type PTP1B (0.375%–1.0% and 0.375%–0.75% sucrose for the R1 and R2 libraries, respectively) and used them to inoculate liquid cultures. (iii) We dropped liquid cultures onto plates with either 0%–1.25% sucrose or 0–300 μg/mL spectinomycin (image right of arrow). (iv) We selected hits that preserved or enhanced sucrose tolerance and spectinomycin sensitivity. (b) The growth of hits from our selection on solid media with different concentrations of spectinomycin (left) or sucrose (right). (c) Kinetic analysis of purified mutants on p‐nitrophenyl phosphate (pNPP). Despite minor changes in k cat—and, for V184I/H175Q, K M —selected mutations changed PTP1B activity (k cat/K M ) by two‐fold or less (Figure S6). R1 denotes the initial epPCR library; R2, the epPCR library of V184I variants. The label “rational” denotes mutants generated via site‐directed mutagenesis. Data represent the mean and standard error for n ≥ 3 technical replicates.
As we note in our introduction, mutations are never truly neutral, as their failure to alter one biochemical property (i.e., neutrality based on a pre‐defined significance threshold) rarely translates to all others (Daudé et al., 2019). Neutrality must be defined: In this study, we define neutral mutations to be those that change PTP1B activity (k cat/K M ) on pNPP by two‐fold or less. This threshold for neutrality is consistent with previous efforts to evolve enzymes, where a 10‐fold change in activity on a target substrate typically defines the lower bound of significance (Bloom & Arnold, 2009); indeed, changes several orders of magnitude higher are often achieved (Cobb et al., 2013; Yang et al., 2016). Of course, by searching for mutants that preserve or enhance biosensor activation in E. coli cells—a weak positive selection for E. coli growth—we might logically find variants that are more active than wild‐type PTP1B; our analysis of initial hits, however, suggests that we do not. These mutants preserve catalytic activity, an indication that our high‐throughput selection method is well suited for studying neutral drift in PTP1B at the molecular level.
In total, we purified and confirmed the neutrality of ~5% of mutants examined with drop plating (step 2 of our selection). If we assume that the hits identified in colony‐based selection (step 1) have the same frequency of neutral mutations—a conservative assumption, given the small number of variants that we chose to purify—we estimate that a minimum of ~0.4% of the plated R1 mutants are neutral (Table S8). The plated library, in turn, comprises only ~0.06% of the full mutant library (we plated a subset of transformants for colony picking), so the confirmed mutants represent about half (~44%) of the neutral mutants present in the plated R1 library and a very small subset (0.03%) of those present in the full library.
2.2. Activating and neutral mutations can mitigate the effects of deleterious ones
The V184I/K292M mutant has two distal substitutions: V184I, which sits in the WPD loop, and K292M, which is in the ⍺7 helix located ~18 Å away (Figure 3a). We used this double mutant to investigate the additivity of mutational effects. As single mutants, V184I enhanced catalytic activity slightly, while K292M reduced it (Figure 2c). The V184 mutation appears to mitigate the disruptive effect of K292M in the double mutant. Neutral mutations exhibited a similar additivity. For example, V198I and A278T sustained their neutral effects when combined in a double mutant or when added to other mutants, such as V184I or V184I/K292M (Figure 2c).
FIGURE 3.
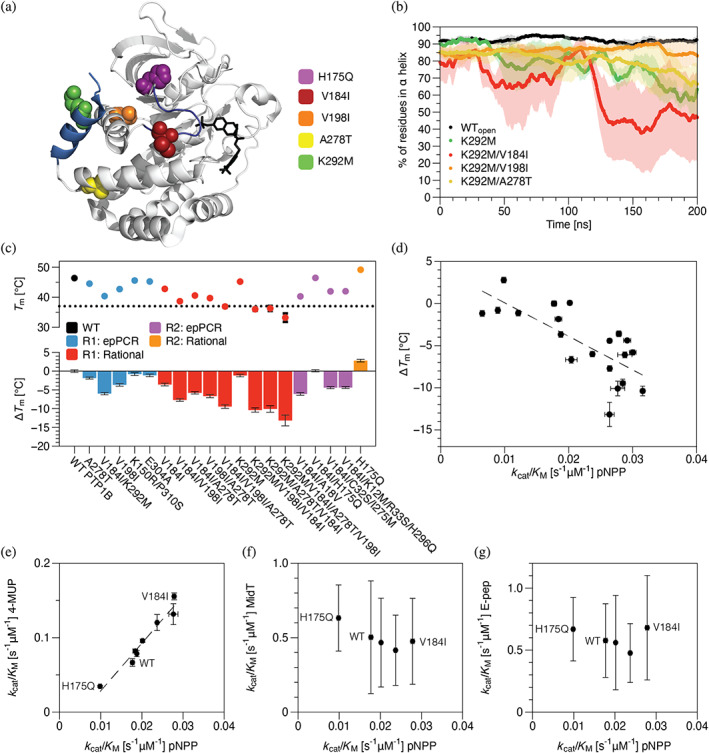
Mutations identified in neutral drift tend to reduce thermodynamic stability but exhibit substrate‐specific effects on activity. (a) A crystal structure of PTP1B (PDB entry 2f71) shows the locations of a subset of neutral (V198I and A278T), activating (V184I), or inactivating (K292M and H175Q) mutations identified in neutral drift experiments (PDB entry 2a5j). Highlights: competitive inhibitor (black), ⍺7 helix (285–298, light blue), and WPD loop (178–185, dark blue). (b) The percent of residues in the core of the ⍺7 helix (287–295) that exhibit ⍺‐helical conformations in each uncorrelated trajectory frame of MD trajectories. Mutant K292M accelerates ⍺7 helix disordering, and V198I suppresses this disruptive effect. (c) We used differential scanning calorimetry (DSF) to measure changes in the melting temperature of PTP1B: ΔT m = T m‐mut − T m‐WT. Most mutations reduced the melting temperature, an effect that was largely additive when mutations were combined. (d) Mutation‐derived shifts in melting temperature and catalytic activity are moderately correlated (r 2 = 0.55). (e) The activities of mutants on two model substrates—pNPP and 4‐methylumbelliferyl phosphate (4‐MUP)—are strongly correlated and differ by two‐ to four‐fold, depending on substrate; all have similar activities on (f) MidT and (g) E‐Pep, two phosphopeptides. MidT = EPQpYEEIPIYL, and E‐Pep = DADEpYLIPQQG. In b‐g, data depict the mean and standard error for n ≥ 3 technical replicates (MD and kinetic data) or mean and standard deviation for n ≥ 12 technical replicates (T m).
The location of K292M suggests that it influences activity through an allosteric network. Prior biophysical analyses indicate that destabilization of the ⍺7 helix—a structural perturbation achievable through mutations (Hongdusit & Fox, 2021; Montalibet et al., 2006), truncations (Wiesmann et al., 2004; Olmez & Alakent, 2011), or protein switches (Hongdusit et al., 2020)—reduces catalytic activity by disrupting a network of hydrogen bonds that stabilizes the closed conformation of the WPD loop (Cui et al., 2019). We used MD simulations to investigate the impact of K292M on ⍺7 stability. Intriguingly, K292M accelerated ⍺7 disordering, relative to the wild‐type enzyme; V184I and A278T did not prevent this dissordering, but V198I appeared to suppress it (Figure 3b). These results suggest two mechanisms of mitigation: (i) compensation, where activating mutations like V184I counter the influence of inactivating mutations through simple additivity, and (ii) suppression, where apparently neutral mutations like V198I stabilize the protein to disruptive structural changes, such as accelerated ⍺7 disordering by K292M.
We explored the influence of V184I on neutral drift by subjecting this mutant to another round of mutagenesis. As before, we used epPCR to prepare a library—hereafter, the R2 library—with a high mutation rate, which decreased under sucrose selection (5.0–2.0 mutations per gene; Figures S4–S5 and Table S7). Once again, the selected variants had activities that were within 50% of wild type (Figure 2c). The V184I/H175Q mutant is particularly interesting because it exhibited both an increased k cat and K M; that is, the combined mutations enhanced activity and altered substrate binding. By contrast, H175Q alone reduced catalytic activity—an influence consistent with its position in the WPD loop. Intriguingly, eight human non‐receptor PTPs (NRPTPs) have a Q at the H175 position (Appendix S1). These findings suggest that V184I can suppress the disruptive effect of an amino acid substitution that arises naturally in other members of the PTP family—one that may contribute to differences in their substrate specificities.
2.3. Activity, not thermodynamic stability, guides PTP1B enrichment under neutral drift
Prior work suggests that stabilizing mutations can suppress—and, thus, permit—destabilizing mutations sampled under neutral drift (Bershtein et al., 2008; Bloom et al., 2005; Besenmatter et al., 2007; Bloom et al., 2006). We used differential scanning fluorimetry (DSF) to evaluate the influence of mutations on the melting temperature (T m) of PTP1B. Surprisingly, most mutations reduced T m, an effect that was largely additive (Figures 3c and S17). For example, V184I and K292M each reduced T m, and their combination reduced it further. By contrast, H175Q increased T m, and V184I compensated for this effect to leave the T m of the double mutant unchanged. Of course, the high intracellular concentration of PTP1B afforded by our B2H system, which is encoded by multi‐copy plasmids, could buffer out losses in protein stability, but the same argument also applies to catalytic activity—that is, overexpression does not favor one property over the other. The effects of mutations on T m indicate that activity, rather than thermodynamic stability, guides mutational enrichment under neutral drift.
The influence of neutral mutations on T m is consistent with the theory of threshold stability, a minimum level of stability required to maintain biological function (Socha & Tokuriki, 2013). Under this theory, the margin of stability from a threshold level can indicate a protein's mutational tolerance and, thus, its evolvability under certain laboratory conditions. PTP1B has a melting temperature (T m) of 46.4°C, and most neutral mutants are less stable, but appear to exhibit a minimum T m of 39.3°C, which sits just above the selection temperature of 37°C (the optimal growth temperature of E. coli). Our results indicate that wild‐type PTP1B has a stability buffer, which is eroded by mutations to a threshold level of ~39°C, below which mutants are purged under our selection. In the absence of a stability buffer, we would not expect to find mutants with a reduced T m.
We note that our selection temperature—37°C, the optimal growth temperature of E. coli—was higher than the temperature used to measure kinetic parameters—22°C, a convenient laboratory temperature. An analysis of several mutants at 37°C, however, shows that their relative rates and catalytic efficiencies (k cat/K M) are unchanged at this higher temperature (Figure S14). This insensitivity, which suggests that neutral mutants have similar activation energies (Arcus et al., 2016), indicates that the difference in temperatures between our selection and kinetic experiments does not alter the conclusions of our analysis.
A common biophysical perspective suggests that the evolution of mesophilic enzymes from thermophilic precursors required protein stability to be sacrificed to support the conformational flexibility necessary for catalysis at low temperatures. Although our neutral mutants show very small differences in activity, relative to wild type, they have a broader range of activities when compared to one another—a kind of “wobble” around the median wild‐type activity. We used them to evaluate the stability‐activity tradeoff in PTP1B. Our measurements indicate that shifts in melting temperature and catalytic activity are moderately correlated (r 2 = 0.55; Figure 3d). Alternatively stated, more active mutants tended to have lower T ms, but for a given activity, the breadth of T ms was quite large (e.g., > 8°C for k cat/K M ~ 0.028 s−1 μM−1). This trend suggests that PTP1B can achieve minor improvements in activity without major losses in thermodynamic stability. We cannot comment on larger changes activity (>10‐fold), as such mutants were not identified in this study.
Motivated by prior work on the contribution of neutral drift to new enzyme function, we compared the activities of mutants on different substrates. Notably, our B2H system uses MidT, a peptide substrate, but we assayed selected mutants on pNPP, a colorimetric substrate that enabled rapid kinetic measurements for a large number of mutants. For our more focused analysis of substrate specificity, we compared a handful of mutants on two model substrates, pNPP and 4‐methylumbelliferyl phosphate (4MUP), and two peptide substrates, MidT and E‐Pep (Figures S7–S8, S10–S12, S15). Interestingly, mutant activities on pNPP and 4MUP were tightly correlated (Figure 3e, r 2 = 0.95), but differences in activities on MidT and E‐Pep were indistinguishable (α = 0.05 for 2 sample t‐test assuming equal variances; Figure 3f, g). For example, V184I and H175Q were neutral with respect to both peptides but exhibited activities that differed by more than four‐fold on 4MUP (although error in the kinetic parameters for the peptide substrates is large, it is compatible with the detection of this large difference in activities).
2.4. Next‐generation sequencing shows patterns in mutational frequency
We identified our first set of neutral mutants by picking colonies, a laborious process in which we selected mutants for further characterization by drop‐plating on solid media. We speculated that next‐generation sequencing (NGS) of large mutant pools might allow us to find neutral mutants more easily by revealing which ones were enriched in the presence of sucrose. To explore this idea, we transformed pools of R1 and R2 mutants (~104 variants each) on solid media and estimated the log2‐fold change in mutant abundance caused by growth on sucrose. From a combination of the two libraries, we characterized 12 mutants (Figure 4a): 10 enriched mutants that contained different numbers of mutations, one enriched truncation variant (the result of a frame shift mutation), and one truncation variant containing only residues 1–298, a residue beyond which truncation variants were more likely to occur (Tables S12–S15). To our satisfaction, 10 of these variants were active, and all active variants had catalytic activities similar to the parent enzyme (69%–141% k cat/K M for 4 mutants and 2 truncations compared to WT, 65%–125% k cat/K M for 4 mutants compared to V184I)—a result consistent with neutral drift. As before, most mutants reduced melting temperature, and this effect was largely additive (Figure 4a).
FIGURE 4.
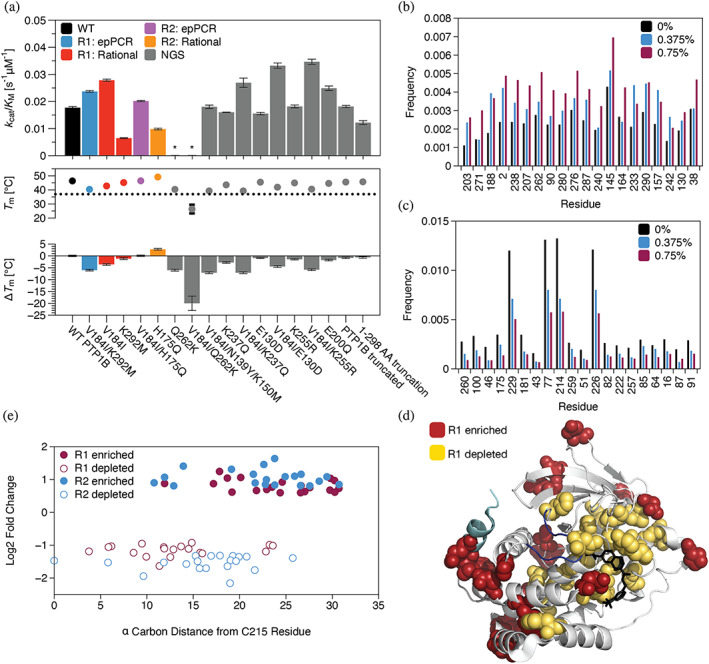
Catalytically influential residues outside of the active site resist mutations under neutral drift. (a) Analysis of mutants identified in NGS (gray). Top: The catalytic efficiencies (k cat/K M) of selected variants on pNPP matched or slightly exceed that of the wild type. Bottom: Most mutations reduced melting temperature (T m), an effect that was largely additive when mutations were combined. Data depict the mean and standard error for n ≥ 3 technical replicates (kinetic data) or mean and standard deviation for n ≥ 12 technical replicates (T m). (b, c) Analysis of enrichment in the R1 library (we used 0.375% and 0.75% sucrose plates for both R1 and R2 libraries). These plots show the normalized frequency of mutations at sites where mutations were (b) most enriched or (c) most depleted by selection on 0.75% sucrose. Bars show mutation frequencies at 0, 0.375, and 0.75% sucrose. (d) A crystal structure of PTP1B shows the locations of the sites where mutations were most enriched (red) or most depleted (yellow; PDB entry 2f71). Highlights: competitive inhibitor (black), ⍺7 helix (light blue), and WPD loop (dark blue). (e) With the exception of Q262, the most mutationally enriched sites in the R1 library were located outside of the active site (i.e., ≥ 15 Å from the C⍺ carbon of the catalytic cysteine), while the most mutationally depleted sites extended from the active site to almost 25 Å away. Trends in the R2 library were similar with more enriched mutations close to the active site.
Surprisingly, two of the newly enriched mutants were inactive. They shared the Q262K mutation, a substitution of a catalytic residue in the Q‐loop. At first glance, this mutation seems perplexing, but inactivating mutations in the catalytic residues of PTPs can disrupt activity while sustaining or enhancing their binding affinity; these mutants are referred to as “substrate‐trapping” mutants (Blanchetot et al., 2005). We speculated that Q262K might function similarly. To test this hypothesis, we used a secondary plasmid to titrate PTP1B expression alongside a luminescent B2H system (Figure 5a). Intriguingly, titration of wild‐type and Q262K variants reduced luminescence, while C215S, an inactive mutant that does not strongly trap substrates (Zhang et al., 2000; Xie et al., 2002), did not (Figure 5b). This result suggests that our B2H system can enrich for inactive mutants that preserve substrate binding, rather than substrate dephosphorylation, though we expect these mutants to be rare.
FIGURE 5.
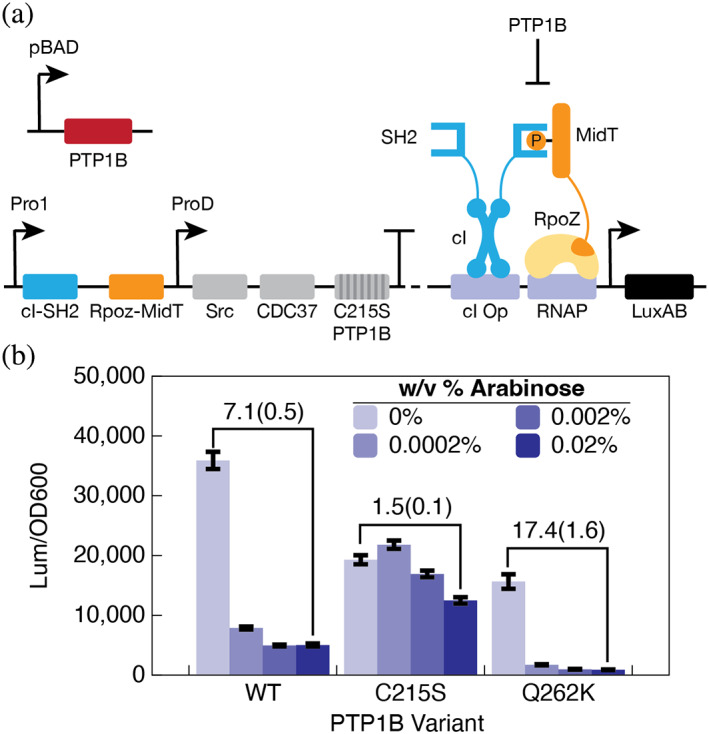
Q262K is a substrate‐trapping mutant. (a) A luminescent B2H system that enables arabinose‐inducible titration of PTP1B from a second plasmid. The base B2H has an inactive variant of PTP1B (C215S) that does not interfere with SH2‐MidT binding. (b) Titration of wild‐type and Q262K variants reduces the luminescent signal; C215S has a negligible effect. The depletion of luminescence by Q262K, a mutation that inactivates PTP1B, suggests that it binds and sequesters MidT.
If we assume that most enriched mutations are neutral (unlike Q262K), we can use NGS results to determine where mutations are most likely to occur under neutral drift. To carry out this analysis, we estimated the log2‐fold change in mutational frequency at different sites, starting with the R1 library. Of the 20 sites with the greatest mutational enrichment, 19 were located outside of the active site (i.e., ≥15 Å from the C⍺ carbon of the catalytic cysteine) with Q262 as the single exception (Figure 4b, d, e). The 20 sites with the greatest mutational depletion, in turn, extended evenly from the active site to ~25 Å away (Figure 4c–e). This difference in mean active site distance between mutationally enriched and depleted residues is statistically significant (p < 0.01, Figure S21). Notably, trends in mutational frequency were similar on both 0.375% and 0.75% sucrose but exhibited less noise at the higher sucrose concentration (e.g., the most mutationally enriched or depleted sites at 0.75% sucrose followed similar trends on 0.375%, while large frequency changes at 0.375% were not necessarily preserved at 0.75%; Figures S19–S20), justifying a focus on this condition. Intriguingly, the depleted sites are more highly conserved in NRPTPs (i.e., 61% have the same amino acid as PTP1B) than the sites that tolerated mutations (i.e., 26%; Tables S17–S18), an attribute suggestive of their structural or functional importance.
Are mutations more likely to occur within the allosteric network or outside of it? In an early study, we used statistical coupling analysis to identify two sectors of coevolving residues that mediate communication with the active site in PTP1B and, likely, other PTPs (Hjortness et al., 2018). Strikingly, this network includes just 10% of the most mutationally enriched sites but 55% of the mutationally depleted sites; overlap with the sites depleted in mutations suggests that the allosteric network resists mutations under neutral drift. When we repeated our analysis with the R2 library, we observed similar trends, though the enriched sites included an additional allosteric residue (i.e., 15% in R2 vs. 10% in R1) and the depleted sites included fewer (i.e., 40% in R2 vs. 55% in R1). This result suggests that V184I—and, perhaps, other activating mutations—can suppress the deleterious effects of mutations within the allosteric network.
3. DISCUSSION
Neutral drift is responsible for most of the biological diversity on this planet, but it remains challenging to recreate in the laboratory—especially for mammalian enzymes with no bacterial counterpart. In this study, we used a B2H system to examine neutral drift in PTP1B, an important signaling enzyme. Kinetic measurements show that activating mutations can mitigate the effects of deleterious ones and, when combined with biophysical measurements, indicate that enzyme activity, rather than thermodynamic stability, guides enrichment of PTP1B mutants under “neutral” evolutionary constraints. This result contrasts with a prior study of TEM‐1, where neutral drift enriched for stabilizing mutations (Bershtein et al., 2008), and may reflect the importance of protein motion in PTP1B, where conformational changes are rate limiting (Torgeson et al., 2020; Torgeson et al., 2022). Nonetheless, mutants from this study showed a moderate activity‐stability tradeoff, an indication that minor improvements in activity do not require losses in stability. This finding is consistent with a prior analysis of adenylate kinases, which uncovered variants that were active at low temperatures yet still thermostable—a contradiction of the activity‐stability tradeoff, at least as a rigid rule (Nguyen et al., 2017). We must note, however, that this study focuses on neutral mutants with small differences in activity, and it carries out selection at a temperature permissive of stability losses. Future attempts to analyze activity‐stability tradeoffs over a broader activity range would benefit from a strong positive selection—for example, a growth‐coupled assay designed to find mutants with large (>10‐fold) improvements in activity on pNPP—carried out at a high temperature that eliminates the stability buffer of this enzyme.
Our synthetic transcriptional system enabled the collection of large datasets compatible with NGS analyses. Most enriched mutants identified with NGS preserved or enhanced catalytic activity with the notable exception of Q262K, a likely substrate‐trapping mutant. Truncations based on common frameshift mutations illustrate another class of functional variants identifiable with our selection assay. Most intriguingly, NGS results indicate that mutations at allosterically influential sites are purged under biological selection but suggest that activating mutations like V184I, which mitigated the disruptive effects of K292M and H175Q, can attenuate this purging. These findings suggest that allosterically influential sites might coevolve with activating mutations within drifting populations. Broadly, this study illustrates how synthetic transcriptional systems can provide a powerful tool for carrying out biophysically informative drift experiments in the laboratory.
4. MATERIALS AND METHODS
4.1. Materials
We purchased yeast extract, sodium chloride, LB broth (Miller), potassium phosphate monobasic, potassium phosphate dibasic, tris base, tetracycline hydrochloride, magnesium sulfate heptahydrate, imidazole, 4‐(2‐hydroxyethyl)‐1‐piperazineethanesulfonic acid (HEPES), and pre‐made 1 M HEPES buffer (pH 7.3) from Fisher; spectinomycin dihydrochloride pentahydrate, Triton X‐100, tris(2‐carboxyethyl)phosphine (TCEP), phenylmethylsulfonyl fluoride (PMSF), malachite green assay kit, dimethyl sulfoxide (DMSO), bovine serum albumin (BSA), p‐nitrophenyl phosphate (pNPP), and 4‐methylumbelliferyl phosphate (4‐MUP) from MilliporeSigma; Phusion and DNase I from New England Biolabs; agar and M9 salts from Becton Dickinson; glucose and Nalpha‐4‐Tosyl‐L‐arginine methyl ester hydrochloride (TAME) from Acros Organics; tryptone from Research Products International; 5x SYPRO Orange Dye from Life Technologies; glycerol from Macron; isopropyl β‐d‐1‐thiogalactopyranoside (IPTG) from ChemCruz; EGFR‐derived phosphopeptide (E‐Pep) from Santa Cruz Biotechnology; kanamycin sulfate from IBI Scientific; carbenicillin from Gemini Bioproducts; lysozyme from Alfa Aesar; 10 kDa spin columns from Sartorius; 4%–20% Criterion TGX stain‐free protein gels from Bio‐Rad; HisTrap and HiTrap columns from GE Healthcare; and a Gene Morph II random mutagenesis kit from Agilent. We purchased 5.5 mg of MidT phosphopeptide (EPQpYEEIPIYL) at >98% purity from Peptide 2.0.
4.2. E. coli strains
We used chemically competent NEB Turbo (#C2984H) cells for cloning, Fisher One Shot Top10 electrocompetent cells (#C404003) and Lucigen E. cloni 10G (#600521) electrocompetent cells for library preparation, electrocompetent and chemically competent S1030 cells (Addgene #105063) for drop‐based plating and luminescence assays, and NEB BL21(DE3) cells (#C2527H) for protein overexpression. When necessary, we generated chemically competent and electrocompetent cells with standard protocols (RbCl and washing) (Sarkar et al., 2021).
4.3. Cloning and molecular biology
We constructed plasmids with Gibson assembly (50°C for 1 h) or restriction cloning. Table S1 lists gene sources; Table S2 describes the composition of each plasmid; Table S3 lists restriction enzymes; Table S4 lists primers used for plasmid assembly and NGS sequencing; and Table S5 lists primers used for site‐directed mutagenesis.
4.4. Error prone PCR
We prepared a library of PTP1B mutants by using a GeneMorph II error prone PCR (epPCR) kit from Agilent (#200550). To begin, we targeted a high mutation frequency by adding 10 ng of template. Table S5 provides the cycle conditions. To prepare our epPCR library, we used Gibson assembly to insert PTP1B mutants into a pMM532 plasmid (Addgene #112529). We dialyzed the assembled plasmids for at least 2 h on dialysis membranes before transforming highly competent (>1010) One Shot Top10 electrocompetent cells (Thermo Fisher # C404052). We plated the transformed cells onto agar plates (5 g/L yeast extract, 10 g/L tryptone, 10 g/L sodium chloride, and 20 g/L agar, 50 ug/mL carbenicillin) and included dilution plates to estimate the library size. We kept the plates in a 37°C incubator for 18 h. Finally, we covered them in lysogeny broth, scraped colonies with a glass pipette, and mini‐prepped the final plasmid pool (Omega).
4.5. Drop‐based assay
We carried out our initial examination of error‐prone PCR libraries by using drop‐based plating. In brief, (i) we dialyzed library and control plasmids (PTP1B and PTP1BC215S) on dialysis membranes for 2 h. (ii) We electroporated 800 ng of DNA into B2H‐encoded s1030 cells and recovered the transformed cells for 1 h in a 37°C shaker. (iii) We plated the cells onto LB agar plates (5 g/L yeast extract, 10 g/L tryptone, 10 g/L sodium chloride, 20 g/L agar with antibiotics for plasmid maintenance) with different concentrations of sucrose (0%, 0.25%, 0.375%, 0.5%, 0.625%, 0.75%, 0.875%, and 1% sucrose), and incubated the plates at 37°C for 22 h. (iv) We used 3 colonies from each 0% sucrose control plate and many colonies from the library plates (102 for the first library and 96 for the second library) to inoculate 1 mL of liquid TB in 96 well‐blocks, and we incubated the well blocks in an incubator shaker (37°C at 225 rpm) overnight. Here, we picked colonies from 0.375% to 1% sucrose plates for the R1 library and 0.375%–0.75% sucrose plates for the R2 library. (v) We diluted each overnight culture to an OD600 of 0.05 and added 3‐uL drops onto LB agar plates with different concentrations of sucrose or spectinomycin (0%–1.25% sucrose and 0–300 μg/mL spectinomycin for the first library, 0%–5% sucrose and 0–200 μg/mL spectinomycin for the second library). (vi) We incubated the plates in a 37°C incubator for 22–22.5 h. (vii) To identify mutants that were at least as active as the wild‐type enzyme, we looked for variants that (a) died at similar or lower concentrations of spectinomycin and (b) survived at similar or higher concentrations of sucrose (relative to wild‐type for the R1 library and V184I for the R2 library; Figures SS–S5). (viii) We sequenced a subset of mutants. Table S7 describes mutation statistics pulled from our drop‐based assay before and after each selection step.
4.6. Quantitative proteomics
We used quantitative proteomics to compare intracellular protein concentrations of select cell cultures. We grew cells for 16 hours, centrifuged them (6000 g, 10 min), and stored pellets at −20°C. To prepare peptides, we used reduction, alkylation, and digestion steps followed by peptide enrichment and cleanup. We resuspended dried samples in 3% (v/v) acetonitrile and 0.1% (v/v) trifluoroacetic acid in water, injected 1 μg of tryptic peptides onto a reversed‐phase C18 column (1.7 um, 130 A°, 75 mm × 250 mm M‐class column; Waters) with an Ultimate 3000 UPLC (Thermo Scientific), and eluted with 2%–20% acetonitrile (300 nL/min for 100 min) into a Q‐Exactive HF‐X mass spectrometer (Thermo Scientific). We used label‐free quantitation (LFQ) intensities to compare protein concentrations across samples (a similar value to the iBAQ intensity with an extra normalization to exclude outliers (Cox et al., 2014).
4.7. Next‐generation sequencing
We used next‐generation sequencing (NGS) to carry out a large‐scale analysis of enrichment in the R1 and R2 library. To begin, we reduced the size of the R1 and R2 libraries to ~104 variants each. This population size permits a sequencing depth sufficient for unambiguous detection of point mutations with Hi‐Fi sequencing (PacBio) (Amarasinghe et al., 2020). For this step, we used serial dilutions to estimate the volume of transformed E. coli (Lucigen 10G electrocompetent cells) necessary to obtain 10,000–20,000 colonies, which we plated, scraped, and mini‐prepped for plasmid extraction. Next, we used the plasmids from each reduced library—hereafter, R1′ and R2′—to transform S1030 cells containing the B2H plasmid (6X transformations with 100 ng DNA for each transformation). We recovered the cells in SOC media for 1 h, pooled all transformations, and plated them onto 0%, 0.375%, and 0.75% sucrose plates. After 22.5 h, we flooded the plates with LB media, scraped them, and miniprepped the plasmid pools. To prepare plasmids for NGS sequencing, we amplified each population of miniprepped plasmids with 16‐bp symmetric barcodes designed by PacBio for the SMRT platform (i.e., a symmetric barcode for 0%, 0.375%, and 0.75% sucrose in both the R1′ and R2′ libraries) and pooled all samples together. We completed sequencing on PacBio Sequel II instruments with support from the DNA Sequencing Center at Brigham Young University.
The sequencing run (15‐h movie length) yielded 4,454,175 HiFi circular consensus reads. To calculate the enrichment of different mutants, we carried out the following steps. (i) We separated barcoded samples into separate FASTA files using VSEARCH (Rognes et al., 2016) and the biopython and pandas Python packages. (ii) We trimmed the barcodes and counted unique sequences. (iii) We used the USEARCH package (Edgar, 2010) to translate the coding regions of unique reads into protein sequences and aligned them with the wild‐type sequence. (iv) We used the “qrowdots” output to identify mutated residues within each variant. (v) For both the R1′ and R2′ libraries, we merged unique variants and their read counts into single CSV files, and calculated log2‐fold enrichment (L2F j ) by using Equations (1) and (2), where m j is the number of reads for mutant j at a given condition, and m t and f j are the total number of reads and frequency of mutant j, respectively, at the same condition. L2F j provides a metric for the change in mutant frequency between sucrose and
| (1) |
| (2) |
sucrose‐free plates. Over 95% of sequences had a single read (Figure S18). Low read counts make true frequencies impossible to assess (e.g., a variant with a frequency of 0.5 would have either a zero or non‐zero frequency based on the stochastic process of DNA molecules binding to the PacBio SMRT cell) and lead to inaccurate enrichment calculations (i.e., the log2‐fold change is very sensitive to small denominators). Importantly, several mutants that were undetectable without sucrose and became abundant in its presence. To accommodate this phenomenon, we used two analyses: For the first, we examined only variants with at least 5 reads in both the sucrose and non‐sucrose conditions. For the second, we included variants that were absent in the unselected population by assigning them a read count of 4.99 for the non‐sucrose conditions. Using our log2‐fold enrichment scores as a guide, we selected 12 enriched protein variants, which are described in the main text and Table S9. Tables S12–S15 summarize the results of our NGS analysis.
NGS provides a powerful means of evaluating the positional dependence of mutations. For each library, we examined the sites for which mutations were most enriched or most depleted by carrying out five steps: (i) We extracted all mutants with five or fewer mutations. (ii) We determined n i , the total number of reads containing any mutation at site i, where i = 1–329 (residues 1–321, an Leu‐Glu linker, and a 6X polyhistidine tag). (iii) We calculated f i , the frequency
| (3) |
| (4) |
of mutations at a given site by using Equation (2), where n t is the sum of all read counts within the respective condition. (iv) We estimated the log2‐fold change in mutation frequency at each site i (L2Ff i ) by using Equation 3, where f i‐x is the frequency of mutations at site i in the presence of X % sucrose (i.e., X = 0.375 or 0.75% sucrose), and f i‐0 is the frequency of mutations at site i in the presence of 0% sucrose. (v) We ranked sites within the catalytic domain by L2Ff i and selected the 20 most enriched sites and the 20 most depleted sites in the 0.75% sucrose condition. Figure 4b and c show the results of this analysis, and Table S16 provides the values of L2Ff i for each site in each library.
4.8. Protein sequence alignment
We compared the sequences of all classical PTPs from H. sapiens by using a multiple sequence alignment. Briefly, we downloaded the sequences of all 17 non‐receptor PTPs (NRPTPs) and 20 of 21 transmembrane classical PTPs (TMPTPs), excluding PTPRV which is a pseudogene, from Uniprot, and we aligned (i) the NRPTPs or (ii) both NRPTPs and TMPTPs with Jalview (version 2.11.2.5) for protein alignment and the TCoffee alignment algorithm for sequence alignment (with default settings). We truncated the alignment occurring after residue 298 of PTP1B and we used the clustal color scheme to highlight residues.
4.9. Protein expression and purification
We overexpressed all proteins examined in this study in BL21(DE3) cells by carrying out the following steps. (i) We used Gibson assembly to introduce mutations for each PTP1B variant into a pET16b vector and transformed sequence‐confirmed plasmids into BL21(DE3) cells. We note that the pET16b vector adds a polyhistidine tag (six histidine residues) and a short linker (Leu‐Glu) on the C‐terminus of each protein. (ii) We used an individual colony from each transformation to inoculate 20 mL of LB media, and we incubated each 20‐mL culture at 37°C in an incubator‐shaker (225 rpm) for 6 hours. (iii) We used each 20‐mL culture to inoculate 1 L of rich induction media (20 g tryptone, 10 g yeast extract, 5 g sodium chloride, 50 μg/mL carbenicillin, 72 mL 5X M9 salts solution, 20 mL of 20% glucose solution), and we grew the resulting inoculum at 37°C in an incubator‐shaker (225 rpm). (iv) At an OD600 of 0.5–0.8, we added 500 μM IPTG to induce protein expression and incubated the induced flasks at 22°C in an incubator‐shaker (225 rpm) for 18–20 h. (v) We pelleted the final culture (5000 rpm for 10 min in a Beckman J2‐HS floor centrifuge), disposed of the supernatants, and stored the cell pellets at −80°C freezer for future purification.
We purified PTP1B variants with fast protein liquid chromatography (FPLC). Briefly, (i) we lysed cells by adding the following to each gram of cell pellet: 4 mL lysis buffer (20 mM tris base, 50 mM sodium chloride, 1% Triton X‐100, pH 7.5), 2 mg magnesium sulfate heptahydrate, 2 mg TAME, 0.5 mM TCEP (0.5 mM), 3.75 uL PMSF solution, 1 mg lysozyme, and 30 U DNase. (ii) We rocked the lysis mixture at room temperature for 1 h and pelleted the cell debris (6000 rpm for 25 min in a Beckman J2‐HS floor centrifuge). (iii) We extracted the supernatant, added 20% saturated ammonium sulfate solution, rocked the resulting mixture for 1 min at room temperature, and spun down the insoluble protein (6000 rpm for 25 min). (iv) We purified PTP1B variants using standard prep. In brief, we used nickel affinity chromatography (HisTrap HP) with buffer A (50 mM Tris–HCl, 300 mM sodium chloride, 0.5 mM TCEP, pH 7.5) and buffer B (50 mM Tris–HCl, 300 mM sodium chloride, 0.5 mM TCEP, 500 mM imidazole, pH 7.5), a spin concentrator (10,000 kDa, Sartorius) for buffer exchange into 50 mM HEPES (0.5 mM TCEP, pH 7.5), and anion exchange (HiTrap HP 5 mL) with buffer A' (50 mM HEPES, 0.5 mM TCEP, pH 7.5) and buffer B′ (50 mM HEPES, 0.5 mM TCEP, 1 M NaCl, pH 7.5). (v) We collected the protein in 5 mL fractions and assessed protein purity with SDS‐PAGE (4%–20% Criterion TGX stain‐free protein gel). (vi) We pooled purified protein and concentrated in buffer A' with a spin concentrator (10,000 kDa, Sartorius). (vii) We froze purified protein in 20% glycerol and stored the final stocks in a −80°C freezer.
4.10. Enzyme kinetics
We characterized the activity of a large subset of PTP1B variants by using two model substrates: chromogenic p‐nitrophenyl phosphate (pNPP) and fluorogenic 4‐methylumbelliferyl phosphate (4MUP). For both, we used 96‐well plates to prepare 100‐μL reactions with 115.3 nM enzyme (pNPP) or 11.53 nM enzyme (4MUP), 50 μg/mL BSA, and varying amounts of substrates in 50 mM HEPES buffer (pH = 7.3). For pNPP, we used 0.167–15 mM substrate to initialize the reactions and monitored the formation of p‐nitrophenol (pNP) by measuring absorbance at 405 nm at 10‐s intervals over 5 minutes (SpectraMax iD3 plate reader). For 4MUP, we used 31.25–4000 μM to initialize the reactions and monitored the formation of 4‐methylumbelliferone (4MU) by measuring fluorescence (370ex/450em) in 10‐s intervals over 5 min. We used standard curves to convert absorbance or fluorescence measurements to product concentrations and used the slopes of the initial rate regime for V o.
We characterized the activity of a small subset of PTP1B variants on two phosphopeptide substrates: MidT (EPQpYEEIPIYL) and E‐Pep (DADEpYLIPQQG). Here, we used 96 “half‐well” plates to prepare 40‐μL reactions with 6.92 nM enzyme and 50 μg/mL BSA in 50 mM HEPES buffer (pH = 7.3). We initialized reactions by adding 5, 15, 25, 50, 100, 150, 200, 250 μM substrate, and we stopped them by adding 10 μL of malachite green working solution (MAK307, MilliporeSigma) at 0, 2, 4, and 6 min after initiation. After incubating each terminated reaction for 30 min, we quantified free phosphate by measuring absorbance at 620 nm. Figure S6 shows the standard curves used for our kinetic analyses, and Table S10 reports all measured initial rates, including error and replicate numbers, for all kinetic measurements.
4.11. Differential scanning fluorimetry
We used differential scanning fluorimetry (DSF) to examine the influence of mutations on the melting temperature (T m) of PTP1B. In brief, we prepared 50 μL reactions containing 4.61 μM PTP1B and 5X SYPRO orange dye (diluted from 5000X; Life Technologies, Eugene, OR) in 50 mM HEPES (pH 7.3), and we performed a melting‐curve analysis from 25°C to 95°C in 0.5°C steps (Bio‐Rad CFX96 Touch RT‐PCR instrument, Bio‐Rad Laboratories). We recorded the SYPRO orange fluorescence using detection settings for the Rox reporter (580ex/621em) and exported relative fluorescence and first‐derivative data for the melt region (Figure S17). We estimated T ms by calculating the local minima of the negative first‐derivative data (Figure S17), and we determined changes in melting temperature (ΔT m) by subtracting the T m of wild‐type PTP1B from the T m of the respective PTP1B variant (Figure S6d).
4.12. Luminescence assays
We transformed B2H LuxAB (Table S2) into electrocompetent S1030 cells (Addgene #105063) to generate a bacterial strain (S1030/B2H LuxAB ) with a transcriptionally active luminescent B2H system. We cloned genes encoding WT, C215S, and Q262K PTP1B variants into plasmid pBAD33t PTP1B (Table S2) for arabinose‐inducible expression of PTP1B variants. We transformed respective pBAD33t PTP1B plasmids into electrocompetent S1030/B2H LuxAB cells. We inoculated 12 single colonies of respective transformants into 12 1‐mL cultures [terrific broth (TB), 12 g/L tryptone, 24 g/L yeast extract, 2% (v/v) glycerol, 2.28 g/L KH2PO4, 12.53 g/L K2HPO4, pH = 7.0, antibiotics described in Table S2] in 96‐well deep‐well blocks. We grew cultures overnight (37°C, 225 rpm). We sub‐cultured (1:100 dilution) overnight cultures into fresh TB media with the following arabinose concentrations (% w/v): 0, 0.0002, 0.002, 0.02. We grew fresh cultures for 6 h (37°C, 225 rpm). We dispensed 100 μL of cultures into wells of clear flat‐bottom 96‐well plates for both OD600 (absorbance at 600 nm) and luminescence (578 nm wavelength, 1000 ms integration, 1.0 mm read height) measurements. We recorded luminescence and OD600 measurements using a SpectraMax iD3 multi‐mode plate reader (Molecular Devices). Table S11 shows normalized luminescence (Lum/OD600) data and dynamic range calculations.
4.13. Modular dynamics simulations
We prepared PTP1B for modular dynamics (MD) simulations by starting with the X‐ray crystal structure of PTP1B with an ordered ɑ7 helix and a closed WPD loop (PDB 1SUG). For each structure, we removed crystallized waters, glycerol, and Mg2+. From this initial structure we used Modeller 10.1 to model the amino acid mutations. We then adjusted the protonation state to a pH of 7 using the H++ web server, added Na+ ions to neutralize the net charge, and hydrated the protein with a TIP3P water box, choosing the box size to maintain a minimum distance of 10 Å between the protein or ligand and the periodic boundary.
We carried out all MD simulations for 200 ns using GROMACS 2020.6 (Abraham et al., 2015) on the Bridges‐2 cluster at the Pittsburgh Supercomputing Center. We used the Amber ff99SB‐ILDN force field to parameterize the protein. For each simulation, we carried out an energy minimization to 100 kJ/mol/nm force tolerance, and equilibrated the protein in the NVT ensemble at 300 K for 100 ps, followed by equilibration to the NPT ensemble at 300 K and 1 atm for 100 ps. All simulations used the velocity rescaling thermostat and the Beredensen weak‐coupling barostat (Bussi et al., 2007). We centered each final trajectory on the protein, removed rotational and translational motions, and removed correlated samples with ruptures 1.1.6 (Friedman et al., 2022) as described previously. To examine the helicity of the α7 helix in our MD trajectories, we used the DSSP algorithm implemented in MDTraj 1.9.4 (McGibbon et al., 2015). This algorithm characterizes the secondary structure of each residue based on the φ and ψ torsional angles. In this paper, “percent α helicity” refers to the percentage of residues from the α7 region that take on an α helical conformation in each uncorrelated trajectory frame of an MD trajectory.
4.14. Analysis of residue distances
We used the crystal structure of PTP1B bound to a competitive inhibitor (PDB entry 2f71) to estimate the distances of mutated residues from the catalytic cysteine, a surrogate for the active site. Briefly, we measured inter‐residue distance between the Cα of C215 and the Cα of each protein residue by using the compute_contacts algorithm implemented in MDTraj 1.9.4.
AUTHOR CONTRIBUTIONS
Evan T Liechty: Conceptualization (equal); formal analysis (equal); methodology (equal); writing – original draft (equal); writing – review and editing (equal). Andrew Hren: Formal analysis (equal); methodology (equal); writing – original draft (equal); writing – review and editing (equal). Gregory Donovan: Formal analysis (equal); writing – review and editing (equal). Levi Kramer: Formal analysis (equal); methodology (equal); writing – review and editing (equal). Anika J Friedman: Formal analysis (equal); methodology (equal); writing – review and editing (equal). Michael R. Shirts: Formal analysis (equal); methodology (equal); writing – review and editing (equal). Jerome M Fox: Conceptualization (equal); formal analysis (equal); funding acquisition (equal); methodology (equal); writing – original draft (equal); writing – review and editing (equal).
CONFLICT OF INTEREST STATEMENT
Jerome M. Fox is a founder of Think Bioscience, Inc., which develops small‐molecule therapeutics and employs Jerome M. Fox and Levi Kramer, who hold equity interests in the company. Think Bioscience is exploring many drug targets, including protein tyrosine phosphatases such as PTP1B. Michael R. Shirts is an Open Science Fellow at and consultant for Psivant Sciences, and a consultant for Relay Therapeutics.
Supporting information
Appendix S1: Supporting information.
ACKNOWLEDGMENTS
This work was supported by funds provided by the National Institute of General Medical Sciences of the National Institutes of Health (Evan T. Liechty, Gregory Donovan, Andrew Hren, and Jerome M. Fox, R35GM143089), Think Bioscience (Levi Kramer, AWD‐21‐04‐0032), and the University of Colorado Boulder (Anika J. Friedman and Michael R. Shirts). The work used computational resources from the University of Colorado Boulder Research Computing Group, which is supported by the National Science Foundation (ACI‐1532235 and ACI‐1532236), the University of Colorado Boulder, and Colorado State University. This work also used the Extreme Science and Engineering Discovery Environment (XSEDE), which is supported by National Science Foundation grant number ACI‐1548562, and made specific use of the Bridges‐2 system, which is supported by NSF ACI‐1928147 at the Pittsburgh Supercomputing Center (PSC). A.H. also acknowledges support from a GAANN Research fellowship (P200A180034).
Liechty ET, Hren A, Kramer L, Donovan G, Friedman AJ, Shirts MR, et al. Analysis of neutral mutational drift in an allosteric enzyme. Protein Science. 2023;32(8):e4719. 10.1002/pro.4719
Review Editor: Aitziber L. Cortajarena
DATA AVAILABILITY STATEMENT
Data available in article supplementary material or on request from the authors.
REFERENCES
- Abraham MJ, Murtola T, Schulz R, Páll S, Smith JC, Hess B, et al. Gromacs: high performance molecular simulations through multi‐level parallelism from laptops to supercomputers. SoftwareX. 2015;1–2:19–25. [Google Scholar]
- Akashi H, Osada N, Ohta T. Weak selection and protein evolution. Genetics. 2012;192:15–31. [DOI] [PMC free article] [PubMed] [Google Scholar]
- Amarasinghe SL, Su S, Dong X, Zappia L, Ritchie ME, Gouil Q. Opportunities and challenges in long‐read sequencing data analysis. Genome Biol. 2020;21:30. [DOI] [PMC free article] [PubMed] [Google Scholar]
- Arcus VL, Prentice EJ, Hobbs JK, Mulholland AJ, Van Der Kamp MW, Pudney CR, et al. On the temperature dependence of enzyme‐catalyzed rates. Biochemistry. 2016;55:1681–1688. [DOI] [PubMed] [Google Scholar]
- Barr AJ, Ugochukwu E, Lee WH, King ONF, Filippakopoulos P, Alfano I, et al. Large‐scale structural analysis of the classical human protein tyrosine Phosphatome. Cell. 2009;136:352–363. [DOI] [PMC free article] [PubMed] [Google Scholar]
- Bershtein S, Goldin K, Tawfik DS. Intense neutral drifts yield robust and evolvable consensus proteins. J Mol Biol. 2008;379:1029–1044. [DOI] [PubMed] [Google Scholar]
- Besenmatter W, Kast P, Hilvert D. Relative tolerance of mesostable and thermostable protein homologs to extensive mutation. Proteins Struct FunctBioinform. 2007;66:500–506. [DOI] [PubMed] [Google Scholar]
- Blanchetot C, Chagnon M, Dubé N, Hallé M, Tremblay ML. Substrate‐trapping techniques in the identification of cellular PTP targets. Methods. 2005;35:44–53. [DOI] [PubMed] [Google Scholar]
- Bloom JD, Arnold FH. In the light of directed evolution: pathways of adaptive protein evolution. 2009;106:9995–10000. [DOI] [PMC free article] [PubMed] [Google Scholar]
- Bloom JD, Silberg JJ, Wilke CO, Drummond DA, Adami C, Arnold FH. Thermodynamic prediction of protein neutrality. Proc Natl Acad Sci U S A. 2005;102:606–611. [DOI] [PMC free article] [PubMed] [Google Scholar]
- Bloom JD, Labthavikul ST, Otey CR, Arnold FH. Protein stability promotes evolvability. Proc Natl Acad Sci U S A. 2006;103:5869–5874. [DOI] [PMC free article] [PubMed] [Google Scholar]
- Bloom JD, Romero PA, Lu Z, Arnold FH. Neutral genetic drift can alter promiscuous protein functions, potentially aiding functional evolution. Biol Direct. 2007;2:1–19. [DOI] [PMC free article] [PubMed] [Google Scholar]
- Bussi G, Donadio D, Parrinello M. Canonical sampling through velocity rescaling. J Chem Phys. 2007;126:014101. [DOI] [PubMed] [Google Scholar]
- Cobb RE, Chao R, Zhao H. Directed evolution: past, present and future. AIChE J. 2013;59:1432–1440. [DOI] [PMC free article] [PubMed] [Google Scholar]
- Cox J, Hein MY, Luber CA, Paron I, Nagaraj N, Mann M. Accurate proteome‐wide label‐free quantification by delayed normalization and maximal peptide ratio extraction, termed MaxLFQ. Mol Cell Proteomics. 2014;13:2513–2526. [DOI] [PMC free article] [PubMed] [Google Scholar]
- Cui DS, Beaumont V, Ginther PS, Lipchock JM, Loria JP. Leveraging reciprocity to identify and characterize unknown allosteric sites in protein tyrosine phosphatases. J Mol Biol. 2017;429:2360–2372. [DOI] [PMC free article] [PubMed] [Google Scholar]
- Cui DS, Lipchock JM, Brookner D, Loria JP. Uncovering the molecular interactions in the catalytic loop that modulate the conformational dynamics in protein tyrosine phosphatase 1B. J Am Chem Soc. 2019;141:12634–12647. [DOI] [PMC free article] [PubMed] [Google Scholar]
- Daudé D, Vergès A, Cambon E, Emond S, Tranier S, André I, et al. Neutral genetic drift‐based engineering of a sucrose‐utilizing enzyme toward Glycodiversification. ACS Catal. 2019;9:1241–1252. [Google Scholar]
- Edgar RC. Search and clustering orders of magnitude faster than BLAST. Bioinformatics. 2010;26:2460–2461. [DOI] [PubMed] [Google Scholar]
- Friedman AJ, Liechty ET, Kramer L, Sarkar A, Fox JM, Shirts MR. Allosteric inhibition of PTP1B by a nonpolar terpenoid. J Phys Chem B. 2022;126:8427–8438. [DOI] [PMC free article] [PubMed] [Google Scholar]
- Gupta RD, Tawfik DS. Directed enzyme evolution via small and effective neutral drift libraries. Nature Methods. 2008;5:939–942. [DOI] [PubMed] [Google Scholar]
- Hjortness MK, Riccardi L, Hongdusit A, Zwart PH, Sankaran B, De VM, et al. Evolutionarily conserved allosteric communication in protein tyrosine phosphatases. Biochemistry. 2018;57:6443–6451. [DOI] [PubMed] [Google Scholar]
- Hongdusit A, Fox J. Optogenetic analysis of allosteric control in protein tyrosine phosphatases. Biochemistry. 2021;60:254–258. [DOI] [PubMed] [Google Scholar]
- Hongdusit A, Zwart PH, Sankaran B, Fox JM. Minimally disruptive optical control of protein tyrosine phosphatase 1B. Nat Commun. 2020;11:788. [DOI] [PMC free article] [PubMed] [Google Scholar]
- Horns F, Vollmers C, Dekker CL, Quake SR. Signatures of selection in the human antibody repertoire: selective sweeps, competing subclones, and neutral drift. Proc Natl Acad Sci U S A. 2019;116:1261–1266. [DOI] [PMC free article] [PubMed] [Google Scholar]
- Jia Z, Barford D, Flint A. Tonks N (1995) Structural basis for phosphotyrosine peptide recognition by protein tyrosine phosphatase 1B. Science. 1979;268:1754–1758. [DOI] [PubMed] [Google Scholar]
- Kelley JL, Arias‐Rodriguez L, Patacsil Martin D, Yee MC, Bustamante CD, Tobler M. Mechanisms underlying adaptation to life in hydrogen sulfide–rich environments. Mol Biol Evol. 2016;33:1419–1434. [DOI] [PMC free article] [PubMed] [Google Scholar]
- Khanal A, McLoughlin SY, Kershner JP, Copley SD. Differential effects of a mutation on the normal and promiscuous activities of orthologs: implications for natural and directed evolution. Mol Biol Evol. 2015;32:100–108. [DOI] [PMC free article] [PubMed] [Google Scholar]
- King JL. Jukes TH (1969) Non‐Darwinian evolution: Most evolutionary change in proteins may be due to neutral mutations and genetic drift. Science. 1979;164:788–798. [DOI] [PubMed] [Google Scholar]
- Lessard L, Stuible M, Tremblay ML. The two faces of PTP1B in cancer. Biochim Biophys Acta Proteins Proteom. 2010;1804:613–619. [DOI] [PubMed] [Google Scholar]
- Lynch M. Evolution of the mutation rate. Trends Genet. 2010;26:345–352. [DOI] [PMC free article] [PubMed] [Google Scholar]
- McGibbon RT, Beauchamp KA, Harrigan MP, Klein C, Swails JM, Hernández CX, et al. MDTraj: a modern open library for the analysis of molecular dynamics trajectories. Biophys J. 2015;109:1528–1532. [DOI] [PMC free article] [PubMed] [Google Scholar]
- Montalibet J, Skorey K, McKay D, Scapin G, Asante‐Appiah E, Kennedy BP. Residues distant from the active site influence protein‐tyrosine phosphatase 1B inhibitor binding. J Biol Chem. 2006;281:5258–5266. [DOI] [PubMed] [Google Scholar]
- Nguyen V, Wilson C, Hoemberger M, Stiller JB, Agafonov RV, Kutter S, et al. Evolutionary drivers of thermoadaptation in enzyme catalysis. 2017;355:289–294. [DOI] [PMC free article] [PubMed] [Google Scholar]
- Olmez EO, Alakent B. Alpha7 helix plays an important role in the conformational stability of PTP1B. J Biomol Struct Dyn. 2011;28:675–693. [DOI] [PubMed] [Google Scholar]
- Peisajovich SG, Tawfik DS. Protein engineers turned evolutionists. Nat Methods. 2007;4:991–994. [DOI] [PubMed] [Google Scholar]
- Rognes T, Flouri T, Nichols B, Quince C, Mahé F. VSEARCH: a versatile open source tool for metagenomics. PeerJ. 2016;4:e2584. [DOI] [PMC free article] [PubMed] [Google Scholar]
- Sarkar A, Kim E, Jang T, Hongdusit A, Kim H, Choi J‐M, et al. Microbially guided discovery and biosynthesis of biologically active natural products. ACS Synth Biol. 2021;10:1505–1519. [DOI] [PubMed] [Google Scholar]
- Shen R, Crean RM, Olsen KJ, Corbella M, Calixto AR, Richan T, Brandão TAS, Brandão B, Berry RD, Tolman A, et al. Insights into the importance of WPD‐loop sequence for activity and structure in protein tyrosine phosphatases. Chem Sci. 2022;113:13524–13540. [DOI] [PMC free article] [PubMed] [Google Scholar]
- Singh JP, Lin MJ, Hsu SF, Peti W, Lee CC, Meng TC. Crystal structure of TCPTP unravels an allosteric regulatory role of helix α7 in phosphatase activity. Biochemistry. 2021;60:3856–3867. [DOI] [PubMed] [Google Scholar]
- Socha RD, Tokuriki N. Modulating protein stability—directed evolution strategies for improved protein function. FEBS J. 2013;280:5582–5595. [DOI] [PubMed] [Google Scholar]
- Tautz L, Critton DA. Grotegut S. Protein tyrosine phosphatases: structure, function and implication in human disease. Phosphatase Modulators. 2013;1053:179–222. [DOI] [PMC free article] [PubMed] [Google Scholar]
- Tenaillon O, Matic I. The impact of neutral mutations on genome evolvability. Curr Biol. 2020;30:R527–R534. [DOI] [PubMed] [Google Scholar]
- Torgeson KR, Clarkson MW, Kumar S, Page R, Peti W. Cooperative dynamics across distinct structural elements regulate PTP1B activity. J Biol Chem. 2020;295:13829–13837. [DOI] [PMC free article] [PubMed] [Google Scholar]
- Torgeson KR, Clarkson MW, Granata D, Lindorff‐Larsen K, Page R, Peti W. Conserved conformational dynamics determine enzyme activity. Sci Adv. 2022;8:5546. [DOI] [PMC free article] [PubMed] [Google Scholar]
- Trudeau DL, Tawfik DS. Protein engineers turned evolutionists—the quest for the optimal starting point. Curr Opin Biotechnol. 2019;60:46–52. [DOI] [PubMed] [Google Scholar]
- Wiesmann C, Barr KJ, Kung J, Zhu J, Erlanson DA, Shen W, et al. Allosteric inhibition of protein tyrosine phosphatase 1B. Nat Struct Mol Biol. 2004;11:730–737. [DOI] [PubMed] [Google Scholar]
- Xie L, Zhang YL, Zhang ZY. Design and characterization of an improved protein tyrosine phosphatase substrate‐trapping mutant. Biochemistry. 2002;41:4032–4039. [DOI] [PubMed] [Google Scholar]
- Yang G, Hong N, Baier F, Jackson CJ, Tokuriki N. Conformational tinkering drives evolution of a promiscuous activity through indirect mutational effects. Biochemistry. 2016;55:4583–4593. [DOI] [PubMed] [Google Scholar]
- Yip SC, Saha S, Chernoff J. PTP1B: a double agent in metabolism and oncogenesis. Trends Biochem Sci. 2010;35:442–449. [DOI] [PMC free article] [PubMed] [Google Scholar]
- Zhang YL, Yao ZJ, Sarmiento M, Wu L, Burke TR, Zhang ZY. Thermodynamic study of ligand binding to protein‐tyrosine phosphatase 1B and its substrate‐trapping mutants. J Biol Chem. 2000;275:34205–34212. [DOI] [PubMed] [Google Scholar]
Associated Data
This section collects any data citations, data availability statements, or supplementary materials included in this article.
Supplementary Materials
Appendix S1: Supporting information.
Data Availability Statement
Data available in article supplementary material or on request from the authors.