

Abstract
PADI4 is one of the human isoforms of a family of enzymes implicated in the conversion of arginine to citrulline. MDM2 is an E3 ubiquitin ligase which is crucial for down‐regulation of degradation of the tumor suppressor gene p53. Given the relationship between both PADI4 and MDM2 with p53‐signaling pathways, we hypothesized they may interact directly, and this interaction could be relevant in the context of cancer. Here, we showed their association in the nucleus and cytosol in several cancer cell lines. Furthermore, binding was hampered in the presence of GSK484, an enzymatic PADI4 inhibitor, suggesting that MDM2 could bind to the active site of PADI4, as confirmed by in silico experiments. In vitro and in silico studies showed that the isolated N‐terminal region of MDM2, N‐MDM2, interacted with PADI4, and residues Thr26, Val28, Phe91 and Lys98 were more affected by the presence of the enzyme. Moreover, the dissociation constant between N‐MDM2 and PADI4 was comparable to the IC50 of GSK484 from in cellulo experiments. The interaction between MDM2 and PADI4 might imply MDM2 citrullination, with potential therapeutic relevance for improving cancer treatment, due to the generation of new antigens.
Keywords: citrullination, isothermal titration calorimetry, MDM2, molecular docking, NMR, PADI4, protein ligation assay, protein–protein interactions
Abbreviations
- BLI
biolayer interferometry
- CD
circular dichroism
- CSP
chemical shift perturbation
- DAPI
4′,6‐diamino‐2‐phenylindole
- DMSO
dimethyl sulfoxide
- EMT
epithelial‐to‐mesenchymal transition
- FBS
fetal bovine serum
- GBM
glioblastoma
- GBSA
generalized Born surface area
- GSK3β
glycogen synthase kinase 3 beta
- IF
immunofluorescence
- ITC
isothermal titration calorimetry
- MDM2
murine double minute 2 oncoprotein
- MGMT
O6‐methylguanine methyltransferase
- MM
molecular mechanics
- MTT
3‐(4,5‐Dimethylthiazol‐2‐Yl)‐2,5‐diphenyltetrazolium bromide
- N‐MDM2
N‐terminal region of MDM2 (residues 6–125 of the intact protein)
- NMR
nuclear magnetic resonance
- PADI
peptidyl‐arginine deiminase
- PBS
phosphate buffered saline
- PDB
Protein Data Bank
- PLA
proximity ligation assay
- PPI
protein–protein interaction
- PTM
post‐translational modification
- RMSD
root mean square deviation
- SAMp73
the sterile alpha motif of p73
- SD
standard deviation
- TA
transactivation domain
- TCEP
tris(2‐carboxyethyl)phosphine
- TMZ
temozolomide
- TSG
tumor suppressor gene
- UV
ultraviolet
1. INTRODUCTION
PADI4 belongs to a family of peptidyl‐arginine deiminases (PADI, EC 3.5.3.15) hydrolytic enzymes responsible of catalyzing citrullination, that is, the conversion of arginine to citrulline residues in a polypeptide chain, in the presence of Ca(II). This post‐translational modification (PTM) is permanent, unless the protein is degraded. Such modification influences the molecular properties of the polypeptide chain and it has important roles in human disease (Gudmann et al., 2015; György et al., 2006; Ishigami & Maruyama, 2010; Yuzhalin, 2019). PADI4 is usually located in cytoplasmic granules of inflammatory cells (eosinophils, neutrophils and macrophages), mammary gland cells, stem cells, and tumor cells, where is highly expressed, either in the cytosol or in the nucleus. This protein is involved in gene transcription and immune system modulation, leading to cell inflammation and immune response (Slade et al., 2014; Wang et al., 2021; Witalison et al., 2015; Yang et al., 2021; Ying et al., 2009). In addition, an enzymatic activity increase is observed for several PADI4 haplotype mutants during the apoptosis enhanced through the mitochondrial pathway (Hung et al., 2007). Furthermore, PADI4 is involved in p53‐gene expression, as well as in the expression of other p53‐target genes (Li et al., 2008; Li et al., 2010; Yang et al., 2021). We have shown recently that PADI4 is expressed in glioblastoma (GBM), pancreatic adenocarcinoma and colon cancer (Neira, Araujo‐Abad, et al., 2022), and it binds to other key proteins involved in cancer development, such as importin α (Neira, Rizzuti, et al., 2022) and plakophilin 1 (Neira et al., 2023). Therefore, in recent years, PADI4 has attracted the attention of the research community due to its key role in cancer progression, which affects patient survival and prognosis.
Tumor suppressor genes (TSGs) are frequently down‐regulated in cancer, leading to dysregulation of the pathways they control and, therefore, provide opportunities for alternative therapies (Gregory & Copple, 2022). The protein p53 is a protein produced by a well‐known TSG (Lei et al., 2023). A key p53 regulator is the cellular protein MDM2 (murine double minute 2 oncoprotein) (EC. 2.3.2.27) (Momand et al., 1992; Reza Saadatzadeh et al., 2017), an E3 ubiquitin ligase encoded by the mdm2 oncogene. MDM2 can inhibit p53 in several ways: (i) the N‐terminal region of MDM2, N‐MDM2 (comprising the first 125 residues), binds to the p53 N‐terminal transactivation domain (residues 15–29, TA), and can alter p53‐transcriptional activity; (ii) the full‐length MDM2 exports p53 from the nucleus (Chen et al., 1993; Kussie et al., 1996; Momand et al., 1992); and (iii) MDM2 activates p53‐degradation via ubiquitin‐proteasome pathways (Kubbutat et al., 1997). The N‐MDM2, which includes the well‐folded p53 binding‐domain (residues 25–109; McCoy et al., 2003), is composed by four α‐helices (residues 32–41, 50–63, 81–86 and 96–104) and a three‐stranded anti‐parallel β‐sheet (residues 66–68, 74–76 and 90–92) (Kussie et al., 1996; Uhrinova et al., 2005). The α‐helices are the side‐walls and bottom of the cavity where the TA of p53 binds, and the antiparallel β‐sheet covers the binding cleft from both sides. Since p53 and MDM2 interact, as well as p53 and PADI4 (Chen et al., 1993; Kussie et al., 1996; Reza Saadatzadeh et al., 2017), we hypothesized that PADI4 and MDM2 might interact directly as well.
In this work, we hypothesized that given the relationship of MDM2 and PADI4 with p53, they could also interact directly, and indeed we identified and described the interaction between intact MDM2 and PADI4 in cellulo in several cancer cell lines. Importantly, in the presence of GSK484, an enzyme inhibitor of PADI4, we observed that the interaction between the two proteins was hampered. Those results indicate that the MDM2‐binding region of PADI4 could be located in, or close to, its active site, or alternatively, in another region involved in a conformational change associated with an allosteric inhibition. As p53 binds MDM2 at the N‐MDM2 region, we performed in vitro and in silico analyses to characterize the possible association of PADI4 through the N‐MDM2. We provided evidence of this binding by a combination of experimental and simulation techniques. The in vitro studies showed an affinity in the micromolar range, as measured by isothermal titration calorimetry (ITC) (K d ~ 1 μM), fluorescence (K d ~ 6 μM) and biolayer interferometry (BLI) (K d ~ 2 μM), comparable to the measured IC50 of GSK484 that was ~20 μM (taking into consideration that IC50 is not a true interaction constant depending on many experimental factors). The PADI4‐binding region of N‐MDM2 was mainly formed by residues Thr26, Val28, Phe91 and Lys98, as suggested by nuclear magnetic resonance (NMR) experiments. Blind docking and simulations followed by re‐scoring through molecular mechanics (MM) methods further pinpointed the involvement of most of these residues of N‐MDM2 in the binding, together with the critical participation of some arginine amino acids. Furthermore, the simulation results strongly supported the idea that the binding of N‐MDM2 involved the active site of PADI4. Interestingly, N‐MDM2 has four arginine residues (Arg29, Arg65, Arg97 and Arg105) that could be susceptible of being citrullinated by PADI4 to further modulate its binding to p53. The fact that MDM2 might be post‐translationally modified opens the possibility to develop new cancer therapies based on its citrullination, or alternatively, its use in liquid biopsy for early detection and prognosis of citrullinated species or the antigens raised against them.
2. RESULTS
2.1. Binding of PADI4 to intact MDM2 occurred in cellulo in the cytosol and nucleus
To test whether interaction between endogenous PADI4 and intact MDM2 occurred within cancer cells, we used different cell lines. For GBM, we employed a previously described patient‐derived cell line, HGUE‐GB‐42 (Ventero et al., 2019). We also used other two cell lines, SW‐480, isolated from the large intestine of a Dukes C colorectal cancer patient, and RWP‐1, as a model of pancreatic cancer. First, we performed immunofluorescence (IF) experiments to address whether both proteins were expressed and colocalized in the same cellular compartments for the different cell lines (Figure S1). We found that the two proteins were highly expressed in all the patient‐derived cell lines. Moreover, the fact that both proteins had a nuclear staining, as shown by the colocalization with DAPI, suggested that they may interact directly within the nuclear compartment. Subsequently, we sought to confirm their interaction by using the Duolink in situ assay. The red fluorescent spots, corresponding to the Proximity ligation assay (PLA) signals, indicated that PADI4 interacted with full‐length MDM2 within the nucleus and cytosol, regardless of the cancer cell type (Figures 1 and S2).
FIGURE 1.
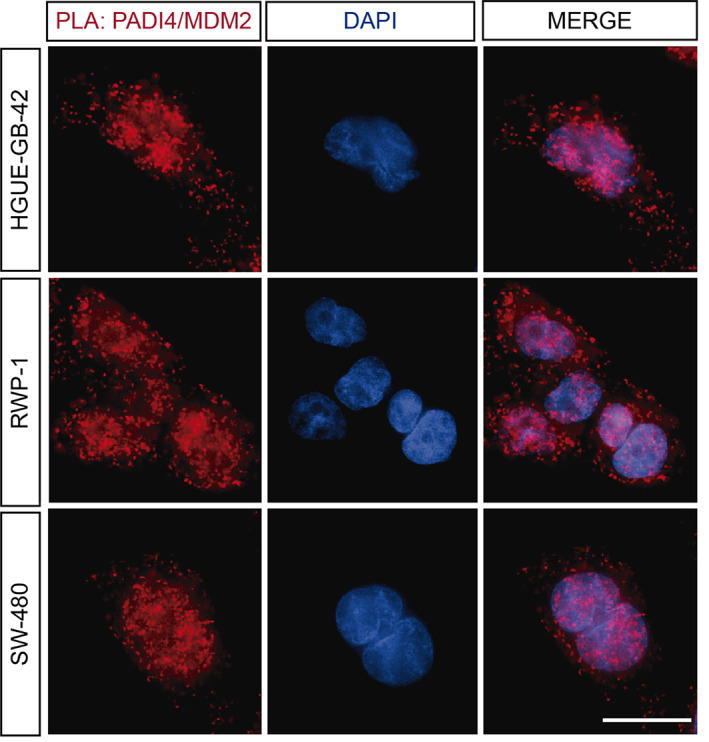
MDM2 interacted directly with PADI4 in cellulo. PLAs of PADI4 with MDM2 reveal the direct interaction between the two proteins in different patient‐derived HGUE‐GB‐42, SW‐480 and RWP‐1 cells. A representative experiment is shown (n = 5). Scale bar = 20 μm.
To sum up, our results indicate that PADI4 and the intact MDM2 not only co‐expressed, but they interacted directly in different cell compartments of cancer cells corresponding to several tissues.
2.2. Inhibition of PADI4 in cellulo resulted in a decrease of PADI4‐MDM2 interaction
It has been described that the compound GSK484 is an enzymatic inhibitor of PADI proteins, but it shows a strong preference for PADI4 over the other isozymes (Lewis et al., 2015). To establish the optimal concentration at which GSK484 had an effect on the studied tumor cell lines, we performed a series of proliferation assays.
We observed that the GBM was the most sensitive cell line to the presence of GSK484, with an IC50 of 12.7 μM (Figure 2a), followed by the colorectal cell line, SW‐480, with an IC50 of 19.2 μM. At 20 μM of GSK484, the highest tested concentration, the pancreatic cancer cell line, did not reach a 50% reduction in the cell proliferation. We considered that the reduction by 40% shown by RWP‐1 was sufficient to affect the binding, and hence, we decided to use GSK484 at 20 μM concentration in the PLAs with PADI4 and MDM2.
FIGURE 2.
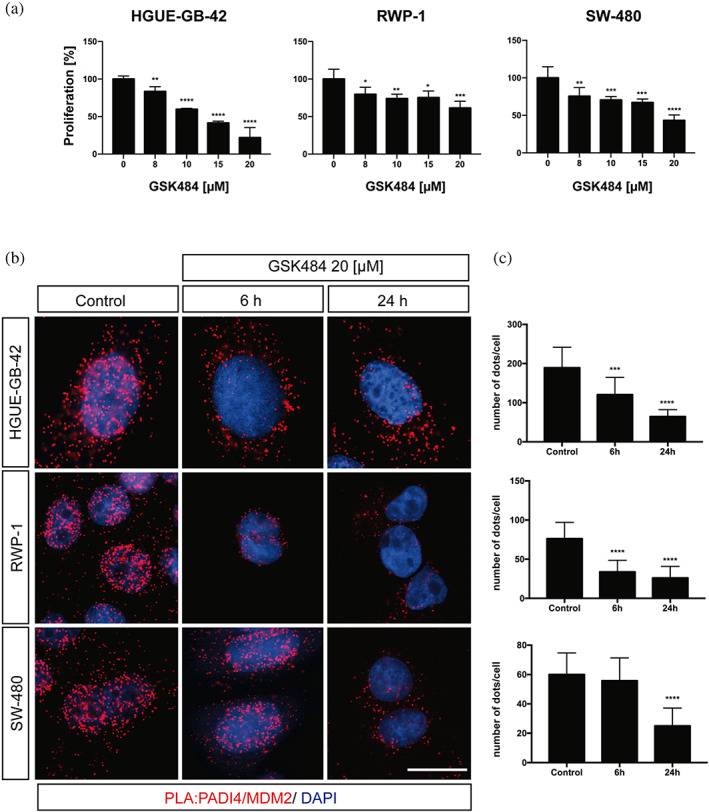
MDM2/PADI4 interaction inhibited by GSK484. (a) Proliferation cell experiments in the presence of GSK484 (at 20 μM) for the three cell lines. (b) PLA was performed in HGUE‐GB‐42, RWP‐1 and SW‐480 cells in the presence or absence of GSK484 at a concentration of 20 μM, for 6 and 24 h. Control experiments were carried out at 6 h. Scale bar = 20 mm. (c) A representative experiment is shown (n = 5). Each panel corresponds to the cell lines shown in B. The Fiji software was used to account for the number of red dots. Data represent mean ± SD, Student's 2‐tailed unpaired t test was used, *p < 0.05; **p < 0.01; ***p < 0.001; ****p < 0.0001.
We treated the cells with GSK484 for 6 and 24 h, and then, we fixed them to perform PLAs. After 6 h, we already observed a great reduction in the number of observed red dots, indicating that the interaction between PADI4 and MDM2 occurred mainly in the nucleus as shown by DAPI nuclear counterstaining (Figures 2b and S3). The reduction in the population of MDM2/PADI4 formed complexes was even greater after the 24‐h treatment with the inhibitor (GSK484), suggesting that the binding of GSK484 could prevent the binding of MDM2 with PADI4. At this stage, we cannot unambiguously conclude that PADI4 may likely competitively prevent the binding of MDM2 with PADI4 or alternatively, the presence of GSK484 could modify allosterically the MDM2‐binding site of PADI4. (Figures 2b,c and S3). Interestingly, each of the tumor cell lines responded differently to GSK484 treatment. Contrary to what we would expect after the proliferation experiments, RWP‐1 showed a large decrease in the amount of the MDM2/PADI4 complexes formed already at 6 h, and the number of those formed was not substantially decreased by longer treatment times. On the other hand, SW‐480 did not respond until 24‐h exposure to the GSK484 treatment. The number of dots per cell in the GBM cell line, HGUE‐GB‐42, decreased over time, suggesting a direct correlation between the treatment time and inhibition effect by GSK484 (Figures 2c and S3). These results agree with previous observations reporting that PADI4 inhibition results in different outcomes in multiple cancer cell lines (Yuzhalin, 2019), besides its different expression among several cell lines, as we have recently shown (Neira, Araujo‐Abad, et al., 2022). Then, all in all, those findings suggest that the inhibitory effect of GSK484 may have different effects among the cell lines (Duan et al., 2016; Stadler et al., 2013; Yuzhalin et al., 2018; Zhang et al., 2021). Altogether, our experiments showed that, in the presence of GSK484, the binding between MDM2 and PADI4 was hampered (Figures 2 and S3).
2.3. PADI4 was bound to N‐MDM2 in vitro
The complex between MDM2 and p53 is primarily formed by the interaction between the N‐terminal domain of MDM2 (N‐MDM2), comprising the first 125 residues of the protein, and the TA of p53 (Joerger & Fersht, 2008; Wallace et al., 2006; Yadahalli et al., 2019). Therefore, as the in cellulo experiments indicated unambiguously that there was binding between intact MDM2 and PADI4, we hypothesized that MDM2 could also interact with PADI4 by using that same p53‐binding region. Then, we tested whether PADI4 interacted with N‐MDM2 in vitro, by following a two‐part experimental approach. First, we used steady‐state fluorescence, far‐ultraviolet (UV) circular dichroism (CD) and NMR, as spectroscopic techniques to observe a possible binding and concomitant conformational changes in the macromolecules; and second, we used fluorescence, BLI and ITC to quantitatively measure the thermodynamic parameters of such binding.
We used fluorescence to determine whether there was a change in: (i) the position of the maximum wavelength; (ii) the intensity at that wavelength; or (iii) both, when the spectrum of the complex was compared to that obtained from the addition of the separated spectra of the two isolated proteins. A variation in fluorescence intensity by excitation at 280 nm was observed when the complex of PADI4 with N‐MDM2 was formed (Figure 3a, left panel), but there were no changes in the maximum wavelength of the spectrum.
FIGURE 3.
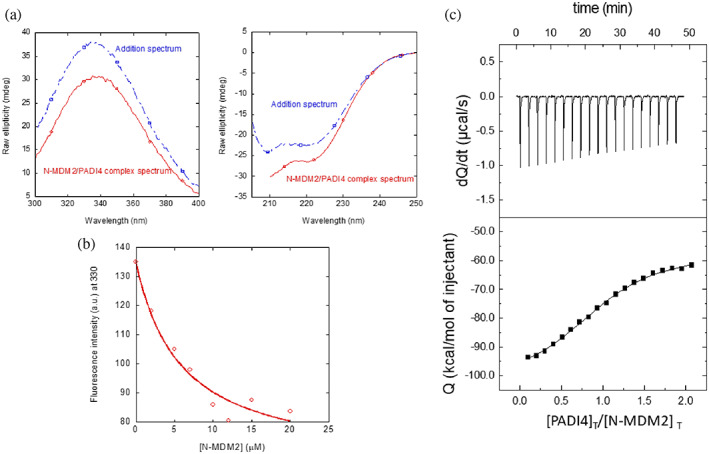
Binding of N‐MDM2 to PADI4 as monitored by different biophysical probes: (a) (Right panel) Fluorescence spectrum obtained by excitation at 280 nm of the N‐MDM2/PADI4 complex, and addition spectrum obtained by the sum of the spectra of the two isolated macromolecules. (Left panel) Far‐UV CD spectrum of the N‐MDM2/PADI4 complex, and addition spectrum obtained by the sum of the spectra of the two isolated macromolecules. (b) Titration curve monitoring the changes in the fluorescence at 315 nm when N‐MDM2 was added to PADI4. The fluorescence intensity on the y‐axis is the relative signal after removal of the corresponding blank. The line through the data are the fitting to Equation (1). Experiments were carried out at 25°C. (c) Calorimetric titrations for the PADI4 binding to N‐MDM2. Upper panel show the thermogram (thermal power as a function of time), and lower panel show the binding isotherm (ligand‐normalized heat effects per injection as a function of the molar ratio in the calorimetric cell). Continuous lines correspond to the fitting curves according to a single ligand binding site interaction model. Experiments were carried out at 25°C.
Next, we carried out far‐UV CD measurements, trying to confirm the fluorescence binding results. In agreement with the observations by fluorescence described above, the addition spectrum was different from that of the complex (Figure 3a, right panel). Then, we can conclude that there were changes in the secondary structure of PADI4 and/or in that of N‐MDM2 when the two proteins were bound; however, we cannot rule out that the changes observed were due to displacements of some aromatic residues (or interactions involving these residues) of at least one of the proteins.
To further confirm in vitro the binding between the two proteins, and to elucidate the PADI4‐binding region of N‐MDM2, we acquired a 2D 1H‐15N HSQC NMR spectra in isolated 15N‐labeled N‐MDM2 and in a complex, with an excess of PADI4 (Figure 4a). The chemical shift perturbations (CSPs) (Equation (2)) of residues Thr26, Val28, Leu33, Gln44, Glu52, Glu69, Phe91, His96 and Lys98 of N‐MDM2 in the presence of PADI4 were larger than the average ± standard deviation (SD) (Figure 4b). As Glu52, Glu69 and His96 have ionizable side‐chains, which could be titrating at the pH of the experiments, we did not consider any further these residues. The presence of such large CSPs for the rest of the residues indicates a fast equilibrium between the free and bound‐N‐MDM2 and, therefore, it confirms the binding to PADI4. We also point out that the fact that large CSP values are restricted to some particular residues of N‐MDM2 further confirms that the association is specific, as already suggested by: (i) the ITC titration curves observed (Figure 3c); and (ii) the well‐defined stoichiometry of the binding reaction. On the other hand, when mapped on the tertiary structure of N‐MDM2 (Figure S4), the CSP values are scattered on several distant regions; this is suggesting that some of those variations might be due to indirect effects on the affected residues rather than a direct contact with the surface of PADI4, and/or to multiple binding modes (i.e., orientations) of N‐MDM2 on the same hot‐spot of PADI4. It is interesting to note that some of those residues are not far away from those involved in forming the p53‐binding pocket in N‐MDM2 (Kussie et al., 1996): Leu54, His96, Ile99 and Tyr100. On the other hand, we observed a general decrease in the signal intensity of any cross‐peak of the spectrum of the complex (i.e., general broadening), when compared with the intensity of the corresponding cross‐peak of the spectrum of isolated N‐MDM2 (Figure 4c).
FIGURE 4.

Binding of N‐MDM2 to PADI4 mapped by NMR. (a) 2D 1H‐15N HSQC NMR spectra of isolated N‐MDM2 (black) and in the presence of PADI4 (red). (b) CSPs (Equation (2)) of the unambiguously assigned cross‐peaks, showing no overlapping with others. The dotted line is the average value ± SD. (c) Ratio of the intensity of a cross‐peak in the spectrum of the complex (red in panel a) to the intensity of the same cross‐peak in the spectrum of isolated MDM2 (black in panel a). The dotted line is the average value ± SD. Experiments were carried out at 25°C.
Since we observed changes in the fluorescence spectra upon PADI4 binding to N‐MDM2, to determine the affinity constant, we carried out titrations by keeping constant the concentration of PADI4, and increasing that of N‐MDM2. The results provided a K d value of 5 ± 2 μM (Figure 3b) for the interaction between PADI4 and N‐MDM2. We also used ITC to determine the thermodynamic binding parameters (Figure 3c). The results indicated that the interaction was highly exothermic (favorable enthalpic contribution and unfavorable entropic contribution to the Gibbs energy of binding), with ΔH = − 42 kcal mol−1, and the K d was 1.0 ± 0.2 μM (slightly lower than the value obtained by fluorescence). The stoichiometry of the reaction was 1.1, indicating that the dimer of PADI4 was bound to two molecules of N‐MDM2.
The results from BLI (Figure 5a) yielded a value of the dissociation constant similar to that measured by ITC and fluorescence. The K d value obtained was: 2 ± 2 μM, with k on = 0.17 ± 0.10 μM−1 s−1 and k off = 0.3 ± 0.2 s−1 (Figure 5b). The latter value was similar to the average obtained from the fitting of dissociation curves of the sensorgrams at the different N‐MDM2 concentrations.
FIGURE 5.
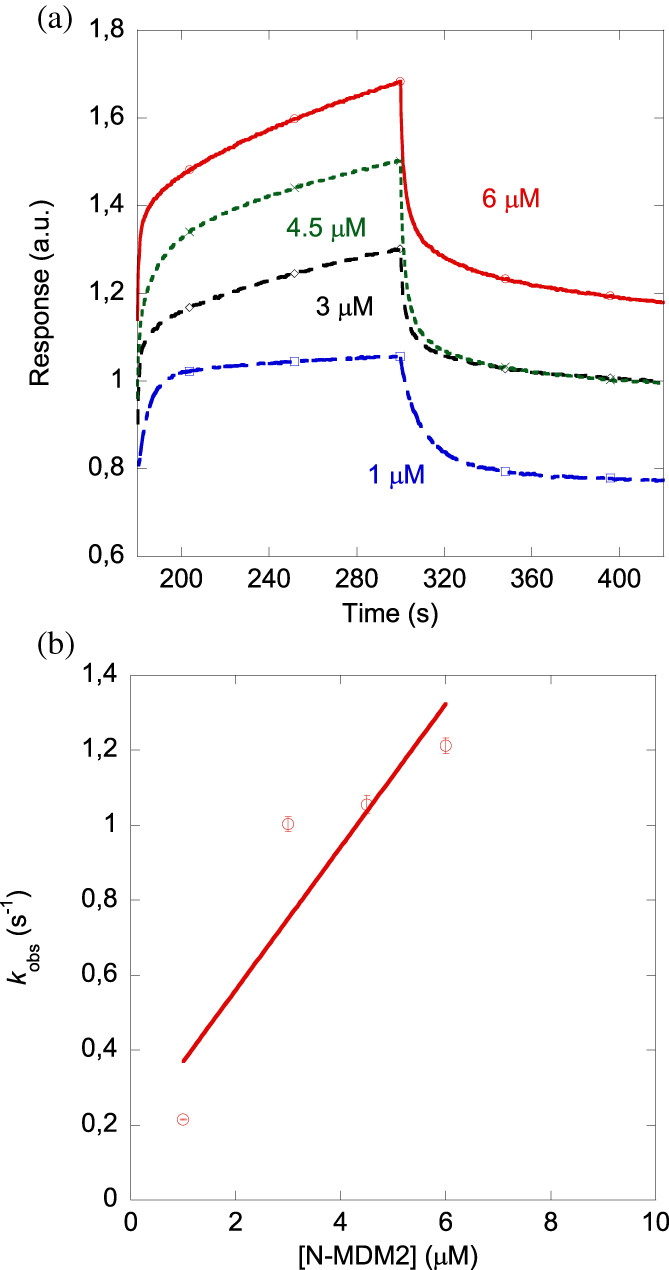
Affinity of N‐MDM2 toward PADI4 from BLI assays. (a) Sensorgrams at different concentrations of N‐MDM2 used in the assays for PADI4‐immobilized on the sensor. (b) Pseudo‐first order plot of the binding of N‐MDM2 to PADI4 (Equation (6)). The error bars are errors from fitting sensorgrams to Equation (5). Experiments were carried out at 25°C.
To sum up, we conclude that N‐MDM2 could bind to PADI4, with a dissociation constant in the low micromolar range through an enthalpically driven process, and therefore the binding we had observed in cellulo should occur through the N‐terminus of the intact protein.
2.4. Using blind docking to define the binding regions of PADI4 and N‐MDM2
Protein–protein docking was used to model the essential features of the structure of the N‐MDM2/PADI4 complex, and to clarify details of their respective hot‐spot regions in the binding.
Some of the results of our in vitro and in cellulo experiments were used to simplify the simulations in a preliminary stage, and as a filter to sort out the predicted docking poses in a subsequent stage. To begin with, the hot‐spot of MDM2 was restricted to a subset of residues of its N‐terminal region N‐MDM2 and, more precisely, of the well‐folded p53‐binding domain encompassing residues 25–109 (McCoy et al., 2003). In fact, both the N‐terminal (residues 1–24) and C‐terminal region (residues 110–125) of N‐MDM2, flanking the p53‐binding domain from either side, are unstructured in the unliganded protein species, and not solved in NMR complexes with protein partners different from PADI4 (Jae‐Sun et al., 2015; Michelsen et al., 2012; Nagata et al., 2014). More importantly, the residues of N‐MDM2 whose NMR signals were significantly affected by the binding to PADI4 and do not contain a titrating side‐chain around pH 7.0 (Thr26, Val28, Leu33, Gln44, Phe91, and Lys98) are all included within the sequence of the p53‐binding domain. Therefore, in our docking simulations we limited our study to the binding of this sole domain.
Possible conformations of the complex between PADI4 and the p53‐binding domain of MDM2 were predicted on the basis of the consensus obtained from different popular docking algorithms: ClusPro (Kozakov et al., 2017), GRAMM (Katchalski‐Katzir et al., 1992), HDOCK (Yan et al., 2020), ZDOCK (Pierce et al., 2014), and pyDock (Jiménez‐García et al., 2013). These algorithms provide a variety of anchoring positions and orientations, which were subsequently screened up to select only eight possible binding modes (Figure 6) on the basis of some simple criteria, again solely based on our previous experimental results. As a first criterion, when two distinct docking poses obtained with the same algorithm were anchored to PADI4 in a symmetric fashion, this was considered equivalent to the prediction of a single binding mode, because the binding stoichiometry we had found by using ITC (Figure 3c) consists of two monomers of N‐MDM2 bound to a sole PADI4 homodimer. For instance, the best two docking poses obtained by ClusPro were located in a similar fashion on each monomer, leading to a single prediction for the molecular complex (Figure S5). As a second criterion, any docking pose was excluded if it overlapped with its symmetrical image when the two were considered together. In fact, their actual existence would be mutually exclusive and, therefore, incompatible with the binding stoichiometry expected. This condition eliminated all of the docking poses predicted by GRAMM, as well as most of the those predicted by HDOCK, with the except for a pair of symmetrical poses. As a third criterion, a maximum of three binding modes were considered for each predictor, when they were too similar to each other. This criterion is normally satisfied in the output of most docking algorithms, but it was necessary in our case to reduce the number of predictions of ZDOCK, which essentially clustered in a single conformation for each monomer of PADI4. Finally, the poses predicted by pyDock were eliminated upon visual inspection because they appeared little anchored to the surface of PADI4, with the sole exception of the best docking conformation bound to the catalytic site of PADI4.
FIGURE 6.
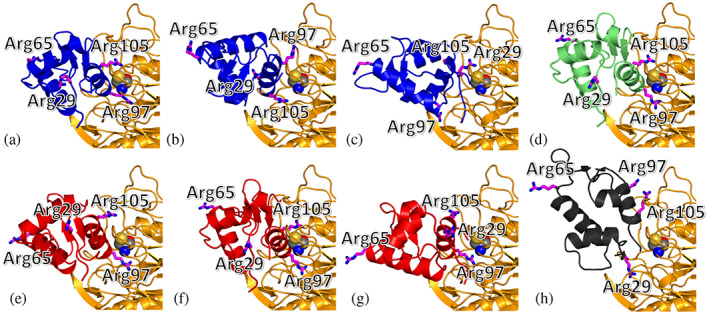
Simulated binding locations of N‐MDM2 on the surface of PADI4. Structures are predicted by using molecular docking, considering the sole p53‐binding domain (residues 25–109) of N‐MDM2, and obtained by using (blue) ClusPro [54], (green) HDOCK (Yan et al., 2020), (red) ZDOCK (Pierce et al., 2014), and (black) pyDock (Jiménez‐García et al., 2013). A detail of the hot‐spot location on the surface of PADI4 (yellow) is shown, with the key catalytic residue Cys645 in van der Waals representation. (a) Pose 1 and 2 of ClusPro; (b) pose 3 and 4 of ClusPro; (c) pose 7 and 8 of ClusPro; (d) pose 3 and 4 of HDOCK; (e) pose 1 of ZDOCK; (f) pose 2 of ZDOCK; (g) pose 3 and 4 of ZDOCK; (h) pose 7 of pyDock. The Arg residues (magenta) of N‐MDM2 are explicitly shown and labeled.
The eight docking poses obtained at the end of the screening procedure represent alternative binding modes that may coexist (although with different statistical weights) in the thermodynamic ensemble of the PADI4/MDM2 complex, as they can interconvert in solution. The predictions of all the docking programs were further re‐scored by using MM/GBSA, one of the most popular techniques to estimate the free energy of the binding of a biomolecular complex in simulation. This procedure was performed for several reasons: (i) to use a more accurate methodology to calculate the binding score of the docking poses; (ii) to compare on a common ground the results of the different docking predictors, for obtaining a single classification for all the poses; (iii) to provide a quantitative value of the affinity of the docking poses, besides their relative position in an energy ranking list; and (iv) to decompose the free energy of binding in distinct per‐residue contributions.
The main results of the re‐scoring procedure are summarized in Table 1. It appears clear that the best results were those obtained by using ClusPro as docking algorithm. In particular, in the highest ranked model of the complex (Figure S5), the p53‐binding domain interacted closely with the catalytic residue Cys645 of PADI4 by means of the two pairs of consecutive residues Arg97‐Lys98 and Tyr104‐Arg105. The best docking poses found by using both HDOCK and ZDOCK, although having a binding affinity significantly less favorable compared to the top prediction of ClusPro (−55.21 and −69.66 kcal mol−1 vs. −112.33 kcal mol−1, respectively), had a similar position and orientation (RMSD <2 Å). In contrast, pyDock was found to be less accurate than the other predictors, suggesting that the geometry of the encounter complex proposed by this algorithm has likely little specificity.
TABLE 1.
Docking poses of the p53‐binding domain of N‐MDM2 to the host structure of PADI4, obtained from different predictors and ranked by using the MM/GBSA technique, with total binding affinity and per‐residue contribution (in parentheses).
| Docking algorithm | Pose rank | Binding affinity (kcal mol−1) | Best contributions to binding affinity (kcal mol−1) | |
|---|---|---|---|---|
| PADI4 | MDM2 | |||
| ClusPro | 1, 2 | −112.33 | Phe634 (−6.99), Thr635 (−5.71), Asp473 (−5.68) | Arg97 (−12.91), Tyr104 (−6.98), Arg105 (−4.96) |
| ClusPro | 3, 4 | −91.38 | Phe633 (−7.47), Asp345 (−4.67), Ser402 (−4.05) | Arg97 (−6.48), Arg105 (−5.48), Thr26 (−4.82) |
| ClusPro | 7, 8 | −74.14 | Gln349 (−8.25), Phe576 (−6.49), Tyr636 (−4.47) | Arg97 (−6.97), Met50 (−6.27), Thr26 (−5.74) |
| ZDOCK | 2* | −69.66 | Phe634 (−4.55), Phe633 (−4.52), Thr635 (−4.06) | Arg97 (−7.30), Tyr104 (−5.56), Val108 (−2.68) |
| HDOCK | 3, 4 | −55.21 | Phe634 (−3.78), Ser312 (−3.74), Thr635 (−3.73) | Arg105 (−6.52), Arg97 (−4.71), Thr26 (−3.10) |
| ZDOCK | 1* | −51.83 | Ile313 (−4.13), Asp632 (−3.95), Glu642 (−3.63) | Arg97 (−12.7), Lys31 (−5.74), Arg105 (−4.11) |
| ZDOCK | 3,4 | −42.97 | Phe634 (−5.34), Gln346 (−3.34), Asp632 (−3.30) | Arg105 (−8.06), Arg97 (−6.78), Lys31 (−3.76) |
| pyDock | 7* | −25.78 | Phe633 (−5.10), Phe634 (−4.08), Tyr636 (−3.58) | Arg29 (−5.32), Arg105 (−2.75), Leu27 (−2.62) |
Single docking pose, missing a similar symmetric pose bound to the other monomers of the homodimeric structure of PADI4.
Some interesting conclusions can be drawn by analyzing the binding interface calculated for the two proteins, on the basis of the residues providing the largest contribution to the calculated binding affinity. As shown in Figure 7, the docking poses selected from all the predictors are clustered on a single position on the surface of PADI4, which is approximately centred on the catalytic site of the protein with significant accuracy. This observation is intriguing due to the relatively large surface area of PADI4, and because of the protocol of blind docking adopted in the search did not make any prior assumption on the binding pocket. The result obtained strongly suggests that the competitive binding observed in our in cellulo experiments (Figure 2) is not due to an allosteric effect, and that N‐MDM2 targets directly the active site of PADI4 not only with a good affinity, but also with a high specificity.
FIGURE 7.
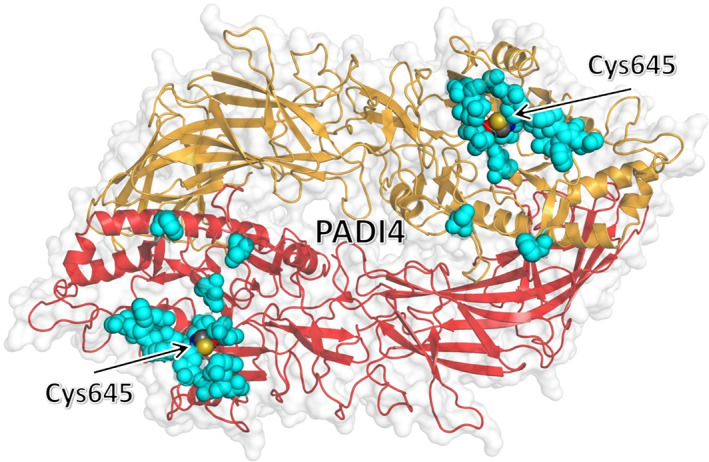
Clustering of residues of PADI4 with the most favorable affinity toward the p53‐binding domain of N‐MDM2. Top three residues of PADI4 with the most favorable binding affinity to each of the eight selected docking poses, as obtained by using MM/GBSA with per residue decomposition (Table 1), are shown (cyan) in van der Waals representation. The key catalytic residue Cys645 is also explicitly shown and labeled. The two chains of the homodimeric structure of PADI4 are represented in different colors.
It is also evident that in all the docking poses found there is an arginine of N‐MDM2 involved as the residue contributing the most to the binding energy in the association of the two proteins (Table 1). Moreover, in most of the docking complexes a second arginine is also present among the other top residues ranked in terms of their most favorable affinity toward PADI4. Since only four arginine residues are present in the p53 domain of N‐MDM2, their affinity toward the catalytic site of PADI4 on the basis of the simulation results can be ranked as follows: Arg97 ≳ Arg105 > Arg29 > Arg65. We note that, although our simulations cannot provide evidence of the citrullination of MDM2, the direct and favorable interaction of these arginines with the active site of PADI4—both in terms of geometry (Figure 6) and affinity (Table 1)—coupled with the high reactivity of the catalytic centre of this protein strongly supports this hypothesis, especially for Arg97 and Arg105. We also stress that our simulation findings have a good agreement with the NMR results, because most of the residues with the highest contribution to the binding affinity of the complex correspond to those whose NMR signals were affected by the binding to PADI4, either exactly or shifted by 1–2 residues (Figure 4b, Table 1).
2.5. Inhibition of PADI4 enhanced temozolomide (TMZ) effect on GBM cells
We observed a strong decrease in the population of MDM2/PADI4 complexes formed at the nucleus of the GBM cell line upon GSK484 treatment (Figure 2). It has been shown that the inhibition of MDM2 expression leads to down‐regulation of O6‐methylguanine methyltransferase (MGMT) enhancing tumor cell sensitivity to the main GBM treatment: the use of the oral alkylating agent TMZ (Sato et al., 2011), which methylates the DNA and triggers the death of tumor cells. Some drugs can bind to proteins that are responsible of drug resistance or, alternatively, relevant in cancer treatment. The sequential application of several drugs, used for different purposes, can have an impact on the cells at different extent; for instance, the co‐administration of a PADI inhibitor and an androgen receptor signal transduction inhibitor hampered tumor growth in prostate cancer and cell proliferation (Wang et al., 2017). In that way, the use of TMZ in combination with other drugs can increase its cytotoxicity at a much lower concentration than when used in isolation (Chakravarty et al., 2021). Therefore, we speculated that the treatment of GBM tumor cells by TMZ could be also enhanced by the presence of GSK484. For this reason, we carried out a first experiment, where the concentration of the inhibitor was increased while that of TMZ was kept constant. TMZ contains a methyl group that modifies the purine DNA bases (O6‐guanine; N7‐guanine and N3‐adenine) in cells. The addition in the first place of this drug, results in an alkylating modification, and therefore may have an impact on the cells for a possible GSK484 action on PADI4, although the exact details of the mechanism are unknown. Then, we also treated the cells firstly with a constant concentration of TMZ, followed by GSK484 increasing concentrations, to experimentally explore the effect of inhibition of PADI4 on cells whose purine bases had been previously alkylated.
To ensure that single treatments did not affect GBM cell line proliferation, we performed monotherapy experiments at low dosages with the two drugs (Figure 8a,b). First, we observed that a range of GSK484 treatment between 1 and 6 μM led to no effect in proliferation of HGUE‐GB‐42 cells (Figure 8a). Similarly, low dosage of TMZ ranging between 1 and 12 μM did not significantly reduce their proliferation either (Figure 8b).
FIGURE 8.
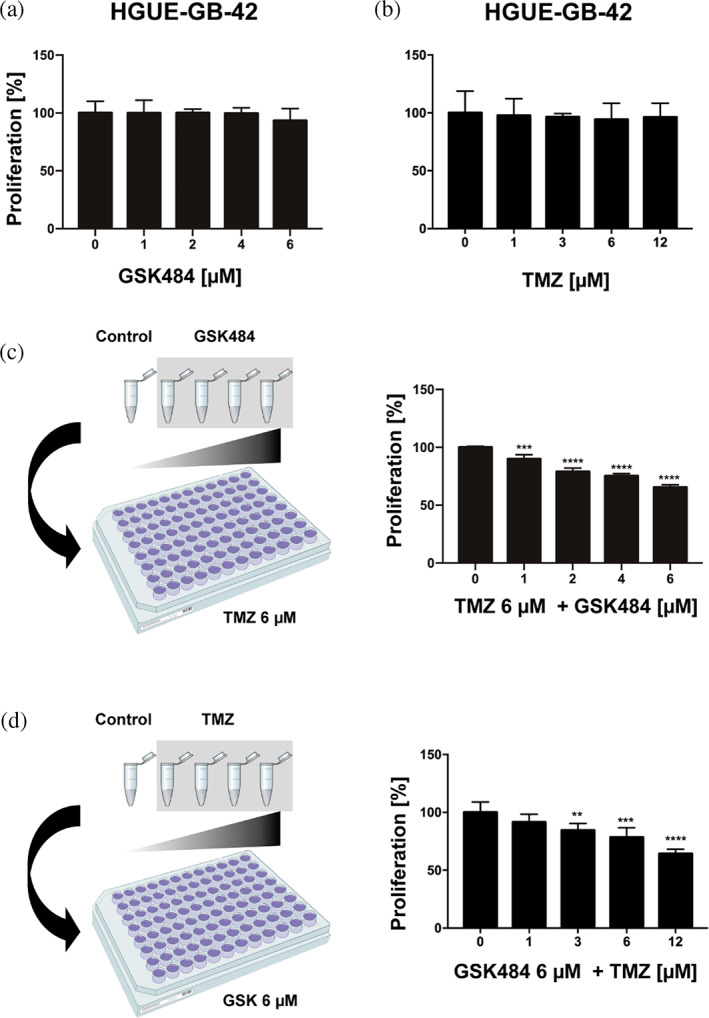
Combinatorial effect of GSK484 and TMZ. Monotherapy applied to GBM cell line HGUE‐GB‐42 with GSK484 (a) and TMZ (b). (c) Scheme and measurements showing the proliferation assays made keeping a constant concentration of 6 μM TMZ and increasing those of GSK484. (d) Scheme and measurements showing the proliferation assays made keeping a constant concentration of 6 μM GSK484 and increasing those of TMZ. Asterisks indicate the statistical significance of the results (**p < 0.01, ***p < 0.001, ****p < 0.0001).
To test whether the combination of both compounds had an impact on GBM proliferation, we treated the cells at a TMZ constant concentration of 6 μM, that was previously reported to have no effects (Figure 8b). That constant TMZ concentration was administered together with increasing concentrations of GSK484, at the same range of low concentrations, at which monotherapy did not alter proliferation (Figure 8a). Our experiments showed that such combined treatment of GBM cells resulted in a significant decrease of proliferation, which was highly dependent on the GSK484 concentration (Figure 8c). We also performed the reverse experiment where the cells were treated with a constant concentration of 6 μM of GSK484. Concomitantly, cells were treated with increasing concentrations of TMZ ranging from 1 to 12 μM, also resulting in a significant decrease of cell proliferation (Figure 8d). These results demonstrate the synergistic effect of the two drugs, opening the venue for new treatments based on the additive effect that PADI4 inhibition might have, in combination with other drugs approved for different types of cancers.
3. DISCUSSION
Cancer accounts for nearly one in six deaths corresponding to around 10 million deaths in 2020 (Sung et al., 2021). To ensure more effective treatments, we need to improve not only the identification of aggressive tumors at an earlier stage, but also to increase the efficiency of therapies against current cancer targets, or alternatively to find new ones (Adashek et al., 2021). This would not only improve the quality of cancer patients lives, but would also enhance survival rates of patients for many types of cancers. Given the importance of PADI4 and MDM2 in cancer, we discuss the possible implications of this new interaction for tumor development and progression.
We observed that the inhibition of PADI4 by GSK484 enhanced the sensitivity to an oral DNA alkylating agent, TMZ, the current main GBM treatment. The combination of these two compounds had a synergistic effect that led to a decrease in GBM cell proliferation, which neither of the isolated drugs could achieve independently. These results might lead to more effective treatments to enhance the effects of other approved drugs against cancer, by using GSK484 against PADI4 in several protein routes. The observed different effects on several cancer cell lines (Section 2.1) is related to the different cross‐talk routes where PADI4 can intervene. For instance, in epithelial‐to‐mesenchymal transition (EMT), PADI4 inhibition results in different outcomes in multiple cancer cell lines. In breast cancer, PADI4 acts through glycogen synthase kinase 3 beta GSK3β; whereas in lung cancer, the inhibition of PADI4 increases the ETS‐domain containing protein (Elk1) expression. On the other hand, in colon cancer, citrullination of the extracellular matrix by PADI4 promotes the EMT, and therefore cancer progression (Yuzhalin et al., 2018). We do not know exactly how the combination of TMZ (acting on DNA) and GSK484 (acting on PADI4) results in a synergistic effect in the cells, but it could probably involve a combined action on several proteins along the pathway, at least one of which implies handling of modified DNA (due to the TMZ effect). We hypothesized that a direct interaction of intact MDM2 with PADI4 could take place through the N‐terminal region of MDM2, the N‐MDM2, which also intervenes in the interaction with the S100 proteins (van Dieck et al., 2010) and the sterile alpha motif (SAM) of p73, SAMp73 (Neira et al., 2019). The results of our in vitro experiments support that hypothesis clearly demonstrating the binding of N‐MDM2 and PADI4. In addition, the NMR experiments indicated that the PADI4‐binding region of N‐MDM2 comprised Thr26, Val28, Gln44– all involved in several loops–, and Phe91 and Lys98– forming the C‐terminal α‐helix. These two latter residues are close, but they do not belong to the region implicated in the binding to the TA of p53; however, different protein partners (either PADI4 or p53) might elicit different changes in the structure of MDM2 to modulate functions in several cellular processes. Except for the above indicated residues, and those whose side chains could be titrating at the pH where experiments were acquired, the chemical shifts of the amide protons of residues of N‐MDM2 did not change substantially in the presence of PADI4 (Figure 4a), indicating that the secondary structure of N‐MDM2 was not modified dramatically upon binding to PADI4. Therefore, the observed changes in the far‐UV CD spectra must occur in the backbone of PADI4, in the disordered N‐ and C‐terminal regions of MDM2 (which are not observed in the NMR spectra), or alternatively in the orientation of some aromatic residues of any of the two proteins (Figure 3a, right panel). For instance, it has been shown that the side‐chains of His96 and Tyr100 move away in the presence of TA of p53 to allocate the side‐chain of Pro27 of p53. Interestingly enough, residues Ile99 and Tyr100 showed split resonances in the 1H‐15N HSQC spectra of isolated N‐MDM2, indicating a slow conformational equilibrium exchange in such region (Uhrinova et al., 2005). We hypothesize that similar changes in the side‐chains of His96 and Tyr100, both close enough to Phe91 and Lys98, can occur in the presence of PADI4, explaining the variations in the far‐UV CD spectra.
ITC experiments demonstrating the interaction between N‐MDM2 and the intact p53 have provided a value of ~0.30 ± 0.01 μM for the dissociation constant of the complex (Schon et al., 2002; Schon et al., 2004; Yu et al., 2006). These values are comparable to the one measured between N‐MDM2 and the TA of p53: 0.10 ± 0.03 μM (Kussie et al., 1996; Lai et al., 2000). Furthermore, the core region of p53 (residues 93–293) also binds to the acidic domain and part of the zinc finger domain of MDM2 with similar values of affinity (0.1–0.3 μM, depending on the MDM2 region explored) (Yu et al., 2006). All these values are within the same range determined in this work for the interaction between N‐MDM2 and PADI4 (Figure 3c,d), by ITC (K d = 1.0 ± 0.2 μM). Similar, but slightly larger figures have been found when the binding between N‐MDM2 and SAMp73 has been studied: 8 ± 3 μM by fluorescence, or 18 ± 6 μM by BLI (Neira et al., 2019). Thus, it seems that the affinity of N‐MDM2 for any of its partners is in the low micromolar region, further pinpointing that PADI4 should be among the canonical binding proteins of intact MDM2.
A close look into the N‐MDM2 region involved in binding to PADI4 further indicates which arginine residues could be the potential citrullination sites. The N‐MDM2 has four arginines: Arg29, Arg65, Arg97 and Arg105. Three of them are close to residues having the largest conformational shifts: Arg29 (close to Val28), Arg97 and Arg105 (both close to Lys98). (Figure 4 B). The simulation results support the idea that some of those arginines are candidates to be citrullinated by PADI4. More specifically, they exclude access of Arg65 to the active site of PADI4; they suggest as possible, but unlikely, an interaction of Arg29; and they point out to Arg97 and Arg105 as the most likely candidates. Although molecular docking cannot demonstrate directly that the citrullination reaction will take place, there is a very favorable interaction geometry and affinity of the enzymatic site of PADI4 with Arg97, which is close to His96. However, we could not unambiguously conclude that their chemical shifts were only affected by the presence of PADI4 because of its titrating imidazole side‐chain. Moreover, Arg97 is close to Ile99, which forms the pocket where Leu26 of p53 is located in the complex with such protein, and therefore, it could hamper the binding of p53, suggesting a potential role of PADI4 in the mechanism of degradation and regulation of p53 by MDM2.
There is a relationship between p53 pathways and citrullination, where PADI4 citrullinates the nuclear localization signal of ING4, preventing ING4 binding to p53 (Guo & Fast, 2011).The lack of ING4/p53 association hampers ING4‐promoted‐p53‐acetylation and the expression of p21. Furthermore, in several PADI4‐overexpressing cancer cells, the use of PADI4 inhibitors or PADI4 siRNA raised the expression of p53 target genes, resulting in apoptosis and cell cycle arrest (Yao et al., 2008). Moreover, p53 transactivates PADI4 through an intronic p53‐binding site, but, the relationship with MDM2 has never been studied (Tanikawa et al., 2009). We hypothesize that MDM2 might be a non‐histone substrate, which could add to the well‐known list of substrates of the PADI4 enzyme, such as ING4, p300 or GSK3β (Zhu et al., 2022). MDM2 not only regulates p53 function by mediating its export from the nucleus in a manner that involves mono‐ubiquitination and SUMOylation (Brooks & Gu, 2011), but it can also self‐ubiquitinate. MDM2 can also be SUMOylated (Chen & Chen, 2003), phosphorylated (Li & Kurokawa, 2015), and acetylated. Then, as regulation of MDM2 takes place at multiple levels including transcriptional, post‐transcription, and even by protein modification through ubiquitination, it would not be surprising that MDM2 might also be citrullinated. Taken all together, our study opens up venues for understanding the basis of molecular mechanism of cancers although, given the promiscuity of PADI4 in the interaction with several proteins, further studies are necessary to translate these findings into possible therapeutic applications.
4. MATERIALS AND METHODS
4.1. Materials
Imidazole, Trizma base, DNase, SIGMAFAST protease tablets, NaCl, Ni2+‐resin, temozolamide (TMZ), 3‐(4,5‐Dimethylthiazol‐2‐Yl)‐2,5‐Diphenyltetrazolium bromide (MTT), dimethyl sulfoxide (DMSO), DAPI (4′,6‐diamidino‐2‐phenylindole) and Amicon centrifugal devices with a molecular weight cut‐off of 3 or 30 kDa were from Sigma (Madrid, Spain). The β‐mercaptoethanol was from BioRad (Madrid, Spain). Ampicillin and isopropyl‐β‐D‐1‐thiogalactopyranoside were obtained from Apollo Scientific (Stockport, UK). Triton X‐100, Tris(2‐carboxyethyl)phosphine (TCEP), dialysis tubing with a molecular weight cut‐off of 3500 Da and the SDS protein marker (PAGEmark Tricolor) were from VWR (Barcelona, Spain). Thrombin and GST‐resin were from GE Healthcare (Barcelona, Spain). The rest of the used materials were of analytical grade. Water was deionized and purified on a Millipore system.
4.2. Protein expression and purification
The dimeric PADI4 (with 663 residues per monomer) and monomeric His‐tagged N‐MDM2 (residues 6–125 of the intact protein) were purified as previously described (Neira et al., 2019; Neira, Araujo‐Abad, et al., 2022). The first five residues of N‐MDM2 were missing due to optimization of cloning sequence. For BLI experiments, GST‐tagged‐N‐MDM2 was produced as described (Yadahalli et al., 2019) and the GST‐tag was removed by using thrombin on the same GST‐column. For the 15N‐labeled His‐tagged N‐MDM2, BL21 cells were grown in M9 minimal medium supplemented with 1 g of 15NH4Cl per liter of media, and the protein was purified as that obtained in rich media. In all cases, protein concentrations were determined by UV absorbance, employing an extinction coefficient at 280 nm estimated from the number of tyrosines and tryptophans in each of these proteins (Gill & von Hippel, 1989). The construct of His‐tagged N‐MDM2 has eight tyrosines, that of GST‐tagged‐N‐MDM2 has seven tyrosines and PADI4 has 10 tryptophans and 13 tyrosines per monomer.
4.3. Cell lines
Isolation of the primary human GBM cell line (HGUE‐GB‐42) was performed from surgical washes, as reported previously (Ventero et al., 2019). Human pancreatic adenocarcinoma (RWP‐1) and colorectal cancer (SW‐480) cell lines were donated by Instituto Municipal de Investigaciones Médicas (IMIM, Barcelona, Spain) (Fuentes‐Baile et al., 2020). The RWP‐1 and SW‐480 cell lines were cultured in Dulbecco's Modified Eagle's Medium: High Glucose (DEMEM‐HG) (Biowest, MO, USA). The GBM cells were cultured in Dulbecco's Modified Eagle's Medium: Nutrient Mixture F‐12 (DMEM F‐12) (Biowest, MO, USA), supplemented with 10% (v/v) heat‐inactivated fetal bovine serum (FBS) (Capricorn Scientific, Ebsdorfergrund, Germany) and 1% (v/v) penicillin/streptomycin mixture (Biowest, MO, USA). Cells were incubated at 37°C in a humidified 5% CO2 atmosphere as previously described (Fuentes‐Baile et al., 2021; Ventero et al., 2019).
4.4. Immunofluorescence
An amount of 30,000 cells of HGUE‐GB‐42, SW‐480 and RWP‐1 cell lines were seeded into 24‐well plates on coverslips. After 24 h, they were fixed with paraformaldehyde at 4% concentration and blocked with FBS/PBS (phosphate buffered saline) (1×) (50 μL/mL). Next, cells were incubated with anti‐PADI4 (1:200, mouse; Abcam, Cambridge, UK) and anti‐MDM2 (1:100, rabbit, Invitrogen, Barcelona, Spain) primary antibodies. After washing out the first antibody, cells were incubated with Alexa Fluor 568‐labeled anti‐mouse (1:500) and Alexa Fluor 488‐labeled anti‐rabbit (1:500) secondary antibodies (Invitrogen, Barcelona, Spain); the DAPI reagent was used to stain the nucleus. Coverslips were mounted in Prolong™ Gold Antifade Reagent (Invitrogen, Barcelona, Spain) and analyzed using a Zeiss Axioscope 5 microscope with the LED light source Colibri 3 (Carl Zeiss, Oberkochen, Germany).
4.5. Proximity ligation assay
An amount of 30,000 cells of HGUE‐GB‐42, SW480 and RWP‐1 cell lines were seeded in 24‐well plates on coverslips to perform the experiments, either in the absence or the presence of GSK484 (at a final concentration of 20 μM). Experiments were carried out at either 6 or 24 h; control experiments were carried out with 6 h. After the corresponding time, cells were washed twice in PBS (1×), fixed, washed twice again, permeabilized in PBS, with 0.2% Triton X‐100, and saturated with blocking solution for 30 min before immune‐staining with Duolink by using PLA Technology (Merck, Madrid, Spain), following the manufacturer's protocol. Anti‐PADI4 and anti‐MDM2 primary antibodies were used. Then, slides were processed for in situ PLA by using sequentially the Duolink In Situ Detection Reagents Red, Duolink In Situ PLA Probe Anti‐Mouse MINUS, and Duolink In Situ PLA Probe Anti‐Rabbit PLUS (Merck, Madrid, Spain). In these experiments, red fluorescence corresponds to the PLA‐positive signal, and it indicates that the two proteins are bound, forming a protein complex. Blue fluorescence corresponds to nuclei (DAPI staining). Both negative and positive control experiments, the former by omitting one of the primary antibodies, were performed. Image acquisition was carried out by using an Axio Observer Z1 inverted microscope (Carl Zeiss, Oberkochen, Germany) at ×63 magnification.
4.6. Proliferation assays
The HGUE‐GB‐42, SW480 and RWP‐1 cell lines were seeded in 96‐well standard plates (Sarstedt, Nümbrecht, Germany) with a density of 4000 cells/well and incubated at 37°C in the presence of 5% CO2 for 24 h. Subsequently, cells were treated with increasing concentrations of one of the drugs—either the PADI4 enzyme inhibitor (GSK484) or TMZ—for 72 h under the same conditions. Then in any of the experiments, 0.25 mg/mL of MTT were added and the samples were incubated for 3 h; afterwards, the medium was removed and 100 μL of DMSO were added. The plate was shaken at room temperature for 20 min to dissolve the formed formazan crystals. Finally, the absorbance was measured on an Eon™ Microplate Spectrophotometer (BioTeK®, Winooski, VT, USA) at 570 nm.
Experiments with HGUE‐GB‐42 were carried out with GSK484, in concentrations ranging between 1 and 6 μM. Similarly, dosage of TMZ with the same cell lines ranged between 1 and 12 μM. For the first series of experiments in the presence of both compounds, the concentration of TMZ was kept constant at 6 μM, whereas that of GSK484 was increased in the range described above. For the second series of experiments in the presence of both compounds, the concentration of GSK484 was kept constant at 6 μM, whereas that of TMZ was increased in the range described above.
4.7. Fluorescence
4.7.1. Steady‐state fluorescence
Fluorescence spectra were collected on a Cary Varian spectrofluorometer (Agilent, Santa Clara, CA, USA), interfaced with a Peltier unit. Following the standard protocols used in our laboratories, the samples were prepared the day before and left overnight at 5°C; before experiments, samples were left for 1 h at 25°C. A 1‐cm‐pathlength quartz cell (Hellma, Kruibeke, Belgium) was used. Concentration of PADI4 was 3 μM (in protomer units), and that of N‐MDM2 was 20 μM. Experiments were performed in 20 mM Tris buffer (pH 7.5), 5 mM TCEP, 150 mM NaCl and 5% glycerol. Protein samples were excited at 280 and 295 nm. The other experimental parameters have been described elsewhere (Neira et al., 2016). Appropriate blank corrections were made in all spectra. Fluorescence experiments were repeated in triplicates with newly prepared samples. Variations of results among the experiments were lower than 10%.
4.7.2. Binding experiments with PADI4
For the titration between N‐MDM2 and PADI4, increasing amounts of the monomeric N‐MDM2 species, in the concentration range 0–20 μM, were added to a solution with a fixed concentration of PADI4 (2.8 μM in protomer units). The samples were prepared the day before and left overnight at 5°C; before the measurements, they were incubated for 1 h at 25°C. Experiments were carried out in the same buffer used for the steady‐state experiments. The samples were excited at 280 and 295 nm, and the rest of the experimental set‐up was the same described above. In all cases, the appropriate blank‐corrections were made by subtracting the signal obtained with the corresponding amounts of N‐MDM2 by using the software KaleidaGraph (Synergy software, Reading, PA, USA). Spectra were corrected for inner‐filter effects during fluorescence excitation (Birdsall et al., 1983). The titration was repeated three times, using new samples; variations in the results were lower than 10%.
The dissociation constant of the corresponding complex, K d, was calculated by fitting the binding isotherm constructed by plotting the observed fluorescence change as a function of N‐MDM2 concentration to the general binding model, explicitly considering protein depletion due to binding (Beckett, 2011; Royer & Scarlata, 2008):
| (1) |
where F is the measured fluorescence at any particular concentration of N‐MDM2 after subtraction of the spectrum of sample containing only the same concentration of such protein (i.e., F is the differential, or difference fluorescence); ΔF max is the largest change in the fluorescence of N‐MDM2 when all polypeptide molecules were forming the complex, compared to the fluorescence of each isolated protein (at the same corresponding concentration); F 0 is the fluorescence intensity when no N‐MDM2 was added; [PADiI4]T is the constant, total concentration of PADI4 (2.8 μM in protomer units); and [N‐MDM2]T is that of N‐MDM2, which was varied during the titration. Fitting to Equation (1) was carried out by using KaleidaGraph (Synergy software, Reading, PA, USA).
4.8. Circular dichroism
Far‐UV CD spectra were collected on a Jasco J810 spectropolarimeter (Jasco, Tokyo, Japan) with a thermostated cell holder and interfaced with a Peltier unit. The instrument was periodically calibrated with (+)‐10‐camphorsulfonic acid. A cell of path length 0.1 cm was used (Hellma, Kruibeke, Belgium). Spectra were corrected by subtracting the corresponding baseline. Polypeptides concentrations and the buffers were the same used in the fluorescence experiments.
Isothermal spectra of each isolated macromolecule and that of the complex were acquired at 25°C as an average of 6 scans, at a scan speed of 50 nm/min, with a response time of 2 s and a band‐width of 1 nm. Samples were prepared the day before and left overnight at 5°C to allow them to equilibrate. Before starting the experiments, samples were further left for 1 h at 25°C.
4.9. Nuclear magnetic resonance
The NMR experiments were acquired in a 600 MHz (1H) Bruker AVNEO spectrometer, (Karlsruhe, Germany) equipped with a z‐gradient cryoprobe. Spectra were acquired at 25°C in 20 mM Tris buffer (pH 7.5), 5 mM TCEP, 150 mM NaCl, 10 mM EDTA, and 5% glycerol with 50 μL of D2O; probe temperature was calibrated with a methanol NMR standard (Cavanagh et al., 2007).
The cross‐peaks in the 2D 1H‐15N HSQC NMR spectra (Bodenhausen & Ruben, 1980) of N‐MDM2 were identified by using previously determined assignments (BMRB number 6612) (Uhrinova et al., 2005). The sample containing the mixture of N‐MDM2 and PADI4 was prepared by using Amicon centrifugal devices of 3 kDa cut‐off, in which both proteins were initially mixed at diluted concentrations in the above indicated buffer, and then, concentrated in the same buffer; any possible precipitation in the Amicon devices was removed during the concentration step. For the isolated N‐MDM2 the buffer was the same, with a final protein concentration of 95 μM. In the sample of the complex, the concentration of N‐MDM2 was the same, and that of PADI4 was 234 μM (in protomer units). The pH of both samples (complex and isolated N‐MDM2) was measured after removal from the Amicon device with an ultra‐thin electrode. Spectra were processed with TopSpin 4.1.3 (Bruker, Karlsruhe, Germany).
Chemical shift perturbations (CSPs) for every cross‐peak in the spectra of either isolated N‐MDM2 or the complex were calculated as:
| (2) |
4.10. Isothermal titration calorimetry
Calorimetric titrations for assessing the interaction of PADI4 with N‐MDM2 were carried out in an automated high‐sensitivity Auto‐iTC200 calorimeter (MicroCal, Malvern‐Panalytical, Malvern, UK). Experiments were performed at 25°C in 20 mM Tris buffer (pH 7.5), 5 mM TCEP, 150 mM NaCl and 5% glycerol at 25°C. PADI4 (100 μM in protomer units) in the injection syringe was titrated into the N‐MDM2 solution (10 μM) in the calorimetric cell. A series of 19 injections with 2 μL volume, 0.5 μL/s injection speed, and 150 s time spacing was programmed while maintaining a reference power of 10 μcal/s and a stirring speed of 750 rpm. The heat effect per injection was calculated by integration of the thermal power raw data after baseline correction, and the interaction isotherm (ligand‐normalized heat effect per injection as a function of the molar ratio) was analyzed by non‐linear least‐squares regression data analysis, applying a model that considers a single binding site to estimate the association constant, K a; the interaction enthalpy, ΔH; and the stoichiometry of binding, n (although, in practice, the apparent stoichiometry n usually reports the fraction of active protein in the calorimetric cell). The background injection heat (usually called “dilution heat,” but reflecting any unspecific phenomenon such as solute dilution, buffer neutralization, temperature equilibration or solution mechanical mixing) was accounted for by including an adjustable constant parameter in the fitting equation. Due to the presence of glycerol in solution, the background injection heat was rather large. The data analysis was conducted in Origin 7.0 (OriginLab, Northampton, MA, USA) with user‐defined fitting functions.
4.11. Biolayer interferometry
4.11.1. Experimental design of BLI experiments
The association (k on) and dissociation (k off) rate constants of the binding of N‐MDM2 to PADI4 were determined by using a BLItz system (ForteBio, Pall, Barcelona, Spain) (Frenzel & Willbold, 2014). The buffer used in the experiments was that recommended by the manufacturer. As PADI4 had a His‐tag, it was immobilized on His‐tag biosensors (Forte Bio) at 0.45 μM, and we used N‐MDM2 derived from a GST‐tagged protein, where the tag had been removed. Experiments were carried out at 25°C. The N‐MDM2 concentrations were in the range from 1 to 9 μM during the association step. The general schemes of the protein association/dissociation reactions in the BLItz system were: 30 s of acquisition of the initial baseline with the 10 × kinetics buffer; 120 s of loading PADI4 into the biosensor; 30 s of baseline with the 10 × kinetics buffer; 120 s of association of N‐MDM2 to the biosensor (which had been previously loaded with PADI4); and 120 s of dissociation of N‐MDM2 from the biosensor.
4.11.2. Fitting of the sensorgrams
Fittings of the sensorgrams was carried out by using KaleidaGraph (Synergy software, Reading, PA, USA) (Pantoja‐Uceda et al., 2016). The interferometry response during the association step, R(t) (measured in response units, RU), and the binding rate, dR(t)/dt, can be used to evaluate the kinetics of the formation of the N‐MDM2/PADI4 complex, according to:
| (3) |
where R max is proportional to the total concentration of biosensor‐bound PADI4; and [N‐MDM2] represents the corresponding concentration of N‐MDM2.
In Equation (3), R(t) is given by:
| (4) |
where R eq is the steady‐state (or equilibrium) response obtained at infinite time when dR(t)/dt = 0, and t 0 = 180 s is the time at which the association step between biosensor‐immobilized PADI4 and N‐MDM2 in the solution started. We fitted the experimentally obtained R(t) under any condition as:
| (5) |
since we observed a slope of the signal at the largest sensorgram acquisition times. The determined k obs was used for the pseudo‐first order plots, where its value is given by:
| (6) |
The dissociation process was always fitted to a single exponential, with R(t) given by:
| (7) |
where t 0 = 300 s is the time at which the dissociation of N‐MDM2 from the biosensor‐bound PADI4 started in our experimental set‐up, and R 1 is the response level when dissociation starts.
4.12. Molecular modeling and simulation
PADI4 was built in homodimeric form as previously described (Neira, Araujo‐Abad, et al., 2022), on the basis of the structure deposited in the Protein Data Bank (PDB) and obtained by x‐ray diffraction (PDB entry: 3APN; Horikoshi et al., 2011).
The structure of N‐MDM2 is present in numerous entries in the PDB database (>100 structures with sequence identity ≥98%), including a 24‐model ensemble of the unliganded protein in solution obtained by NMR (PDB entry: 1Z1M (Uhrinova et al., 2005)) as well as bound to a large variety of molecular partners (McCoy et al., 2003). Both the N‐terminal (residues 1–24) and C‐terminal region (residues 110–125) of N‐MDM2 are unstructured in the unliganded protein species. More importantly, they are generally not solved in the experimentally determined structure of the complexes—or absent in the protein construct used to obtain crystals. These observations suggest that the two termini of N‐MDM2 do not tend to acquire a structure when the protein is engaged in a complex, and may not be essential in the binding. Therefore, for our molecular docking simulations we considered the sole well‐folded N‐terminal domain of N‐MDM2, the so‐called p53‐binding domain, encompassing residues 25–109 (Marine et al., 2007).
The structure of the p53‐binding domain is essentially identical (deviations of backbone atoms <1 Å) in almost all the structures of N‐MDM2 reported in the PDB (McCoy et al., 2003). To avoid any potential bias due to choosing a specific experimental structure over any other, for our calculations we used the structure of the p53‐binding domain obtained from the AlphaFold Protein Structure Database (Varadi et al., 2022), entry Q00987. Models of the complex between PADI4 and the p53‐binding domain of MDM2 were built on the basis of the 10 most favorable conformations predicted by each of the following protein–protein docking servers: ClusPro (version 2.0) (Kozakov et al., 2017), GRAMM (current version) (Katchalski‐Katzir et al., 1992), HDOCK (version 2020) (Yan et al., 2020), pyDock (current version) (Jiménez‐García et al., 2013), and ZDOCK (version 3.0.2) (Pierce et al., 2014). All these algorithms were used with default parameters, and without specifying any preference or constraint on the possible binding hot‐spot of the two proteins.
After the protein–protein docking stage, the poses calculated with the different predictors were sieved to eliminate those that were not consistent with our experimental findings, leading to a smaller subset that was re‐scored by using a more accurate methodology to estimate the binding free energy, and evaluate its decomposition into contributions of each single residue. To this aim, MM combined with generalized Born surface area (MM/GBSA) continuum solvation was applied (Rizzuti, 2022), as implemented in the web server HawkDock (Weng et al., 2019). Interactions were calculated after an energy minimization of 5000 steps (steepest descent followed by the conjugate gradient algorithm for 2000 and 3000 cycles, respectively), using the Amber ff02 force field (Cieplak et al., 2001) and the implicit solvent GBOBC1 model (Onufriev et al., 2004) with interior dielectric constant εin = 1.
4.13. Statistical analysis
Results in the isolated or combined therapy (GSK484 and TMZ) are always shown as the mean ± standard deviation (SD) of three independent experiments. To evaluate the normal distribution of the data, the Shapiro–Wilk statistical test was used; either the Student's t‐test or the Mann–Whitney U test were used to analyze the association between variables. Differences were considered to be statistically significant with a p‐value <0.05. Statistical analysis was performed with GraphPad Prism v7.0a software (GraphPad Software Inc., San Diego CA, USA).
AUTHOR CONTRIBUTIONS
Conceptualization: José L. Neira, Bruno Rizzuti, Camino de Juan Romero and Adrián Velazquez‐Campoy. Methodology: Salomé Araujo‐Abad, José L. Neira, Camino de Juan Romero, Bruno Rizzuti and Adrián Velazquez‐Campoy. Investigation: José L. Neira, Salomé Araujo‐Abad, Adrián Villamarin‐Ortiz, David Pantoja‐Uceda, Celia M. Moreno‐Gonzalez, Bruno Rizzuti and Olga Abian. Data formal analysis: José L. Neira, Salomé Araujo‐Abad, Olga Abian, Adrián Villamarin‐Ortiz, David Pantoja‐Uceda, Celia M. Moreno‐Gonzalez, Bruno Rizzuti and Adrián Velazquez‐Campoy. Writing‐original draft preparation: Salomé Araujo‐Abad, David Pantoja‐Uceda, José L. Neira, Camino de Juan Romero, Bruno Rizzuti and Adrián Velazquez‐Campoy. Materials: José L. Neira, Camino de Juan Romero, Olga Abian, Bruno Rizzuti and Adrián Velazquez‐Campoy. Writing‐review and editing: José L. Neira, Olga Abian, Camino de Juan Romero, Bruno Rizzuti and Adrián Velazquez‐Campoy. Funding acquisition: José L. Neira, Camino de Juan Romero, Olga Abian and Adrián Velazquez‐Campoy. All authors have read and agreed to the published version of the manuscript.
FUNDING INFORMATION
This research was funded by Spanish Ministry of Economy and Competitiveness and European ERDF Funds (MCIU/AEI/FEDER, EU) [BFU2016‐78232‐P to Adrián Velazquez‐Campoy]; by Ministry of Science and Innovation MCIN/AEI/10.13039/501100011033/ and “ERDF A way of Making Europe” [PID2021‐127296OB‐I00 to Adrián Velazquez‐Campoy]; by Instituto de Salud Carlos III co‐funded by European Social Fund “Investing in your future” [CP19/00095 to Camino de Juan Romero] [PI22/00824 to Camino de Juan Romero] [PI18/00394 to Olga Abian]; by Diputación General de Aragón [“Protein targets and Bioactive Compounds group” E45‐20R to Adrián Velazquez‐Campoy, and “Digestive Pathology Group” B25‐20R to Olga Abian], and by Consellería de Innovación, Universidades, Ciencia y Sociedad Digital (Generalitat Valenciana) [CAICO 2021/0135 to Camino de Juan Romero and José L. Neira]. Salomé Araujo‐Abad was recipient of a “Carolina Foundation predoctoral fellowship 2020”. The funders had no role in the study design, data collection and analysis, decision to publish, or preparation of the manuscript.
CONFLICT OF INTEREST STATEMENT
The authors have no relevant financial or non‐financial interest to disclosure.
Supporting information
Data S1: There are three figures containing PLA images of PADI4 and MDM2 interaction, in the absence and presence of the GSK484 inhibitor (Figures S1–S3); one showing the structure of N‐MDM2 with the residues with the largest CSP values highlighted (Figure S4); and one showing the most favorable docking complex identified in the docking procedure (Figure S5).
ACKNOWLEDGMENTS
We thank Miguel Saceda for the use of the cancer cell lines. The inverted microscope (at Bioengineering Institute of the Miguel Hernández University) used to obtain high‐resolution images of our samples, was funded by the Fondo Europeo de Desarrollo Regional (FEDER)‐operational program 2007/2013. We would like to thank Dr. Eduardo Fernández Jover and his team for their kindness, generosity and their technical support and expertise in the use of the microscope. We deeply thank the two anonymous reviewers for their helpful comments and suggestions.
Araujo‐Abad S, Rizzuti B, Villamarin‐Ortiz A, Pantoja‐Uceda D, Moreno‐Gonzalez CM, Abian O, et al. New insights into cancer: MDM2 binds to the citrullinating enzyme PADI4 . Protein Science. 2023;32(8):e4723. 10.1002/pro.4723
Salomé Araujo‐Abad and José L. Neira are contributed equally to this work.
Review Editor: Aitziber L. Cortajarena
Contributor Information
José L. Neira, Email: jlneira@umh.es.
Camino de Juan Romero, Email: m.juan@umh.es.
DATA AVAILABILITY STATEMENT
The datasets generated during and/or analyzed during the current study are available from the corresponding authors on reasonable request.
REFERENCES
- Adashek JJ, Janku F, Kurzrock R. Signed in blood: circulating tumor DNA in cancer diagnosis, treatment and screening. Cancers (Basel) [Internet]. 2021;13:3600. Available from: https://pubmed.ncbi.nlm.nih.gov/34298813/ [DOI] [PMC free article] [PubMed] [Google Scholar]
- Beckett D. Measurement and analysis of equilibrium binding titrations: a beginner's guide. Methods Enzymol. 2011;488:1–16. [DOI] [PubMed] [Google Scholar]
- Birdsall B, King RW, Wheeler MR, Lewis CA, Goode SR, Dunlap RB, et al. Correction for light absorption in fluorescence studies of protein‐ligand interactions. Anal Biochem. 1983;132:353–361. [DOI] [PubMed] [Google Scholar]
- Bodenhausen G, Ruben DJ. Natural abundance nitrogen‐15 NMR by enhanced heteronuclear spectroscopy. Chem Phys Lett. 1980;69:185–189. [Google Scholar]
- Brooks CL, Gu W. p53 regulation by ubiquitin. FEBS Lett [Internet]. 2011;585:2803–2809. Available from: https://pubmed.ncbi.nlm.nih.gov/21624367/ [DOI] [PMC free article] [PubMed] [Google Scholar]
- Cavanagh J, Wayne J, Fairbrother WJ, Palmer AG III, Rance M, Skelton NJ. Protein NMR spectroscopy: principles and practice. New York: Academic Press; 2007. [Google Scholar]
- Chakravarty M, Ganguli P, Murahari M, Sarkar RR, Peters GJ, Mayur YC. Study of combinatorial drug synergy of novel Acridone derivatives with Temozolomide using in‐silico and in‐vitro methods in the treatment of drug‐resistant glioma. Front Oncol. 2021;11:640. [DOI] [PMC free article] [PubMed] [Google Scholar]
- Chen J, Marechal V, Levine AJ. Mapping of the p53 and mdm‐2 interaction domains. Mol Cell Biol. 1993;13:4107–4114. [DOI] [PMC free article] [PubMed] [Google Scholar]
- Chen L, Chen J. MDM2‐ARF complex regulates p53 sumoylation. Oncogene [Internet]. 2003;22:5348–5357. Available from: https://pubmed.ncbi.nlm.nih.gov/12917636/ [DOI] [PubMed] [Google Scholar]
- Cieplak P, Caldwell J, Kollman P. Molecular mechanical models for organic and biological systems going beyond the atom centered two body additive approximation: aqueous solution free energies of methanol and N‐methyl acetamide, nucleic acid base, and amide hydrogen bonding and chloroform/water partition coefficients of the nucleic acid bases. J Comput Chem [Internet]. 2001;22:1048–1057. 10.1002/jcc.1065 [DOI] [Google Scholar]
- Duan Q, Pang C, Chang N, Zhang J, Liu W. Overexpression of PAD4 suppresses drug resistance of NSCLC cell lines to gefitinib through inhibiting Elk1‐mediated epithelial‐mesenchymal transition. Oncol Rep [Internet]. 2016;36:551–558. 10.3892/or.2016.4780/abstract [DOI] [PubMed] [Google Scholar]
- Frenzel D, Willbold D. Kinetic titration series with biolayer interferometry. PloS One. 2014;9:e106882. [DOI] [PMC free article] [PubMed] [Google Scholar]
- Fuentes‐Baile M, Bello‐Gil D, Pérez‐Valenciano E, Sanz JM, García‐Morales P, Maestro B, et al. CLyta‐DAAO, free and immobilized in magnetic nanoparticles, induces cell death in human cancer cells. Biomolecules. 2020;10:222. [DOI] [PMC free article] [PubMed] [Google Scholar]
- Fuentes‐Baile M, Pérez‐Valenciano E, García‐Morales P, de Romero CJ, Bello‐Gil D, Barberá VM, et al. Clyta‐daao chimeric enzyme bound to magnetic nanoparticles. A new therapeutical approach for cancer patients? Int J Mol Sci. 2021;22:1–24. [DOI] [PMC free article] [PubMed] [Google Scholar]
- Gill SC, von Hippel PH. Calculation of protein extinction coefficients from amino acid sequence data. Anal Biochem. 1989;182:319–326. [DOI] [PubMed] [Google Scholar]
- Gregory GL, Copple IM. Modulating the expression of tumor suppressor genes using activating oligonucleotide technologies as a therapeutic approach in cancer. Mol Ther Nucleic Acids [Internet]. 2022;31:211–223. Available from: https://pubmed.ncbi.nlm.nih.gov/36700046/ [DOI] [PMC free article] [PubMed] [Google Scholar]
- Gudmann NS, Hansen NUB, Jensen ACB, Karsdal MA, Siebuhr AS. Biological relevance of citrullinations: diagnostic, prognostic and therapeutic options. Autoimmunity. 2015;48:73–79. [DOI] [PubMed] [Google Scholar]
- Guo Q, Fast W. Citrullination of inhibitor of growth 4 (ING4) by peptidylarginine deminase 4 (PAD4) disrupts the interaction between ING4 and p53. J Biol Chem. 2011;286:17069–17078. [DOI] [PMC free article] [PubMed] [Google Scholar]
- György B, Tóth E, Tarcsa E, Falus A, Buzás EI. Citrullination: a posttranslational modification in health and disease. Int J Biochem Cell Biol. 2006;38:1662–1677. [DOI] [PubMed] [Google Scholar]
- Horikoshi N, Tachiwana H, Saito K, Osakabe A, Sato M, Yamada M, et al. Structural and biochemical analyses of the human PAD4 variant encoded by a functional haplotype gene. Acta Crystallogr D Biol Crystallogr [Internet]. 2011;67:112–118. Available from: https://pubmed.ncbi.nlm.nih.gov/21245532/ [DOI] [PubMed] [Google Scholar]
- Hung HC, Lin CY, Liao YF, Hsu PC, Tsay GJ, Liu GY. The functional haplotype of peptidylarginine deiminase IV (S55G, A82V and A112G) associated with susceptibility to rheumatoid arthritis dominates apoptosis of acute T leukemia Jurkat cells. Apoptosis. 2007;12:475–487. [DOI] [PubMed] [Google Scholar]
- Ishigami A, Maruyama N. Importance of research on peptidylarginine deiminase and citrullinated proteins in age‐related disease. Geriatr Gerontol Int. 2010;10:S53–S58. [DOI] [PubMed] [Google Scholar]
- Jae‐Sun S, Ji‐Hyang H, Dong‐Hwa L, Kyoung‐Seok R, Kwang‐Hee B, Byoung CP, et al. Structural convergence of unstructured p53 family transactivation domains in MDM2 recognition. Cell Cycle [Internet]. 2015;14:533–543. Available from: https://pubmed.ncbi.nlm.nih.gov/25591003/ [DOI] [PMC free article] [PubMed] [Google Scholar]
- Jiménez‐García B, Pons C, Fernández‐Recio J. pyDockWEB: a web server for rigid‐body protein‐protein docking using electrostatics and desolvation scoring. Bioinformatics. 2013;29:1698–1699. [DOI] [PubMed] [Google Scholar]
- Joerger AC, Fersht AR. Structural biology of the tumor suppressor p53. Annu Rev Biochem [Internet]. 2008;77:557–582. Available from: https://pubmed.ncbi.nlm.nih.gov/18410249/ [DOI] [PubMed] [Google Scholar]
- Katchalski‐Katzir E, Shariv I, Eisenstein M, Friesem AA, Aflalo C, Vakser IA. Molecular surface recognition: determination of geometric fit between proteins and their ligands by correlation techniques. Proc Natl Acad Sci [Internet]. 1992;89:2195–2199. 10.1073/pnas.89.6.2195 [DOI] [PMC free article] [PubMed] [Google Scholar]
- Kozakov D, Hall DR, Xia B, Porter KA, Padhorny D, Yueh C, et al. The ClusPro web server for protein–protein docking. Nature Protocols. 2017;12(2):255–278. Available from: https://www.nature.com/articles/nprot.2016.169 [DOI] [PMC free article] [PubMed] [Google Scholar]
- Kubbutat MHG, Jones SN, Vousden KH. Regulation of p53 stability by Mdm2. Nature. 1997;387:299–303. [DOI] [PubMed] [Google Scholar]
- Kussie PH, Gorina S, Marechal V, Elenbaas B, Moreau J, Levine AJ, et al. Structure of the MDM2 oncoprotein bound to the p53 tumor suppressor transactivation domain. Science [Internet]. 1996;274:948–953. Available from: https://pubmed.ncbi.nlm.nih.gov/8875929/ [DOI] [PubMed] [Google Scholar]
- Lai Z, Auger KR, Manubay CM, Copeland RA. Thermodynamics of p53 binding to hdm2(1–126): effects of phosphorylation and p53 peptide length. Arch Biochem Biophys. 2000;381:278–284. [DOI] [PubMed] [Google Scholar]
- Lei L, Lu Q, Ma G, Li T, Deng J, Li W. P53 protein and the diseases in central nervous system. Front Genet [Internet]. 2023;13:1051395. Available from: https://pubmed.ncbi.nlm.nih.gov/36712862/ [DOI] [PMC free article] [PubMed] [Google Scholar]
- Lewis HD, Liddle J, Coote JE, Atkinson SJ, Barker MD, Bax BD, et al. Inhibition of PAD4 activity is sufficient to disrupt mouse and human NET formation. Nat Chem Biol [Internet]. 2015;11:191 Available from: https://www.ncbi.nlm.nih.gov/pmc/articles/PMC4397581/ [DOI] [PMC free article] [PubMed] [Google Scholar]
- Li J, Kurokawa M. Regulation of MDM2 stability after DNA damage. J Cell Physiol [Internet]. 2015;230:2318Available from: https://www.ncbi.nlm.nih.gov/pmc/articles/PMC5810548/–2327. [DOI] [PMC free article] [PubMed] [Google Scholar]
- Li P, Wang D, Yao H, Doret P, Hao G, Shen Q, et al. Coordination of PAD4 and HDAC2 in the regulation of p53‐target gene expression. Oncogene. 2010;29:3153–3162. [DOI] [PMC free article] [PubMed] [Google Scholar]
- Li P, Yao H, Zhang Z, Li M, Luo Y, Thompson PR, et al. Regulation of p53 target gene expression by peptidylarginine deiminase 4. Mol Cell Biol. 2008;28:4758. [DOI] [PMC free article] [PubMed] [Google Scholar]
- Marine JCW, Dyer MA, Jochemsen AG. MDMX: from bench to bedside. J Cell Sci [Internet]. 2007;120:371–378. Available from: https://journals.biologists.com/jcs/article/120/3/371/29795/MDMX‐from‐bench‐to‐bedside [DOI] [PubMed] [Google Scholar]
- McCoy MA, Gesell JJ, Senior MM, Wyss DF. Flexible lid to the p53‐binding domain of human Mdm2: implications for p53 regulation. Proc Natl Acad Sci U S A [Internet]. 2003;100:1645–1648. Available from: https://pubmed.ncbi.nlm.nih.gov/12552135/ [DOI] [PMC free article] [PubMed] [Google Scholar]
- Michelsen K, Jordan JB, Lewis J, Long AM, Yang E, Rew Y, et al. Ordering of the N‐terminus of human MDM2 by small molecule inhibitors. J Am Chem Soc [Internet]. 2012;134:17059–17067. Available from: https://europepmc.org/article/MED/22991965 [DOI] [PubMed] [Google Scholar]
- Momand J, Zambetti GP, Olson DC, George D, Levine AJ. The mdm‐2 oncogene product forms a complex with the p53 protein and inhibits p53‐mediated transactivation. Cell. 1992;69:1237–1245. [DOI] [PubMed] [Google Scholar]
- Nagata T, Shirakawa K, Kobayashi N, Shiheido H, Tabata N, Sakuma‐Yonemura Y, et al. Structural basis for inhibition of the MDM2:p53 interaction by an optimized MDM2‐binding peptide selected with mRNA display. PLoS One [Internet]. 2014;9:e109163. Available from: https://pubmed.ncbi.nlm.nih.gov/25275651/ [DOI] [PMC free article] [PubMed] [Google Scholar]
- Neira JL, Araujo‐Abad S, Cámara‐Artigas A, Rizzuti B, Abian O, Giudici AM, et al. Biochemical and biophysical characterization of PADI4 supports its involvement in cancer. Arch Biochem Biophys. 2022;717:109125. [DOI] [PubMed] [Google Scholar]
- Neira JL, Díaz‐García C, Prieto M, Coutinho A. The C‐terminal SAM domain of p73 binds to the N terminus of MDM2. Biochim Biophys Acta Gen Subj. 2019;1863:760–770. [DOI] [PubMed] [Google Scholar]
- Neira JL, Hornos F, Bacarizo J, Cámara‐Artigás A, Gómez J. The monomeric species of the regulatory domain of tyrosine hydroxylase has a low conformational stability. Biochemistry. 2016;55:3418–3431. [DOI] [PubMed] [Google Scholar]
- Neira JL, Rizzuti B, Abián O, Araujo‐Abad S, Velázquez‐Campoy A, de Juan RC. Human enzyme PADI4 binds to the nuclear carrier importin α3. Cells [Internet]. 2022;11:2166. Available from: https://pubmed.ncbi.nlm.nih.gov/35883608/ [DOI] [PMC free article] [PubMed] [Google Scholar]
- Neira JL, Rizzuti B, Araujo‐Abad S, Abian O, Fárez‐Vidal ME, Velazquez‐Campoy A, et al. The armadillo‐repeat domain of Plakophilin 1 binds to human enzyme PADI4. Biochim Biophys Acta. Proteins Proteom [Internet] Available from: https://pubmed.ncbi.nlm.nih.gov/36372391/. 2023;1871:140868. [DOI] [PubMed] [Google Scholar]
- Onufriev A, Bashford D, Case DA. Exploring protein native states and large‐scale conformational changes with a modified generalized born model. Proteins. 2004;55:383–394. 10.1002/prot.20033 [DOI] [PubMed] [Google Scholar]
- Pantoja‐Uceda D, Neira JL, Saelices L, Robles‐Rengel R, Florencio FJ, Muro‐Pastor MI, et al. Dissecting the binding between glutamine Synthetase and its two natively unfolded protein inhibitors. Biochemistry. 2016;55:3370–3382. [DOI] [PubMed] [Google Scholar]
- Pierce BG, Wiehe K, Hwang H, Kim BH, Vreven T, Weng Z. ZDOCK server: interactive docking prediction of protein‐protein complexes and symmetric multimers. Bioinformatics [Internet]. 2014;30:1771–1773. Available from: https://pubmed.ncbi.nlm.nih.gov/24532726/ [DOI] [PMC free article] [PubMed] [Google Scholar]
- Reza Saadatzadeh M, Elmi AN, Pandya PH, Bijangi‐Vishehsaraei K, Ding J, Stamatkin CW, et al. The role of MDM2 in promoting genome stability versus instability. Int J Mol Sci. 2017;18:2216. [DOI] [PMC free article] [PubMed] [Google Scholar]
- Rizzuti B. Molecular simulations of proteins: from simplified physical interactions to complex biological phenomena. Biochim Biophys Acta Proteins Proteom [Internet]. 2022;1870:140757. Available from: https://pubmed.ncbi.nlm.nih.gov/35051666/ [DOI] [PubMed] [Google Scholar]
- Royer CA, Scarlata SF. Fluorescence approaches to quantifying biomolecular interactions. Methods Enzymol. 2008;450:79–106. [DOI] [PubMed] [Google Scholar]
- Sato A, Sunayama J, Matsuda KI, Seino S, Suzuki K, Watanabe E, et al. MEK‐ERK signaling dictates DNA‐repair gene MGMT expression and temozolomide resistance of stem‐like glioblastoma cells via the MDM2‐p53 axis. Stem Cells [Internet]. 2011;29:1942–1951. Available from: https://pubmed.ncbi.nlm.nih.gov/21957016/ [DOI] [PubMed] [Google Scholar]
- Schon O, Friedler A, Bycroft M, Freund SMV, Fersht AR. Molecular mechanism of the interaction between MDM2 and p53. J Mol Biol [Internet]. 2002;323:491–501. Available from: https://pubmed.ncbi.nlm.nih.gov/12381304/ [DOI] [PubMed] [Google Scholar]
- Schon O, Friedler A, Freund S, Fersht AR. Binding of p53‐derived ligands to MDM2 induces a variety of long range conformational changes. J Mol Biol [Internet]. 2004;336:197–202. Available from: https://pubmed.ncbi.nlm.nih.gov/14741215/ [DOI] [PubMed] [Google Scholar]
- Slade DJ, Horibata S, Coonrod SA, Thompson PR. A novel role for protein arginine deiminase 4 in pluripotency: the emerging role of citrullinated histone H1 in cellular programming. Bioessays. 2014;36:736–740. [DOI] [PMC free article] [PubMed] [Google Scholar]
- Stadler SC, Vincent CT, Fedorov VD, Patsialou A, Cherrington BD, Wakshlag JJ, et al. Dysregulation of PAD4‐mediated citrullination of nuclear GSK3β activates TGF‐β signaling and induces epithelialto‐mesenchymal transition in breast cancer cells. Proc Natl Acad Sci U S A [Internet]. 2013;110:11851–11856. 10.1073/pnas.1308362110 [DOI] [PMC free article] [PubMed] [Google Scholar]
- Sung H, Ferlay J, Siegel RL, Laversanne M, Soerjomataram I, Jemal A, Bray F. Global cancer statistics 2020: GLOBOCAN estimates of incidence and mortality worldwide for 36 cancers in 185 countries. CA Cancer J Clin. 2021;71:209–249. [DOI] [PubMed] [Google Scholar]
- Tanikawa C, Ueda K, Nakagawa H, Yoshida N, Nakamura Y, Matsuda K. Regulation of protein Citrullination through p53/PADI4 network in DNA damage response. Cancer Res [Internet]. 2009;69:8761–8769. Available from: https://pubmed.ncbi.nlm.nih.gov/19843866/ [DOI] [PubMed] [Google Scholar]
- Uhrinova S, Uhrin D, Powers H, Watt K, Zheleva D, Fischer P, et al. Structure of free MDM2 N‐terminal domain reveals conformational adjustments that accompany p53‐binding. J Mol Biol. 2005;350:587–598. [DOI] [PubMed] [Google Scholar]
- van Dieck J, Lum JK, Teufel DP, Fersht AR. S100 proteins interact with the N‐terminal domain of MDM2. FEBS Lett [Internet]. 2010;584:3269–3274. Available from: https://pubmed.ncbi.nlm.nih.gov/20591429/ [DOI] [PubMed] [Google Scholar]
- Varadi M, Anyango S, Deshpande M, Nair S, Natassia C, Yordanova G, et al. AlphaFold protein structure database: massively expanding the structural coverage of protein‐sequence space with high‐accuracy models. Nucleic Acids Res [Internet]. 2022;50:D439–D444. Available from: https://academic.oup.com/nar/article/50/D1/D439/6430488 [DOI] [PMC free article] [PubMed] [Google Scholar]
- Ventero MP, Fuentes‐Baile M, Quereda C, Perez‐Valeciano E, Alenda C, Garcia‐Morales P, et al. Radiotherapy resistance acquisition in glioblastoma. Role of SOCS1 and SOCS3. PLoS One. 2019;14:e0212581. [DOI] [PMC free article] [PubMed] [Google Scholar]
- Wallace M, Worrall E, Pettersson S, Hupp TR, Ball KL. Dual‐site regulation of MDM2 E3‐ubiquitin ligase activity. Mol Cell. 2006;23:251–263. [DOI] [PubMed] [Google Scholar]
- Wang L, Song G, Zhang X, Feng T, Pan J, Chen W, et al. PADI2‐mediated Citrullination promotes prostate cancer progression. Cancer Res [Internet]. 2017;77:5755–5768. Available from: https://pubmed.ncbi.nlm.nih.gov/28819028/ [DOI] [PubMed] [Google Scholar]
- Wang Y, Chen R, Gan Y, Ying S. The roles of PAD2‐ and PAD4‐mediated protein citrullination catalysis in cancers. Int J Cancer. 2021;148:267–276. [DOI] [PubMed] [Google Scholar]
- Weng G, Wang E, Wang Z, Liu H, Zhu F, Li D, et al. HawkDock: a web server to predict and analyze the protein‐protein complex based on computational docking and MM/GBSA. Nucleic Acids Res [Internet]. 2019;47:W322–W330. Available from: https://pubmed.ncbi.nlm.nih.gov/31106357/ [DOI] [PMC free article] [PubMed] [Google Scholar]
- Witalison E, Thompson P, Hofseth L. Protein arginine deiminases and associated citrullination: physiological functions and diseases associated with dysregulation. Curr Drug Targets. 2015;16:700–710. [DOI] [PMC free article] [PubMed] [Google Scholar]
- Yadahalli S, Neira JL, Johnson CM, Tan YS, Rowling PJE, Chattopadhyay A, et al. Kinetic and thermodynamic effects of phosphorylation on p53 binding to MDM2. Sci Rep [Internet]. 2019;9:693. Available from: https://pubmed.ncbi.nlm.nih.gov/30679555/ [DOI] [PMC free article] [PubMed] [Google Scholar]
- Yan Y, Tao H, He J, Huang SY. The HDOCK server for integrated protein–protein docking. Nat Protoc. 2020;15(5):1829–1852. Available from: https://www.nature.com/articles/s41596-020-0312-x [DOI] [PubMed] [Google Scholar]
- Yang C, Dong ZZ, Zhang J, Teng D, Luo X, Li D, et al. Peptidylarginine deiminases 4 as a promising target in drug discovery. Eur J Med Chem. 2021;226:113840. [DOI] [PubMed] [Google Scholar]
- Yao H, Li P, Venters BJ, Zheng S, Thompson PR, Pugh BF, et al. Histone Arg modifications and p53 regulate the expression of OKL38, a mediator of apoptosis. J Biol Chem [Internet]. 2008;283:20060–20068. Available from: https://pubmed.ncbi.nlm.nih.gov/18499678/ [DOI] [PMC free article] [PubMed] [Google Scholar]
- Ying S, Dong S, Kawada A, Kojima T, Chavanas S, Méchin MC, et al. Transcriptional regulation of peptidylarginine deiminase expression in human keratinocytes. J Dermatol Sci. 2009;53:2–9. [DOI] [PubMed] [Google Scholar]
- Yu GW, Rudiger S, Veprintsev D, Freund S, Fernandez‐Fernandez MR, Fersht AR. The central region of HDM2 provides a second binding site for p53. Proc Natl Acad Sci U S A [Internet]. 2006;103:1227–1232. 10.1073/pnas.0510343103 [DOI] [PMC free article] [PubMed] [Google Scholar]
- Yuzhalin AE. Citrullination in cancer. Cancer Res. 2019;79:1274–1284. [DOI] [PubMed] [Google Scholar]
- Yuzhalin AE, Gordon‐Weeks AN, Tognoli ML, Jones K, Markelc B, Konietzny R, et al. Colorectal cancer liver metastatic growth depends on PAD4‐driven citrullination of the extracellular matrix. Nat Commun. 2018;9(1):1–15. Available from: https://www.nature.com/articles/s41467-018-07306-7 [DOI] [PMC free article] [PubMed] [Google Scholar]
- Zhang Y, Yang Y, Hu X, Wang Z, Li L, Chen P. PADs in cancer: current and future. Biochim Biophys Acta rev. Cancer Available from: https://pubmed.ncbi.nlm.nih.gov/33321174/. 2021;1875:188492. [DOI] [PubMed] [Google Scholar]
- Zhu D, Lu Y, Wang Y, Wang Y. PAD4 and its inhibitors in cancer progression and prognosis. Pharmaceutics [Internet]. 2022;14:2414 Available from: https://pubmed.ncbi.nlm.nih.gov/36365233/ [DOI] [PMC free article] [PubMed] [Google Scholar]
Associated Data
This section collects any data citations, data availability statements, or supplementary materials included in this article.
Supplementary Materials
Data S1: There are three figures containing PLA images of PADI4 and MDM2 interaction, in the absence and presence of the GSK484 inhibitor (Figures S1–S3); one showing the structure of N‐MDM2 with the residues with the largest CSP values highlighted (Figure S4); and one showing the most favorable docking complex identified in the docking procedure (Figure S5).
Data Availability Statement
The datasets generated during and/or analyzed during the current study are available from the corresponding authors on reasonable request.