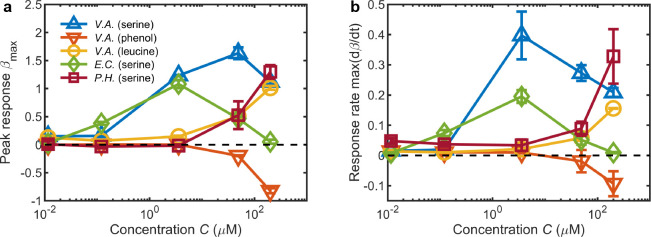
Figure 4. Summary of chemotactic responses across various species, chemostimulants, and concentrations measured using the MCD.
(a) The primary metric for quantifying the chemotactic response of the bacteria was the peak of the accumulation index , where the sign is determined by the positive or negative chemotactic behavior for each chemostimulus concentration (from Figures 2h, 3b, d, f and h). (b) The maximal response rate (prior to ) is indicative of the speed of cell accumulation. These metrics distinguish chemotactic behaviors, for example: The accumulation of V. alginolyticus to serine is greatest at high concentrations (a; ), but the fastest response occurs at weaker concentrations (a; ). Error bars are one standard deviation across biological replicates.

