. 2023 Jul 11;12:e81011. doi: 10.7554/eLife.81011

Figure 1. HTT phosphorylation at S421 increases synaptic vesicle precursor (SVP) anterograde axonal transport and SV exocytosis.

(A) Diagram of the microfluidic device for reconstituting a corticostriatal network compatible with live-cell imaging of axons. Cortical axons grow in the cortical chamber (yellow) and connect with the striatal dendrites in the striatal chamber (green) through synapses in the synaptic compartment (purple). On the right, representative kymographs of VAMP2-mCherry vesicle transport in axons for each genotype. Scale bar = 25 µm. (B) Segmental anterograde (**** p<0.0001, N = 1078 wild-type [WT] vesicles, 1886 HTT-SD vesicles, and 1384 HTT-SA vesicles), retrograde velocities (ns: non-significant; N=1029 WT vesicles, 1564 HTT-SD vesicles, 2019 HTT-SA vesicles) and directional net flux (****p<0.0001; N=118 WT axons, 157 HTT-SD axons, 132 HTT-SA axons) of VAMP2-mCherry vesicles. Histograms represent means ± SEM of three independent experiments. Significance was determined using one-way ANOVA followed by Dunn’s multiple comparison test. (C) Schematic of the three-compartment microfluidic device. Cortical neurons were infected with a lentivirus expressing VGLUT1 linked to a pH-sensitive variant of GFP (pHluorin); they were stimulated with 4AP-bicuculline at day in vitro (DIV) 11. The number of VGLUT-1 pHluorin exocytosis events within the synaptic chamber of the corticostriatal network, as compared to that of WT and to that of non-stimulated condition is shown here (*p<0.05; N=6712 events in WT, 4640 events in HTT-SD and 5176 events in HTT-SA neurons). The box-whisker plots show the median, the 25th and the 75th percentiles, the smallest and the largest values of three independent experiments using a total of N=WT 11, 10 HTT-SD, and 10 HTT-SA neurons seeded within microfluidic devices with at least three fields per device. Significance was determined using one-way ANOVA followed by Dunn’s multiple comparison test.

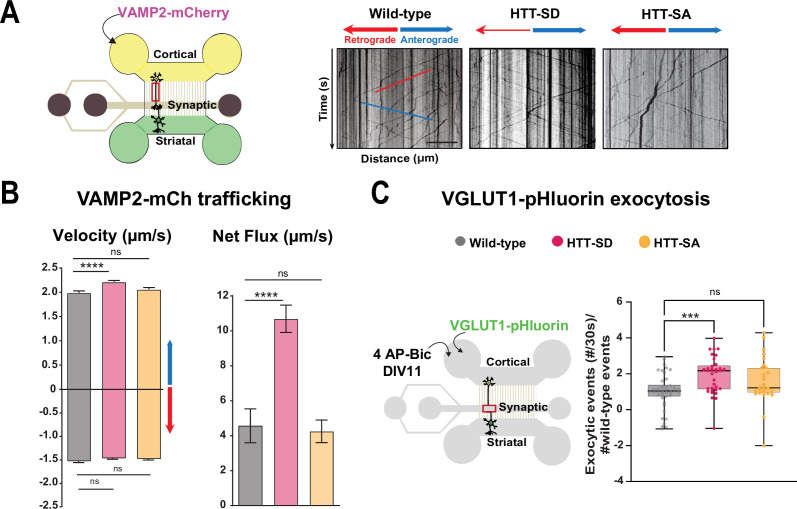
Figure 1—source data 1. Data analyzed for anterograde velocity.
Figure 1—source data 2. Data analyzed for retrograde velocity.
Figure 1—source data 3. Data analyzed for net flux.
Figure 1—source data 4. Data analyzed for VGLUT1 pHluorin exocytosis number of events.
elife-81011-fig1-data4.xlsx (153.9KB, xlsx)

Figure 1.

Figure 1—figure supplement 1. HTT phosphorylation at S421 increases synaptic vesicle precursor (SVP) anterograde axonal transport without affecting the quantity of SV released.

Figure 1—figure supplement 1.

(A) Left: Number of anterograde (*p<0.05; N=117 WT axons, 156 HTT-SD axons, and 132 HTT-SA axons) and retrograde (*p<0.05; 118 WT axons, 159 HTT-SD axons, and 134 HTT-SA axons) VAMP2-mCherry vesicles in 100 µm of axon. Right: Their linear flow rate (*p<0.05; 118 WT axons, 158 HTT-SD axons, and 133 HTT-SA axons). Histograms represent means ± SEM of three independent experiments. Significance was determined using a one-way ANOVA followed by Dunn’s multiple comparison test. (B) Diagram of the three-compartment microfluidic device with an indication of lentiviral transduction and stimulation with 4AP-bicuculline. The amplitude of VGLUT-1 pHluorin exocytosis events within the synaptic chamber of the corticostriatal network was compared to that of non-stimulated condition (see Materials and methods). Histograms represent means ± SEM of three independent experiments. Significance was determined using one-way ANOVA followed by Dunn’s multiple comparison test (ns: non-significant).
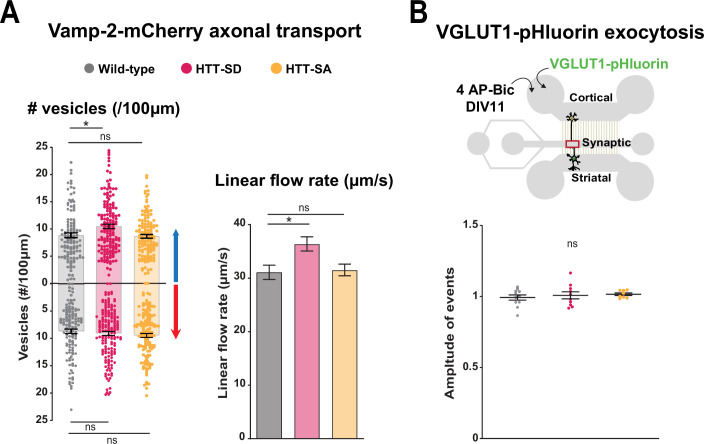
Figure 1—figure supplement 1—source data 1. Data analyzed for number of anterograde vesicles.
Figure 1—figure supplement 1—source data 2. Data analyzed for number of retrograde vesicles.
Figure 1—figure supplement 1—source data 3. Data analyzed for the linear flow rate.
Figure 1—figure supplement 1—source data 4. Data analyzed for VGLUT1 pHluorin exocytosis amplitude of events.
Figure 1—video 1. Movie showing the glutamate release (VGLUT-pHluorin) in wild-type (WT) neurons after the stimulation.
Download video file (10.9MB, mp4)