. 2023 Jul 11;12:e81011. doi: 10.7554/eLife.81011

Figure 4. HTT phosphorylation increases the number of synaptic vesicles (SVs) distally to the presynaptic active zone.

(A) Representative images of SVs at the corticostriatal synapse, obtained by electronic microscopy, in dorsolateral striatum (DLS) slices from three wild-type (WT) and HTT-SD mice 3-month-old male. Scale = 200 nm. (B) Quantification of (i) the number of synapses at the corticostriatal synapse per 100 µm2 in DLS on n=74 WT and 74 HTT-SD striatal areas (ns: non-significant), (ii) the number of SVs per corticostriatal synapse from five WT and three HTT-SD mouse brains (N=279 WT and 171 HTT-SD axon terminals; ****p<0.0001), (iii) size of the cortical axon terminal in 158 WT and 156 HTT-SD corticostriatal synapses (*p<0.05), and (iv) the density of SVs within these axon terminals (number of vesicles per μm2) in N=157 WT and 162 HTT-SD corticostriatal synapses (***p<0.001). (C) Representative images showing the 40-nm-wide zones in the axon terminal. Zone 1 is the closest to the synaptic cleft and contains the active zone. Zone 2 (40–80 nm) is adjacent to zone 1, and zone 3 (80–120 nm) is farthest from the active zone. Dark orange denotes the PSD within the striatal postsynaptic element. Scale = 100 nm. (D) The number of SVs per zone within the distal 120 nm of the axon terminal in at least 149±2 axon terminals (ns: non-significant, *p<0.05). The box-whisker plots show the median, the 25th and the 75th percentiles, the smallest and the largest value from at least three brains for each condition. Significances were determined using the Mann-Whitney test.

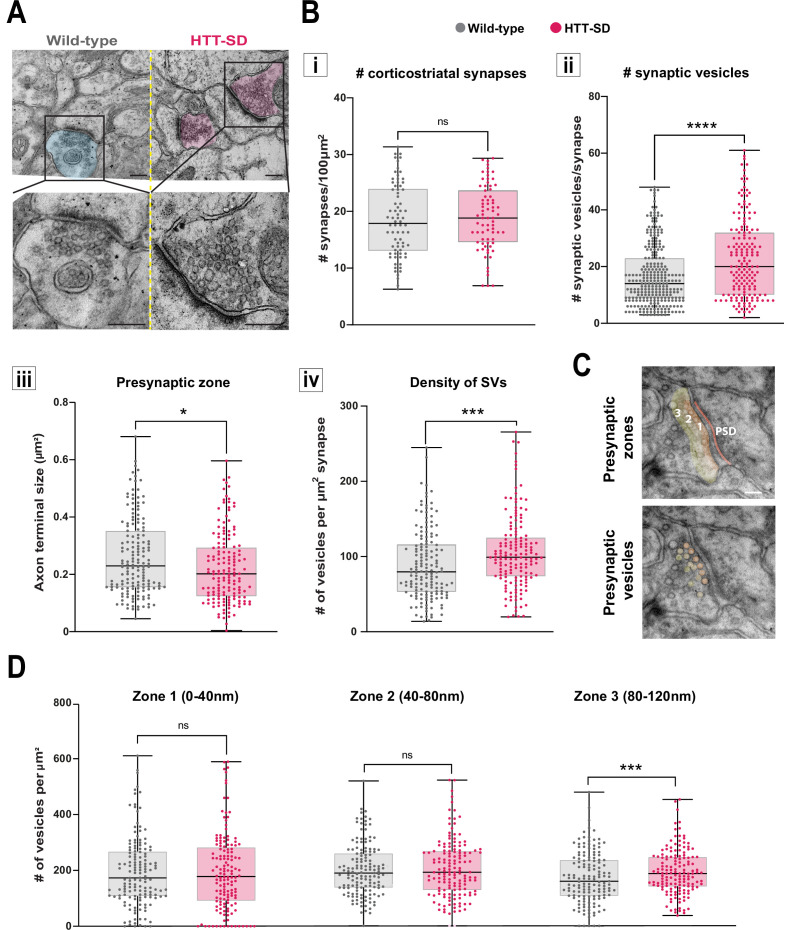
Figure 4—source data 1. Data analyzed for the number of the corticostriatal synapses (i).
Figure 4—source data 2. Data analyzed for the number of the synaptic vesicles (ii).
Figure 4—source data 3. Data analyzed for the number of the axon terminal size in the presynaptic zone.
Figure 4—source data 4. Data analyzed for the density of synaptic vesicles.
Figure 4—source data 5. Data analyzed for the number of vesicles per zone.

Figure 4.

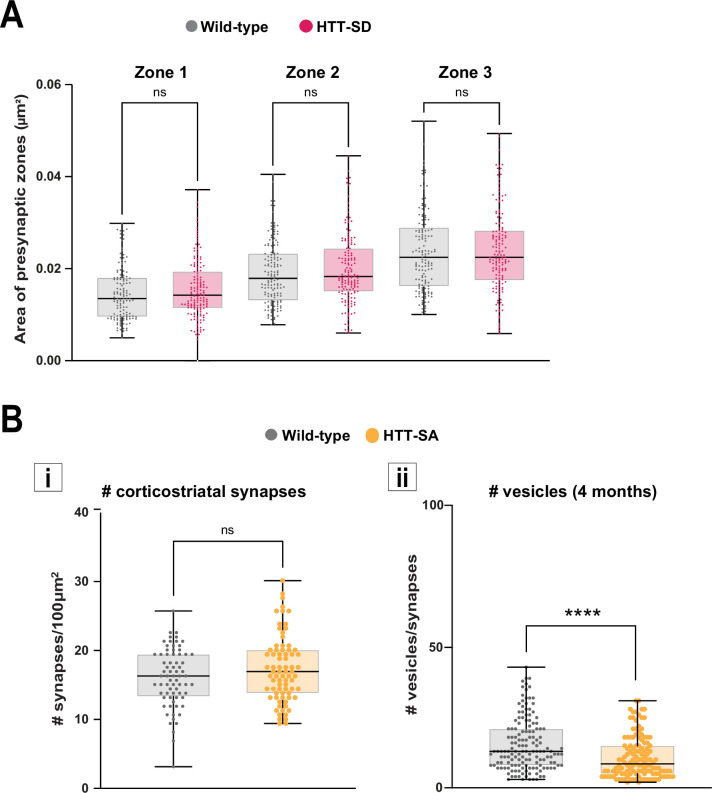
Figure 4—figure supplement 1. Characterization of the three presynaptic zones of HTT-SD corticostriatal axon terminals and analysis of HTT-SA corticostriatal synapses.

Figure 4—figure supplement 1.

(A) Area of the three zones in wild-type (WT) and HTT-SD axon terminals studied in 145±9 axon terminals from three WT and HTT-SD 3-month-old mice (ns: non-significant, two-way ANOVA followed by Dunn’s multiple comparisons test). (B) Left (i). The number of corticostriatal synapses in 72 WT and 77 HTT-SA striatal areas from three WT and HTT-SA 4-month-old mice (ns: non-significant, Mann-Whitney). Right (ii). The number of vesicles at 4 months in 148 WT and 130 HTT-SA corticostriatal axon terminals (****p<0.0001, Mann-Whitney). The box-whisker plots show the median, the 25th and the 75th percentiles, using at least three brains of each genotype.
Figure 4—figure supplement 1—source data 1. Data analyzed for the area of the presynaptic zones.
Figure 4—figure supplement 1—source data 2. Data analyzed for the the number of the corticostriatal synapses (i).
Figure 4—figure supplement 1—source data 3. Data analyzed for the number of the synaptic vesicles (ii).