. 2023 Jul 11;12:e81011. doi: 10.7554/eLife.81011

Figure 6. HTT-dependent axonal transport of synaptic vesicle precursors (SVPs) is mediated by KIF1A.

(A) Diagram indicating lentiviral transduction of VAMP2-mCherry and sh-scramble (sh-Scr-GFP) or sh-Kif1a (sh-Kif1a-GFP) lentiviruses at day in vitro (DIV) 8 in the microfluidic device. On the right, representative kymographs of VAMP2-mCherry vesicle transport in axons for each condition. Scale bar = 25 µm. (B) Segmental anterograde and retrograde velocities (anterograde: *p<0.05, ***p<0.001, ****p<0.0001; N=548 vesicles wild-type [WT] sh-Scr, 318 vesicles WT sh-Kif1a, 1129 vesicles HTT-SD sh-Scr, 628 vesicles HTT-SD sh-Kif1a) (retrograde: *p<0.05, **p<0.01, ****p<0.0001; N=583 vesicles WT sh-Scr, 396 vesicles WT sh-Kif1a, 1282 vesicles HTT-SD sh-Scr, 620 vesicles HTT-SD sh-Kif1a) and directional net flux (*p<0.01; N=79 axons WT sh-Scr, 59 axons WT sh-KIFA,112 axons HTT-SD sh-Scr, 89 axons HTT-SD sh-Kif1a; one-way ANOVA test) of VAMP2-mCherry vesicles in WT and HTT-SD neurons transduced with sh-Scr or sh-Kif1a lentiviruses. Histograms represent means ± SEM of three independent experiments. Significance was determined using a one-way ANOVA followed by Dunn’s multiple comparison test.

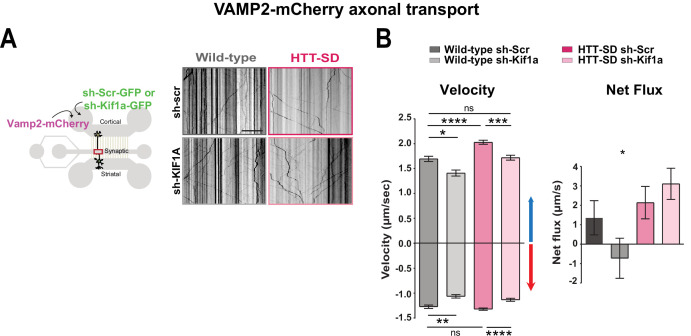
Figure 6—source data 1. Data analyzed for anterograde velocity.
Figure 6—source data 2. Data analyzed for retrograde velocity.
Figure 6—source data 3. Data analyzed for net flux.

Figure 6.

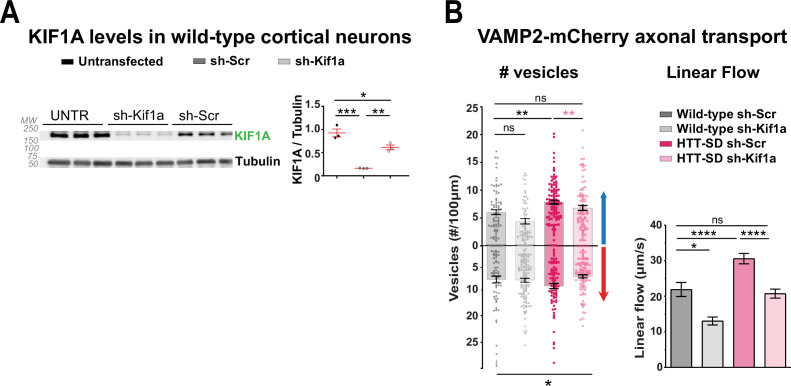
Figure 6—figure supplement 1. KIF1A levels in HTT-SD neurons regulate VAMP2 axonal transport.

Figure 6—figure supplement 1.

(A) Analysis of KIF1A levels by western blot in cortical neurons either not-transduced or transduced with sh-Kif1a or sh-Scr lentiviruses (*p<0.05, **p<0.01, ***p<0.001; one-way ANOVA followed by Dunn’s multiple comparisions test). Histograms represent the means ± SEM. (B) Number of anterograde (*p<0.05, **p<0.01; n=76 axons wild-type [WT] sh-Scr, 59 axons WT sh-Kif1a, 110 axons HTT-SD sh-Scr, and 86 axons HTT-SD sh-Kif1a) and retrograde (*p<0.05; n=60 WT sh-Scr axons, 114 WT sh-Kif1a axons, 79 HTT-SD sh-Scr axons, and 95 HTT-SD sh-Kif1a axons) VAMP2-mCherry axonal vesicles along 100 µm of axon in WT and HTT-SD and their linear flow rate (*p<0.05; 75 WT sh-Scr axons, 59 WT sh-Kif1a axons, 107 HTT-SD sh-Scr axons, and 85 HTT-SD sh-Kif1a axons; one-way ANOVA followed by Dunn’s test). Histograms represent the means ± SEM of at least three independent experiments.
Figure 6—figure supplement 1—source data 1. Western blot scans for the data presented in Figure 6—figure supplement 1A (KIF1A levels in cortical neurons).
Shown in red are the cropped regions presented in Figure 6—figure supplement 1A. Films containing the samples are shown.
Figure 6—figure supplement 1—source data 2. Data analyzed for number of anterograde vesicles.
Figure 6—figure supplement 1—source data 3. Data analyzed for number of retrograde vesicles.
Figure 6—figure supplement 1—source data 4. Data analyzed for the linear flow rate.
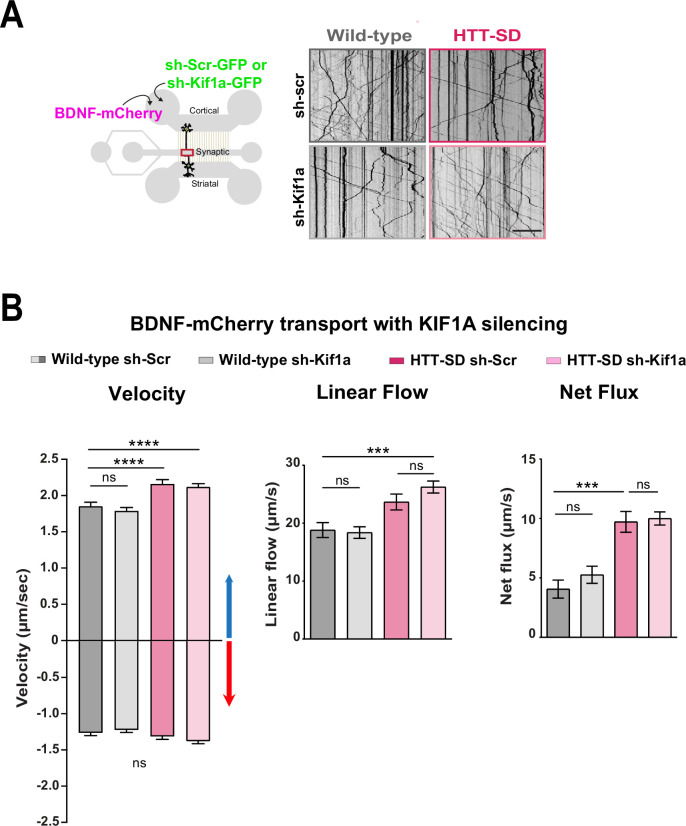
Figure 6—figure supplement 2. KIF1A silencing doesn’t affect BDNF-mCherry transport.

Figure 6—figure supplement 2.

(A) Diagram indicating transduction of BDNF-mCherry and sh-scramble (sh-scr-GFP) or sh-Kif1a (sh-Kif1a-GFP) lentiviruses (left). Representative kymographs of BDNF-mCherry vesicle transport within wild-type (WT) or HTT-SD axons transduced with sh-Scr or sh-Kif1a at day in vitro (DIV) 8. Scale bar = 25 µm. (B) Segmental anterograde (****p<0.0001; n=618 WT sh-Scr vesicles, 901 WT sh-Kif1a vesicles, 1735 HTT-SD sh-Scr vesicles, and 2830 HTT-SD sh-Kif1a vesicles) and retrograde velocities. There were no significant differences between genotypes in the retrograde segmental velocities and KIF1A silencing conditions (ns = non-significant), linear flow (***p<0.001; 75 WT sh-Scr axons, 102 WT sh-Kif1a axons, 114 HTT-SD sh-Scr axons, and 191 HTT-SD sh-Kif1a axons), or net flux (***p<0.001; n=75 WT sh-Scr axons, 103 WT sh-Kif1a axons, 123 HTT-SD sh-Scr axons, and 186 HTT-SD sh-Kif1a axons) of BDNF-mCherry vesicles. Histograms represent means ± SEM of three independent experiments. Significance was determined using one-way ANOVA followed by Dunn’s multiple comparisons test.
Figure 6—figure supplement 2—source data 1. Data analyzed for for anterograde velocity.
Figure 6—figure supplement 2—source data 2. Data analyzed for for retrograde velocity.
Figure 6—figure supplement 2—source data 3. Data analyzed for the linear flow rate.
Figure 6—figure supplement 2—source data 4. Data analyzed for the net flux.