

Abstract
Per- and polyfluoroalkyl substances (PFAS) are globally distributed and potentially toxic compounds. We report accumulation of chloroperfluoropolyethercarboxylates (Cl-PFPECAs) and perfluorocarboxylates (PFCAs) in vegetation and subsoils in New Jersey. Lower molecular weight Cl-PFPECAs, containing 7–10 fluorinated carbons, and PFCAs containing 3–6 fluorinated carbons were enriched in vegetation relative to surface soils. Subsoils were dominated by lower molecular weight Cl-PFPECAs, a divergence from surface soils. Contrastingly, PFCA homologue profiles in subsoils were similar to surface soils, likely reflecting temporal-use patterns. Accumulation factors (AFs) for vegetation and subsoils decreased with increasing CF2, 6–13 for vegetation and 8–13 in subsoils. In vegetation, for PFCAs having , AFs diminished with increasing CF2 as a more sensitive function than for longer chains. Considering that PFAS manufacturing has transitioned from long-chain chemistry to short-chain, this elevated vegetative accumulation of short-chain PFAS suggests the potential for unanticipated PFAS exposure levels globally in human and/or wildlife populations. This inverse relationship between AFs and CF2-count in terrestrial vegetation is opposite the positive relationship reported in aquatic vegetation suggesting aquatic food webs may be preferentially enriched in long-chain PFAS. AFs normalized to soil-water concentrations increased with chain length for in vegetation but remained inversely related to chain length for , reflecting a fundamental change in vegetation affinity for short chains compared to long.
Keywords: PFAS alternatives, accumulation factors, next-generation chemicals, polyfluorinated alkyl substances
Graphical Abstract
1. INTRODUCTION
Per- and polyfluoroalkyl substances (PFAS) are a diverse class of compounds prominently distinguished by their carbon–fluorine bonds, used in a variety of consumer and industrial products ranging from food-contact paper to flooring treatment, and used as surfactants and processing aids in the fluoropolymer industry. (1) The strong carbon–fluorine bonds that contribute to their nonreactive chemistries also lead to persistence in the environment, in turn establishing a potential for a range of adverse human- and ecosystem-health effects. (1)
Currently, the primary route of PFAS exposure in the general human population is via consumption of drinking water and food, although respiratory and dermal-contact exposures are also possible. (2,3) While direct exposure through manufactured products and drinking water can be reasonably managed, indirect exposures from accumulation in aquatic and terrestrial food sources are more difficult to mitigate. (1) PFAS introduction to food webs, either through ingestion of PFAS-contaminated produce (4,5) or animals reliant on these systems, (6−9) remains a complex and ever-developing issue, with sources of PFAS varying from ambient atmospheric deposition, precipitation, (10,11) irrigation using contaminated water, (12−15) or land-applied sludge or biosolids. (16−18) Among PFAS sources, one of the most common is atmospheric deposition from fluorochemical-use or -manufacturing facilities, (19−21) which can release large quantities of PFAS regionally. Therefore, determining vegetative bioaccumulation in industrialized regions is an essential component of risk assessment.
Vegetative accumulation studies, particularly those focused on edible vegetation, have shown that PFAS indeed are transported into plants and PFAS chain-length plays an important role in accumulation and distribution in plant tissue, where short-chain compounds can accumulate in the above-ground plant tissues including leafy vegetables, fruit, and shoots and longer chain PFAS can accumulate in the roots of terrestrial plants. (22−25) Furthermore, vertical distribution of PFAS in soils has been evaluated, (26) and the migration of these analytes can be dependent on several physiochemical properties of the soil and analyte. However, many of these studies are on legacy PFAS including globally distributed (27) long-chain () perfluorocarboxylates (PFCAs) (28,29) (Figure 1A) and perfluorosulfonates (PFSAs), (2,28) the production of which has been phased out and replaced with next-generation PFAS as well as expanded the uses of previously manufactured PFAS, which contain unique chemistries involving substituted headgroups and altered chain lengths, composition, and configuration (linking moieties, branching, cyclicity, etc.). These changes in chemical structure can modify the environmental behavior of PFAS substantially. (30,31)
Figure 1.
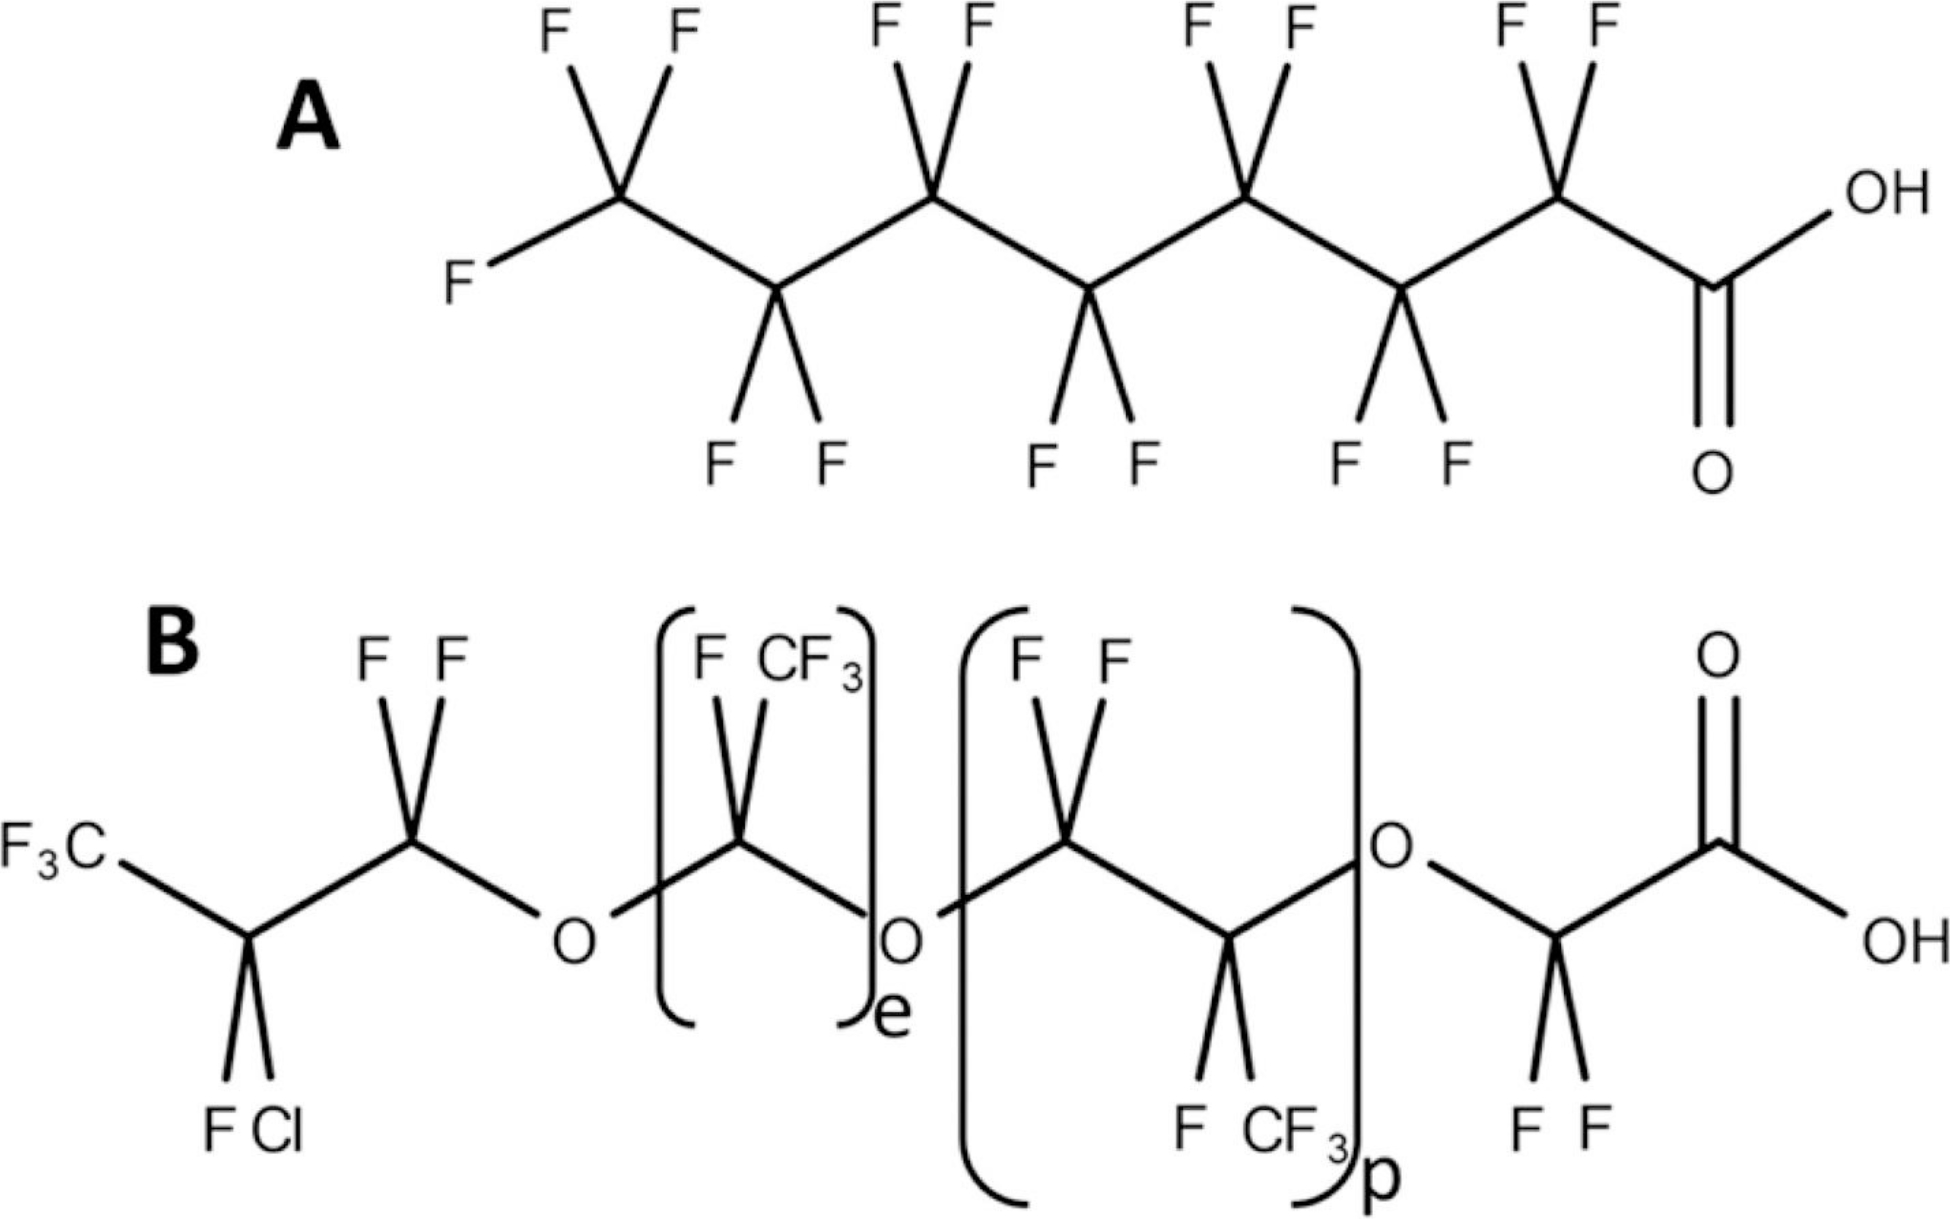
A. Structure of perfluorooctanoate (PFOA), one of the legacy PFCAs, for which fluorocarbons commonly vary in number from 3 to 11. B. Structure of the (e,p) = (1,1) congener of the novel Cl-PFPECAs, for which perfluoroethyl (e) and perfluoropropyl (p) groups each can vary from 0 to 4.
One unique PFAS chemistry involves the incorporation of ether linkages along the fluorinated-carbon tail, creating perfluoroether carboxylic acids. (32) These compounds have been purported to degrade more readily and therefore be less persistent in the environment, and although some polyfluoroalkyl ether acids which include −O–CFH– moieties can degrade under extreme oxidative conditions of a total oxidizable precursor assay, perfluoroalkyl ether acids are persistent and highly resistant to chemical degradation even under these aggressive conditions. (33) Overall, there is little evidence of degradation of perfluoroether carboxylic acids under natural environmental conditions. (34,35) A class of such ether-containing replacement PFAS includes the chloroperfluoropolyether carboxylates (Cl-PFPECAs) (Figure 1B), which have been recently identified in environmental surface soils from New Jersey with geographic distribution trends suggesting airborne transport from a manufacturing facility. (36,37) The spatial distribution of these compounds was found to be highly dependent on molecular weight, with the lighter compounds dispersed more widely than the heavier compounds. (36) In addition to being widely dispersed, with detection as far as 150 km from the industrial source, (36) these compounds are reported to be bioaccumulative in humans on a similar level as PFOA, with a half-life of 2.5–3 years, (38) and have potential to transform to other unique PFAS at the chlorofluorine terminus, (35) highlighting the need to assess vegetative bioaccumulation of these novel compounds in the region and probe for factors that may be involved in bioaccumulation potential.
Here, we study accumulation of PFCAs and Cl-PFPECAs (Figure 1) in New Jersey vegetation and subsoils, which have been collected during surface soil sampling in southern New Jersey at varying distances along dominant downwind transects near two prominent fluorochemical industrial facilities. (36) In doing so, we seek to elucidate the complex migration behavior of these contaminants in the environment.
2. MATERIALS & METHODS
2.1. Sample Collection and Preparation
A detailed description of chemicals, sample collection, and preparation can be found in the Supporting Information (SI) Text S1 and Tables S1 and S2.
2.2. Analytical Data
Ten congeners of Cl-PFPECAs have previously been identified using high-resolution nontargeted mass-spectral (MS) analysis and a low-resolution targeted MS/MS method (Table S3) in the surface soils at these same site locations. (36) We have reported analytical details for PFCAs numerous times in the past using a research standard operating procedure (SOP) developed for soils and polymers (Table S4). (39,40) In this current effort, triplicate extracts of vegetation and subsoils were prepared using this same SOP to allow internally consistent direct comparisons of these new vegetation and subsoil data to our previous surface soil data from these same locations. (36) These extracts then were analyzed for Cl-PFPECAs and PFCAs on a Waters Corporation (Milford, MA) Acquity UPLC coupled to a Quattro Premier MS/MS operated in negative electrospray ionization mode. Chromatographic separation was performed using an Acquity BEH C18 column (1.7 μm, 2.1 × 100 mm) at 35 °C with a Waters frit guard disc (0.2 mm, 2.1 mm).
2.3. Analyte Quantitation and Semiquantitation
Sample extracts were quantitated for PFCAs following the method of Rankin et al. using constant 99.4 pg/g concentrations of mass-labeled PFAS as matrix internal standards. As described in Rankin et al., (27) triplicate extraction replicates of each sample were compared to process blanks using a Student’s -test. When the test statistic exceeded the critical we designated these values as greater than the limit of quantitation (LOQ) and report these values in green fields (Tables S7–S10). When the test statistic exceeded the critical but was less than we designated these values as greater than the limit of detection (LOD) and report these values in yellow fields (Tables S7–S10). Semiquantitative concentration estimates of Cl-PFPECAs were generated to allow comparison of relative amounts detected among samples by normalizing Cl-PFPECA LC-MS/MS peaks to the peak area of the mass-labeled internal matrix standard of 13C5-perfluorononanoate (PFNA) added to all extracts at 99.4 pg/g and expressing sample concentrations as “pg/g as C9”. We semiquantitated these Cl-PFPECA data following the same t-test procedure as for the PFCAs, comparing triplicate sample-replicate results to process blanks.
2.4. Soil Testing
Testing of soil properties was conducted at the University of Georgia’s Soil, Plant, and Water Laboratory in Athens, GA. The following tests were run on samples: lime requirement, P, K, Ca, Mg, Zn, Mn, Na, pH, heavy metals (Fe, Cu, Cr, Mo, Ni, Cd, Pb) by Mehlich 1, cation-exchange capacity (CEC), percent base saturation, texture by hydrometer (% sand, silt, clay), organic matter by loss on ignition, and total organic carbon (TOC). A few samples were not analyzed by these tests due to limited sample availability. Results from these tests are given in the SI (Table S5).
2.5. Calculation of Accumulation Factors
A vegetative accumulation factor (VAF) was calculated for each compound at each sample site from the PFAS concentrations measured in vegetation and surface soil at each site according to
| (1) |
where is a given PFAS compound and and are its concentrations in vegetation and surface soil, respectively. A subsoil accumulation factor (SAF) was similarly calculated for each compound and sampling site by replacing with , the concentration of compound in the corresponding subsoil sample.
Similarly, vegetative accumulation factors, relative to estimated soil–water concentration (VAFW), were calculated according to the following equation (see the SI for derivation):
| (2) |
where is the distribution coefficient describing sorbed PFAS concentration (i.e., soil solids and air–water interface; ng/g) divided by bulk-phase water PFAS concentration (ng/g). We used the PFCA values of reported by Nguyen et al. (30) for pH = 5.2 in our calculations. A subsoil accumulation factor, relative to estimated soil water (SAFW), was calculated for each compound and sampling site by replacing with .
3. RESULTS & DISCUSSION
3.1. Quality Metrics
Recovery was found to be 78 ± 8% (mean ±1 standard deviation) for 13C8-perfluorooctanoic acid (PFOA) in vegetation samples and 89 ± 2% in subsoils (Table S6). Data for PFCAs and Cl-PFPECAs are summarized for vegetative tissue in Tables S7 and S8, respectively, and for subsoil in Tables S9 and S10, respectively. Concentrations > LOQ are highlighted in green, while concentrations > LOD are highlighted in yellow. Concentrations < LOD are shown in blue. The coefficient of variation (COV) was <1 in 99% of vegetation samples and 100% of subsoil samples. Of the 111 sample:compound pairings in vegetation samples above LOQ, 83% repeatedly analyzed 15 months apart reported concentrations within 50% of each other, illustrating the stability of these compounds in their extracted matrices. Concentrations of Cl-PFPECAs and PFCAs in surface soils at these same site locations have been reported previously. (36)
With the objective of comparing PFAS accumulation across matrices relative to our published surface-soil data for these sites, (36) to minimize artifactual variation arising from multiple methods, we employed the same extraction and analytical methods for all matrices: vegetation, subsoils, and surface soils. (36) Use of this previously developed extraction procedure (39) presents a limitation of having used a single recovery standard (13C8-PFOA, Table S6), so there exists some uncertainty regarding the exact recoveries of other PFAS analytes from the vegetation. As a proxy of recoveries for these other homologues, however, we note that the central tendency of our log VAF values regressed against all our reported homologue lengths is virtually identical in absolute value (intercept) and trend (slope) to the large curated data set of the Lesmeister et al. (28) literature review (Figure S1). Also noteworthy is that other literature methods for extraction of PFAS from vegetation have reported relatively consistent recoveries among PFCAs of varying chain length. (41,42) Considering that the overall focus of the current study is to utilize a single method for the extraction of analytes across multiple matrices to determine internally consistent accumulation factors, the uniformly high recoveries we report for 13C8-PFOA, the very close consistence of our VAFs with numerous literature values (28) (Figure S1), and previous reports of similar recoveries from vegetation across numerous PFAS chain lengths (41,42) all suggest the reliability of the data reported here.
3.2. Semiquantitation Implications and IS Suppression
Biases associated with semiquantitation processes exist, originating from differences in ionization, chromatography, and fragmentation between analytes and their surrogate standards. McCord et al. illustrated how these estimates can result in as much as order-of-magnitude differences in absolute concentration for emerging compounds. (32) However, these semiquantitation techniques still prove valuable in that their relative concentration values are comparable among samples and so have been used to report Cl-PFPECA concentrations “as C9” in surface soil and water. (36,37) Being systematic errors, they can be used with more confidence when comparing samples or calculating ratios, as we describe below.
The signal intensity of the mass-labeled matrix internal-standards (ISs) for vegetative extracts varied over a considerably wider range than did the surface soils. Normalizing IS peak intensity in extracts relative to process blanks reveals both a sample-dependent (Figure S2) and compound-dependent (Figure S3) peak suppression. While sample-dependent suppression was evident across all compounds, relative to the surface soil extracts, we found no evidence in our data that the extent of suppression was systematically dependent on vegetation type. We noticed in our vegetative extracts that a “chlorophyll green” coloration survived our liquid–liquid cleanup to varying degree among samples. Whether the signal suppression resulted from this color or other matrix complexity remains uncertain. Since M5C9 was used as the internal standard for all Cl-PFPECAs, longer chain suppression could introduce a bias in some samples that makes concentrations (as C9) in vegetation, and hence, long-chain VAFs and VAFWs for Cl-PFPECAs appear somewhat lower than they really are (Figure S3).
3.3. Detection of Cl-PFPECAs and PFCAs in Multiple Matrices
At least two Cl-PFPECA congeners were observed at semiquantifiable concentrations in all surface soils, (36) vegetation, and subsoils collected from New Jersey. Of all the possible Cl-PFPECA and vegetative and surface soil pairings in this study (240 congener:sample pairings), 44% were measured above LOQ in both matrices, 20% were found only in surface soil, 3% were found only in vegetation, and 33% were < LOQ in both surface soil and vegetation. Of the Cl-PFPECA and subsoil and surface soil pairings (40 congener:sample pairings), 45% were measured above LOQ in both soil matrices, 28% were found only in surface soils, 5% were found only in subsoils, and 22% were < LOQ in both surface and subsoils.
Figure 2 displays the relative composition (Figure 2A–C) and semiquantified concentration (Figure 2D–F) of Cl-PFPECA congeners measured in each sample, arranged in order of increasing distance from the previously identified (36) industrial source. Total Cl-PFPECA concentrations (as C9) in vegetative samples (dry-mass basis) generally are several-fold higher than previously reported for surface-soil samples collected for this study (36) and are comparable to other reported PFAS ranges in vegetation near fluorochemical manufacturing facilities with concentrations falling in the ng/g to μg/g range. (43) Although the sum of Cl-PFPECA congeners generally decreases with distance from the identified source in all matrices (Figure 2D–F), specific congener trends clearly observed in surface soil samples (36) are less pronounced in vegetation and subsoils, likely due to variability imparted by postdepositional transport and sorption processes. Nevertheless, as was previously reported for these surface soils, (36) the [0,1], [1,1], and [0,2] congeners dominate the signal response in vegetation and subsoil samples. These three congeners represent more than 91% of the total signal in surface soil samples, 96% in vegetation samples, and 98% in subsoil samples. The enrichment in relative signal from these dominant congeners in vegetation and subsoil is consistent with preferential mobility for lower molecular weight Cl-PFPECA congeners (7–10 fluorinated carbons) relative to higher molecular weight congeners, which can contain up to 13 fluorinated carbons. In particular, the [0,1] congener fraction increased considerably in both vegetation and subsoils, relative to that in surface soils (Figure 2A–C). This congener, with the lowest molecular weight of the 3 most-prevalent congeners, is thought to have enhanced environmental mobility, as witnessed by its wide distribution in both surface soil samples (36) and groundwater. (37) These data suggest that the higher mobility extends to plant uptake and subsurface vadose soil as well. Interestingly, vegetation samples did not show a significant difference in Cl-PFPECA composition when averaged across vegetation type or when categorized by short-lived grasses and weeds or long-term plants such as shrubs and trees (data not shown).
Figure 2.
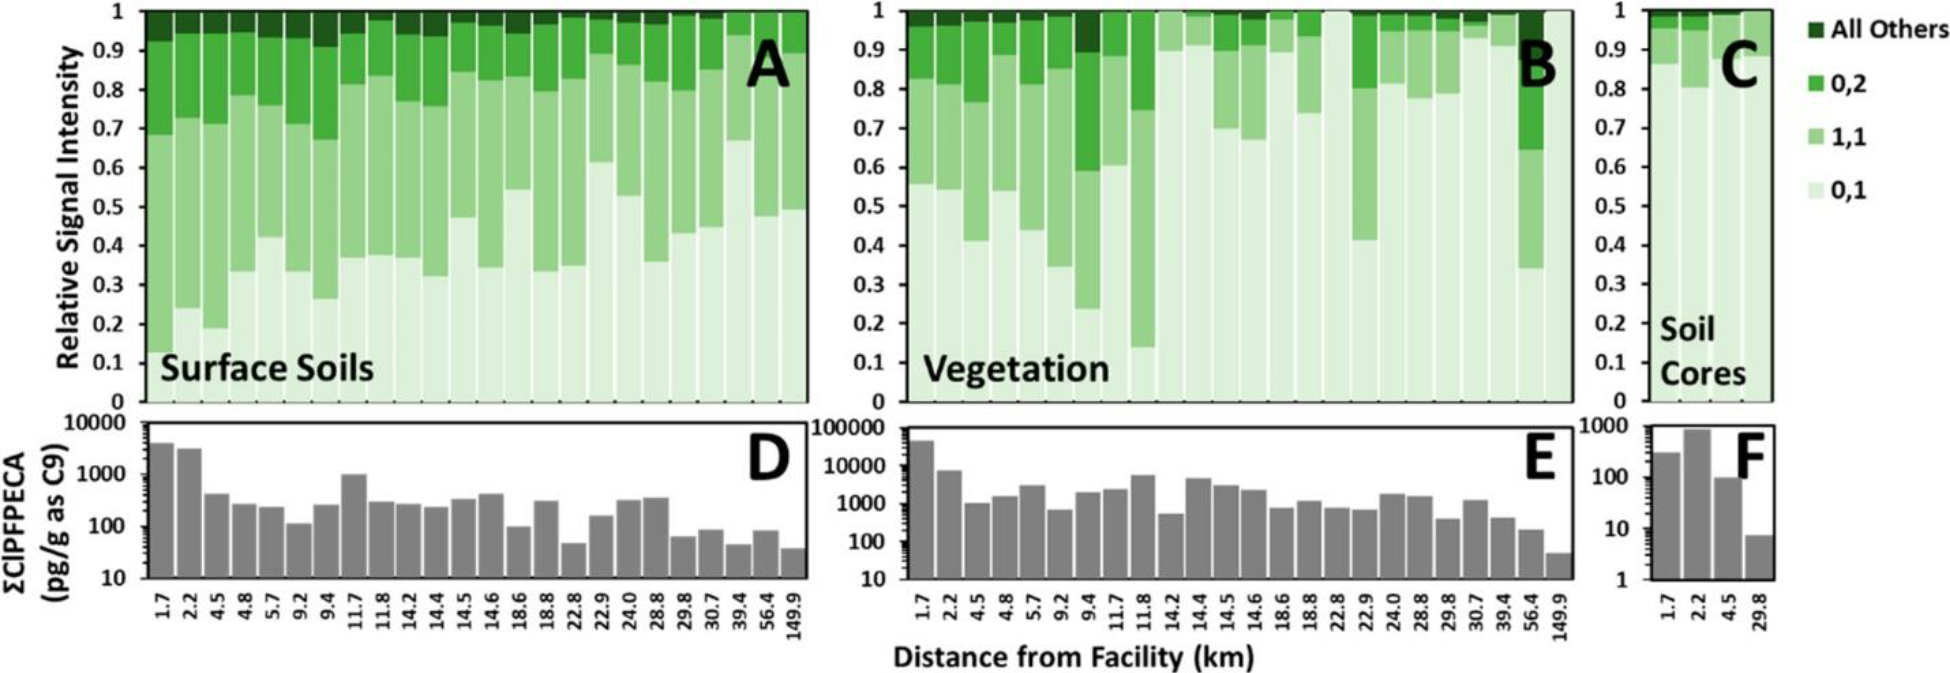
Congener distribution (A–C) and concentration as C9 (D–F) of Cl-PFPECA congeners in surface soils (A and D), vegetation (B and E), and subsoils (C and F) normalized by dry-sample mass. Samples ordered by distance from Solvay. Relative signal in vegetation and surface soils for all 24 samples is 86% vegetation and 14% surface soils. Relative signal strength in vegetation, surface soils, and deep soils for the four cored samples is 84% vegetation, 14% surface soil, and 2% deep soils. Note the greater fraction of the 0,1 congener in vegetation and deep soils (relative to that in surface soils), the increasing fraction of the lower molecular weight congeners with increasing distance from the facility, and the general decreasing trend in total Cl-PFPECAs with distance from the facility. See the text for discussion.
Three or more PFCA homologues were observed at quantifiable concentrations in all surface soils, (36) vegetation, and subsoil samples collected from New Jersey. Of all of the possible PFCA and vegetative and surface soil pairings in this study (216 homologue:sample pairings), 59% were measured above LOQ in both vegetation and surface soil, 34% were found only in surface soil, 4% were found only in vegetation, and 3% were < LOQ in both surface soil and vegetation. Of the possible PFCA and subsoil and surface soil pairings (44 homologue:sample pairings), 73% were measured above LOQ in both surface and subsoil, 20% were found only in surface soil, 5% were found only in subsoil, and 2% were < LOQ in both surface and subsoil.
The industrial source of the Cl-PFPECAs in the region has been identified as the Solvay manufacturing facility; (36) however, other facilities that use or manufacture fluorochemicals exist in the vicinity, including Chemours, situated south of Solvay in southern New Jersey. Figure 3 displays the relative composition (Figure 3A–C) and concentration (Figure 3D–F) of PFCA homologues measured in each sample, arranged in order of increasing distance from the Chemours manufacturing facility. (36) The total PFCA concentrations in vegetative samples (dry-mass basis) generally exceed those previously reported for surface soil samples in this study area; (36) however, whereas the sum of Cl-PFPECAs in all 24 samples is ~6-fold higher in vegetation relative to surface soils, it is <2-fold higher for PFCAs. This contrast in partitioning between Cl-PFPECAs, which were in use at the industrial source at the time of sampling, versus PFCAs, which include chain lengths ≥ C7 that largely have been phased out of use in the US, may reflect more substantial ongoing direct sorption from the atmosphere of Cl-PFPECAs to plant tissue than for the long-chain PFCAs.
Figure 3.
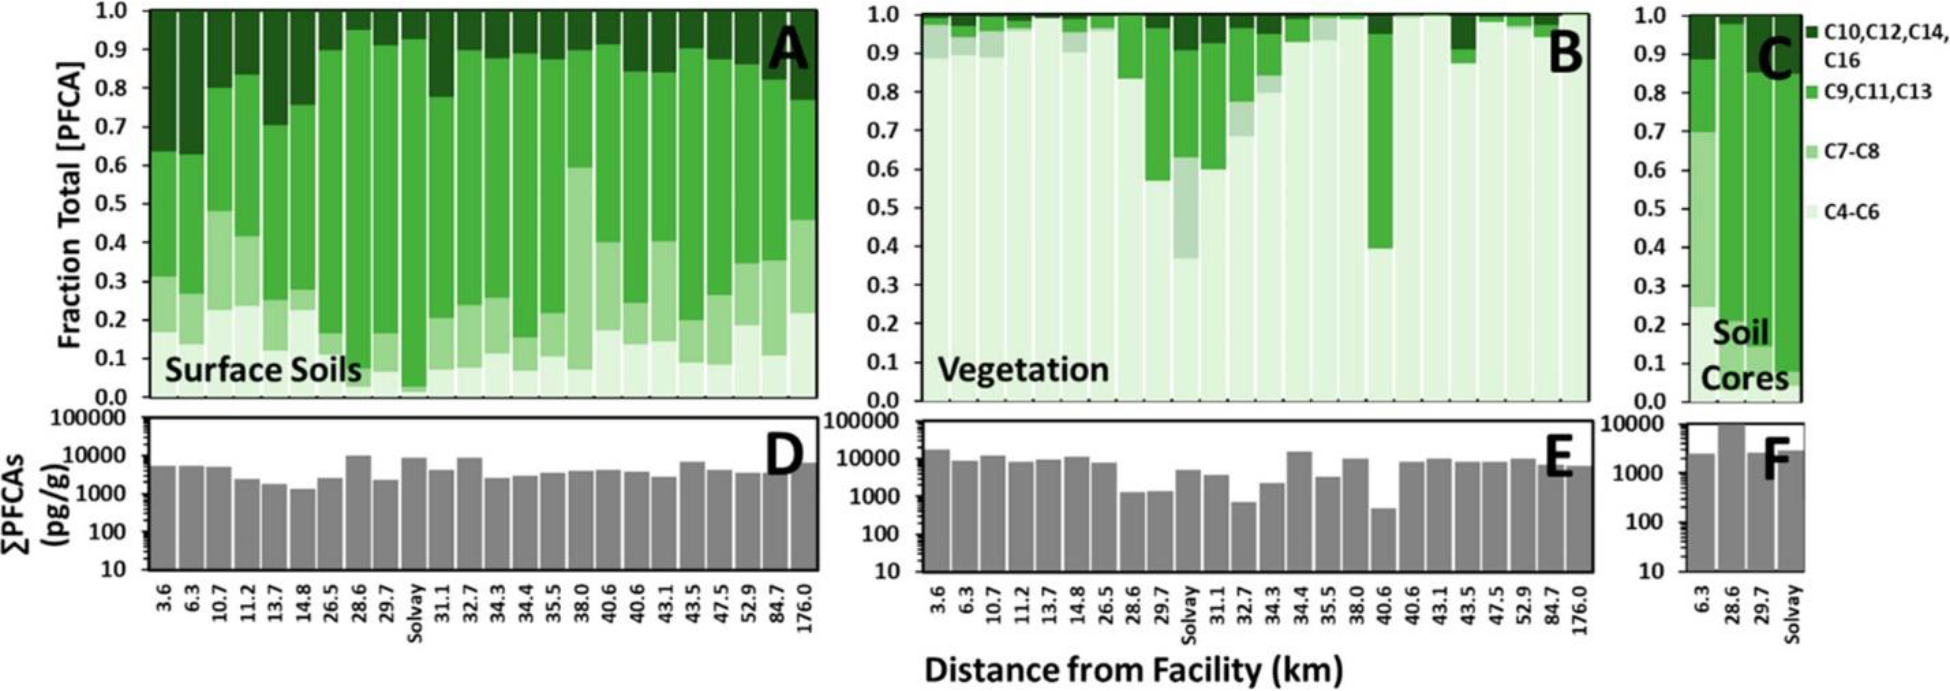
Homologue distribution (A–C) and concentration (D–F) of PFCAs in surface soils (A and D), vegetation (B and E), and subsoils (C and F) normalized by dry-sample mass. Samples ordered by distance from Chemours. The sample labeled Solvay is Sample 8, the closest sample to the Solvay facility. Relative concentrations in vegetation and surface soils for all 24 samples are 63% vegetation and 37% surface soils. Relative concentration strengths in vegetation, surface soils, and deep soils for the four cored samples is 27% vegetation, 44% surface soil, and 29% deep soils. Note the relatively large contribution of long even-numbered PFCAs (C10 + C12 + C14 + C16) in surface soil closest to Chemours, the relatively large contribution of long odd-numbered PFCAs (C9 + C11 + C13) in surface soils and vegetation near Solvay, and the contrast in deep soils of intermediately sized PFCAs with predominantly lower molecular weight congeners for Cl-PFPECAs. See the text for discussion.
The mean perfluorohexanoate and perfluoroheptanoate (C6 and C7 PFCAs) surface soil concentrations in this study exceed the global surface-soil background values we have reported previously. (44) And the minimum PFOA through perfluorododecanoic acid (PFDoA) (C8–C12 PFCAs) surface-soil concentrations in this study exceed the global surface soil background values reported previously. (44)
Consistent with the preferential accumulation of lower molecular weight Cl-PFPECA congeners in vegetation, vegetation also accumulated short-chain PFCAs preferentially compared to surface soils (Figure 3). Because the vegetation samples were exposed under real-world conditions, subjected to ambient weather cycles, there exists some ambiguity regarding exposure pathways, i.e., relative contributions from PFAS uptake from soil or deposition from air, rain, or suspended particulates onto plant tissue. Uptake from soil requires transport from the plant roots to shoots, a process that varies in complexity with properties of the xenobiotic compound, environmental conditions, and specific plant characteristics. (45) Alternatively, deposition onto exposed plant tissues from air, rain, or suspended particles serves as a direct mode by which contaminants might enter vegetative plant compartments.
Fluorochemical manufacturing facilities are substantial sources of PFAS emissions into the atmosphere, (43) with some atmospheric concentrations of ionic PFAS ranging upward of 1440 pg/m (3,46) and neutral PFAS up to 1297 pg/m (3,47) in Asia. Despite long-chain PFCA production having been phased out in the US since 2015, (48) PFOA and perfluorooctanesulfonic acid (PFOS) still commonly are detected in rainwater, (49,50) suggesting atmospheric persistence, while concentrations of short-chain replacement PFAS including perfluorobutanoate (PFBA) commonly are reported to have increased in rainwater. (50,51) Moreover, statistical modeling has suggested that PFAS profiles in rain are influenced by regional sources. (51)
The PFCA homologue profile in the subsurface soils (Figure 3C) contrasts sharply with that of Cl-PFPECAs (Figure 2C). Whereas the subsurface soils were dominated by lower molecular weight congeners of Cl-PFPECAs, subsurface soils generally exhibited PFCA homologue profiles similar to that of surface soils (Figure 3A,C). This contrasting pattern of Cl-PFPECA congener distribution vs PFCA homologue distribution in subsoils likely reflects, at least in part, relative timing of chemical use at Solvay. For more than a decade before 2003, Solvay used Surflon in its industrial processing, which contained a mix of PFNA, perfluoroundecanoate (PFUnA), and perfluorotridecanoate (PFTrA) (C9, C11, C13 in Figure 3). Between 2003 and 2009, Solvay transitioned from using Surflon to the Cl-PFPECAs. (38,52) Considering that lower molecular weight PFAS molecules generally have a higher mobility in the environment than larger, (1) the longer presence in New Jersey surface soils of Surflon chemicals than the Cl-PFPECAs offered additional time for less mobile homologues to percolate through the soil profile so that the PFCA homologue subsoil distribution more closely resembles that of the surface-soil profile (Figures 2A,C) than that of the Cl-PFPECAs (Figures 1A,C).
3.4. PFAS Accumulation in Vegetation and Subsoils
Accumulation factors were calculated for each sample location and analyte detected at (semi)quantifiable levels in both vegetation and subsurface soil according to eqs 1 and 2.
Log-transformed VAFs for Cl-PFPECAs and PFCAs are plotted against fluorinated-carbon chain length in Figure 4A. Both Cl-PFPECAs and PFCAs exhibit statistically significant decreasing linear trends (dotted lines) with increasing fluorinated chain length (CF2), which is consistent with published studies on PFAS accumulation in plants. (24,28,43) With the benefit of our data-rich PFCA sample set , an inflection point is evident in the sensitivity of Log VAF vs chain-length falling at (perfluoroheptanoate); the shorter chains bear a best-fit slope more than 4-fold steeper than the longer chains , and the difference in slopes is significant at (Table S11). Based on this short- vs long-chain VAF slope difference, accumulation of PFBA is roughly 15-fold more than would be anticipated based on the long-chain trend. At the same time, the slopes of the PFCAs and Cl-PFPECAs having are not statistically different from each other (Table S11), suggesting VAFs of long chains are more sensitive to CF2 chain length than to variation in the nonfluorinated moieties of our study compounds, Cl, and ether linkages.
Figure 4:

Vegetative accumulation factor (VAF) decreases with fluorinated carbon chain length for both Cl-PFPECAs (yellow) and legacy PFCAs (blue). Fitting PFCA and Cl-PFPECA data for chain length ≥6 yields trend lines having statistically similar slope (A). When the VAFs of all PFCA chain-lengths are regressed together, the result is nearly identical to the literature-review regression of Lesmeister et al. (28) (Figure S1). Subsoil accumulation factor (SAF) vs chain length for Cl-PFPECAs and PFCAs (B). In these SAFs, an inflection is evident at chain-length 8, perhaps reflecting a complex balance of sufficient relative mobility from the surface to the subsurface sample depth to deliver long chains vs still higher mobility for short chains fostering continued percolation to greater depths. Vegetative accumulation factor (VAFW) normalized to estimated soil-water concentration (using eq 2) vs chain length (C). The inflection at chain length 6 is even more pronounced when normalized to soil water, possibly reflecting a change in relative affinity of vegetation for the short chains. See text for details. Subsoil accumulation factor (SAFW) normalized to estimated soil–water concentration (using eq 2) vs chain length for Cl-PFPECAs and PFCAs (D). When normalized to estimated soil water the inflection observed in SAF at chain length 8 disappears, yielding a continuous linear function from C3 to C12, within the resolution of the data set. See the text for details.
Log-transformed SAFs for Cl-PFPECAs and PFCAs are plotted against CF2 in Figure 4B. Both the PFCAs with (PFNA) and the Cl-PFPECAs bear negative slopes which are statistically indistinguishable (Table S11). In contrast, PFCAs having display a positive slope that does differ statistically from the long-chain trend at (Table S11).
A noteworthy overarching contrast between VAFs (Figure 4A) and SAFs (Figure 4B) for Cl-PFPECAs vs PFCAs is that Cl-PFPECA VAFs exceed PFCA VAFs, but PFCA SAFs exceed Cl-PFPECA SAFs. As deposition of PFAS can vary spatially depending on local sources, (51) this contrast potentially reflects a temporal change in the local atmospheric release of Cl-PFPECAs relative to long-chain PFCAs. The release of Cl-PFPECAs to the atmosphere, which initiated in 2003 until the time of sampling, (38) evidently resulted in ongoing atmospheric deposition on vegetation, but offered only a limited time to migrate through the soil profile. This temporal-use pattern is opposite that of long-chain PFCAs which were in use for decades but were largely phased out over several years ending in 2015, (48) thereby diminishing ongoing flux from regional point sources to the atmosphere thence to vegetation but allowing a relatively longer time to migrate through the soil profile.
A uniquely prominent trait of PFAS, indeed the design intent for many, is their pronounced hydrophobicity, a characteristic that becomes more pronounced with increasing CF2 chain length. (53) Two general modes among three of PFAS accumulation in terrestrial vegetation, i.e., (i) root uptake and translocation, (ii) wet atmospheric deposition, and (iii) dry atmospheric deposition, involve transfer from the aqueous phase. With this in mind, we can explore more directly the role of relative hydrophobicity among PFAS species in the trends of Figures 3A,B by normalizing accumulation factors to estimated soil-water concentrations according to eq 2. In the absence of Kd values for the novel Cl-PFPECAs and considering the statistically indistinguishable VAF and SAF slopes for Cl-PFPECAs and long-chain PFCAs, we used Nguyen et al.’s (30) Kd values for the Cl-PFPECAs as well.
Log-transformed VAFs, normalized to estimated soil water concentrations (VAFWs), are plotted against chain-length in Figure 4C. Changing the normalization basis from “soil” to “soil water” imparts a dramatic change on the trends for Cl-PFPECAs and long-chain PFCAs, with slopes transitioning from negative for VAFs (Figure 4A) to positive for VAFWs (Figure 4B); these Cl-PFPECA and long-chain PFCA VAFW trend slopes do not differ from each other statistically (Table S11). Moreover, the positive aspects of these VAFW slopes are consistent with the large majority of accumulation factors reported for aquatic species. (54) This contrast of negative VAF slopes in terrestrial vegetation, vs the positive slopes in aquatic species, highlights a potential contrast in PFAS accumulation patterns in terrestrial- vs aquatic-based food webs; whereas short chains accumulate preferentially in terrestrial vegetation, long chains may accumulate preferentially in food webs based in aquatic vegetation- and detritus-consuming macroinvertebrates and fish.
In contrast to the dramatic change in slope from negative to positive for Cl-PFPECAs and long-chain PFCAs, short-chain PFCAs exhibit only a minor decrease in VAFW slope, with the inflection point remaining at for both VAF and VAFW. Considering that VAFWs express PFAS partitioning between vegetative tissue and soil water, the role of each the vegetative and aqueous phases in VAFWs can be elucidated given values that reflect the relative hydrophobicity among homologues. PFCA solubility is a suitable proxy to represent relative hydrophobicity; while the concentrations observed in our samples fall orders of magnitude below solubility limits, the relative solubility values among homologues likely reasonably reflects the relative chemical potentials of PFCA homologues of given concentrations under environmental conditions. Wang et al. (55) used COSMOtherm to generate solubility estimates as depicted in Figure 5. Using these Wang et al. estimates of as a metric of relative solubility, the relative affinity of vegetation for PFCA homologues can be estimated according to
| (3) |
Figure 5:
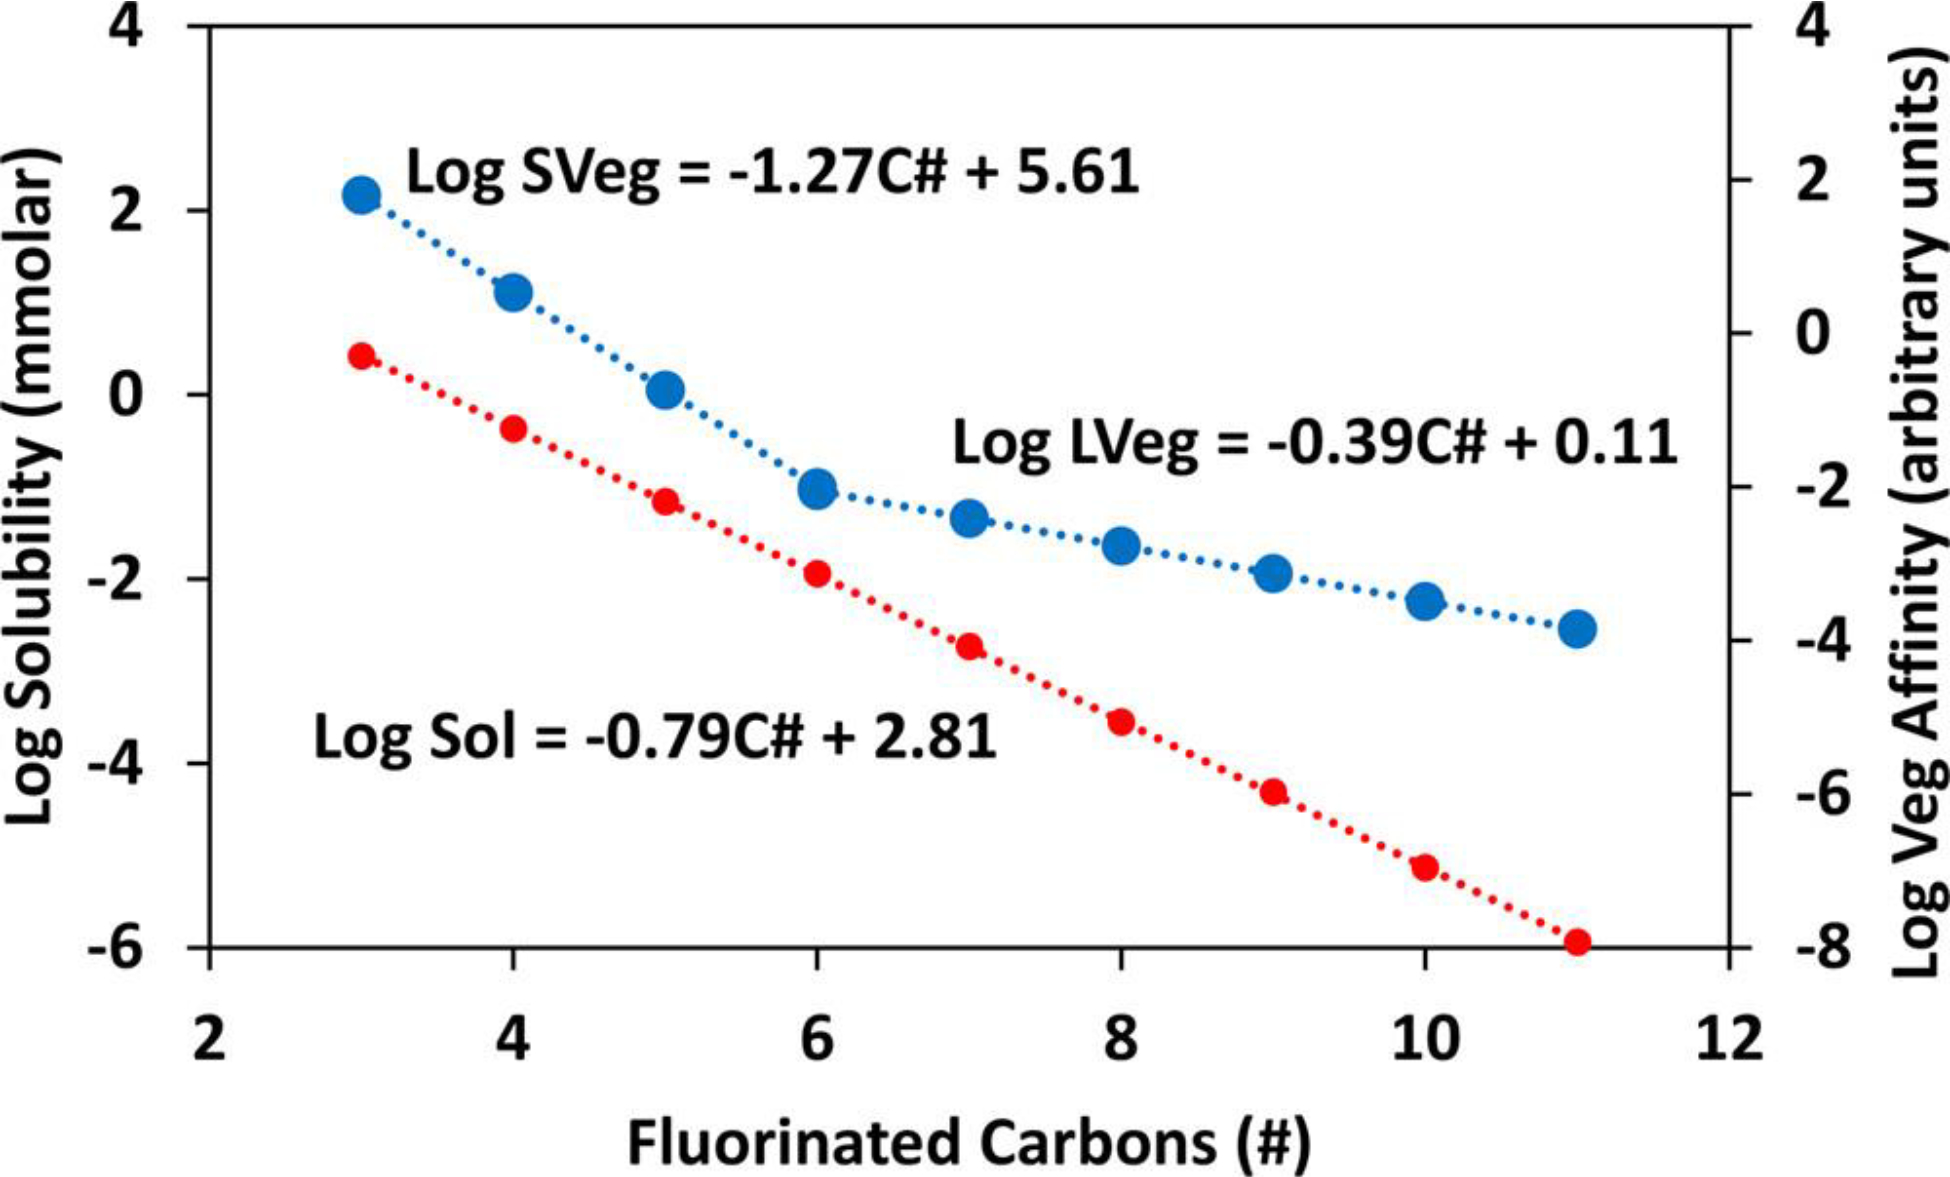
Log solubility (red; primary y axis) and log relative vegetative affinity (blue; secondary y axis) vs number of fluorinated carbons (CF2) for PFCAs. Solubility (red) was modeled by Wang et al. (55) Relative vegetative affinity for homologues is estimated by the regressions depicted in Figure 4C as explained in the text. According to this approach, the incremental increase in affinity of vegetation for PFCAs is greater for short chains (SVeg; ) than long chains (LVeg; ). For example, the relative affinity of perfluorobutane carboxylate () is >700-fold higher than suggested by the long-chain (LVeg) trend. Also noteworthy, the relative vegetative affinity slope is less than that of bulk-water solubility for long-chain PFCAs but greater than the solubility slope for short-chain PFCAs.
Substituting the Wang solubility function (Figure 5) for and the long-chain function (Figure 4C) into eq 3:
| (4) |
Using the same approach for the short-chain PFCAs, the relative affinity of vegetation for PFCA homologues is plotted in Figure 5. With this approach, the inflection point observed at for log VAF and log VAFW remains for the relative vegetation–PFCA affinity, with statistically different slopes for short vs long chains (Tables S11–S12), and therefore appears to be founded upon the interaction of vegetative tissue with PFCAs. These affinity values are best thought of relative among homologues only, expressed in arbitrary units, because the VAFWs expressed for our environmental samples are unlikely to be maintained at the limits of PFAS solubility in water due to toxicity or other effects. Nevertheless, this approach suggests a fundamental change in the sensitivity of vegetation affinity for PFAS at chain-lengths of under the ambient environmental conditions of our vegetation samples. In turn, this discrete change in sensitivity of vegetative affinity for short chains, from the relation expressed for long chains, suggests that the fluorinated chain affects the vegetation–PFCA interaction beyond simple hydrophobic effects, an effect that is robust across the numerous vegetative species of this study (Table S2) and a study area spanning >180 km (Table S1).
Using the approach described in eqs 3 and 4, subsurface soil accumulation factors, normalized to estimated soil-water concentration (SAFWs), are depicted in Figure 4D. In contrast to the VAFWs, which accentuated the VAF inflection point at , the SAF inflection point at is not observed in SAFWs, with a continuous linear function of log SAFW over all chain lengths . In this light, the inflection observed in SAF at appears simply to reflect a balance of sufficient mobility to migrate from the surface to sampling depth within a given time frame against more extensive leaching for the higher mobility short-chain PFCAs. Recalling the contrast between Cl-PFPECA (which had been in use at the time samples were collected) subsoil profiles being dominated by the smallest congeners (Figure 2C) vs the PFCA (for which PFOA and longer homologues were phased out of use by 2015) subsoil profiles being dominated by longer chain homologues (Figure 3C), the SAF inflection point observed at (Figure 4B) might well migrate with time since PFAS deposition diminished at the soil surface, with no inflection point at the time of initial soil deposition then, with increasing time of leaching, appearing and migrating toward increasing chain lengths through time. The effect of limited time for leaching affecting the subsurface Cl-PFPECA congener profile is consistent with the observation of dominantly lower molecular weight congeners in groundwater. (37) For example, one of the smallest Cl-PFPECA species, the 7 fluorinated-carbon species (0,1) Cl-PFPECA, was observed to constitute ~40% of total Cl-PFPECAs in surface soil samples (36) but was the primary species in water samples (>94% of total Cl-PFPECAs) and the only detected congener in the groundwater samples in the vicinity of the manufacturing facility. (37)
Soil organic matter and cation-exchange capacity (CEC) have been proposed as important factors impacting PFAS accumulation in plants. (25) However, we did not observe statistically significant correlations between our PFAS-accumulation data and the conventional soil characterization data summarized in the SI. Consistent with our efforts, an analysis of available data by Li et al. (56) on the role of soil characteristics suggests that PFAS sorption in the environment could not be explained by organic content or environmental pH alone.
3.5. Chemistry Impacts on Accumulation
In one of the few studies comparing alternative PFAS within the same series, Lin et al. compared the accumulation of two chlorinated polyfluorinated ether sulfonate (Cl-PFAES) congeners found in the commercial mixture F-53B (trade name) in wheat seedlings with that of PFOS under controlled conditions in a growth chamber. (57) Structurally, 6:2 Cl-PFAES is identical to PFOS, except for the addition of an ether linkage and substitution of a chlorine for a fluorine; 8:2 Cl-PFAES is likewise related to perfluorodecanesulfonic acid. The Lin et al. study provided a controlled comparison between compounds with similar differences to those in our study, with plant uptake occurring only through the roots. The same authors found that the accumulation factors for 6:2 Cl-PFAES and PFOS were insignificantly different in both shoots and roots, suggesting that the structural changes did not strongly influence accumulation. However, 8:2 Cl-PFPAES accumulation factors were significantly lower than PFOS and 6:2 Cl-PFPAES, and comparing the two Cl-PFPAES compounds found a decrease in the Log(BCFshoot) of approximately −0.27 per fluorinated carbon, consistent with trends observed for PFSAs and PFCAs. (24,28) Applying the influence of ether linkages and chlorine substitution reported by Lin et al. to our study, Cl-PFPECAs might be expected to have similar accumulation factors to PFCAs of equal chain length and similar trend with the number of fluorinated carbons. While trends in our VAFs for Cl-PFPECAs and PFCAs are statistically indistinguishable (Table S11), Cl-PFPECA VAFs exceed those of PFCAs by more than 10-fold. This deviation of our VAFs for vegetation collected from the ambient environment from the controlled conditions of Lin et al. likely are due at least in part to Cl-PFPECA deposition directly onto the vegetation from the atmosphere.
4. Environmental Implications and Outlook
Evaluating accumulation of multiple PFAS congeners and families in ambient vegetation, surface soils and subsoils yields valuable information regarding the mobility, environmental partitioning, and exposure potential of these persistent contaminants in real-world matrices. Vegetative accumulation factors from soil decreased with increasing chain length for both Cl-PFPECAs and PFCAs, as demonstrated by previous studies, where short-chain PFAS like PFBA accumulate primarily in the above-ground tissues of terrestrial vegetation, (13,25) a trend opposite that of the increasing trends in accumulation from water with chain lengths usually observed in aquatic biota. (54) When terrestrial-vegetative PFAS are normalized to estimated soil water, the trend as a function of chain length inverts from negative to positive for Cl-PFPECAs and long-chain PFCAs, consistent with aquatic accumulation patterns, (54) suggesting the negative terrestrial VAF slopes for these long-chain PFAS compounds is influenced by sorbed vs bulk-water partitioning. These contrasting trends suggest the potential for aquatic-based food webs to accumulate relatively more toxic long-chain PFAS as compared to food-webs based in terrestrial vegetation and can have important implications for phytoremediation strategies, (58) as shown by Wang et al. where emerged plants showed higher accumulation of PFBA and PFBS but lower accumulation of PFOA and PFOS than submerged aquatic plants. (59)
In contrast to the positive VAFW slope of long-chain PFAS, short-chain PFCAs maintained a negative VAFW slope with increasing chain length. Based on the inflection we observed in VAFs and VAFWs, there appears to be a fundamental change in sensitivity of vegetation to chain length at . For shorter chains, our data indicate vegetation accumulates PFAS more effectively than for longer chains. Considering the higher accumulation we observed for short-chain PFAS in light of previous studies, we found only a few studies reporting on vegetative accumulation that include both short- and long-chain PFAS. Among these, the data from a field-based study of Wen et al. (60) (Figure S4), conducted in Asia, yielded a steeper slope for relative to (Table S12), consistent with our findings in North America. On the other hand, for the greenhouse accumulation data (Figure S5; Table S12) of Krippner et al. (61) there is no inflection evident in accumulation factors over the range . Likewise, the greenhouse data of Blaine et al. (62) exhibit no obvious inflection in their accumulation factors for (Figure 2 in Blaine et al.). This contrast of accumulation-factor inflections in slope at in ambient real-world vegetation of this study and Wen et al., but not under the controlled greenhouse-study conditions of Krippner et al. and Blaine et al., suggests the mode of excess short-chain accumulation under ambient conditions may be via direct transfer from the atmosphere to vegetation. This implication is further supported by the newly published study of Shen et al. (63) who report that dry deposition of short-chain PFAS was proportionally greater in the field soils than in the greenhouse soils of their study.
With the transition away from use of long-chain PFAS to replacement compounds, commonly having , these observations suggest an ongoing potential for logarithmically higher PFAS accumulation in vegetation for short-chains relative to long-chains at the base of terrestrial food webs for given loadings of PFAS in surface soils. Considering that PFAS are distributed globally via atmospheric transport, (27,47,51,64) that lower molecular weights of at least some PFAS have been shown to be atmospherically transported greater distances than higher, (36) and that the short-chain PFBA has more atmospheric sources than longer chain PFCAs, (65) to the extent the short-chain VAF trend we report here for above-ground nonwoody vegetative tissue is expressed in vegetative food tissue, these elevated short-chain PFAS VAFs potentially constitute a considerable route of exposure globally for humans and wildlife at levels higher than have been anticipated previously. For example, PFBA VAF is roughly 15-fold higher for our data than would be expected based on our legacy long-chain VAF trend (Figure 4A).
There is a paucity of published toxicological studies on short-chain PFAS compared to long-chains. For humans, however, PFBA has been reported to activate peroxisome proliferator-activated receptors, (66) been associated with hypertension, (66) been shown to impose cytotoxicity and perhaps adipogenic and osteogenic activity in human cells, (67) and been reported to pose a risk for increased severity of infection with Covid 19. (68) In high doses in rodents, PFBA has been reported to affect pup development as well as liver and thyroid development and activity. (66)
Taking together the documented global atmospheric transport and distribution of PFAS, (27,47,51,64) the wider atmospheric dispersion of shorter PFAS species than longer, (36) the recent transition of industry to use of shorter chain PFAS, (48) and the potential toxicity of some of these chemicals, (66−68) the logarithmically increased vegetative accumulation we report here in ambient, real-world vegetation of short-chain PFAS relative to long chains (Figures 3 and 4), presents the potential for impactful global PFAS exposures at unanticipated levels for humans and wildlife now and, barring intervention, in the future. The full scientific implications of the PFAS VAF patterns we report here are yet to be determined; however, the scale of exposure potentially is global, so our hope for this report is to persuade future-focused scrutiny of the accumulation of short-chain PFAS in real-world ambient and agricultural vegetation to better characterize this phenomenon.
Supplementary Material
Synopsis.
Accumulation of next-generation and legacy PFAS in exposed vegetation is inversely correlated with fluorocarbon chain length and is potentially a consequence of relative hydrophobicity in long-chain PFAS.
Acknowledgments
We thank anonymous reviewers for helpful suggestions. This research was supported by the EPA, Office of Research and Development and the NJDEP, Site Remediation and Waste Management Program. The views expressed in this paper are those of the authors and do not necessarily represent the views or policies of the U.S. Environmental Protection Agency (EPA). Mention of trade names or products does not convey official EPA approval, endorsement or recommendation.
Abbreviations
- PFAS
per- and polyfluorinated alkyl substances
- Cl-PFPECAs
chloroperfluoropolyethercarboxylates
- PFCAs
perfluorocarboxylates
- AFs
accumulation factors
- VAF
vegetative accumulation factor
- SAF
subsoil accumulation factor
- VAFW
vegetative accumulation factors, relative to estimated soil-water concentration
- SAFW
subsoil accumulation factor, relative to estimated soil water
- PFSAs
perfluorosulfonates
- PFOA
perfluorooctanoic acid
- PFDoA
perfluorododecanoic acid
- PFOS
perfluorooctanesulfonic acid
- PFNA
perfluorononanoate
- PFUnA
perfluoroundecanoate
- PFTrA
perfluorotridecanoate
- PFBA
perfluorobutanoate
- TOC
total organic carbon
Footnotes
The authors declare no competing financial interest.
M.J.B.D.: Retired.
Supporting Information
This article includes supporting information online.
Additional sample preparation methodology, sample site details, vegetative sample details, instrumentation parameters, soil and geochemical properties, equation derivations, sample recoveries, estimated PFAS concentrations in vegetation, estimated PFAS concentrations in deep soil cores, statistical tests, normalized signal of internal standards by sample, internal standard suppression by compound, Log SCF vs fluorinated carbon number plots
References
- 1.Evich MG; Davis MJB; McCord JP; Acrey B; Awkerman JA; Knappe DRU; Lindstrom AB; Speth TF; Tebes-Stevens C; Strynar MJ; Wang Z; Weber EJ; Henderson WM; Washington JW Per- and polyfluoroalkyl substances in the environment. Science 2022, 375 (6580), eabg9065 DOI: 10.1126/science.abg9065 [DOI] [PMC free article] [PubMed] [Google Scholar]
- 2.Costello MCS; Lee LS Sources, Fate, and Plant Uptake in Agricultural Systems of Per- and Polyfluoroalkyl Substances. Current Pollution Reports 2020, DOI: 10.1007/s40726-020-00168-y [DOI] [Google Scholar]
- 3.Sunderland EM; Hu XC; Dassuncao C; Tokranov AK; Wagner CC; Allen JG A review of the pathways of human exposure to poly- and perfluoroalkyl substances (PFASs) and present understanding of health effects. Journal of Exposure Science & Environmental Epidemiology 2019, 29 (2), 131–147, DOI: 10.1038/s41370-018-0094-1 [DOI] [PMC free article] [PubMed] [Google Scholar]
- 4.Brown JB; Conder JM; Arblaster JA; Higgins CP Assessing Human Health Risks from Per- and Polyfluoroalkyl Substance (PFAS)-Impacted Vegetable Consumption: A Tiered Modeling Approach. Environ. Sci. Technol. 2020, 54 (23), 15202–15214, DOI: 10.1021/acs.est.0c03411 [DOI] [PubMed] [Google Scholar]
- 5.Wang X; Wang Y; Li J; Liu J; Zhao Y; Wu Y Occurrence and dietary intake of Perfluoroalkyl substances in foods of the residents in Beijing, China. Food Addit Contam Part B Surveill 2021, 14 (1), 1–11, DOI: 10.1080/19393210.2020.1821098 [DOI] [PubMed] [Google Scholar]
- 6.Hlouskova V; Hradkova P; Poustka J; Brambilla G; De Filipps SP; D’Hollander W; Bervoets L; Herzke D; Huber S; de Voogt P; Pulkrabova J Occurrence of perfluoroalkyl substances (PFASs) in various food items of animal origin collected in four European countries. Food Additives and Contaminants Part a-Chemistry Analysis Control Exposure & Risk Assessment 2013, 30 (11), 1918–1932, DOI: 10.1080/19440049.2013.837585 [DOI] [PubMed] [Google Scholar]
- 7.Barhoumi B; Sander SG; Driss MR; Tolosa I Survey of legacy and emerging per- and polyfluorinated alkyl substances in Mediterranean seafood from a North African ecosystem. Environ. Pollut. 2022, 292 (Pt B), 118398, DOI: 10.1016/j.envpol.2021.118398 [DOI] [PubMed] [Google Scholar]
- 8.Jha G; Kankarla V; McLennon E; Pal S; Sihi D; Dari B; Diaz D; Nocco M Per- and Polyfluoroalkyl Substances (PFAS) in Integrated Crop-Livestock Systems: Environmental Exposure and Human Health Risks. International journal of environmental research and public health 2021, 18 (23), 12550, DOI: 10.3390/ijerph182312550 [DOI] [PMC free article] [PubMed] [Google Scholar]
- 9.Judy JD; Gravesen C; Christopher Wilson P; Lee L; Sarchapone J; Hinz F; Broadbent E Trophic transfer of PFAS from tomato (Solanum lycopersicum) to tobacco hornworm (Manduca sexta) caterpillars. Environ. Pollut. 2022, 310, 119814, DOI: 10.1016/j.envpol.2022.119814 [DOI] [PubMed] [Google Scholar]
- 10.Dreyer A; Kirchgeorg T; Weinberg I; Matthias V Particle-size distribution of airborne poly- and perfluorinated alkyl substances. Chemosphere 2015, 129, 142–149, DOI: 10.1016/j.chemosphere.2014.06.069 [DOI] [PubMed] [Google Scholar]
- 11.Han D; Ma Y; Huang C; Zhang X; Xu H; Zhou Y; Liang S; Chen X; Huang X; Liao H; Fu S; Hu X; Cheng J Occurrence and source apportionment of perfluoroalkyl acids (PFAAs) in the atmosphere in China. Atmos. Chem. Phys. 2019, 19 (22), 14107–14117, DOI: 10.5194/acp-19-14107-2019 [DOI] [Google Scholar]
- 12.Yamazaki E; Taniyasu S; Noborio K; Eun H; Thaker P; Kumar NJI; Wang X; Yamashita N Accumulation of perfluoroalkyl substances in lysimeter-grown rice in Japan using tap water and simulated contaminated water. Chemosphere 2019, 231, 502–509, DOI: 10.1016/j.chemosphere.2019.05.022 [DOI] [PubMed] [Google Scholar]
- 13.Scher DP; Kelly JE; Huset CA; Barry KM; Hoffbeck RW; Yingling VL; Messing RB Occurrence of perfluoroalkyl substances (PFAS) in garden produce at homes with a history of PFAS-contaminated drinking water. Chemosphere 2018, 196, 548–555, DOI: 10.1016/j.chemosphere.2017.12.179 [DOI] [PubMed] [Google Scholar]
- 14.Dalahmeh S; Tirgani S; Komakech AJ; Niwagaba CB; Ahrens L Per- and polyfluoroalkyl substances (PFASs) in water, soil and plants in wetlands and agricultural areas in Kampala, Uganda. Science of the total environment 2018, 631–632, 660–667, DOI: 10.1016/j.scitotenv.2018.03.024 [DOI] [PubMed] [Google Scholar]
- 15.Lasier PJ; Washington JW; Hassan SM; Jenkins TM Perfluorinated chemicals in surface waters and sediments from northwest Georgia, USA, and their bioaccumulation in Lumbriculus variegatus. Environ. Toxicol. Chem. 2011, 30 (10), 2194–2201, DOI: 10.1002/etc.622 [DOI] [PubMed] [Google Scholar]
- 16.Navarro I; de la Torre A; Sanz P; Porcel M; Pro J; Carbonell G; Martínez ML Uptake of perfluoroalkyl substances and halogenated flame retardants by crop plants grown in biosolids-amended soils. Environ. Res. 2017, 152, 199–206, DOI: 10.1016/j.envres.2016.10.018 [DOI] [PubMed] [Google Scholar]
- 17.Chu S; Letcher RJ Side-chain fluorinated polymer surfactants in aquatic sediment and biosolid-augmented agricultural soil from the Great Lakes basin of North America. Science of the total environment 2017, 607–608, 262–270, DOI: 10.1016/j.scitotenv.2017.06.252 [DOI] [PubMed] [Google Scholar]
- 18.Washington JW; Yoo H; Ellington JJ; Jenkins TM; Libelo EL Concentrations, Distribution, and Persistence of Perfluoroalkylates in Sludge-Applied Soils near Decatur, Alabama, USA. Environ. Sci. Technol. 2010, 44 (22), 8390–8396, DOI: 10.1021/es1003846 [DOI] [PubMed] [Google Scholar]
- 19.Liu Z; Lu Y; Song X; Jones K; Sweetman AJ; Johnson AC; Zhang M; Lu X; Su C Multiple crop bioaccumulation and human exposure of perfluoroalkyl substances around a mega fluorochemical industrial park, China: Implication for planting optimization and food safety. Environ. Int. 2019, 127, 671–684, DOI: 10.1016/j.envint.2019.04.008 [DOI] [PubMed] [Google Scholar]
- 20.Bao J; Yu WJ; Liu Y; Wang X; Jin YH; Dong GH Perfluoroalkyl substances in groundwater and home-produced vegetables and eggs around a fluorochemical industrial park in China. Ecotoxicol Environ. Saf 2019, 171, 199–205, DOI: 10.1016/j.ecoenv.2018.12.086 [DOI] [PubMed] [Google Scholar]
- 21.Galloway JE; Moreno AVP; Lindstrom AB; Strynar MJ; Newton S; May AA; Weavers LK Evidence of Air Dispersion: HFPO-DA and PFOA in Ohio and West Virginia Surface Water and Soil near a Fluoropolymer Production Facility. Environ. Sci. Technol. 2020, 54 (12), 7175–7184, DOI: 10.1021/acs.est.9b07384 [DOI] [PMC free article] [PubMed] [Google Scholar]
- 22.Wang W; Yuan S; Kwon JH Insight into the uptake and translocation of per- and polyfluoroalkyl substances in hydroponically grown lettuce. Environ. Sci. Pollut Res. Int. 2022, 29 (56), 85454–85464, DOI: 10.1007/s11356-022-21886-4 [DOI] [PubMed] [Google Scholar]
- 23.Xu B; Qiu W; Du J; Wan Z; Zhou JL; Chen H; Liu R; Magnuson JT; Zheng C Translocation, bioaccumulation, and distribution of perfluoroalkyl and polyfluoroalkyl substances (PFASs) in plants. iScience 2022, 25 (4), 104061, DOI: 10.1016/j.isci.2022.104061 [DOI] [PMC free article] [PubMed] [Google Scholar]
- 24.Yoo H; Washington JW; Jenkins TM; Ellington JJ Quantitative Determination of Perfluorochemicals and Fluorotelomer Alcohols in Plants from Biosolid-Amended Fields using LC/MS/MS and GC/MS. Environ. Sci. Technol. 2011, 45 (19), 7985–7990, DOI: 10.1021/es102972m [DOI] [PubMed] [Google Scholar]
- 25.Ghisi R; Vamerali T; Manzetti S Accumulation of perfluorinated alkyl substances (PFAS) in agricultural plants: A review. Environ. Res. 2019, 169, 326–341, DOI: 10.1016/j.envres.2018.10.023 [DOI] [PubMed] [Google Scholar]
- 26.Lyu X; Xiao F; Shen C; Chen J; Park CM; Sun Y; Flury M; Wang D Per- and Polyfluoroalkyl Substances (PFAS) in Subsurface Environments: Occurrence, Fate, Transport, and Research Prospect. Reviews of Geophysics 2022, 60, e2021RG000765 DOI: 10.1029/2021RG000765 [DOI] [Google Scholar]
- 27.Rankin K; Mabury SA; Jenkins TM; Washington JW A North American and global survey of perfluoroalkyl substances in surface soils: Distribution patterns and mode of occurrence. Chemosphere 2016, 161, 333–341, DOI: 10.1016/j.chemosphere.2016.06.109 [DOI] [PubMed] [Google Scholar]
- 28.Lesmeister L; Lange FT; Breuer J; Biegel-Engler A; Giese E; Scheurer M Extending the knowledge about PFAS bioaccumulation factors for agricultural plants - A review. Science of The Total Environment 2021, 766, 142640, DOI: 10.1016/j.scitotenv.2020.142640 [DOI] [PubMed] [Google Scholar]
- 29.Yoo H; Washington JW; Ellington JJ; Jenkins TM; Meill MP Concentrations, Distribution, and Persistence of Fluorotelomer Alcohols in Sludge-Applied Soils near Decatur, Alabama, USA. Environ. Sci. Technol. 2010, 44, 8397–8402, DOI: 10.1021/es100390r [DOI] [PubMed] [Google Scholar]
- 30.Nguyen TMH; Bräunig J; Thompson K; Thompson J; Kabiri S; Navarro DA; Kookana RS; Grimison C; Barnes CM; Higgins CP; McLaughlin MJ; Mueller JF Influences of Chemical Properties, Soil Properties, and Solution pH on Soil-Water Partitioning Coefficients of Per- and Polyfluoroalkyl Substances (PFASs). Environ. Sci. Technol. 2020, 54 (24), 15883–15892, DOI: 10.1021/acs.est.0c05705 [DOI] [PubMed] [Google Scholar]
- 31.Barzen-Hanson KA; Roberts SC; Choyke S; Oetjen K; McAlees A; Riddell N; McCrindle R; Ferguson PL; Higgins CP; Field JA Discovery of 40 Classes of Per- and Polyfluoroalkyl Substances in Historical Aqueous Film-Forming Foams (AFFFs) and AFFF-Impacted Groundwater. Environ. Sci. Technol. 2017, 51 (4), 2047–2057, DOI: 10.1021/acs.est.6b05843 [DOI] [PubMed] [Google Scholar]
- 32.McCord J; Newton S; Strynar M Validation of quantitative measurements and semi-quantitative estimates of emerging perfluoroethercarboxylic acids (PFECAs) and hexfluoroprolyene oxide acids (HFPOAs). J. Chromatogr A 2018, 1551, 52–58, DOI: 10.1016/j.chroma.2018.03.047 [DOI] [PMC free article] [PubMed] [Google Scholar]
- 33.Zhang C; Hopkins ZR; McCord J; Strynar MJ; Knappe DRU Fate of Per- and Polyfluoroalkyl Ether Acids in the Total Oxidizable Precursor Assay and Implications for the Analysis of Impacted Water. Environmental Science & Technology Letters 2019, 6 (11), 662–668, DOI: 10.1021/acs.estlett.9b00525 [DOI] [PMC free article] [PubMed] [Google Scholar]
- 34.Strynar M; Dagnino S; McMahen R; Liang S; Lindstrom A; Andersen E; McMillan L; Thurman M; Ferrer I; Ball C Identification of Novel Perfluoroalkyl Ether Carboxylic Acids (PFECAs) and Sulfonic Acids (PFESAs) in Natural Waters Using Accurate Mass Time-of-Flight Mass Spectrometry (TOFMS). Environ. Sci. Technol. 2015, 49 (19), 11622–30, DOI: 10.1021/acs.est.5b01215 [DOI] [PubMed] [Google Scholar]
- 35.Evich MG; Davis M; Weber EJ; Tebes-Stevens C; Acrey B; Henderson WM; Goodrow S; Bergman E; Washington JW Environmental Fate of Cl-PFPECAs: Predicting the Formation of PFAS Transformation Products in New Jersey Soils. Environ. Sci. Technol. 2022, 56 (12), 7779–7788, DOI: 10.1021/acs.est.1c06126 [DOI] [PMC free article] [PubMed] [Google Scholar]
- 36.Washington JW; Rosal CG; McCord JP; Strynar MJ; Lindstrom AB; Bergman EL; Goodrow SM; Tadesse HK; Pilant AN; Washington BJ; Davis MJ; Stuart BG; Jenkins TM Nontargeted mass-spectral detection of chloroperfluoropolyether carboxylates in New Jersey soils. Science 2020, 368, 1103–1107, DOI: 10.1126/science.aba7127 [DOI] [PMC free article] [PubMed] [Google Scholar]
- 37.McCord JP; Strynar M; Washington JW; Bergman EL; Goodrow SM Emerging chlorinated polyfluorinated polyether compounds impacting the waters of southeastern New Jersey identified by use of nontargeted analysis. Environmental Science & Technology Letters 2020, 7, 903–908, DOI: 10.1021/acs.estlett.0c00640 [DOI] [PMC free article] [PubMed] [Google Scholar]
- 38.Post GB Technical Support Document: Interim Specific Ground Water Quality Criterion for Chloroperfluoropolyether Carboxylates; New Jersey Department of Environmental Protection, Division of Science and Research, October 20, 2021; p 108. [Google Scholar]
- 39.Washington JW; Naile JE; Jenkins TM; Lynch DG Characterizing Fluorotelomer and Polyfluoroalkyl Substances in New and Aged Fluorotelomer-Based Polymers for Degradation Studies with GC/MS and LC/MS/MS. Environ. Sci. Technol. 2014, 48 (10), 5762–5769, DOI: 10.1021/es500373b [DOI] [PubMed] [Google Scholar]
- 40.Washington JW; Jenkins TM; Rankin K; Naile JE Decades-scale degradation of commercial, side-chain, fluorotelomer-based polymers in soils & water. Environ. Sci. Technol. 2015, 49 (2), 915–923, DOI: 10.1021/es504347u [DOI] [PubMed] [Google Scholar]
- 41.Brandsma SH; Koekkoek JC; van Velzen MJM; de Boer J The PFOA substitute GenX detected in the environment near a fluoropolymer manufacturing plant in the Netherlands. Chemosphere 2019, 220, 493–500, DOI: 10.1016/j.chemosphere.2018.12.135 [DOI] [PubMed] [Google Scholar]
- 42.Nassazzi W; Lai FY; Ahrens L A novel method for extraction, clean-up and analysis of per- and polyfluoroalkyl substances (PFAS) in different plant matrices using LC-MS/MS. Journal of Chromatography B 2022, 1212, 123514, DOI: 10.1016/j.jchromb.2022.123514 [DOI] [PubMed] [Google Scholar]
- 43.Li J; Sun J; Li P Exposure routes, bioaccumulation and toxic effects of per- and polyfluoroalkyl substances (PFASs) on plants: A critical review. Environ. Int. 2022, 158, 106891, DOI: 10.1016/j.envint.2021.106891 [DOI] [PubMed] [Google Scholar]
- 44.Washington JW; Rankin K; Libelo EL; Lynch DG; Cyterski M Determining global background soil PFAS loads and the fluorotelomer-based polymer degradation rates that can account for these loads. Sci. Total Environ. 2019, 651, 2444–2449, DOI: 10.1016/j.scitotenv.2018.10.071 [DOI] [PMC free article] [PubMed] [Google Scholar]
- 45.Cunningham SD; Shann JR; Crowley DE; Anderson TA Phytoremediation of Contaminated Water and Soil. In Phytoremediation of Soil and Water Contaminants; American Chemical Society: 1997; Vol. 664, pp 2–17. [Google Scholar]
- 46.Guo M; Lyu Y; Xu T; Yao B; Song W; Li M; Yang X; Cheng T; Li X Particle size distribution and respiratory deposition estimates of airborne perfluoroalkyl acids during the haze period in the megacity of Shanghai. Environ. Pollut. 2018, 234, 9–19, DOI: 10.1016/j.envpol.2017.10.128 [DOI] [PubMed] [Google Scholar]
- 47.Li J; Del Vento S; Schuster J; Zhang G; Chakraborty P; Kobara Y; Jones KC Perfluorinated Compounds in the Asian Atmosphere. Environ. Sci. Technol. 2011, 45 (17), 7241–7248, DOI: 10.1021/es201739t [DOI] [PubMed] [Google Scholar]
- 48.EPA 2010/2015. PFOA Stewardship Program. http://www.epa.gov/oppt/pfoa/pubs/stewardship/index.html (accessed May 16, 2022).
- 49.Kwok KY; Taniyasu S; Yeung LWY; Murphy MB; Lam PKS; Horii Y; Kannan K; Petrick G; Sinha RK; Yamashita N Flux of Perfluorinated Chemicals through Wet Deposition in Japan, the United States, And Several Other Countries. Environ. Sci. Technol. 2010, 44 (18), 7043–7049, DOI: 10.1021/es101170c [DOI] [PubMed] [Google Scholar]
- 50.Gewurtz SB; Bradley LE; Backus S; Dove A; McGoldrick D; Hung H; Dryfhout-Clark H Perfluoroalkyl Acids in Great Lakes Precipitation and Surface Water (2006–2018) Indicate Response to Phase-outs, Regulatory Action, and Variability in Fate and Transport Processes. Environ. Sci. Technol. 2019, 53, 8543–8552, DOI: 10.1021/acs.est.9b01337 [DOI] [PubMed] [Google Scholar]
- 51.Pike KA; Edmiston PL; Morrison JJ; Faust JA Correlation Analysis of Perfluoroalkyl Substances in Regional U.S. Precipitation Events. Water research 2021, 190, 116685, DOI: 10.1016/j.watres.2020.116685 [DOI] [PubMed] [Google Scholar]
- 52.RouxAssociates. West Deptford Plant PFC Usage and Emissions. November 15, 2013 Memorandum; November 15, 2013. [Google Scholar]
- 53.Kissa E Fluorinated Surfactants and Repellents; Marcel Dekker AG, 2001. [Google Scholar]
- 54.Burkhard LP Evaluation of published bioconcentration factor (BCF) and bioaccumulation factor (BAF) data for per- and polyfluoroalkyl substances across aquatic species. Environ. Toxicol. Chem. 2021, 40 (6), 1530–1543, DOI: 10.1002/etc.5010 [DOI] [PubMed] [Google Scholar]
- 55.Wang Z; MacLeod M; Cousins IT; Scheringer M; Hungerbühler K Using COSMOtherm to predict physicochemical properties of poly- and perfluorinated alkyl substances (PFASs). Environmental Chemistry 2011, 8 (4), 389–398, DOI: 10.1071/EN10143 [DOI] [Google Scholar]
- 56.Li Y; Oliver DP; Kookana RS A critical analysis of published data to discern the role of soil and sediment properties in determining sorption of per and polyfluoroalkyl substances (PFASs). Science of the total environment 2018, 628–629, 110–120, DOI: 10.1016/j.scitotenv.2018.01.167 [DOI] [PubMed] [Google Scholar]
- 57.Lin Q; Zhou C; Chen L; Li Y; Huang X; Wang S; Qiu R; Tang C Accumulation and associated phytotoxicity of novel chlorinated polyfluorinated ether sulfonate in wheat seedlings. Chemosphere 2020, 249, 126447, DOI: 10.1016/j.chemosphere.2020.126447 [DOI] [PubMed] [Google Scholar]
- 58.Kavusi E; Shahi Khalaf Ansar B; Ebrahimi S; Sharma R; Ghoreishi SS; Nobaharan K; Abdoli S; Dehghanian Z; Asgari Lajayer B; Senapathi V; Price GW; Astatkie T Critical review on phytoremediation of polyfluoroalkyl substances from environmental matrices: Need for global concern. Environmental Research 2023, 217, 114844, DOI: 10.1016/j.envres.2022.114844 [DOI] [PubMed] [Google Scholar]
- 59.Wang P; Zhang M; Lu Y; Meng J; Li Q; Lu X Removal of perfluoalkyl acids (PFAAs) through fluorochemical industrial and domestic wastewater treatment plants and bioaccumulation in aquatic plants in river and artificial wetland. Environ. Int. 2019, 129, 76–85, DOI: 10.1016/j.envint.2019.04.072 [DOI] [PubMed] [Google Scholar]
- 60.Wen B; Li L; Zhang H; Ma Y; Shan X-Q; Zhang S Field study on the uptake and translocation of perfluoroalkyl acids (PFAAs) by wheat (Triticum aestivum L.) grown in biosolids-amended soils. Environ. Pollut. 2014, 184, 547–554, DOI: 10.1016/j.envpol.2013.09.040 [DOI] [PubMed] [Google Scholar]
- 61.Krippner J; Brunn H; Falk S; Georgii S; Schubert S; Stahl T Effects of chain length and pH on the uptake and distribution of perfluoroalkyl substances in maize (Zea mays). Chemosphere 2014, 94, 85–90, DOI: 10.1016/j.chemosphere.2013.09.018 [DOI] [PubMed] [Google Scholar]
- 62.Blaine AC; Rich CD; Hundal LS; Lau C; Mills MA; Harris KM; Higgins CP Uptake of Perfluoroalkyl Acids into Edible Crops via Land Applied Biosolids: Field and Greenhouse Studies. Environ. Sci. Technol. 2013, 47 (24), 14062–14069, DOI: 10.1021/es403094q [DOI] [PubMed] [Google Scholar]
- 63.Shen L; Zhou J; Liang X; Qin L; Wang T; Zhu L Different Sources, Fractionation, and Migration of Legacy and Novel Per- and Polyfluoroalkyl Substances between Greenhouse and Open-Field Soils. Environ. Sci. Technol. 2023, 57 (4), 1670–1679, DOI: 10.1021/acs.est.2c07500 [DOI] [PubMed] [Google Scholar]
- 64.Wu J; Fang G; Wang X; Jiao L; Wang S; Li Y; Wang Y Occurrence, partitioning and transport of perfluoroalkyl acids in gas and particles from the southeast coastal and mountainous areas of China. Environmental Science and Pollution Research 2023, 30, 32790–32798, DOI: 10.1007/s11356-022-24468-6 [DOI] [PubMed] [Google Scholar]
- 65.Wang Z; Cousins IT; Scheringer M; Buck RC; Hungerbuehler K Global emission inventories for C-4-C-14 perfluoroalkyl carboxylic acid (PFCA) homologues from 1951 to 2030, Part I: production and emissions from quantifiable sources. Environ. Int. 2014, 70, 62–75, DOI: 10.1016/j.envint.2014.04.013 [DOI] [PubMed] [Google Scholar]
- 66.ATSDR. Toxicological Profile for Perfluoroalkyls; Agency for Toxic Substances and Disease Registry, 2021; p 822. [PubMed] [Google Scholar]
- 67.Liu S; Yang R; Yin N; Faiola F The short-chain perfluorinated compounds PFBS, PFHxS, PFBA and PFHxA, disrupt human mesenchymal stem cell self-renewal and adipogenic differentiation. Journal of Environmental Sciences 2020, 88, 187–199, DOI: 10.1016/j.jes.2019.08.016 [DOI] [PubMed] [Google Scholar]
- 68.Grandjean P; Timmermann CAG; Kruse M; Nielsen F; Vinholt PJ; Boding L; Heilmann C; Molbak K Severity of COVID-19 at elevated exposure to perfluorinated alkylates. PLoS One 2020, 15, e0244815, DOI: 10.1371/journal.pone.0244815 [DOI] [PMC free article] [PubMed] [Google Scholar]
Associated Data
This section collects any data citations, data availability statements, or supplementary materials included in this article.